ecosystem vs. community recovery 25 years after grass...
TRANSCRIPT

SPECIAL FEATURE: LONG-TERM DYNAMICS AND IMPACTS OF PLANT INVASIONS
Ecosystem vs. community recovery 25 years aftergrass invasions and fire in a subtropical woodlandCarla M. D’Antonio*,1 , Stephanie G. Yelenik2 and Michelle C. Mack3
1Environmental Studies Program and Department of Ecology, Evolution and Marine Biology, UC Santa Barbara, SantaBarbara, CA 93106, USA; 2Pacific Island Ecosystem Research Center, US Geological Survey, Hawai’i VolcanoesNational Park, HI 96718, USA; and 3Center for Ecosystem Science and Society, Northern Arizona University,Flagstaff, AZ 86011, USA
Summary
1. Despite a large body of research documenting invasive plant impacts, few studies have followed indi-vidual invaded sites over decades to observe how they change, and none have contrasted how composi-tional impacts from invasion compare to ecosystem-process impacts over a multi-decadal time-scale.2. Using direct measurements of plant density and composition and of ecosystems processes, we evalu-ate how ecosystem structure, above-ground net primary production (ANPP), and above-ground and soilnutrient pools compare over 25 years since fire and C4 grass invasions disrupted seasonally dry Hawai-ian woodlands. We compare structure and function between primary woodland that has never burnedand is largely native species-dominated, with sites that had been the same woodland type but burned inalien-grass-fuelled fires in the 1970s and 1980s. The sites have not experienced fires since 1987.3. We report here that woody plant composition and structure continue to be dramatically changedby the initial invasions and fires that occurred 25 years ago and invaders continue to dominate inburned sites. This is reflected in continued low plant carbon pools in burned compared to unburnedsites. Yet ANPP and N storage, which were dramatically lower in the initial decade after invasive-grass fuelled fires, have increased and are now indistinguishable from values measured in intactwoodlands. Soil carbon pools were resilient to both invasion and fire initially and over time.4. Above-ground net primary production has recovered because of invasion of burned sites by anon-native N-fixing tree rather than because of recovery of native species. This invasive N-fixingtree is unlikely to return C storage of the invaded sites to those of unburned woodland because ofits tissue and growth characteristics and its interactions with invasive grasses. It does not facilitatenative species but rather promotes a persistent invasive grass/N-fixer savanna.5. Synthesis. We conclude that fire, an unusual disturbance in this system, has perpetuated the domi-nance of these sites by invasive species and that despite the dramatic recovery of above-ground netprimary production and N pools, the ecosystem continues to be in a distinctly different state thanthe pre-fire, pre-Melinis community. Thus, despite the absence of further disturbance (fire), there isno evidence that succession towards the original ecosystem is occurring. The fact that N pools andabove-ground net primary production recover because of a new invader (Morella faya), highlightsthe unpredictability of ecosystem trajectories in the face of altered regional species pools.
Key-words: alternative states, ANPP, disturbance, ecosystem processes, exotic species, long-termimpacts, net primary productivity, resilience, secondary invasions
Introduction
Disturbances in terrestrial systems can dramatically shift spe-cies composition to dominance by non-native, invasive spe-cies, some of which stall succession and create alternative
stable states (e.g. Hobbs & Humphries 1995; D’Antonio,Dudley & Mack 1999; Suding, Gross & Houseman 2004;Diez et al. 2012). These species can create alternative statesby establishing strong priority effects (e.g. Didham, Watts &Norton 2005; Fukami & Nakajima 2011) or generating posi-tive feedbacks (Klironomos 2002; Reinhart & Callaway2004). It is a matter of speculation whether strongly invaded*Correspondence author. E-mail: [email protected]
© 2017 The Authors. Journal of Ecology © 2017 British Ecological Society
Journal of Ecology 2017, 105, 1462–1474 doi: 10.1111/1365-2745.12855

ecosystems, in the absence of further disturbance, will eventu-ally return to uninvaded trajectories as priority effects or posi-tive feedbacks decline (Lundberg & Moberg 2003; Yelenik &D’Antonio 2013). Invader-dominated states may be transi-tional if propagules of potential colonists (native or not) arewidespread (e.g. Didham, Watts & Norton 2005; Fukami &Nakajima 2011), and the physical environment and stablepools of soil organic matter (SOM) have not been dramati-cally altered during disturbance and invasion.Despite hypotheses about when invader-dominated states
should be transitional, there is a general lack of data concern-ing the long-term impacts of invasive plant species on ecosys-tem structure and functioning, particularly after disturbance(Strayer et al. 2006; Strayer 2012). By contrast, there is agrowing body of knowledge on the impact of invaders onecosystem function in the short term (e.g. Vitousek & Walker1989; D’Antonio & Vitousek 1992; Ehrenfeld 2003; Mack &D’Antonio 2003a; Yelenik, Stock & Richardson 2004; Vilaet al. 2011). This lack of long-term knowledge hinders anunderstanding of the recovery of important ecosystem proper-ties including species composition, above-ground net primaryproductivity (hereafter, ANPP), N cycling, and carbon (C)and nitrogen (N) pools after disturbance and invasion. It istherefore not known whether some ecosystem properties suchas ANPP are more resilient than other properties such as spe-cies composition, and how changes in these properties overtime relate to changes in invader dominance.Disturbance is often associated with invasion in terrestrial
ecosystems. Disturbances reduce plant biomass and associatednutrient pools and uptake, and can initially reduce ANPP(Hicke et al. 2012; McLauchlan et al. 2014). The extent towhich ecosystem properties such as ANPP, SOM pools andspecies composition are resilient to disturbance—particularlyin the face of invasion—has been less well studied but is ofcurrent interest due to concerns over carbon sequestration(Jandl et al. 2007; Magnani et al. 2007) and concerns overecosystems reaching ‘tipping points’ beyond which they donot return to prior trajectories (Turner 2010). Over the pasttwo decades, many studies have documented the influence ofplant species composition, disturbance (Jandl et al. 2007) andinvasion (Liao et al. 2008) on soil C and N cycling, ANPPand nutrient pools. If a single disturbance causes a large-scaleplant invasion, then ecosystem properties such as SOM andANPP may be altered for decades particularly if invadersremain dominant (McLauchlan et al. 2014). Many invasiveplant species enhance net primary productivity in ecosystemsthey invade (Vila et al. 2011) because they can accessresources unavailable to residents thereby increasing accumu-lation and retention of nutrients (Liao et al. 2008; Vila et al.2011). Invaders that enhance disturbance frequency or inten-sity, such as fire-associated grasses (D’Antonio & Vitousek1992; Mack & D’Antonio 1998; Rossiter et al. 2003), cancause loss of nutrients stored in plant material (e.g. Mack,D’Antonio & Ley 2001), while simultaneously reducing theability of resident species to re-establish through priority com-petition (e.g. Hughes & Vitousek 1993). They thus could cre-ate a persistent low productivity plant community. While a
few studies have documented short-term negative impacts ofinvaders (coupled with disturbance) on ANPP (e.g. Mack,D’Antonio & Ley 2001), the low productivity ‘state’ has notbeen followed over time.In this study, we evaluate the long-term ecosystem effects
of plant invaders that promote and respond positively to firein seasonally dry, primary successional woodlands in HawaiʻiVolcanoes National Park, USA. These sites were studiedintensively in the 1990s when it was found that fires, whosespread was promoted by invasive C4 grasses, eliminated manynative species (Hughes, Vitousek & Tunison 1991; Hughes &Vitousek 1993; D’Antonio, Hughes & Tunison 2011). Whilesediment charcoal clearly demonstrates that fire occurred inthe quaternary history of Hawaiʻi (S. Hotchkiss, unpubl. data),there is no consensus today on how burned ecosystemsshould respond over multi-decadal time periods. A few nativeHawaiian species regenerate immediately post-fire while manydo not (D’Antonio, Tunison & Loh 2000; Tunison, D’Anto-nio & Loh 2000; Loh & Daehler 2008; Ainsworth & Kauff-man 2009, 2010). It is not clear whether net primaryproductivity and other ecosystem properties will return to val-ues of the pre-fire environment over decadal time-scales. Con-tinued persistence of invaders or the incursion of otherinvaders may affect the trajectory of these systems.Here we evaluate how ecosystem structure (woody species
densities and composition as well as grass cover), ANPP andC and N pools have changed in the 25 years since the last oftwo fires burned sites that were formerly open-canopy nativeMetrosideros polymorpha Gaud. woodlands with a denseunderstorey of native shrubs. These primary successional siteswere invaded by non-native perennial bunch grasses (Schiza-chyrium condensatum Kunth (Nees) and Andropogon virgin-cus L.) in the 1960s and 1970s, changing the understorey fuelbed (Tunison, D’Antonio & Loh 2000). After fires in 1970and 1987, a mat-forming, African grass (Melinis minutifloraP. Beauv.) quickly became dominant (Hughes, Vitousek &Tunison 1991), suppressing regeneration of native woody spe-cies (Hughes & Vitousek 1993; D’Antonio, Hughes & Tuni-son 2011). In the 1990s, 7–8 years post-fire, ANPP wasapproximately 65% lower in burned compared to unburnedwoodland and above-ground nutrient pools were also dramati-cally lower (Mack, D’Antonio & Ley 2001). Yet soil N andC (unpublished) pools were unaffected by fire history suggest-ing the potential for return to pre-fire ANPP. From a commu-nity composition perspective, recent work has shown that20+ years after the last fire sites are still largely grass-domi-nated (D’Antonio, Hughes & Tunison 2011), and N cyclingrates are similar to unburned (Yelenik & D’Antonio 2013).Woody cover has increased in the grasslands and in particularan invasive N-fixing tree is increasing in density and coveracross the region (Yelenik & D’Antonio 2013) which couldaffect ANPP.We specifically evaluate whether ecosystem properties are
consistent with the resilience predicted to occur after distur-bance in primary successional systems (Peltzer et al. 2010),or whether invasive grasses continue to dominate and ANPPremains substantially lower than in unburned sites. If ANPP
© 2017 The Authors. Journal of Ecology © 2017 British Ecological Society, Journal of Ecology, 105, 1462–1474
Longterm ecosystem impacts of grass invasions 1463

has remained low, then soil C pool sizes may have divergedbetween the woodland and the grassland sites. We ask the fol-lowing specific questions: (i) How do woody species densitiesand composition, and total ANPP, and the components con-tributing to it, compare in burned vs. unburned woodlandsites? (ii) How do the relative contributions of the life-formcomponents of ANPP compare between current measurementsand the 1990s when the sites were early in post-fire succes-sion? and (iii) Is there evidence that ecosystem N and C poolsin burned sites are converging towards the unburned woodlandsites in the 25 years since fire? Because unburned woodlandsites continue to be largely undisturbed and the woody plantsthat dominate them are relatively slow growing, we predictedthat biomass and soil N and C pools will have changed littlein 25 years, and ANPP will still be dominated by nativewoody plants. By contrast we predict that the burned sites,although still invasive grass-dominated, will show increasedANPP compared to the past due largely to recent invasion bynon-native N-fixing trees not native woody plants (Yelenik &D’Antonio 2013). We likewise predict that soil C and N poolswill be similar to the past or lower in the burned sites becauseof decades of low NPP and persistent grass dominance priorto this recent invasion of the N-fixing tree. We also predict rel-atively little change in soil pools because of the slow nature ofchange in these large nutrient pools.
Study site description
The study sites are on Kilauea Volcano in Hawaiʻi VolcanoesNational Park, Hawaiʻi, USA. They are between 850 and
910 m in elevation and annual precipitation is approximately1500 mm (D’Antonio, Hughes & Tunison 2011). There is adry season from late April and extending typically intoSeptember (D’Antonio, Hughes & Tunison 2011; Fig. S1,Supporting Information). Because of the strongly seasonalrainfall, and the elevation, we refer to the area as seasonalsubmontane dry woodland.The sites are on pahoehoe lava flows approximately 750–
1000 years old overlain by volcanic ash creating entisol soils(mapped as Ustipsamments). The top 30 cm of soil is largelyderived from ash deposited in the 1700s. Where soils are dee-per than 30 cm, the surface (30–40 cm) ash is underlain byfine cinder and occasionally by an older ash layer that appearsto comprise an undated buried A horizon (M.G. Kramer andC.M. D’Antonio, unpubl. data). The weighted average ofcation exchange capacity for the surface 30 cm in a core fromunburned and burned woodland yielded values of 20�5 and22�8 respectively (M.G. Kramer and C.M. D’Antonio, unpubl.data). We have no information on the sulphur status of thesoils or pre- and post-fire phosphorus. Tissue P-values sug-gest that plants are not P limited here (D’Antonio & Mack2006).The burned and unburned sites we studied are part of what
was once continuous primary successional ʻ�ohiʻa (M. poly-morpha) woodland. Typical of primary successional wood-land in this region, unburned sites are dominated by an opencanopy of M. polymorpha with a dense understorey of nativeshrubs primarily of Leptocophylla tameiameia Cham. &Schltdl (pukiawe), Osteomeles anthyllidofolia Sm. (Lindl)(ʻ�ulei), Dodonaea viscosa Jacl. (ʻaʻaliʻi) and Wikstroemia
(a) (b)
(c) (d)
Fig. 1. (a) Typical understorey near base of the dominant tree, Metrosideros polymorpha in unburned site (Summer 2011). (b) One of 10 sur-veyed density plots in unburned woodland (2011). Tape shows one edge of plot. (c) Matrix of Melinis minutiflora after wet season green up withscattered woody plants in a burned (TB) site. Morella faya individuals are large, dense and in background (Fall 2011). (d) One of surveyed den-sity plots in a burned (TB) site. Light green individuals represent Dodonaea viscosa shrubs and darker green larger woody plants are M. faya(Summer 2011). Photos by Carla D’Antonio. [Colour figure can be viewed at wileyonlinelibrary.com]
© 2017 The Authors. Journal of Ecology © 2017 British Ecological Society, Journal of Ecology, 105, 1462–1474
1464 C. M. D’Antonio, S. G. Yelenik & M. C. Mack

phillyraeifolia A. Gray (ʻ�akia) and a sparse understorey ofnative sedges and lichens (Fig. 1, and see D’Antonio, Hughes& Tunison 2011). Introduced perennial grasses are abundantin the woodland understorey and include S. condensatum(beardgrass) and M. minutiflora (molasses grass). By contrast,those woodland sites that burned in 1970 and 1987 are domi-nated by a carpet of M. minutiflora, with common D. viscosashrubs within the matrix of grass (D’Antonio, Hughes &Tunison 2011). Also present are scattered individuals of thenon-native, N-fixing tree, Morella (formerly Myrica) faya(Aiton) (Fig. 1). Annual plants are lacking in both burnedand unburned sites. We refer to the two habitats we samplewithin as, unburned woodland (UB in Tables and Figures)and burned woodland (TB in Tables and Figures). TB standsfor twice burned because all burned sites studied here burnedtwice (1970, 1987). Both fires burned with high intensityaccording to National Park Service Personnel (Tunison, Loh& Leialoha 1995). Within each habitat, we sampled five‘sites’ (Table S1). Sites are flat, vegetated swales at least100 m in length and approximately 20 m wide, adjacent totransects sampled in the past (Hughes, Vitousek & Tunison1991; D’Antonio, Hughes & Tunison 2011). They are a mini-mum of 200 m from one another in a landscape of undulatingpahoehoe lava ridges and vegetated swales.
Materials and methods
ABOVE-GROUND COMPOSIT ION/DENSITY AND
PRODUCTION OF WOODY SPECIES
To assess plant density and biomass in the two habitats, we estab-lished ten 10 m 9 10 m unburned and eleven 10 m 9 10 m burnedplots and measured density, basal diameter (BD) and height of allwoody individuals present keeping track of them by species thusobtaining woody species composition and density estimates. Wemeasured all stems of individuals with multiple stems. These plotswere adjacent to transects that have been regularly surveyed since1988 and are described elsewhere (Hughes, Vitousek & Tunison1991; D’Antonio, Hughes & Tunison 2011). We used allometricrelationships (Table S2) created by harvesting 10–20 individuals ofeach marked woody species in each habitat, to convert BD towoody plant biomass. Before harvest we measured their BD andheight. We separated biomass into stems vs. ‘leafy twigs’ (smallstems with leaves). Biomass of each vegetation component wasweighed in the field and a subsample returned to the laboratory,weighed, dried for 3 days at 60°C, and reweighed to correct fieldweights for tissue % moisture. Regressions were generated for eachspecies using BD, BD2, height (H), H2, BDH, BD2H or BDH2
against total biomass. Regressions predicting biomass with the high-est R2 values were chosen for conversion of surveyed plants tostanding biomass. For the dominant tree in the woodland, M. poly-morpha, we used biomass regressions from Aplet & Vitousek(1994), as well as unpublished data provided by G. Aplet, separatingtrees by basal circumference and using different equations for differ-ent size classes. Samples obtained for % moisture were ground witha Wiley Mill and Wig-L-Bug Dental Amalgamator (Crescent Dental,Elgin, IL, USA) for %C and %N (UHH Analytical Laboratory, Hilo,HI, USA) to estimate standing C and N pools, and plant N uptake(nitrogen taken up by a plant in 1 year).
We used the per individual growth rate of woody species, scaledup by the censuses for woody species density and initial size to esti-mate ANPP. Within each of the five sites per habitat (Table S1), wemarked the base of a minimum of ten individuals of all woody spe-cies that comprised >5% understorey cover (see D’Antonio, Hughes& Tunison 2011), using weather resistant paint in February of 2011.If there were fewer than 10 individuals in the area, we marked all ofthem. We measured BD with a dbh tape (≥1 cm stem) or with digitalcallipers (<1 cm stem) at the site of the paint. When individual shrubshad more than one main stem at base, we marked and measured eachstem separately marking three stems per individual shrub. If there washigh variation in stem size, we attempted to sample across that vari-ability. We also measured the height of all marked individuals. Atotal of 52 shrubs (206 stems) and 11 trees (48 stems) were markedin the Unburned Woodland, and 49 shrubs (97 stems) in the TwiceBurned. Morella faya was considered a shrub. These same individualstems were resampled in March 2012 to obtain a 1-year woodygrowth increment.
Finally, we calculated annual growth increment to estimatechange in biomass between 2011 and 2012. We used habitat andspecies-specific (unburned vs. burned), growth increment averages toestimate growth of every stem in the density census and used thepredicted 2012 stem diameter to calculate 2012 biomass, and annualabove-ground growth. To measure site level ANPP, we added inANPP of grasses and annual litterfall of woody species as describedbelow.
ABOVE-GROUND GRASS PRODUCTION AND
COMPOSIT ION
Above-ground net primary production of perennial grasses is difficultto measure and controversial (Scurlock, Johnson & Olson 2002). Wecoupled a sequential harvest technique to assess min and max livebiomass across the year, with a census of grass per cent cover. Weharvested biomass plots that were as close to 100% cover as possibleand then used grass % cover taken in random subplots in each site(see below) to convert estimates to grass biomass on a per area basisacross sites. Min/max live biomass techniques are the most commonlyused measurements of grass production (Scurlock, Johnson & Olson2002). This was not however, the same technique used by Mack,D’Antonio & Ley (2001), who used standing peak biomass of1 year’s leaves and stems sampled from randomly arrayed plots, toestimate grass ANPP.
For sequential grass harvests, we selected two 0�5 9 0�5 m plotswith approximately 100% grass cover within each of the five sites perhabitat and harvested the plots to the ground. We did this every2 months for 14 months (November 2010 to February 2012), select-ing new plots at each time point. Harvests were separated into livevegetative, live reproductive, and standing dead material, and litterand weighed damp. Subsamples were weighed, dried for 3 days at60°C, and then reweighed to convert field-moist samples to dryweight. Biomass per m2 was adjusted by % grass cover data takenacross the sites (described below). Samples that were obtained for %moisture were also ground with a Wiley mill (#20 mesh) and Wig-L-Bug Amalgamator for %C and %N content (UHH Analytical Labora-tory) to estimate standing C and N pools, and plant N uptake.
We harvested two plots per site (=10 plots per habitat) forM. minutiflora, the dominant grass. In unburned sites, S. condensatumwas common although largely dead. Unlike Melinis it does not form100% cover. We harvested plots with the highest per cent cover wecould find, counted the number of individual plants and calculated
© 2017 The Authors. Journal of Ecology © 2017 British Ecological Society, Journal of Ecology, 105, 1462–1474
Longterm ecosystem impacts of grass invasions 1465

biomass per plant, although there were never distinct relationships.Thus, S. condensatum biomass may be underestimated. We lookedacross sample dates to find maximum and minimum live vegetativeand reproductive biomass per harvested quadrat in each site, not nec-essarily taking the two maximum or minimum values from the samesample date for each site. We used the equation (Live[stems andleaves]max + Reproductivemax) � (Live[stems and leaves]min + Repro-ductivemin) to estimate ANPP in these high-density plots (Scurlock,Johnson & Olson 2002). We averaged ANPP per habitat per speciesbefore correcting with per cent cover census data (below). We did notharvest S. condensatum in burned sites because living plants wererare. Yet because it had a small per cent cover in burned censuses,we used ANPP rates from unburned corrected with per cent coverdata from burned to estimate S. condensatum ANPP in burned.
We censused per cent cover of M. minutiflora and S. condensatumin ten 1 9 1 m subplots within plots where woody plant density andsize were censused. In the unburned, we measured subplots within alldensity plots where as in the burned we used only five of thesebecause grass cover was high and uniform (see D’Antonio, Hughes &Tunison 2011). For S. condensatum, bundle density was obtained inthese plus 10 other randomly places 1 9 1 m plots per site. Finally,we used the average ANPP at 100 per cent cover multiplied by actualper cent cover data of the species, to estimate ANPP for each grassspecies in the two habitats. We did not measure sedge productionbecause living sedges were rare.
ANNUAL L ITTERFALL
To measure annual litterfall, we lined 60 9 60 cm plastic horticul-tural trays with 1-mm window-screen mesh and installed them withsix traps being placed at regular intervals along a transect through themiddle of each site. Traps were checked every 3 months for 1 year,which entailed collecting all litter within the trap, returning it to thelaboratory, drying it and weighing it. Litter was not separated by spe-cies. Litter from each sample date was summed over the year and anaverage annual total calculated per site and then per habitat. This wasadded to the species level production measurements to get totalANPP.
COMPARISONS OF ANPP IN 1990S VS. THIS STUDY
A goal of this study was to compare the components of ANPPbetween past and current measurements. Direct statistical comparisonsof ANPP could not be done because of differences in methodologiesfor measuring grass ANPP. Instead, we qualitatively compare the pro-portion of total ANPP contributed by each of the components mea-sured. Data from the 1990s were obtained through Mack (1998) andMack & D’Antonio (2003b).
N AND C PLANT AND LITTER POOL
CHARACTERIZAT ION
To estimate total standing C and N pools in each site, we used theBD data from the census plots, allometric relationships between BDand biomass of different plant parts (e.g. trunk, twigs, leafy twigs),and the %C and %N content of different woody plant material fromthe harvests for allometric relationships. We used %C and %N con-tent that was averaged across species, habitat and plant part (e.g. leafytwigs). For grass N pools, we used standing dead, and live vegetativeand reproductive biomass from harvest plots averaged across sampledates and habitat and multiplied this by the per cent cover found in
the census plots. We then multiplied grass biomass of each compo-nent part (vegetative, reproductive) per unit area by %C and %N forthat part found in the biomass harvests. To calculate plant N uptake,we multiplied the %N of each plant specific part by the amount thatplant part contributed to ANPP.
To calculate the amount of N stored in litter at the soil surface, wecollected three randomly placed 30 9 30 cm plots in each site, twotimes per year (October 2012, March 2013). All litter within thequadrat was collected down to the point at which no recognizableleaves, twigs or fruits were present, dried at 60°C for 3 days andweighed. Subsamples were ground for N and C analysis in bulk. Thetwo dates are averaged to obtain one pool size and N and C contentfor each habitat type.
To sample roots, we took three, 3 cm diameter 9 10 cm deep soilcores per site under random points through the middle of each site,sieved them and hand-picked both coarse and fine roots. Roots thatwere obviously dead were excluded. We were interested solely in thestanding root biomass pool that was as close to live as possible andcould be clearly separated from SOM. Sampling was done in August2012 and March 2013 and averaged. Samples were rinsed, dried,weighed and ground for CN analysis. Per core averages were con-verted to roots per m2 using bulk density values obtained from thesoil coring and the surface area of the core. We sampled only the top10 cm because depth to bedrock varied wildly and this depth wasconsistent. This is meant as a comparative and not exhaustive descrip-tion of surface root pools.
SOIL N AND C POOL SAMPLING
To calculate C and N stored in soil, we sampled the soil in threelocations randomly chosen along transects through each site using a3�9-cm wide soil corer. At each location, the soil was sampled inincrements including 0–5, 5–10, 10–20 and 20–30 cm from surface.Each sampling location had to have at least 35 cm of soil or a newlocation was chosen. Because most biological activity is in the top30 cm, and because of the high variability in soil depth, we focusedonly on the 0–30 cm layer of soil. Before sampling, the litter-O hori-zon was removed, and coring began at the level where no recogniz-able leaves or plant parts could be identified. Each core section wassieved through 2-mm mesh. Exact volumes and total dry weight wereused to calculate bulk density. Soil C and N were measured on sub-samples after samples were ground in a mortar and pestle. Subsam-ples were rolled in tin caps and analysed on a Fison’s Carlo Erba CNAnalyzer (Beverly, MA, USA). Per cent C and N were multiplied bybulk density to obtain C and N per cm3 of soil and then converted toper m2 by layer.
We assessed d13C of surface (0–5 cm) and deepest (20–30 cm) soilcores to assess the contribution of C4 (invasive grass) carbon to theotherwise C3 (native) soil carbon pool. d13C was analysed on sieved,dried and ground (mortar and pestle) samples from all the cores.Analyses were conducted at the UH-Hilo Analytical Laboratory usinga Thermo-Finnegan Delta V IRMS.
STAT IST ICAL ANALYSES
All statistical analyses were conducted using JMP versions 11 and12. Most tests were one-way ANOVAs with habitat as a fixed effect,or two-way ANOVAs (habitat = fixed, soil depth = fixed) unlessotherwise noted in figure legends. Morella faya data were log10 trans-formed for analyses due to unequal variances/non-normal distribu-tions.
© 2017 The Authors. Journal of Ecology © 2017 British Ecological Society, Journal of Ecology, 105, 1462–1474
1466 C. M. D’Antonio, S. G. Yelenik & M. C. Mack

Results
ANPP AND WOODY PLANT DENSITY AND COMPOSIT ION
Total ANPP (2011–2012) was not statistically distinguishablebetween the two habitats (Fig. 2a). In the unburned woodland,ANPP was distributed relatively evenly among shrubs, trees,grasses, M. faya and litterfall (Figs 2a and 3). While the nativetree M. polymorpha-dominated standing biomass (Fig. 2b), itcontributed little to ANPP because of its slow growth rates; onaverage the BD of M. polymorpha increased by 1�5% per year.By contrast the BD of the invasive tree M. faya, a newcontributor to ANPP compared to the past (Fig. 3),increased by 17�4% per year (Table 1). This led to per tree pro-duction rates of M. polymorpha being 2�6 � 7�0 kg year�1 vs.26�4 � 5�2 kg year�1 for M. faya. In contrast to theunburned sites, burned ANPP was dominated by grass andM. faya growth. Morella faya was present in the unburnedwoodland and comprised a similar density (Fig. 4) but wasmore productive (per tree) in the burned sites (Table 1).Native shrub production made up approximately one quar-
ter of ANPP in the unburned woodland and it was substan-tially greater there than in burned sites (Fig. 2a) largelyreflecting dramatic different in native shrub densities andcomposition between habitats (Fig. 4). The shrub D. viscosawas the only shrub common in both habitats. Per individual itwas substantially less productive in burned sites where it hadlower height growth rates (Table 1). Overall shrub productionwas 20 times higher in the unburned compared to burned sitesbecause of the prevalence and high density of other nativeshrubs primarily L. tameiameia and O. anthyllidifolia (Fig. 4).These species can occasionally be found in burned habitatand they appear to be growing well there (Table 1) but theiroverall densities were so low that their contribution to pro-duction was negligible.Grass production was more important in burned compared
to unburned sites (Figs 2 and 3), largely because of the highcover of M. minutiflora in burned sites and the low cover ofliving S. condensatum in unburned sites (data not shown). Asa result, standing live grass biomass was three times higher inthe burned than unburned woodland (Fig. 2b) and grass con-tributions to ANPP were higher in the burned as well(Fig. 2a).In comparing components of ANPP between our current
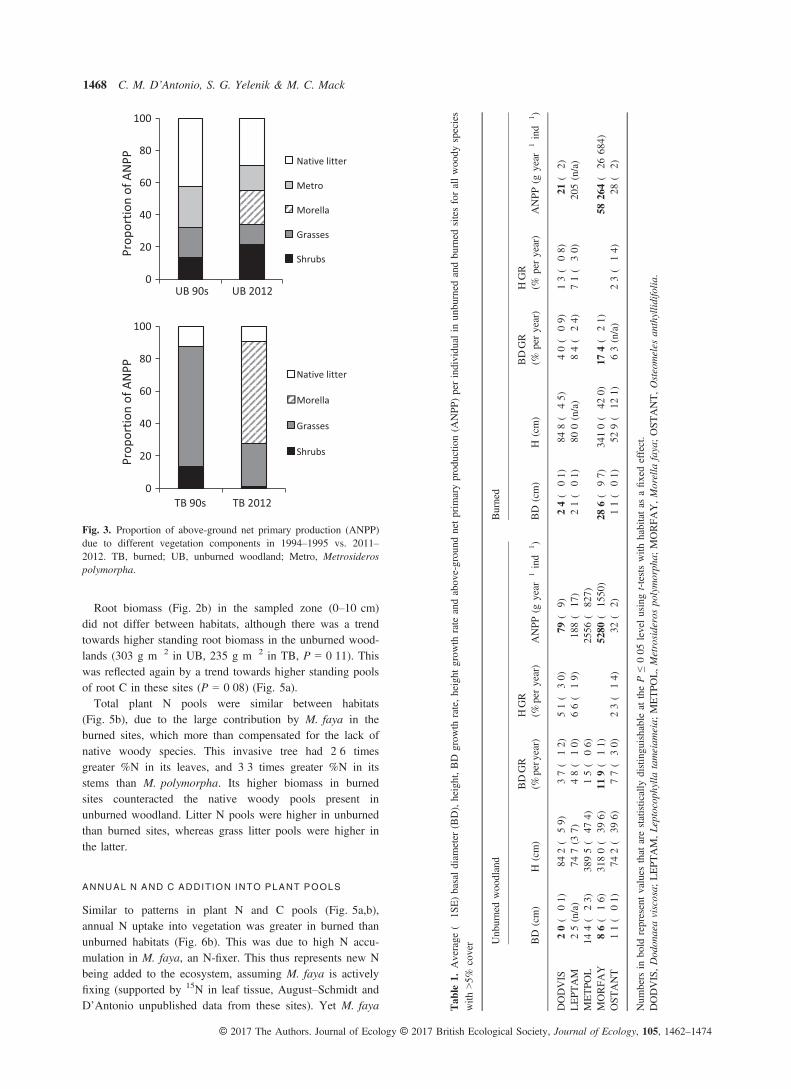
measurements and the 1990s, the single most obvious differ-ence is the new contribution of M. faya to current productionat both sites (Fig. 3). Its enormous increase (from 0 to 63%of ANPP) in the burned is mirrored by a similar decline inthe relative contribution of grasses. Morella faya contributionsin the unburned also increased, but this was substantially less(from 0 to 21%) and shrubs also increased as a proportion oftotal as well leading to an overall increase in ANPP comparedto the past (Fig. 3). Grass production declined as a fraction oftotal production in unburned sites most likely because the dra-matic decrease in S. condensatum was not compensated bythe increase that did occur in M. minutiflora cover andproductivity.
PLANT C AND N POOLS
Carbon pools were greater in unburned than burned sites pri-marily because of large C pools in M. polymorpha (Fig. 5a).While this species is slow growing and thus a small contribu-tor to annual ANPP, it retains a large amount of standing car-bon. Indeed our standing stock estimates are low given thatwe did not census the dead standing M. polymorpha. Yetdead trees are common in these woodlands, and they wouldpossibly nearly double the standing pools of C in unburnedas found in Mack, D’Antonio & Ley (2001). In contrast, therewere no standing dead M. polymorpha in the burned sitesbecause most dead trunks were incinerated in the second fire(Mack, D’Antonio & Ley 2001).Tree and shrub litter biomass at the soil surface was signifi-
cantly greater, as were C pools of litter, in unburned as com-pared to burned (Figs 2b and 5a). This is consistent withhigher tree and shrub ANPP in unburned and also with thehigher C:N ratio of the litter produced by native woody spe-cies that dominate these sites (Table S3).
Fig. 2. (a) Above-ground net primary productivity (ANPP) compo-nents and totals and (b) biomass pools in plants, roots and litter inburned (TB) and unburned habitats (UB). Bars are means � 1SE.Asterisks denote that habitats show significant differences with t-testsat the *P ≤ 0�05, **P ≤ 0�01 and ***P ≤ 0�001 levels. Woody plantbiomass and ANPP (TB: n = 11; UB: n = 10); grass biomass andANPP (TB: n = 5; UB: n = 10); litterfall, n = 5; and standing litterand roots, n = 20. Morella faya data were log10 transformed for anal-yses due to unequal variances/non-normal distributions.
© 2017 The Authors. Journal of Ecology © 2017 British Ecological Society, Journal of Ecology, 105, 1462–1474
Longterm ecosystem impacts of grass invasions 1467
Root biomass (Fig. 2b) in the sampled zone (0–10 cm)did not differ between habitats, although there was a trendtowards higher standing root biomass in the unburned wood-lands (303 g m�2 in UB, 235 g m�2 in TB, P = 0�11). Thiswas reflected again by a trend towards higher standing poolsof root C in these sites (P = 0�08) (Fig. 5a).Total plant N pools were similar between habitats
(Fig. 5b), due to the large contribution by M. faya in theburned sites, which more than compensated for the lack ofnative woody species. This invasive tree had 2�6 timesgreater %N in its leaves, and 3�3 times greater %N in itsstems than M. polymorpha. Its higher biomass in burnedsites counteracted the native woody pools present inunburned woodland. Litter N pools were higher in unburnedthan burned sites, whereas grass litter pools were higher inthe latter.
ANNUAL N AND C ADDIT ION INTO PLANT POOLS
Similar to patterns in plant N and C pools (Fig. 5a,b),annual N uptake into vegetation was greater in burned thanunburned habitats (Fig. 6b). This was due to high N accu-mulation in M. faya, an N-fixer. This thus represents new Nbeing added to the ecosystem, assuming M. faya is activelyfixing (supported by 15N in leaf tissue, August–Schmidt andD’Antonio unpublished data from these sites). Yet M. faya
0
20
40
60
80
100
UB 90s UB 2012
Prop
ortio
n of
AN
PP Native litter
Metro
Morella
Grasses
Shrubs
0
20
40
60
80
100
TB 90s TB 2012
Prop
ortio
n of
AN
PP Native litter
Morella
Grasses
Shrubs
Fig. 3. Proportion of above-ground net primary production (ANPP)due to different vegetation components in 1994–1995 vs. 2011–2012. TB, burned; UB, unburned woodland; Metro, Metrosiderospolymorpha.
Tab
le1.
Average
(�1S
E)basaldiam
eter
(BD),height,BD
grow
thrate,height
grow
thrate
andabov
e-grou
ndnetprim
aryprod
uctio
n(A
NPP
)perindividu
alin
unburned
andburned
sitesforallwoody
species
with
>5%
cover Unb
urnedwoo
dland
Burned
BD
(cm)
H(cm)
BDGR
(%peryear)
HGR
(%peryear)
ANPP
(gyear
�1ind�
1 )BD
(cm)
H(cm)
BDGR
(%peryear)
HGR
(%peryear)
ANPP
(gyear
�1ind�
1 )
DODVIS
2�0(�
0�1)
84�2
(�5�9
)3�7
(�1�2
)5�1
(�3�0
)79
(�9)
2�4(�
0�1)
84�8
(�4�5
)4�0
(�0�9
)1�3
(�0�8
)21
(�2)
LEPT
AM
2�5(n/a)
74�7
(3�7)
4�8(�
1�0)
6�6(�
1�9)
188(�
17)
2�1(�
0�1)
80�0
(n/a)
8�4(�
2�4)
7�1(�
3 �0)
205(n/a)
METPO
L14
�4(�
2�3)
389�5
(�47�4)
1�5(�
0�6)
2556
(�82
7)MORFA
Y8�6
(�1�6
)31
8�0(�
39�6)
11�9
(�1�1
)52
80(�
1550
)28
�6(�
9�7)
341�0
(�42�0)
17�4
(�2�1
)58
264(�
2668
4)OST
ANT
1�1(�
0�1)
74�2
(�39�6)
7�7(�
3�0)
2�3(�
1�4)
32( �
2)1�1
(�0�1
)52�9
(�12�1)
6�3(n/a)
2�3(�
1�4)
28(�
2)
Num
bers
inbold
representvalues
that
arestatistically
distinguishableat
theP≤0�0
5levelusingt-testswith
habitatas
afixedeffect.
DODVIS,Dod
onaeaviscosa;
LEPT
AM,Leptocop
hylla
tameiam
eia;
METPO
L,Metrosiderospolymorpha;
MORFA
Y,Morella
faya;OST
ANT,Osteomeles
anthyllid
ifolia
.
© 2017 The Authors. Journal of Ecology © 2017 British Ecological Society, Journal of Ecology, 105, 1462–1474
1468 C. M. D’Antonio, S. G. Yelenik & M. C. Mack

has lower %C in wood and thus lower C:N ratios than nativewoody plants and so does not enhance C pools compared tounburned.
SOIL C AND N POOLS
Total soil carbon pools in the top 30 cm of soil were not dif-ferent between the burned and unburned (Table 2,P = 0�134). The only layer to differ in soil carbon was the10–20 cm layer, which had more C in the burned comparedto the unburned sites (Table 2). This was the result of higher% soil C in the burned: bulk density was not different(Table 3).In contrast to C, total soil N was higher in burned com-
pared to unburned soils with habitat differences largely drivenby the difference in %N in the 0–5 cm layer (Tables 2 and3). C:N ratios tended to reflect these differences in the surfacesoil layer: the ratio was almost double in the unburned com-pared to the burned soils due to this difference in %N(Table 3). There were no other differences in C:N valuesacross depths. Bulk density did not differ significantlybetween habitats, although there was a trend towards lighterbulk density in 0–5 cm cores in unburned compared toburned. This difference accounts for around half of the differ-ence in N pool size between burned and unburned habitat.Even though total soil N in upper soil levels in burned ishigher than unburned, soil net N mineralization is not differ-ent between habitats (Yelenik & D’Antonio 2013).There were significant differences in soil d13C between
habitats, reflecting the larger inputs from C4 grasses in theburned habitat compared to the unburned. Soil d13C in theunburned was more depleted in 13C both in the surface and atdepth compared to the burned sites (Table 4). Differenceswere more prominent in surface layers (0–5 cm) as seen in ahabitat by depth interaction (two-way ANOVA with habitatand depth as fixed effects, and an interaction effect, n = 5:
habitat, P < 0�001; depth, P = 0�195; habitat 9 depth,P = 0�005). The contribution of C4 grasses to soil C as a %of soil C was six times as great in burned surface soils com-pared to unburned and 2�5 times as great at depth (20–30 cm).
Discussion
Our data clearly demonstrate that although composition, den-sity and biomass of native woody plants have not recovered(Table 1, Fig. 1) in the 25 years since the last fire burnedthrough these former woodlands, ANPP has convergedbetween unburned and burned sites (Fig. 2). The lack ofrecovery of composition is consistent with a recent multisiteanalysis of fire effects in Metrosideros forests across Hawaiʻi(Wasser 2015) and it appears unlikely that the native wood-land will ever recover (see Hughes & Vitousek 1993;D’Antonio, Hughes & Tunison 2011). The recovery of ANPPin burned sites, however, is due to the invasion of a non-native N-fixing tree into the grassland where M. minutifloraremains as a dominant. Thus, although invasive grass domi-nance remains strong in burned sites, the relative contribu-tions of each life-form to the components of ANPP haveshifted. Despite the apparent resilience of ANPP and N pools,above-ground C pools are still greatly diminished in theburned habitats. Thus compositionally, this ecosystem is stillin an alternative state although that state has transitioned to asavanna, co-dominated by M. minutiflora and M. faya.Fukami & Nakajima (2011) suggested quantitatively thatalternative states are best viewed as transitional because prior-ity effects of early colonists are unlikely to remain strong. Inthis case, the slow breakdown of M. minutiflora’s priorityeffects led to succession towards a low-diversity M. faya/M. minutiflora savanna (Yelenik & D’Antonio 2013). Thisecosystem is thus an example of a system where disturbance(fire) hastened a transition to ‘no analogue’ communities thatwill continue for decades (Turner 2010). These novel commu-nities retain few elements of the original community and pre-sent new challenges to ecosystem managers (Hobbs, Higgs &Harris 2009).
PLANT INVADER EFFECTS ON ANPP
In a meta-analytic review of plant invader impacts on ecosys-tem processes, Liao et al. (2008) found that invaders overallsignificantly increase ANPP (mean response ratio = 83%increase). This ‘generality’ does not apply in our study sys-tem. In the first decade after invasion and fire, Mack, D’Anto-nio & Ley (2001) clearly demonstrated a decline in ANPPwith fire and invasion because of the loss of native woodyspecies and the inability of grasses to compensate for thisloss. While we found that ANPP is now similar betweenburned and unburned sites, we found no evidence that ANPPwill be enhanced in burned M. minutiflora-invaded sitesabove unburned because grass dominance still limits woodyestablishment (Yelenik & D’Antonio 2013).
Fig. 4. Density of dominant trees and shrubs in unburned woodlandand burned (twice burned) habitats. Asterisks denote that habitatsshow significant differences with t-tests at the P ≤ 0�01 level. Dodon-aea viscosa was significant at the P = 0�06 level. N for woody plantdensity: UB = 10, TB = 11.
© 2017 The Authors. Journal of Ecology © 2017 British Ecological Society, Journal of Ecology, 105, 1462–1474
Longterm ecosystem impacts of grass invasions 1469

We believe that the reason our study is an outlier fromLiao et al. is due to the direction of life-form change withinvasion: fires here drove a catastrophic shift from a tall sta-tured, woody plant-dominated ecosystem to a grass-dominatedone of much lower stature, and diversity. Melinis minutiflora,cannot compensate for the lost leaf area and growth potentialof the taller and more architecturally complex woody species.In many of the studies cited by Liao et al. (2008), invadersconsisted of larger life-forms compared to the flora that theyinvaded (see Harcombe, Cameron & Glumac 1993; Lett et al.2004). Other studies in their meta-analysis evaluated invadersentering systems with little competition from residents (e.g.Vitousek & Walker 1989; Hughes & Denslow 2005).In ecosystems where invaders trigger a change in distur-
bance regime that leads to herbaceous species replacingwoody ones, we expect ANPP and long-term above-groundcarbon pools to be reduced by disturbance particularly if thedisturbance intensity is high, as was reputed to be the case inthese systems. Studies of cheatgrass (Bromus tectorum)-fuelled fires in the Great basin deserts of the western USAdemonstrate reduced carbon storage in invaded and burnedecosystems (Bradley et al. 2006) compared to unburned. Thepersistence of such an impact, and its potential for reversal,
depend on the diversity (and traits) of native species thatcould compete with the post-disturbance invader and ulti-mately recolonize these sites over time (Didham, Watts &Norton 2005). Our system, like Great Basin sagebrush–cheat-grass systems, has a low diversity of dominant woody spe-cies, which contributes to low native woody plant recovery.
CARBON STORAGE AND ANPP
In the last two decades, there has been great interest in howplant composition and forest management practices influencecarbon storage because of the importance of C sequestrationas a strategy to offset fossil fuel emissions (e.g. Canadell &Raupach 2008). Several studies have shown that increases inANPP due to increases in woody plants do not always resultin increased ecosystem C storage, consistent with our study:we found that ANPP is converging between the habitatsbecause of succession towards a grass/M. faya savanna, but Cstorage is still different because above-ground C remainslower and soil C storage is unchanged. The still lower above-ground C pool in burned sites is due to the lack of recoveryof the C-storing, slow-growing native plants that dominateunburned woodland and the much higher standing tree
Fig. 5. Pools of (a) carbon and (b) nitrogen in plants, roots and litterin burned (TB) and unburned (UB) habitats. Bars are means � 1SE.Asterisks denote that habitats show significant differences with t-testsat the *P ≤ 0�05, **P ≤ 0�01 and ***P ≤ 0�001 levels. Woody plantpools (TB: n = 11; UB: n = 10); grass pools (TB: n = 5; UB:n = 10); and woody litter and roots, n = 20. Morella faya data werelog10 transformed for analyses due to unequal variances/non-normaldistributions.
Fig. 6. Plant (a) carbon accrual and (b) nitrogen uptake as measuredby above-ground growth x tissue C and N content, unburned andburned (twice burned) habitat. Bars are means � 1SE. Asterisksdenote that habitats show significant differences with t-tests at the*P ≤ 0�05, **P ≤ 0�01 and ***P ≤ 0�001 levels. Woody plant pools(UB: n = 10; TB: n = 11), grass pools (UB: n = 10; TB: n = 5).Morella faya and TOTAL (all species) data were log10 transformedfor analyses due to unequal variances/non-normal distributions.
© 2017 The Authors. Journal of Ecology © 2017 British Ecological Society, Journal of Ecology, 105, 1462–1474
1470 C. M. D’Antonio, S. G. Yelenik & M. C. Mack

biomass in unburned both today and in the past (Mack,D’Antonio & Ley 2001). These native species build up a highC:N surface litter layer (Table S3) and higher C in theirwood—all traits that would lead to higher above-groundecosystem C storage.
Below-ground increases in C have been observed when for-est is converted to pasture (Guo & Gifford 2002), a conver-sion similar to the change from woodland to grasslandinduced by fire and invasion in our sites. Yet we did not seean increase in soil C storage in the grassland despite decadesof grass domination. Both habitats stored roughly12 000 g m�2 of C in soil. The lack of increase in soil Cmay be because microbes and decomposition processes alsorespond to vegetation change, and increased respiratorylosses, such as might be induced by M. minutiflora with itsdense above-ground litter layer could result in lack ofadditional soil C accumulation.Above-ground net primary production in our burned sites
has come to be dominated by the invasive N-fixing tree,M. faya, a change from 25 years ago (Fig. 3). Elsewhere,woody plant invasion of grassland has been found to drivedown soil C at precipitation >1000 mm offsetting gains inabove-ground C with woody invasion (Jackson et al. 2002).Yet our results are not consistent with this: soil C storage wasstatistically similar among habitats (11 592 g m�2 in wood-land vs. 12 573 g m�2 in burned), while the plant and litterC pool together was twice as high in the woodland(5191 g m�2 vs. 2550 g m�2). Ash soils tend to have highcapacity for C storage (Torn et al. 1997; Kramer et al. 2012)
Table 2. Soil carbon and nitrogen pools (g m�2) in unburned (UB) and burned (TB) habitats between 2011 and 2013. Values = means of threecoring locations in each of five sites per habitat with standard error in parentheses. F-values represent results of ANOVA with location nestedwithin site. Nesting factor always P > 0�10. d.f. for habitat effect = 1, 28. %N and C are presented in Table 3. Values obtained for individualcores were converted to g m�2 using bulk density for each soil layer. F-(only shown for P < 0�10) and P-values in table below are for each soillayer. Analysis of pool distributions by depth was not done here because of differences in soil volume in the different depth fractions
Depth (cm)
C pool (g m�2) N pool (g m�2)
UB TB F, P UB TB F, P
0–5 3094�5 (220�8) 2795�1 (121�1) P = 0�245 110�9 (8�9) 155�5 (7�5) 14�69, P < 0�0015–10 2304�7 (167�3) 2409�1 (118�8) P = 0�619 132�0 (10�7) 146�0 (9�9) P = 0�35210–20 3321�0 (270�4) 4183�8 (256�8) 4�75, P = 0�038 209�6 (16�6) 250�6 (15�3) 3�31, P = 0�07920–30 2976�1 (212�3) 3185�4 (234�1) P = 0�53 179�4 (12�8) 191�0 (13�1) P = 0�543Total 11 592�7 (637�2) 12 573�4 (437�4) P = 0�134 623�0 (33�7) 743�1 (25�7) 9�26, P = 0�005
Bold indicates P values of <0�10 suggesting statistical significance or a strong trend.
Table 3. Soil bulk density, % nitrogen (N), % carbon (C), and C:N ratio of unburned (UB) and burned (TB) habitats between 2011 and 2013.Because the significance of nesting factors (site within habitat) were always >0�12, it was excluded from further models. Values therefore repre-sent means where N = 15. Standard errors are in parentheses. Lower case letters indicate significant differences using one-way ANOVAs withhabitat as a fixed effect for each depth, and Tukey tests at P < 0�05 significant values. The bottom row gives statistics for two-way ANOVAswith depth and habitat as fixed effects, as well as an interaction term. F and P-values are shown only when P < 0�10
Depth (cm)
Bulk density (g soil cm�3) Soil %N Soil %C Soil C:N
UB TB UB TB UB TB UB TB
0–5 0�42a (0�03) 0�49a (0�02) 0�46b (0�02) 0�60a (0�03) 13�54a (1�13) 10�77b (0�67) 30�12b (2�90) 18�12a (0�50)5–10 0�67b (0�04) 0�70b (0�04) 0�40bc (0�048) 0�44b (0�03) 7�15c (0�64) 7�30c (0�55) 17�68a (0�60) 16�84a (0�60)10–20 0�77b (0�06) 0�74b (0�07) 0�29cd (0�03) 0�35bcd (0�04) 4�69d (0�42) 5�81cd (0�51) 16�11a (0�40) 16�74a (0�50)20–30 0�94c (0�04) 0�81c (0�03) 0�23d (0�03) 0�25d (0�02) 3�67d (0�37) 4�20d (0�37) 16�86a (0�70) 16�62a (0�40)F, P Depth: F = 36�98,
P < 0�001Habitat = 9�46, P < 0�003 Depth: F = 65�47, P < 0�001 Depth*Habitat: F = 16�51,
P = 0�004Depth*Habitat = 2�153,P = 0�09
Depth: F = 34�49, P < 0�001 Depth*Habitat: F = 3�85,P = 0�016
Bold indicates P values of <0�10 suggesting statistical significance or a strong trend.
Table 4. d13C values of soil organic carbon and plant leaves fromunburned and burned sites. 13C values are means from five samples(each a composite of five samples) from each habitat. Leaf 13C valuesare means from 5 to 25 samples per type (C4 vs. C3) depending onhabitat and plant type. Proportion of SOC (soil organic carbon) fromC4 calculated with simple mixing model
Unburned Burned
d13C soil0–5 cm �26�03 �20�9420–30 cm �25�43 �22�45
d13C plant leavesC4 �13�71 �13�41C3 (native woody) �26�03 �25�94
Proportion SOC from C4
0–5 cm 6�28 39�9020–30 cm 10�94 27�29
Bold indicates P values of <0�10 suggesting statistical significance ora strong trend.
© 2017 The Authors. Journal of Ecology © 2017 British Ecological Society, Journal of Ecology, 105, 1462–1474
Longterm ecosystem impacts of grass invasions 1471

and so may be buffered from C loss as the vegetationchanges. Thus, despite clear differences in the nature of vege-tation inputs to soil as estimated from delta 13C values of soil(Table 4), soil C pools remain similar in overall size. Whilethis is consistent with at least one review of soil C pools inforested ecosystems, it contrasts with studies that reportincreases in soil C pools with N-fixation in some forested sys-tems (Johnson & Curtis 2001). If N-fixers alleviate N limita-tion and do not become limited by other nutrients (like P),then soil C pools may increase over time.
FIRE AND TIPPING POINTS IN DRYLAND FOREST
ECOSYSTEMS
Many dry forest ecosystems experience fire as a regular peri-odic disturbance and the trajectory of ANPP after fire appearsto depend on the recruitment of trees (Mack et al. 2008;Turner 2010). Similarly, ANPP in burned grasslands can bestrongly enhanced by woody plant recruitment because woodyspecies typically have much greater leaf area and thus muchgreater potential for annual growth (Lett et al. 2004; Knappet al. 2008). In our system (1500 mm mean annual precipita-tion [MAP]), recruitment of only one native shrub species,D. viscosa, occurred in the initial post-fire decade. This spe-cies, however, has low leaf area and contributes minimally toANPP (Fig. 2a). Tree recruitment did not occur until the sec-ond post-fire decade (by non-native M. faya), such that nowANPP is approaching that of unburned sites despite substan-tially lower tree density overall. Thus, the high contributionof individual M. faya trees to ANPP in burned sites (Figs 1–3) suggests that like other post-fire woodland or forestedecosystems in the world, tree density will drive ANPP. Inwetter Hawaiian forests, Asner et al. (2006) found thatM. faya had consistently higher Leaf Area Index thanM. polymorpha and grew 16–44% more rapidly, which isconsistent with our data (Table 1). These fundamental differ-ences in growth rate explain the convergence of ANPPbetween unburned and the burned habitats.Does the relationship between tree density and ANPP pla-
teau as ecosystems develop? In our system, the answerdepends on ultimate M. faya density. In other work (C. M.D’Antonio & S. G. Yelenik, in review), we found that estab-lished M. faya in these sites enhance grass N status severalmetres beyond the canopy edge which in turn should enhancegrass growth (D’Antonio & Mack 2006). Enhanced grasscover should reduce M. faya’s further invasion because asseedlings, M. faya plants do not compete well with denseMelinis (Yelenik, D’Antonio & August-Schmidt 2017). Thus,M. faya abundance should plateau without achieving canopyclosure because it enhances a competitor beyond its canopyedges suppressing its further recruitment. In the woodlandhowever, where M. faya is also invading, it grows moreslowly (Table 1) likely as a result of greater competition fromnative woody species. Asner et al. (2010) studying nearbyM. faya-invaded sites at higher MAP (2000–3000 mm rainper year) found that its invasion did not lead to net changesin above-ground C pools. They used Lidar and hyperspectral
imaging to evaluate contributions of M. faya to above-groundC in five sites and concluded that the elimination of under-storey species via competition from the dense M. faya canopycompensates for C sequestered in M. faya trees. In our burnedsites M. faya replaces species with much lower biomass(M. minutiflora), but in the unburned, increases in its growthmay be compensated by reduced growth and eventual loss ofnative woody species. Thus, our unburned sites are more akinto some of those studied by Asner et al. (2010), while theburned sites are much different. Overall, adding more M. fayato unburned will likely not enhance either ANPP or C storagebecause of interactions and compensation with native under-storey species.Laurance et al. (2011) identified dry land forests and
savanna/woodlands in Australia as ecosystems are vulnerableto tipping points due to changing fire regimes. The ecosys-tems we studied here experienced only two fires yet they arefar from the composition and C storage of the ecosystemsfrom which they were derived and we are predicting that theyare unlikely to arrive back to those conditions. Fire hasoccurred in the quaternary history of Hawaiʻi yet most ofthese species did not evolve with a regular fire regime, nordid they evolve with competitors like these African grasseswhose dominance can be triggered by a single fire (Hughes,Vitousek & Tunison 1991; D’Antonio, Hughes & Vitousek2001). As a result, the ecosystem is vulnerable to long-termchange even from a single disturbance. Didham, Watts &Norton (2005) suggested that alternative stable states or longtransitions occur when abiotic conditions are harsh and wheretrait diversity is limited. The ecosystems we studied have botha harsh dry season (April through August) and limited traitdiversity. In addition, the shallow soil limits water-holdingcapacity making the ecosystems perhaps harsher than mightbe revealed by MAP. Thus, this ecosystem fits with predic-tions of when and where invaders dominated states will bepersistent (Didham, Watts & Norton 2005) even despite resili-ence of ANPP.
Conclusions
We found that ANPP, soil C pools and total plant and soil Npools are resilient to fire and invasion, but that native woodyplant density and composition and plant C pools are not. Ourresults contrast with reviews that suggest that invadersincrease ANPP above uninvaded sites (Liao et al. 2008; Vilaet al. 2011) and highlight that the recovery of ANPP comesabout because of a new arriving invader and not recovery ofnative woody species. Thus, generalities (see Liao et al.2008; Vila et al. 2011) can mask important context-specificimpacts of invaders. The life-form/traits of the invader needsto be considered when predicting impacts on ANPP: a grassmoving into a woody ecosystem, triggers a lowered ANPP atleast for a decade, while an invasive tree then counteracts thatchange.In low-diversity ecosystems such as those studied here, inva-
ders contribute to long-term compositional change towards noanalogue communities despite the recovery of ANPP and N
© 2017 The Authors. Journal of Ecology © 2017 British Ecological Society, Journal of Ecology, 105, 1462–1474
1472 C. M. D’Antonio, S. G. Yelenik & M. C. Mack

pools. Our study thus highlights the need for caution in defin-ing ecosystem resilience. Measured as simply ‘recovery ofANPP and N pools’ towards a reference ecosystem, the systemappears to be resilient. Yet, from a species composition andstructure (density) perspective, these ecosystems do not recoverfrom invasion and fire. Like native woody species metrics,plant C pools are sensitive to fire and invasion and did notrecover over this multi-decadal time-scale because the loss ofM. polymorpha was not compensated by invasion of M. faya.Our study suggests untapped potential for above-ground Cstorage which could be achieved through restoration of slow-growing, high C:N woody plants in burned sites (Ostertaget al. 2015). The fate of these sites if not managed over thenext decade will ultimately depend on the dynamics M. faya,which enhances M. minutiflora beyond its canopy thus poten-tially limiting its own recruitment.
Authors’ contributions
C.M.D. and S.Y. conceived of the original research in this paper based on ear-lier work done by M.C.M. and C.M.D.; S.Y. and C.M.D. carried out fieldwork; S.Y. compiled the data and led analysis of plant data, C.M.D. led analy-sis of soils, M.C.M. was responsible for 1990s data; all authors contributed todata interpretation; C.M.D. led the writing and all authors contributed criticallyto the drafts.
Acknowledgements
The authors acknowledge the following individuals for field and laboratoryassistance: J. Batemen, B. Buckley, N. DiManno, T. D’Antonio-Dudley,T. Kalei, S. Ma, G. Ravenhurst, and V. Vincent. Logistical support and siteaccess were provided by Rhonda Loh and Sierra McDaniel with ResourcesManagement at Hawaiʻi Volcanoes National Park. We also thank Greg Apletfor raw data on ʻ�ohiʻa (Metrosideros) allometric equations. We thank R. Loh,J. Ross, L. Flory and two anonymous reviewers for comments on the manu-script. This research was funded by National Science Foundation DEB1029168 and two REU supplements. Any use of trade, firm or product namesis for descriptive purposes only and does not imply endorsement by the U.S.Government. We have no conflicts of interest to declare.
Data accessibility
Data associated with the figures and tables in this manuscript can be found athttps://knb.ecoinformatics.org/#view/knb.1302.1 (Yelenik 2017).
References
Ainsworth, A. & Kauffman, J.B. (2009) Response of native Hawaiian woodyspecies to lava-ignited wildfires in tropical forests and shrublands. PlantEcology, 201, 197–209.
Ainsworth, A. & Kauffman, J.B. (2010) Interactions of fire and nonnative spe-cies across an elevation/plant community gradient in Hawaii VolcanoesNational Park. Biotropica, 42, 647–655.
Aplet, G.H. & Vitousek, P.M. (1994) An age-altitude matrix analysis of Hawai-ian rainforest succession. Journal of Ecology, 82, 137–147.
Asner, G.P., Martin, R.E., Carlson, K.M., Rascher, U. & Vitousek, P.M. (2006)Vegetation–climate interactions among native and invasive species in Hawai-ian rainforest. Ecosystems, 9, 1106–1117.
Asner, G.P., Martin, R.E., Knapp, D.E. & Kennedy-Bowdoin, T. (2010) Effectsof Morella faya tree invasion on aboveground carbon storage in Hawaii. Bio-logical Invasions, 12, 477–494.
Bradley, B.A., Houghton, R., Mustard, J.F. & Hamburg, S.P. (2006) Invasivegrass reduces aboveground carbon stocks in shrublands of the Western US.Global Change Biology, 12, 1815–1822.
Canadell, J.G. & Raupach, M.R. (2008) Managing forests for climate changemitigation. Science, 320, 1456–1457.
D’Antonio, C., Dudley, T. & Mack, M. (1999) Disturbance and biologicalinvasions: direct effects and feedbacks. Ecosystems of the World, 16, 413–452.
D’Antonio, C.M., Hughes, R.F. & Tunison, J.T. (2011) Long-term impacts ofinvasive grasses and subsequent fire in seasonally dry Hawaiian woodlands.Ecological Applications, 21, 1617–1628.
D’Antonio, C.M., Hughes, R.F. & Vitousek, P.M. (2001) Factors influencingdynamics of two invasive C-4 grasses in seasonally dry Hawaiian woodlands.Ecology, 82, 89–104.
D’Antonio, C.M. & Mack, M.C. (2006) Nutrient limitation in a fire-derived,nitrogen-rich Hawaiian grassland. Biotropica, 38, 458–467.
D’Antonio, C.M., Tunison, J.T. & Loh, R.K. (2000) Variation in the impact ofexotic grasses on native plant composition in relation to fire across an eleva-tion gradient in Hawaii. Austral Ecology, 25, 507–522.
D’Antonio, C.M. & Vitousek, P.M. (1992) Biological invasions by exoticgrasses, the grass fire cycle, and global change. Annual Review of Ecologyand Systematics, 23, 63–87.
Didham, R.K., Watts, C.H. & Norton, D.A. (2005) Are systems with strongunderlying abiotic regimes more likely to exhibit alternative stable states?Oikos, 110, 409–416.
Diez, J.M., D’Antonio, C.M., Dukes, J.S. et al. (2012) Will extreme climaticevents facilitate biological invasions? Frontiers in Ecology and the Environ-ment, 10, 249–257.
Ehrenfeld, J.G. (2003) Effects of exotic plant invasions on soil nutrient cyclingprocesses. Ecosystems, 6, 503–523.
Fukami, T. & Nakajima, M. (2011) Community assembly: alternative stablestates or alternative transient states? Ecology Letters, 14, 973–984.
Guo, L.B. & Gifford, R. (2002) Soil carbon stocks and land use change: a metaanalysis. Global Change Biology, 8, 345–360.
Harcombe, P., Cameron, G. & Glumac, E. (1993) Above-ground net primaryproductivity in adjacent grassland and woodland on the coastal prairie ofTexas, USA. Journal of Vegetation Science, 4, 521–530.
Hicke, J.A., Allen, C.D., Desai, A.R. et al. (2012) Effects of biotic disturbanceson forest carbon cycling in the United States and Canada. Global ChangeBiology, 18, 7–34.
Hobbs, R.J., Higgs, E. & Harris, J.A. (2009) Novel ecosystems: implications forconservation and restoration. Trends in Ecology & Evolution, 24, 599–605.
Hobbs, R.J. & Humphries, S.E. (1995) An integrated approach to the ecologyand management of plant invasions. Conservation Biology, 9, 761–770.
Hughes, R.F. & Denslow, J.S. (2005) Invasion by a N-2-fixing tree alters func-tion and structure in wet lowland forests of Hawaii. Ecological Applications,15, 1615–1628.
Hughes, R.F. & Vitousek, P.M. (1993) Barriers to shrub reestablishment follow-ing fire in the seasonal submontane zone of Hawaii. Oecologia, 93, 557–563.
Hughes, R.F., Vitousek, P.M. & Tunison, T. (1991) Alien grass invasion andfire in the seasonal submontane zone of Hawaii. Ecology, 72, 743–746.
Jackson, R.B., Banner, J.L., Jobb�agy, E.G., Pockman, W.T. & Wall, D.H.(2002) Ecosystem carbon loss with woody plant invasion of grasslands. Nat-ure, 418, 623–626.
Jandl, R., Lindner, M., Vesterdal, L., Bauwens, B., Baritz, R., Hagedorn, F.,Johnson, D.W., Minkkinen, K. & Byrne, K.A. (2007) How strongly can forestmanagement influence soil carbon sequestration? Geoderma, 137, 253–268.
Johnson, D.W. & Curtis, P.S. (2001) Effects of forest management on soil Cand N storage: meta analysis. Forest Ecology and Management, 140, 227–238.
Klironomos, J.N. (2002) Feedback with soil biota contributes to plant rarityand invasiveness in communities. Nature, 417, 67–70.
Knapp, A.K., Briggs, J.M., Collins, S.L. et al. (2008) Shrub encroachment inNorth American grasslands: shifts in growth form dominance rapidly alterscontrol of ecosystem carbon inputs. Global Change Biology, 14, 615–623.
Kramer, M.G., Sanderman, J., Chadwick, O.A., Chorover, J. & Vitousek, P.M.(2012) Long-term carbon storage through retention of dissolved aromaticacids by reactive particles in soil. Global Change Biology, 18, 2594–2605.
Laurance, W.F., Dell, B., Turton, S.M. et al. (2011) The 10 Australian ecosystemsmost vulnerable to tipping points. Biological Conservation, 144, 1472–1480.
Lett, M.S., Knapp, A.K., Briggs, J.M. & Blair, J.M. (2004) Influence of shrubencroachment on aboveground net primary productivity and carbon and nitro-gen pools in a mesic grassland. Canadian Journal of Botany, 82, 1363–1370.
Liao, C.Z., Peng, R.H., Luo, Y.Q., Zhou, X.H., Wu, X.W., Fang, C.M., Chen,J.K. & Li, B. (2008) Altered ecosystem carbon and nitrogen cycles by plantinvasion: a meta-analysis. New Phytologist, 177, 706–714.
Loh, R.K. & Daehler, C.C. (2008) Influence of woody invader control methodsand seed availability on native and invasive species establishment in aHawaiian forest. Biological Invasions, 10, 805–819.
© 2017 The Authors. Journal of Ecology © 2017 British Ecological Society, Journal of Ecology, 105, 1462–1474
Longterm ecosystem impacts of grass invasions 1473

Lundberg, J. & Moberg, F. (2003) Mobile link organisms and ecosystem func-tioning: implications for ecosystem resilience and management. Ecosystems,6, 0087–0098.
Mack, M.C. (1998) Effects of exotic grass invasion on ecosystem nitrogendynamics in a Hawaiian woodland. PhD, University of California, Berkeley,CA, USA.
Mack, M.C. & D’Antonio, C.M. (1998) Impacts of biological invasions on dis-turbance regimes. Trends in Ecology & Evolution, 13, 195–198.
Mack, M.C. & D’Antonio, C.M. (2003a) The effects of exotic grasses on litterdecomposition in a Hawaiian woodland: the importance of indirect effects.Ecosystems, 6, 723–738.
Mack, M.C. & D’Antonio, C.M. (2003b) Exotic grasses alter controls over soilnitrogen dynamics in a Hawaiian woodland. Ecological Applications, 13,154–166.
Mack, M.C., D’Antonio, C.M. & Ley, R.E. (2001) Alteration of ecosystemnitrogen dynamics by exotic plants: a case study of C-4 grasses in Hawaii.Ecological Applications, 11, 1323–1335.
Mack, M.C., Treseder, K.K., Manies, K.L., Harden, J.W., Schuur, E.A., Vogel,J.G., Randerson, J.T. & Chapin, F.S. III (2008) Recovery of abovegroundplant biomass and productivity after fire in mesic and dry black spruce for-ests of interior Alaska. Ecosystems, 11, 209–225.
Magnani, F., Mencuccini, M., Borghetti, M. et al. (2007) The human footprintin the carbon cycle of temperate and boreal forests. Nature, 447, 849–851.
McLauchlan, K.K., Higuera, P.E., Gavin, D.G. et al. (2014) Reconstructing dis-turbances and their biogeochemical consequences over multiple timescales.BioScience, 64, 105–116.
Ostertag, R., Warman, L., Cordell, S. & Vitousek, P.M. (2015) Using plantfunctional traits to restore Hawaiian rainforest. Journal of Applied Ecology,52, 805–809.
Peltzer, D.A., Wardle, D.A., Allison, V.J. et al. (2010) Understanding ecosys-tem retrogression. Ecological Monographs, 80, 509–529.
Reinhart, K.O. & Callaway, R.M. (2004) Soil biota facilitate exotic Acer inva-sions in Europe and North America. Ecological Applications, 14, 1737–1745.
Rossiter, N.A., Setterfield, S.A., Douglas, M.M. & Hutley, L.B. (2003) Testingthe grass-fire cycle: alien grass invasion in the tropical savannas of northernAustralia. Diversity and Distributions, 9, 169–176.
Scurlock, J.M., Johnson, K. & Olson, R.J. (2002) Estimating net primary pro-ductivity from grassland biomass dynamics measurements. Global ChangeBiology, 8, 736–753.
Strayer, D.L. (2012) Eight questions about invasions and ecosystem function-ing. Ecology Letters, 15, 1199–1210.
Strayer, D.L., Eviner, V.T., Jeschke, J.M. & Pace, M.L. (2006) Understandingthe long-term effects of species invasions. Trends in Ecology & Evolution,21, 645–651.
Suding, K.N., Gross, K.L. & Houseman, G.R. (2004) Alternative states andpositive feedbacks in restoration ecology. Trends in Ecology & Evolution,19, 46–53.
Torn, M., Trumbore, S.E., Chadwick, O.A., Vitousek, P.M. & Hendricks, D.M.(1997) Mineral control over soil organic carbon and turnover. Nature, 389,170–173.
Tunison, J.T., D’Antonio, C.M. & Loh, R.K. (2000) Fire and INVASIVEPLANTS in Hawai ‘i volcanoes National Park. Proceedings of the Invasive
Species Workshop: The Role of Fire in the Control and Spread of InvasiveSpecies, Tall Timbers Research Station Publication No. 11 (eds K.E. Galley& T.P. Wilson), pp. 122–131. Allen Press, Lawrence, KS, USA.
Tunison, J.T., Loh, R. & Leialoha, J.A.K. (1995) Fire effects in the submon-tane seasonal zone in Hawaii Volcanoes National Park, Technical Report 97.Cooperative National Park Resources Studies Unit, Manoa, HI, USA.
Turner, M.G. (2010) Disturbance and landscape dynamics in a changing world1. Ecology, 91, 2833–2849.
Vila, M., Espinar, J.L., Hejda, M. et al. (2011) Ecological impacts of invasivealien plants: a meta-analysis of their effects on species, communities andecosystems. Ecology Letters, 14, 702–708.
Vitousek, P.M. & Walker, L.R. (1989) Biological invasion by Myrica faya inHawai’i: plant demography, nitrogen fixation, ecosystem effects. EcologicalMonographs, 59, 247–265.
Wasser, M.W. (2015) Decadal scale vegetation response of Metrosideros poly-morpha-dominated communities to wildfire on Hawai’i Island. MS thesis,University of Hawai’i, Hilo.
Yelenik, S. (2017) Long-term impacts of grass invasion and fire, HawaiiNational Park. Knowledge Network for Biocomplexity, knb.1302.1.
Yelenik, S.G. & D’Antonio, C.M. (2013) Self-reinforcing impacts of plantinvasions change over time. Nature, 503, 517–520.
Yelenik, S.G., D’Antonio, C.M. & August-Schmidt, E.M. (2017) The influenceof soil resources and plant traits on invasion and restoration in a subtropicalwoodland. Plant Ecology, 218. (in press).
Yelenik, S.G., Stock, W.D. & Richardson, D.M. (2004) Ecosystem levelimpacts of invasive Acacia saligna in the South African fynbos. RestorationEcology, 12, 44–51.
Received 4 February 2017; accepted 5 June 2017Handling Editor: Luke Flory
Supporting Information
Details of electronic Supporting Information are provided below.
Figure S1. Monthly rainfall across the sampling periods (a) 1994 to1996 and (b) 2011 to 2013.
Table S1. Sampling design and terms.
Table S2. Allometric equations for biomass.
Table S3. Carbon to nitrogen ratio of litter collected from UB andTB sites.
© 2017 The Authors. Journal of Ecology © 2017 British Ecological Society, Journal of Ecology, 105, 1462–1474
1474 C. M. D’Antonio, S. G. Yelenik & M. C. Mack