ecotourism development in a remote district of india: …
TRANSCRIPT

SJIF Impact Factor 2021: 8.013| ISI I.F.Value:1.241| Journal DOI: 10.36713/epra2016 ISSN: 2455-7838(Online)
EPRA International Journal of Research and Development (IJRD) Volume: 6 | Issue: 8 | August 2021 - Peer Reviewed Journal
2021 EPRA IJRD | Journal DOI: https://doi.org/10.36713/epra2016 | www.eprajournals.com |50 |
ECOTOURISM DEVELOPMENT IN A REMOTE DISTRICT OF INDIA: A STUDY OF TAWANG,
ARUNACHAL PRADESH
Ashi Lama Associate Professor, Department of Economics, Rajiv Gandhi University, Doimukh-791112, Itanagar,
Arunachal Pradesh, India
ABSTRACT This paper explores the potentials and challenges of ecotourism development in Tawang, a remote district of
Arunachal Pradesh, India. It also examines the trend in tourist arrivals, travel choice and expenditure pattern of the
tourists based on secondary and field survey data collected from randomly selected 200 Indian tourists. The data were
analysed by using statistical tools such as percentage, compound annual growth rate, line graph and pie diagram. The
study revealed that Tawang has huge potentials for ecotourism development owing to its location in Eastern
Himalayan ranges. Its landscape is extremely fascinating with presence of numerous snow-capped peaks, passes and
lakes, historical sites and cultural heritage. However, the tourists inflow in Tawang has been fluctuating and its share
in total tourist arrivals in the State has declined over the years. The travel choice of tourists indicated that most of the
tourists visited this destination in a group of families mainly to enjoy natural beauty. The expenditure pattern
indicated that tourists spent greater proportion on accommodation, transportation and food and beverages. The main
challenges of ecotourism development were identified as inaccessibility, inadequate recreational facilities, entry
restrictions, climatic constraints and socio-political disturbances. Hence, the policy should focus on improving
connectivity, recreational facilities, quality of services and maintain clean and green environment.
KEYWORDS: Ecotourism, Tawang, Potentials, Challenges, Travel Choice, Expenditure Pattern
INTRODUCTION Ecotourism is a form of tourism that involves travelling
to natural sites to enjoy and admire natural environment
and culture connected with such environment. It is
dependent on nature environments (both living and
non-living) and any indigenous cultures closely
connected to such environments (Tisdell, 2001).
Ecotourism is defined is a variety of ways. However,
the most widely accepted definition was given by
Ceballos–Lascurain in 1987 who defined it as, “tourism
that involves traveling to relatively undisturbed or
uncontaminated natural areas with the specific
objective of studying, admiring and enjoying the
scenery and its wild plants and animals as well as any
existing cultural manifestations (both past and present)
found in these areas” (Boo, 1990, p.20). The
Ecotourism Society in 1991 defined ecotourism as,
“purposeful travel to natural areas to understand the
culture and natural history of the environment, taking
care not to alter the integrity of ecosystem while
producing economic opportunities that make the
conservation of natural resources beneficial to local
people”. The society, later, shortened this definition of
ecotourism to “responsible travel to natural areas which
conserves the environment and improves the welfare of
local people” (Western, 1993, p. 8).
These definitions imply that ecotourism is
based on natural environment and local culture and it
involves non-consumptive and mindful use of
surrounding environments for recreation benefit of
visitors and economic benefits of local people by
generating income and employment opportunities. It is
a nature-based tourism that must enhance or maintain
natural systems. It involves recreational activities such
as bird watching, wildlife watching, nature
photography, botanical study, and wildlife treks or

SJIF Impact Factor 2021: 8.013| ISI I.F.Value:1.241| Journal DOI: 10.36713/epra2016 ISSN: 2455-7838(Online)
EPRA International Journal of Research and Development (IJRD) Volume: 6 | Issue: 8 | August 2021 - Peer Reviewed Journal
2021 EPRA IJRD | Journal DOI: https://doi.org/10.36713/epra2016 | www.eprajournals.com |51 |
safaris (Whelan, 1991). Environmental education is an
important aspect of ecotourism as it can educate both
visitors and local people about the importance of
environment and thus helps to reduce environmental
damage. A distinguishing feature of ecotourism is that
it benefits biodiversity conservation (Brandon and
Margoluis, 1996). Ecotourism is gaining popularity
worldwide because of its potential to combine
conservation of environment and economic
development. In fact, it is one of the fastest growing
segments of the tourism industry (Whelan, 1991). The
global spending on ecotourism is increasing by 20 per
cent per year, about five times the average rate of
growth in tourism industry as a whole (Vijayakumar,
2005). This is because people all over the world are
turning to nature for peace, happiness and enjoyment.
The participation of local community in resource
management and in provisioning of services to the
tourists is an important component of ecotourism. It,
thus, provides economic benefits to local community
and encourage their participation in the conservation
efforts. Because of its potential to produce economic
benefits to host community and ensure conservation of
environment, ecotourism is considered as an effective
strategy across the world to promote sustainable
development.
Tawang district is a remote district of India. It
is situated in the Eastern Himalayas in the north
western corner of Arunachal Pradesh, India. Tawang,
the headquarter of Tawang district, is situated an
altitude of 10,000 ft (3,048 m) above mean sea level.
This district is connected to the rest of the world only
by the National Highway-13. It is located at a distance
of 555 km from Guwahati and 320 km from Tezpur
airport, Assam (the nearest airport) and about 300 km
from Rangapara, Assam (the nearest railway station). It
is strategically located and shares international border
with Tibet (China) in the north and Bhutan in the south-
west. It is spread over and area of 2172 sq. km. As per
the population census 2011, the district has a
population of 49,950 persons (54 per cent male and 46
per cent female) with population density of only 23
persons per Sq. km. The literacy rate in the district was
59 per cent as per 2011 census which is lower than the
State average of 65.38 per cent and national average of
74.04 per cent. The district is inhabited by Monpa tribe
who profess Buddhism and are known for hospitable
and peace loving nature. The district is lagging behind
in socio-economic development because of its
inaccessibility, limited arable land owing to its
mountainous topography and lack of industrial
activities. Majority of the people live in rural area (77
per cent as per population census 2011) and are
engaged in agriculture and rearing of animals like yak
and sheep for their livelihood. However, Tawang has
tremendous potential for development of ecotourism
because of its picturesque landscape, crystal fresh water
lakes, cascading waterfalls, peaks and passes, snowfall,
places of historical significance and rich local culture.
Tawang‟s potential for tourism came to be known to
the rest of the world after the filming of a scene of the
Bollywood movie Koyla featuring actress Madhuri
Dixit at Sangetsar Lake in 1996. Since then, Tawang
has been witnessing increasing number of tourist
arrivals every year. However, there are numerous
challenges to development of ecotourism in the
destination.
In this background, this paper explores the
potentials for ecotourism in Tawang, trend in tourist
inflow and tourists‟ perception and challenges of
ecotourism development.
DATA SOURCE AND METHODOLOGY The study is based on both primary and secondary data.
The secondary data were collected from the Indian
Tourism Statistics, Ministry of Tourism, Government
of India and Tourism Statistics of Arunachal Pradesh,
Directorate of Tourism, Government of Arunachal
Pradesh. The primary data were collected by
conducting field survey of visitors in the study area.
The survey was conducted with the help of structured
questionnaire during the peak tourist seasons. The
questionnaire was designed to collect information on
socio-economic variables (such as age, sex, educational
qualification, occupation, income etc.), travel pattern
and choice such as duration of tour, duration of stay,
purpose of visit, sources of information, mode of
transportation and other relevant information. Face-face
interview method was used to collect information from
the tourists. Tourists who had completed their tour
were interviewed in the hotels for collection of
necessary information. The random sampling technique
was applied to select the samples of visitors. The
sample size was 200 Indian tourists. Foreign tourists
could not be included the sample, as the government
had imposed restrictions on their entry owing to Covid-
19 pandemic. In the sample, only adult visitors who
have defined source of income were included because
they are considered to be more realistic in making
personal valuations.
The data were analysed by using various
statistical tools. The Statistical analysis was done using
software such as MS Excel and SPSS.

SJIF Impact Factor 2021: 8.013| ISI I.F.Value:1.241| Journal DOI: 10.36713/epra2016 ISSN: 2455-7838(Online)
EPRA International Journal of Research and Development (IJRD) Volume: 6 | Issue: 8 | August 2021 - Peer Reviewed Journal
2021 EPRA IJRD | Journal DOI: https://doi.org/10.36713/epra2016 | www.eprajournals.com |52 |
ECOTOURISM POTENTIALS OF TAWANG Tawang has a high potential for ecotourism. It is an
ideal destination for ecotourism as it has numerous
natural and cultural attractions which lure tourists from
different parts of the world as well and the country. Its
landscape is quite fascinating owing to undulating
topography consisting of snow-capped peaks, passes,
waterfalls, lakes and river valleys. Unequivocally, it is
one of the most beautiful place on the Earth. The
presence of historical monuments, international borders
and rich culture of the people are added attractions of
Tawang. The ecotourism potentials of Tawang are
presented as follows:
Galden Namgyal Lhatse: It is popularly known as
Tawang Monastery. It the largest monastery in India
and second largest monastery in the world after the
Potala Palace in Lhasa, Tibet. It was founded by Merak
Lama Lodre Gyatso in 1680-1681 in accordance with
the wishes of the 5th
dalai Lama, ngawang Lobsang
Gyatso (Singh, 2016). The main temple is known as
Dukhang which means assembly building. It houses a
large image of Lord Buddha of 18 feet height which is
glided and decorated in a lotus position. Galden
Namgyal Lhatse which means „celestial paradise is a
clear night‟ is the cultural and religious centre of the
people of Tawang. The main festivals held in the
monastery are; Torgya, Losar, Ajilamu and Choskar.
Torgya, an annual festival, is one of the most colourful
and important festivals celebrated in Tawang
Monastery. It is celebrated in the month of January to
drive away evil spirits and to protect the people from
natural disasters. The monastery has a library which
houses valuable old scriptures. It also has a museum
which contains statues of gods and goddesses and
antique items. The monastery attracts a large number of
Buddhist pilgrimage and tourists.
Sela Pass and Sela Lake: Sela Pass is the second
highest motorable Pass in the world after Leh-Manali.
It is situated at and altitude of 13,701 ft (4,176 m)
above mean sea level and connects Tawang with rest of
the world. The landscape of the Pass is mesmerising
and breath-taking with presence of snow cover and Sela
Lake. Sela Lake, located just adjacent, to the Pass is a
crystal fresh water lake. It is really a pristine and a
beautiful high altitude lake. The local community
considers it to be a sacred lake and believe that sacred
ducks swim on the lake which is visible only to few
fortune The fishing and boating activities are strictly
prohibited. Tourists can walk around the lake and take
photography.
Sangetsar lake: The Sangetsar lake (Tso) is popularly
known as Madhuri lake. It is located at a distance of
about 35 km north of Tawang town and 6.4 km west of
Bumla Pass (Indo-China border) and is situated about
15,200 ft above sea level. The lake is situated at 27.720
N and 91.820 E and is one of the most pristine lakes in
the State. It is considered as a sacred lake by the
Buddhist community. It is quite attractive and
fascinating as it is surrounded by snow covered
mountains and alpine forests. It came to be known to
rest of the world after the filming of a scene of
Bollywood movie Koyla in 1997 featuring actress
Madhuri Dixit. Since then it came to be popularly
known as Madhuri lake. The tourists visit the lake for
recreation and enjoy the beauty of the lake, local people
visit it for religious purpose during important days as
per Buddhist calendar. Fishing and other activities are
strictly prohibited in the lake. There is strong a belief
among the local community that any disturbances to the
holy lake may bring calamities and disasters.
Nuranang Waterfall: It is one of the most spectacular
and beautiful waterfalls in Arunachal Pradesh. It is
located near Jang in Tawang district. It is around 100
metre high waterfall. It is formed by Nuranag river
which originates from the northern slopes of Sela Pass
and it discharge its water in Tawang Chu (river). The
fall came to the limelight after the filming of a song of
the Koyla movie featuring actress Madhuri Dixit.
Bum La Pass and Border: Bum La Pass is a border
point between India and Tibet (China). It is situated at a
distance of 37 km north from Tawang town (India). It
is situated at an altitude of (15, 200 ft (4,600 m) above
mean sea level. The Pass, which served as a trading
point between Tawang and Tibet, was closed for
trading after the Sino-India War of 1962. It was re-
opened for local traders after 44 years in 2006. It has a
historic significance as the People‟s Liberation Army
of China entered Tawang through Bum La (Pass)
during the Sino-India War in 1962. One of the fierce
battle of the 1962 Sino-India War took place at Bum La
(Singh, 2016). The 14th
Dalai lama also used this Pass
to cross into Tawang (India) on 30th
March, 1959. The
Pass remains covered with snow for most part of the
year. It is one of the most fascinating pass in the world
because of its wonderful landscape and history
associated with it. The Pass is, now, an important
tourist attraction of and is visited by most of the tourists
who travel to Tawang.
Zemithang Valley: Zemithang valley is a beautiful
place in Tawang district. It is located at distance of
about 90 km away from Tawang town. The route to

SJIF Impact Factor 2021: 8.013| ISI I.F.Value:1.241| Journal DOI: 10.36713/epra2016 ISSN: 2455-7838(Online)
EPRA International Journal of Research and Development (IJRD) Volume: 6 | Issue: 8 | August 2021 - Peer Reviewed Journal
2021 EPRA IJRD | Journal DOI: https://doi.org/10.36713/epra2016 | www.eprajournals.com |53 |
Zemitang is narrow but quite scenic. The road goes
through the thick shadow of pine trees. Zemithang is
known for Gorsam Chorten (Stupa) which is second
largest stupa in Asia after the Baudha stupa of
Kathmandu. Gorsam mela, which is held at the interval
of every three years, attracts a large number of
devotees. Zemithang is also known for Siberian black-
necked Cranes which visit the valley during December
to January as their winter habitat. The Cranes are
considered to be sacred and are revered by the Monpas
as the embodiment of the 6th
Dalai Lama (Rina, 2019).
Nyamjang Chu (river), which originates in Tibet
(China), flows through the valley and adds to its natural
attractions. Tourists can enjoy viewing migratory bird
Siberian black-necked Cranes, visit Gorsam stupa,
swim in the Nyamjang Chu, visit Pangchen valley
community conserved forest for viewing some rare
animals like Red Panda, mock deer, trapogan, monal
etc. Visit to tribal villages and agricultural fields of
Zemithang to learn their culture and tradition can also
be a satisfying experience for tourists.
TREND IN TOURIST ARRIVALS IN
TAWANG Tawang is one of the most attractive tourist spots of the
State. A large number of visitors visit Tawang every
year for recreation and other purposes. It comes under
the Tezpur-Bhalukpong-Bomdila-Tawang tourist
circuit which is one of the government identified tourist
circuits of the State. In recent years, Tawang has come
to emerge as one of the most favoured tourist
destinations. It has become a popular destination for
spending holidays by both domestic and foreign
tourists. The trend in tourist inflow in Tawang has been
observed to be fluctuating (Figure 1).
Figure 1 Trend in Tourist Arrivals in Tawang
Table 1: Tourist Arrivals in Tawang
Year Domestic Foreign Total
Growth of total
(%)
2010 21325 273 21598 NA
2011 16433 277 16710 -22.63
2012 12686 271 12957 -22.46
2013 12874 235 13109 1.17
2014 13919 319 14238 8.61
2015 23776 305 24081 69.13
2016 22039 234 22273 -7.51 Source: Government of Arunachal Pradesh, 2019.
0
5000
10000
15000
20000
25000
30000
2010 2011 2012 2013 2014 2015 2016
Nu
mb
er
of
tou
rist
s
CAGR 3.36%

SJIF Impact Factor 2021: 8.013| ISI I.F.Value:1.241| Journal DOI: 10.36713/epra2016 ISSN: 2455-7838(Online)
EPRA International Journal of Research and Development (IJRD) Volume: 6 | Issue: 8 | August 2021 - Peer Reviewed Journal
2021 EPRA IJRD | Journal DOI: https://doi.org/10.36713/epra2016 | www.eprajournals.com |54 |
The Table 1 shows that inflow of tourists in
Tawang during the period 2010 to 2016. In 2010, total
tourist inflow in the district was 21,598 which
accounted for 9.34 per cent of the total tourist arrivals
in the State. Tourist inflow to Tawang fell sharply by
22.63 per cent to 16,710 in 2011. It was mainly on
account of fall in domestic tourist inflow. It further
decline to 12,957 in 2012. The fall can be attributed to
socio-political disturbance in the State owing to change
in political leadership in the State.
Thereafter, the inflow of tourist in Tawang
improved to 14,238 in 2014. It increased sharply to
24,081 in 2015. But in 2016 tourist inflow marginally
fell to 22,273 which was 5.68 per cent of the total
tourist arrivals in the State. The decline in share of
Tawang in total tourist arrivals in the State indicates
that it is losing its competitive position. The CAGR of
tourist inflow in Tawang during the period 2010 to
2016 was 3.36 per cent. The fluctuations in tourist
inflow in Tawang can be attributed to socio-political
disturbance related to hydropower development.
Hence, there is need to maintain conducive atmosphere
to attract tourists. At the same time, roads and other
infrastructure should be developed to harness its
tourism potential and enhance benefits from tourism.
TOURISTS’ SOCIO-ECONOMIC
CHARACTERISTICS The travel decision and demand for tourism are
influenced to a great extent by the socio-economic
characteristics of tourists and visitors. The study of
socio-economic characteristics and demand pattern of
the tourists is important for developing facilities in
consonance with tourists‟ need and demand pattern.
The socio-economic characteristics of the visitors
include age, gender, education level, occupation,
annual household income etc. The demand pattern
includes purpose of visit, frequency of visit, duration of
stay, type of tour, source of information, expenditure
pattern of tourists in the study area and their responses
to various facilities enjoyed by them. This information
is important to understand in formulating appropriate
policy in future for promoting tourism development.
An analysis of gender-wise distribution of the
surveyed tourists (respondents) revealed among the
surveyed domestic tourists 84.5 per cent were male and
only 15.5 were female. It was found that most of the
respondent tourists were travelling in a group of one or
more families consisting of male, female and children.
The average size of group was 6 persons among the
surveyed tourists. Since female and children constitute
a good proportion of tourists, there is a need to develop
sanitary toilet facilities along the side of routes leading
to tourist spots and at the spots. There is also a need to
develop amusement park for children with all facilities
for enhancing tourists‟ satisfaction and improve
destination loyalty. The age profile of tourists showed
that 31 per cent of were in the age group of 35-45
years, 29 per cent were in the age group of 45-60 years,
and 21.5 per cent were in the age group of 25-35 years,
17 per cent were in the age group of 60 years and
above. The mean age of the surveyed domestic tourists
was 44.71 years. The details are given in Table 2.
Table 2: Distribution of Surveyed Tourists by Age group
Age Group Percentage of tourists
Below 25 1.0
25-35 21.5
35-45 31.00
45-60 29.50
60 and above 17.0
Total 100.00
Source: Field Survey 2020
Thus, it was observed that 53.5 per cent of the
surveyed domestic tourists belonged to relatively young
age group of below 45 years.
The household size is also one of the factors
influencing visitation rate. The analysis showed that
household size of most of the tourists was small. The
details are given in the table 3.

SJIF Impact Factor 2021: 8.013| ISI I.F.Value:1.241| Journal DOI: 10.36713/epra2016 ISSN: 2455-7838(Online)
EPRA International Journal of Research and Development (IJRD) Volume: 6 | Issue: 8 | August 2021 - Peer Reviewed Journal
2021 EPRA IJRD | Journal DOI: https://doi.org/10.36713/epra2016 | www.eprajournals.com |55 |
Table 3: Distribution of Surveyed Tourists by Household Size
Household Size Percentage of tourists
1 to 3 42.5
4 to 8 53.0
9 and above 4.50
Total 100.00
Source: Field Survey 2020
The analysis of household size of domestic
tourists showed that 53 per cent of domestic tourists
had household size of 4 to 8 members. However, a
good number of domestic tourists (42.5 per cent) were
having small household size and only 4.50 per cent
were of them were having large household size. The
analysis shows that the demand for recreation comes
mainly from small and medium size households. This is
expected as per capita income of small and medium
sized household tend to relatively be higher than the
others.
Demand for tourism is also influenced by the
educational level of the people. It is argued that the
demand for tourism varies directly with education. This
is because the educated people understand the
importance of recreational activities in improving both
physical and mental health and so they tend to travel
for recreation. The analysis of the education level of the
surveyed tourists revealed that most of them were
sufficiently educated. None of the tourist was found
illiterate. The details are given in the Table 4.
Table 4: Distribution of Surveyed Tourists by Education level
Education level Percentage of tourists
Primary level 0.50
Secondary level 3.5
Higher Secondary 4.5
Graduate 56.5
Post Graduate and above 31.5
Any other 3.5
Total 100.00
Source: Field Survey 2020
It was found that majority of the surveyed
tourists were graduates (56.5 per cent) followed by post
graduates and above (31.50 per cent). Among the
surveyed domestic tourists, 3.50 per cent were educated
up to secondary level and 4.5 per cent up to higher
secondary. Any other category accounted for 3.5 per
cent of tourists which mainly consisted of diploma
holders.
Occupation is also important determinants of
demand for recreation. People with better occupation
are more likely to travel frequently for recreation. The
government service holders in India enjoy the facility
of leave travel concession (LTC) for all India travel.
This facility has encouraged people to travel to
different places for tourism and recreation. Hence,
occupation can be an important factor determining the
demand for tourism. The analysis of data showed that
most of the surveyed tourists were salaried employees
followed by professional/consultant and self-employed
and business. Any other category included mostly
social workers, members of NGOs, pensioners, writers,
housewife etc. The details are given in the Table 5.

SJIF Impact Factor 2021: 8.013| ISI I.F.Value:1.241| Journal DOI: 10.36713/epra2016 ISSN: 2455-7838(Online)
EPRA International Journal of Research and Development (IJRD) Volume: 6 | Issue: 8 | August 2021 - Peer Reviewed Journal
2021 EPRA IJRD | Journal DOI: https://doi.org/10.36713/epra2016 | www.eprajournals.com |56 |
Table 5: Distribution of Surveyed Tourists by Occupation
Occupation Percentage of tourists
Salaried Employee Govt./Private 55.0
Self-employed 19.0
Professional/Consultant 12.5
Any other 13.5
Total 100.00
Source: Field Survey 2020
The study of the occupational category of the surveyed
tourists revealed that most of them were salaried
employees (55 per cent) followed by self-employed (19
per cent) and professional/consultant (12.5 per cent).
The income is considered to be one of most
important factors that influence the demand for
recreation in any site or destination. Demand for
recreation is considered to be positively influenced by
income level. People with higher level of income tend
to have higher demand for recreation, as recreation is
considered to be a luxury goods. The surveyed tourists
were classified into various income groups to know the
demand for tourism from various categories of tourists.
The classification of the surveyed tourists on the basis
of annual household income is given in the Table 6.
Table 6: Distribution of Surveyed Tourists by Annual Household Income
Income (in Rs. lakh) Percentage of tourists
Less than 5 9.0
5-10 42
10-15 26.5
15-20 5.5
20 and above 17.0
Total 100.00
Source: Field Survey 2020
The Table 6 shows that majority of the surveyed
tourists (42 per cent) belonged to income group of Rs.
5 lakh to 10 lakh followed by 26.5 per cent in the
income group of 10-15 lakh. It was found that 17 per
cent of them belonged to income group of 20 lakh and
above.
TOURISTS’ TRAVEL CHOICE AND
EXPENDITURE PATTERN Travel Choice
The travel choice of tourists is presented as follows:
Sources of origin: The study examined the sources of
tourists arrivals in the State. It is important to know the
sources of origin of tourists for the purpose of
developing services and facilities keeping in view the
region specific food habits and other needs. The source
of origin of surveyed domestic tourists was analysed to
examine the States from which tourists prefer to visit
the destination. From the survey, it was found that the
tourists came to visit Arunachal Pradesh from almost
all the States of India. However, it was found that
majority of them were from West Bengal (53 per cent),
followed by Maharashtra (13.5 per cent), Assam (10
per cent). The details are given in the Table 7.

SJIF Impact Factor 2021: 8.013| ISI I.F.Value:1.241| Journal DOI: 10.36713/epra2016 ISSN: 2455-7838(Online)
EPRA International Journal of Research and Development (IJRD) Volume: 6 | Issue: 8 | August 2021 - Peer Reviewed Journal
2021 EPRA IJRD | Journal DOI: https://doi.org/10.36713/epra2016 | www.eprajournals.com |57 |
Table 7: Distribution of Domestic Tourists by State of Origin
State Percentage of tourist
West Bengal 53.0
Maharashtra 13.5
Assam 10.0
New Delhi 3.5
Rajasthan 3.5
Others 16.5
Source: Field Survey 2020
It was observed that most of the visitors were basically
from plain States. They were visiting in large
proportion mainly to enjoy natural beauty, pleasant
climate in the hills, experience snowfall and to visit
Indo-China border (Bumla border).
Purpose of visit: Tourists visit a destination with
various purposes. The study of purpose of visit of the
tourists can provide information about the purpose of
visit of tourists and can help in formulating policies to
develop facilities for enhancing their satisfaction level.
The main purpose of visit of the surveyed tourists is
presented in the Table 8.
Table 8: Distribution of Surveyed Tourists by main Purpose of Visit
Purpose of visit Percentage of tourists
Recreation/natural beauty 74.7
Know people and their culture 12.9
Adventure tourism 4.7
Educational value 2.9
Religious purpose 1.8
Any other purpose 2.9
Total 100.0
Source: Field Survey 2020
The Table 8 shows that most of the domestic tourists
(74.5 per cent) were visiting the State for
recreation/enjoy natural beauty. They were mainly
interested in enjoying natural beauty and recreation.
Only a small proportion of domestic tourists visited for
any other purpose which includes mainly official and
business visits.
Companion: Tourists, usually, travel to a destination in
different types of companion or group. The
classification of the surveyed tourists by the type of
group in which they were travelling revealed that most
of the surveyed tourists (were travelling with their own
family members. The details are given in the Table 9.
Table 9: Distribution of Surveyed Tourists by Type of Group
Types of group Percentage of tourists
Single person
4.0
Couple
0.00
With own family members 51.5
In a group of more than one family 28.0
In a group of friends without family 13.0
Total 100.00
Source: Field Survey, 2020
SJIF Impact Factor 2021: 8.013| ISI I.F.Value:1.241| Journal DOI: 10.36713/epra2016 ISSN: 2455-7838(Online)
EPRA International Journal of Research and Development (IJRD) Volume: 6 | Issue: 8 | August 2021 - Peer Reviewed Journal
2021 EPRA IJRD | Journal DOI: https://doi.org/10.36713/epra2016 | www.eprajournals.com |58 |
It was found that most of the domestic tourists (79.5
per cent) were travelling with family members. They
were travelling with their own family members (51.5
per cent) or in a group of more than one family (28 per
cent). Only a few surveyed domestic tourists (4 per
cent) were travelling alone. The analysis shows that
most of the tourists prefer to travel to the destination in
a group of one of more family. The average size of
group of domestic tourist was 6 persons. Hence, there
is a need to develop facilities to meet the requirement
of family oriented tourists.
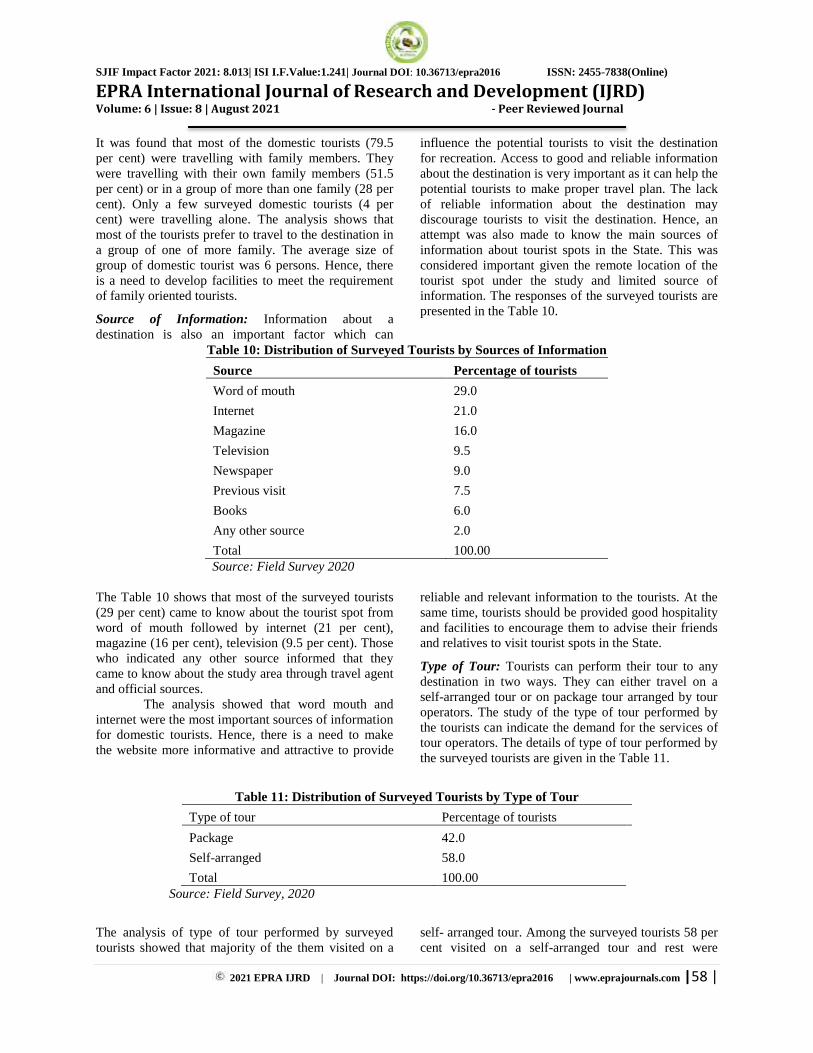
Source of Information: Information about a
destination is also an important factor which can
influence the potential tourists to visit the destination
for recreation. Access to good and reliable information
about the destination is very important as it can help the
potential tourists to make proper travel plan. The lack
of reliable information about the destination may
discourage tourists to visit the destination. Hence, an
attempt was also made to know the main sources of
information about tourist spots in the State. This was
considered important given the remote location of the
tourist spot under the study and limited source of
information. The responses of the surveyed tourists are
presented in the Table 10.
Table 10: Distribution of Surveyed Tourists by Sources of Information
Source Percentage of tourists
Word of mouth 29.0
Internet 21.0
Magazine 16.0
Television 9.5
Newspaper 9.0
Previous visit 7.5
Books 6.0
Any other source 2.0
Total 100.00
Source: Field Survey 2020
The Table 10 shows that most of the surveyed tourists
(29 per cent) came to know about the tourist spot from
word of mouth followed by internet (21 per cent),
magazine (16 per cent), television (9.5 per cent). Those
who indicated any other source informed that they
came to know about the study area through travel agent
and official sources.
The analysis showed that word mouth and
internet were the most important sources of information
for domestic tourists. Hence, there is a need to make
the website more informative and attractive to provide
reliable and relevant information to the tourists. At the
same time, tourists should be provided good hospitality
and facilities to encourage them to advise their friends
and relatives to visit tourist spots in the State.
Type of Tour: Tourists can perform their tour to any
destination in two ways. They can either travel on a
self-arranged tour or on package tour arranged by tour
operators. The study of the type of tour performed by
the tourists can indicate the demand for the services of
tour operators. The details of type of tour performed by
the surveyed tourists are given in the Table 11.
Table 11: Distribution of Surveyed Tourists by Type of Tour
Type of tour Percentage of tourists
Package 42.0
Self-arranged 58.0
Total 100.00
Source: Field Survey, 2020
The analysis of type of tour performed by surveyed
tourists showed that majority of the them visited on a
self- arranged tour. Among the surveyed tourists 58 per
cent visited on a self-arranged tour and rest were

SJIF Impact Factor 2021: 8.013| ISI I.F.Value:1.241| Journal DOI: 10.36713/epra2016 ISSN: 2455-7838(Online)
EPRA International Journal of Research and Development (IJRD) Volume: 6 | Issue: 8 | August 2021 - Peer Reviewed Journal
2021 EPRA IJRD | Journal DOI: https://doi.org/10.36713/epra2016 | www.eprajournals.com |59 |
visiting on package tour. This indicated growing
demand for the services of tour operators. Hence, there
is a need to improve the efficiency of the tour operator
services to increase their demand and enhance income
and employment.
Frequency of visit: The frequency of visit of tourists
shows that ability of a destination to attract the visitors.
From the survey, it was found that most of the surveyed
tourists were visiting for the first time in the tourist spot
under the study. This is expected as the spot has a
remote location. The details are given in the Table 12.
Table 12: Distribution of Surveyed Tourists by Frequency of Visit
Frequency Percentage of tourists
First 87.0
More than Once 13.0
Total 100.00
Source: Field Survey 2020
It was found that 87 per cent of the surveyed tourists
were visiting for the first time. It found that 13 per cent
of the surveyed tourists visited the spot more than once.
This is due to that fact that the tourist spot is located in
a remote district of the State.
Length of stay: The study also attempted to analyse the
length of stay of the surveyed tourists. The length of
stay of tourists in a destination can be taken as an
indicator of the demand for tourism. The longer length
of stay generally leads to more spending of tourists and
greater economic impact of local economy. However,
length of stay depends on various factors such as
income level, family size, purpose of visit, and
availability of recreational facilities in the destination
and so on. The length of stay of surveyed tourists in
Tawang is given in the Table 13.
Table 13: Length of Stay of Surveyed Tourists
Length of stay (in days) Percentage of tourists
Less than 5 58.0
5-10 34.0
Above 10 7.5
Total 100.00
Source: Field Survey, 2020
It was found that most of the tourists stayed in the
destination for less than 5 days. A high percentage of
tourists (58 per cent) stayed in the destination for less
than 5 days and 34 per cent of them stayed for 5 to 10
days. Only 7.5 per cent of the tourists stayed for more
than 10 days. The average length of stays of the
surveyed tourist 4.34
The above analysis and discussion shows that
most of the surveyed tourists were visiting the
destination for recreation and enjoy natural beauty.
They were extremely mesmerised by scenic natural
beauty of the Lake. This fact shows that there is a good
potential market for ecotourism in the Lake and in
Tawang. However, there is a need for formulating
proper policies and guidelines so as to avert damages to
natural environment. The analysis showed that most of
the domestic tourists were from West Bengal,
Maharashtra and Assam. The domestic tourists were
visiting for recreation and enjoy natural beauty and to
know people and their rich culture. Hence, there is a
need develop various facilities recreational activities
and also for displaying local culture.
Expenditure Pattern of Tourists
The expenditure pattern of tourists shows their demand
for various products and services. This information can
be important for policy making purpose. Hence, the
study examined the expenditure pattern of the surveyed
tourists in the study area. The expenditure pattern of the
surveyed tourists is shown in the Figure 2.

SJIF Impact Factor 2021: 8.013| ISI I.F.Value:1.241| Journal DOI: 10.36713/epra2016 ISSN: 2455-7838(Online)
EPRA International Journal of Research and Development (IJRD) Volume: 6 | Issue: 8 | August 2021 - Peer Reviewed Journal
2021 EPRA IJRD | Journal DOI: https://doi.org/10.36713/epra2016 | www.eprajournals.com |60 |
Figure 2: Expenditure pattern of surveyed tourists (in percentage)
It was found that tourists incur expenditure on
various services and goods in Tawang. The analysis of
the expenditure pattern of the tourists showed that the
surveyed tourists incurred the highest expenditure on
accommodation (Figure 2). The share of
accommodation in total expenditure of tourists was 36
per cent followed by local transport (33 per cent) and
food and beverages (27 per cent). It was found that the
surveyed tourists spent 4 per cent of total expenditure
on purchasing souvenirs (mainly handloom and
handicraft products) which is a low share as compared
to other hill stations where handicrafts/souvenirs
accounts for more than 10 per cent of tourist
expenditure. In Sikkim, shopping accounted for 22.7
per cent of tourist spending (GoI, 2012). In Guatemala,
handicrafts /souvenirs accounted for 20 per cent of
tourist expenditure (Foam and Franco (2008). The
tourists‟ expenditure pattern indicates that
accommodation, transport service providers and food
and beverages establishment receive significant
benefits from tourism in Tawang. Benefit to the
accommodation providers is obvious as almost all
tourists stay in hotels and lodges during their trip. The
fairly high share of local transport can be attributed to
the recent rules made by the local people of the area
which require tourists to hire local taxis for sites seeing
purpose. Tourists are not allowed to use their own
vehicles or vehicles hired from outsides to go for site
seeing. Relatively low share of food and beverage in
total expenditure is mainly because of the fact that most
of the Indian tourists travel in a group and they carry
their own kitchen along in their vehicles. The low share
of souvenirs in total tourist expenditure can be ascribed
to high price due to limited availability of such
products. Hence, there is a need to focus on producing
varied and attractive local handicraft products to
enhance income and employment generation in local
area.
CHALLENGES OF ECOTOURISM IN
TAWANG The challenges of ecotourism development in Tawang
have been identified as follows:
Transportation Problem: Tawang is a remote district
of India and its tourist spots are inaccessibility due to
poor road network. It is relatively backward in terms of
infrastructural facilities. It is connected to rest of the
world only by road (National Highway 13). The road
communication remains affected during summer due to
heavy monsoon rainfall and during winter heavy
snowfall disrupts road network. There is no railway
link. However, it is connected by helicopter service
from a few selected towns/cities like Guwahati and
Itanagar. But the frequency of the service is limited.
Inadequate Infrastructure: Inadequate infrastructure
is one of the most important cause of
underdevelopment of tourism (Bhatia, 1997). Tourism
infrastructure includes, good accommodation facilities,
better sanitary facilities and amenities for recreational
activities, proper human resources. In Tawang, a good
number of hotels and lodges have come up in response
to growing tourists demand, but standard of services
provided by the tourist lodges are also found to be
below the satisfaction level of tourists and room rents
are relatively high. Further, there are very few
Souvenirs 4 %
Accommodation 36 %
Food and Beverages
27 %
Local Transport
33 %

SJIF Impact Factor 2021: 8.013| ISI I.F.Value:1.241| Journal DOI: 10.36713/epra2016 ISSN: 2455-7838(Online)
EPRA International Journal of Research and Development (IJRD) Volume: 6 | Issue: 8 | August 2021 - Peer Reviewed Journal
2021 EPRA IJRD | Journal DOI: https://doi.org/10.36713/epra2016 | www.eprajournals.com |61 |
amenities for recreational activities. There is only one
cable car in Tawang which also often remains defunct.
Climatic Constraints: The climatic condition of
Tawang is extremely cool during winter, particularly
from December to February. During these months,
temperature goes below zero degree. Heavy snowfall
which occurs during December to February causes
disruption in road network and acts as a natural barrier
for tourists. During the rainy season, June to August,
the entire area receives heavy monsoon rainfall which
leads to landslides and road blockades. This serves as a
disincentive for potential tourists to visit the spot
during these months. Hence, the tourist inflow is
confined only during September to November and
March to May.
Institutional Constraints: Arunachal Pradesh, due to
its strategic location, has been designated as a restricted
area. The main institutional constraints are the
provision of Inner Line Permit (ILP) and Protected
Area Permit (PAP). Domestic tourists are required to
obtain ILP and foreign tourists are to obtain PAP to
enter the State. PAP is issued by Ministry of Home
Affairs, Government of India. PAP is issued only to
those foreign tourists who visit in a group of three or
more persons for a maximum period of thirty days.
Tourists opined that obtaining PAP is difficult and time
consuming. This acts as a disincentive for the potential
tourists intending to visit Arunachal Pradesh. Further,
in Tawang, foreign tourists are not allowed to visit
places of interest located near the border.
Socio-political Disturbances: Socio-political
disturbances in the State as well as in the neighbouring
State also affects tourism development in Tawang.
Such disturbances act as a psychological barrier for
potential tourists (Mitra and Lama, 2013). Tawang is a
peaceful place but it is connected to rest of the world
through Assam. The frequent strike (Bandh call) by
different organizations in Assam restricts the
movement of vehicles to the State. At the same time,
number of bandh call within the State has increased in
recent years. For instance, the strike called by some
organizations against PRC issue in February, 2020
continued for many days and caused fear psychosis
among the public with massive destruction of public
properties in the State capital. These disturbances cause
psychological impact on potential tourists and lead to
diversion of tourists to other hill destinations like
Shillong, Gangtok, Darjeeling etc.
CONCLUSION On the basis of above discussion and findings, it can be
concluded that Tawang has huge potentials for
development of ecotourism. Its landscape is quite
fascinating with presence of numerous snow-capped
mountain peaks, passes, lakes, rivers and alpine
vegetations. It is also rich in cultural heritage and
historical sites. Tawang came to the limelight after the
filming of some scenes of Bollywood movie Koyla in
1996. Since, then this remote destination has been
attracting a growing number of tourists from different
parts of the country and the world. However, the inflow
of tourists in Tawang has been fluctuating which can be
attributed to emergence of other destinations as well as
socio-political disturbances. The CAGR of tourist
inflow in Tawang during the period 2010 to 2016 was
only 3.36 per cent. Tawang‟s share in total tourist
arrivals in the State has declined over the years from
9.34 per cent in 2010 to 5.68 per cent in 2016. This
shows that Tawang is losing its competitive position.
The study of socio-economic characteristics showed
that most of the tourists male. The tourists were
travelling in a group of one or more families consisting
of male, female and children which implies that there is
a need to develop way side sanitary facilities and
develop amusement park with all facilities. It was
observed that more than per cent of the tourists were
below 45 years. Educational level of tourists showed
that majority of the surveyed tourists were graduates
followed by post graduates and above. The study of the
occupational category of the surveyed tourists revealed
that most of them were salaried employees, self-
employed and professional/consultant.
The analysis of travel choice of the tourists
revealed that majority of tourists were from West
Bengal, Maharashtra and Assam and most of them
were visiting to enjoy natural beauty. In case of source
of information, it was found that most of the tourists
came to know about the tourist spot from word of
mouth, internet, magazine and television. The analysis
of type of tour performed by surveyed tourists showed
that majority of the them visited on a self- arranged
tour. Frequency of visit showed that most of the tourists
were visiting the destination for the first time which
can be attributed to its remote location. The length of
stay of tourists revealed that a high percentage of
tourists stayed in the destination for less than 5 days.
The expenditure pattern of the tourists showed that
accommodation accounted for the highest share in total
expenditure. It was observed that tourists spent only 4
per cent of total expenditure on purchasing souvenirs
(mainly handloom and handicraft products).

SJIF Impact Factor 2021: 8.013| ISI I.F.Value:1.241| Journal DOI: 10.36713/epra2016 ISSN: 2455-7838(Online)
EPRA International Journal of Research and Development (IJRD) Volume: 6 | Issue: 8 | August 2021 - Peer Reviewed Journal
2021 EPRA IJRD | Journal DOI: https://doi.org/10.36713/epra2016 | www.eprajournals.com |62 |
The following policy suggestions can be made
for promoting ecotourism development in Tawang; The
policy should focus on improving connectivity and
recreational facilities at Tawang. There is a need to
focus on producing varied and attractive local
handicraft products to enhance income and
employment generation in local area. The various
stakeholders should be sensitized to improve the
quality of services to maintain the competitiveness of
the destination as word of mouth was the source of
information for majority of the tourists. There is a need
to invest more in maintaining clean and green
environment as tourists were visiting mainly to enjoy
natural beauty.
Acknowledgement: This article is based on the minor
research project funded by Indian Council of Social
Science Research (ICSSR), New Delhi. The author
would like to acknowledge the financial support of
ICSSR, New Delhi.
REFERENCES 1. Boo, E. (1990): Ecotourism: The Potential and
Pitfalls, World Wildlife Fund.
2. Bhatia, A. K. (1997): International Tourism:
Fundamentals and Problems, Sterling Publishers,
New Delhi.
3. Brandon, K. and R. Margoluis (1996): ‘The
Ecotourism Equation: Measuring the Impacts’,
Bulletin 99, Yale School of Forestry and
Environmental Studies.
4. Foam, L. and R. Franco (2008), Measuring the
Local Economic Impact of Tourism, The SEEP
Network, Washington DC, USA.
5. Government of Arunachal Pradesh (2011): Census
of India 2011: Provisional Population Totals,
Arunachal Pradesh, Directorate of Census
Operations, Arunachal Pradesh.
6. Government of Arunachal Pradesh (2019): Tourism
Statistics, Directorate of Tourism, Itanagar,
Government of Arunachal Pradesh.
7. Government of India (2012): Tourism Survey for
the State of Sikkim, Ministry of Tourism,
Government of India.
8. Mitra, A. and M. lama (2013): Tourism
Development in a Remote State: A Case Study of
Arunachal Pradesh, India, in Tisdell, C. A. (ed.),
Handbook of Tourism Economics: Analysis, New
Applications and Case Studies, World Scientific
Publications, Singapore.
9. Rina, T. (2019). Black-necked Crane Arrives in
Nyamjang Chhu, The Arubachal Times, December
27, 2019.
10. Singh, S.(2016). Tourism in North East India,
Vandana Publications, New Delhi.
11. Tisdell, C. A. (2001): Tourism, Economics, the
Environment and Development: Analysis and
Policy, Edward Elgar, Cheltenham, UK.
12. Vijayakumar, B. (2005): ‘Ecotourism: Concepts
and Issues’, in Sarngadharan, M. and G. Raju
(eds.), Tourism and Sustainable Economic
Development: Indian and Global Perspectives, New
Century Publications, New Delhi, pp. 69-82.
13. Western, D. (1993): ‘Defining Ecotourism’, in K.
Lindberg and D. E. Hawkins (Eds.), Ecotourism: A
guide for Planners and Managers, North
Bennington, VT: The Ecotourism Society, pp. 7-11.
14. Whelan, T. (1991): Nature Tourism – Managing for
the Environment, Island Press, New York.