ectomycorrhizal dynamics of white fir stands at teakettle a.d. izzo and t.d. bruns plant and...
Post on 20-Dec-2015
215 views
TRANSCRIPT
Ectomycorrhizal dynamics of white fir stands at Teakettle
A.D. Izzo and T.D. BrunsPlant and Microbial BiologyUniversity of California, Berkeley


Questions
• what is the community structure of ectomycorrhizal fungi associated with white fir?
• how does species richness and diversity change following fire/thinning?
• what is the role of the spore bank in these scenarios?
• how does the spore bank respond to heat/ash?
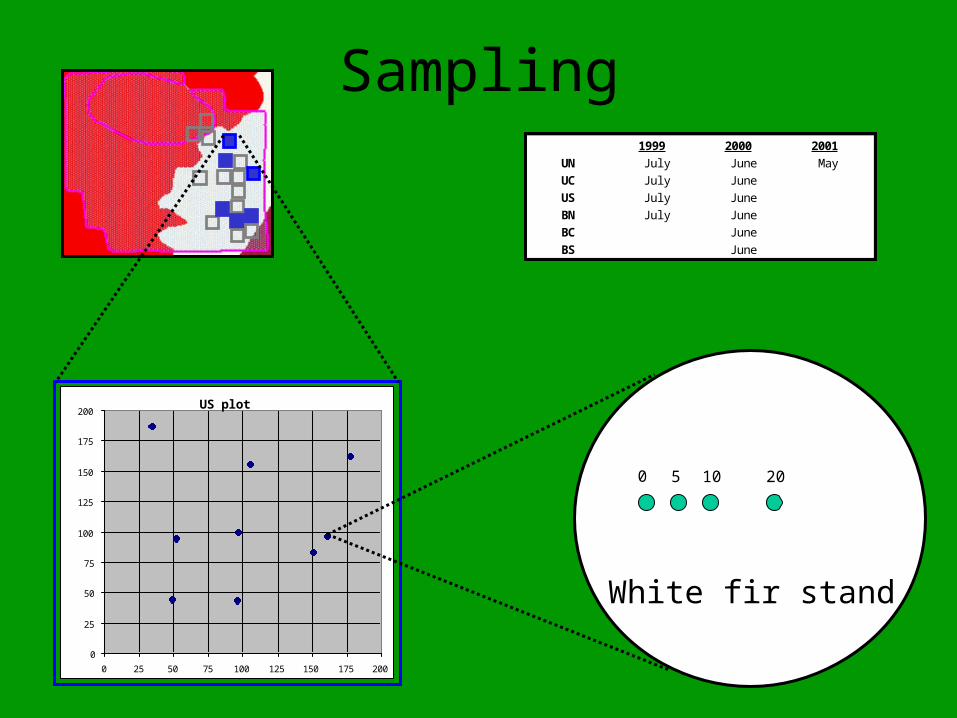
Sampling
US plot
0
25
50
75
100
125
150
175
200
0 25 50 75 100 125 150 175 200
0 5 10 20
White fir stand
1999 2000 2001UN July June MayUC July JuneUS July JuneBN July JuneBC JuneBS June

Techniques: RFLP matching
ID of root tips by RFLP matches
separate morphotypesfreeze dry, weigh
PCR RFLP
DNA sequence (ITS)
PCR RFLPmatch
Species ID
Taxonomic ID (Phylum, “Family”, Genus, RFLP taxon)
ITS1F
ITS4
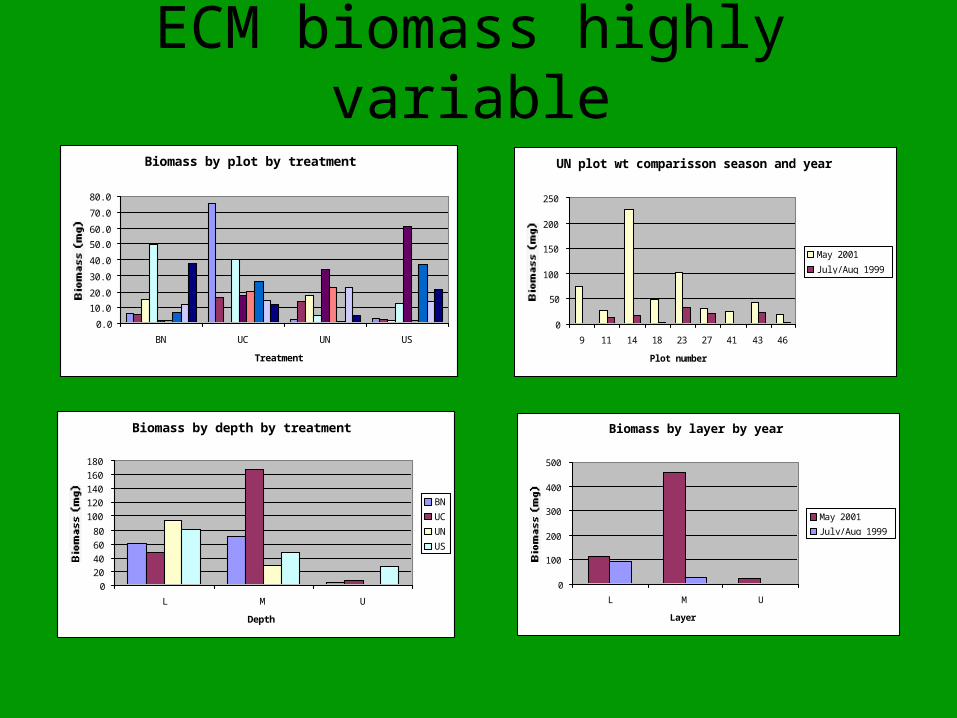
Biomass by plot by treatment
0.0
10.0
20.0
30.0
40.0
50.0
60.0
70.0
80.0
BN UC UN US
Treatment
Biomass by depth by treatment
020406080
100120140160180
L M U
Depth
BN
UC
UN
US
UN plot wt comparisson season and year
0
50
100
150
200
250
9 11 14 18 23 27 41 43 46
Plot number
May 2001
July/Aug 1999
Biomass by layer by year
0
100
200
300
400
500
L M U
Layer
May 2001
July/Aug 1999
ECM biomass highly variable

0%
10%
20%
30%
40%
50%
60%
70%
80%
90%
100%
phylum class family genus TOT spp biomass
Tota
l R
el
Ab
un
dan
ce
BN UC UN US
Agaricales
Russulaceae
Cortinariaceae
Pezizales Otideaceae Wilcoxina
Cortinarius
Russula
Cortinarioid1
Russuloid1
Thelephoroid2
Cencococcum
Wilcoxina1
BK
AB
Basidio18
Basidiomycete
Ascomycete
Cencococcum3
Piloderma2Piloderma
RFLP-taxon

0.00
0.02
0.04
0.06
0.08
0.10
0.12
0.14
0.16
0.18
Cenoc
occu
m
Wilc
oxina
taxo
n3
taxo
n4
taxo
n5
taxo
n6
taxo
n7
taxo
n8
Spring 2001
Summer 1999
Note minimal temporal similarity
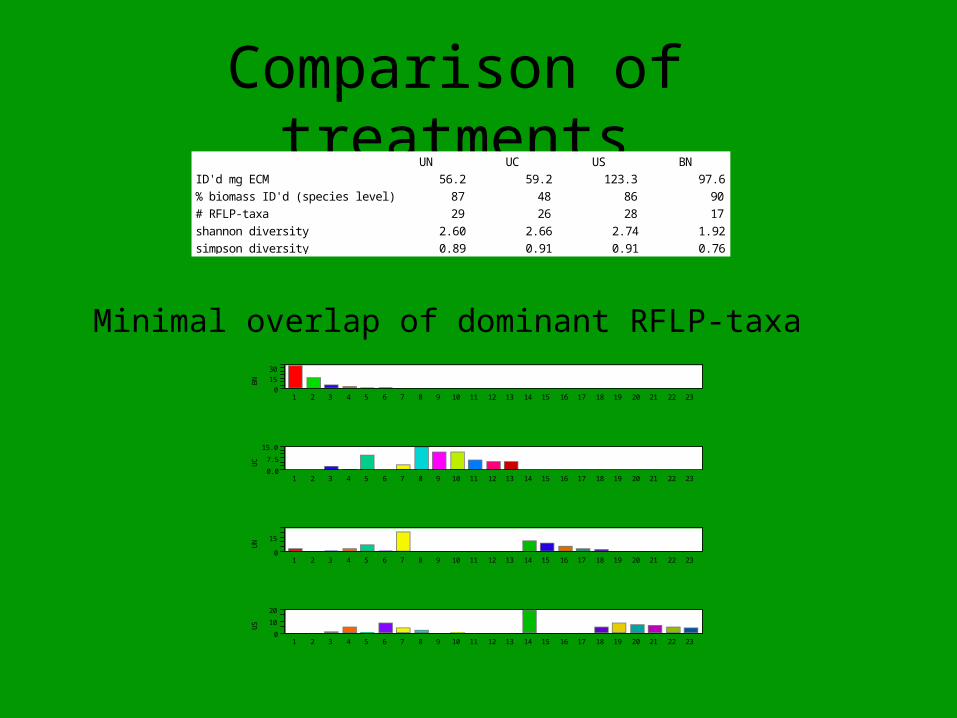
Comparison of treatmentsUN UC US BN
ID'd mg ECM 56.2 59.2 123.3 97.6% biomass ID'd (species level) 87 48 86 90# RFLP-taxa 29 26 28 17shannon diversity 2.60 2.66 2.74 1.92simpson diversity 0.89 0.91 0.91 0.76
BN
01530
1 2 3 4 5 6 7 8 9 10 11 12 13 14 15 16 17 18 19 20 21 22 23
UC
0.0
7.5
15.0
1 2 3 4 5 6 7 8 9 10 11 12 13 14 15 16 17 18 19 20 21 22 23
UN
0
15
1 2 3 4 5 6 7 8 9 10 11 12 13 14 15 16 17 18 19 20 21 22 23
US
0
10
20
1 2 3 4 5 6 7 8 9 10 11 12 13 14 15 16 17 18 19 20 21 22 23
Minimal overlap of dominant RFLP-taxa

Family-level comparisonB
N
0
30
60
1 2 3 4 5 6 7
UC
0
30
1 2 3 4 5 6 7
UN
0
15
30
1 2 3 4 5 6 7
US
0
30
60
1 2 3 4 5 6 7
TK99
0
0.1
0.2
0.3
0.4
0.5
0.6
Ru
ssu
loid
Co
rtin
ari
od
Ce
no
cocc
um
Wil
coxi
na
The
lep
ho
roid
Go
mp
ho
id
Tric
ho
lom
ato
id
UN
K
rela
tive a
bundance
TK01
TK99
TK01/99 (2 yrs)

Importance - all plotstop 75% importance shown
0.00
0.02
0.04
0.06
0.08
0.10
0.12
0.14
0.16
0.18W
ilco
xin
a1
Ru
ssu
loid
1
Ce
no
cocc
um
1
BK
Ce
no
cocc
um
3
BL K
BJ
Co
rt4
The
lep
ho
roid
2
BC
AB
Asc
o1
Lact
ari
us5
Co
rtin
ari
us1
Co
rt2
Phia
lop
ho
ra2
Ru
ssu
la7 B
Lact
ari
us3
Ru
ssu
la2
Ce
no
cocc
um
2
Ga
uti
eri
a1
Phia
loce
ph
ala
1
Wil
coxi
na
3
Ru
ssu
loid
2
Lact
ari
us2 AD
Tric
ho
lom
a1
Ru
ssu
la3
Lact
ari
us1 AN
Wil
coxi
na
2
RFLP taxon
import
ance
* 2
% biomass
% freq
All taxa included

1
2
3
ECM “islands of dominance”

Additional studies Spatial bioassays
- soils from all 54 plots pre-treatment
- ABCO, PIJE, ABCO + PIJE
Heat and Ash bioassays
Pooled soil from 7-8 mature white fir stands across Teakettle
C, 40, 55, 70 deg C, ash
ABCO, PIJE
Soil heating rates
0
10
20
30
40
50
60
70
80
-25 25 75 125 175
Time (min)

Acknowledgements
Collectors 1999/2001Martin BidartondoRyan BowmanFrancisco CamachoLisa GrubishaErik Lilleskov
Molecular analysisJosephine Agbowo
Bioassay setupKari Cheng
FundingUSDA, PMB dept