ed 333 050 tm 016 648
TRANSCRIPT
DOCUMENT RESUME
ED 333 050 TM 016 648
AUTHOR Kim, Seock-Ho; Cohen, Allan S.TITLE Effects of Linking Methods On Detection of DIF.PUB DATE Apr 91NOTE 33p.; Paper presented at the Annual Meeting of the
National Council On Measurement in Education(Chicago, IL, April 4-6, 1991).
PUB TYPE Reports - Evaluative/Feasibility (142) --Speeches/Conference Papers (150)
EDRS PRICE MF01/PCO2 Plus Postage.DESCRIPTORS Chi Square; Comparative Analysis; Equations
(Mathematics); Estimation (Mathematics); 'EvaluationMethods; *Item Bias; Item Response Theory;*Mathematical Models; 'Sample Size; Simulation
IDENTIFIERS Item Characteristic Function; Item Parameters;'Linking Metrics
ABSTRACT
Studies of differential item functioning (DIF) underitem response theory require that item parameter estimates be placedon the same metric before comparisons can be made. Evidence thatmethods for linking metrics may be influenced by the presence ofdifferentially functioning items has been inconsistent. The effectsof three methods for linking mltrics on detection of DIF werestudied. The methods included: (1) a weighted mean and sigma method;(2) the test characteristic curve method; and (3) the minimumchi-square method. Both iterative and non-iterative linkingprocedures were compared for each met'iod. A two-parameter logisticitem characteristic model was used to generate eight simulated datasets. A 60-item test and sample sizes of 300 and 600 were generatedfor each data set. Results indicate that detection of DIF followinglinking via the test characteristic curve method gave the mostaccurate results when the sample size was small. When the sample sizewas large, results for the three methods were essentially the same.Iterative linking provided a substantial improvement in detection ofDIF over non-iterative linking. A 28-item list of references isincluded. Seven tables present study findings, and an appendixsummarizes the three methods. (Author/SLD)
***********************************************************************Reproductions supplied by EDRS are the best that can be made
from the original document.***** ***** *************************************************************

112eztl
U.S. DEPARTMENT Of EDUCATIONOleo* 01 Educatoonai Peewee. end Improvement
EDUCATIONAL RESOURCES INFORMATIONCENTER (ERIC)
Vii(tAdi aocument Aas been reproducod $ofCfmed trOrn MS ',town Or Ofeent taboo,originating itMinor changes have been made to ImproverevrdCtsOn gusIgtV
POirit Ot vlVs Of opinions *toted in trim d0CuMIMI do not nCesalirily mpresent "cmOERI posit.on or 0011Cy
"PERMISSION TO REPRODUCE THISMATERIAL HAS BEEN GRANTED BY
Scoek-
TO THE EDUCATIONAL RESOURCESINFORMATION CENTER (ERIC1-
Effects of Linking Methods on Detection of DIF
Seock-Ho Kim and Allan S. Cohen
University of Wisconsin-Madison
Paper presented at the annual meeting of the National Council on
Meazurement in Education, Chicago, IL
April, 1991
Running Head: EFFECTS OF LINKING METHODS
REST COPY AVAILABLE
44.

EFFECTS OF LINKING METHODS 2
Abstract
Studies of differential item functioning under item response theory re-
quire that item parameter estimates be placed on the same metric before
comparisons can be made. Evidence that methods for linking metrics may
be influenced by the presence of differentially functioning items has shown in-
consistent findings. The present study compared the effects of three methods
for linking metrics, a weighted mean and sigma method, the test character-
istic curve method, and the minimum chi-square method, on detection of
differential item functioning. Both iterative and noniterative linking pro-
cedures were compared for each method. Rtsults indicated that detection
of differentially functioning items following linking via the test characteristic
curve method gave the most accurate results when the sample size was small.
When the sample size was large, results for the three linking methods were
essentially the same. Iterative linking provided a substantial improvement in
detection of differentially functioning items over noniterative linking.
Index terms: differential item functioning, equating, item response theory,
iterative linking, linking metrics.
EFFECTS OF LINKING METHODS 3
Effeet 4.1f Linking Methods on Detection of DIF
Studies of differential item functioning (DIF) under item response the-ory (IRT) require that item parameter estimates obtained on the same itembut from different samples of examinees are expressed in the same metric.
Current item parameter estimation methods yield metrics which are uniqueonly up to a linear transformation. To link both sets of estimates, that is, toplace them both on the same metric, it is necessary to determine the slope
and intercept of the linear equation required for the transformation. Thepresent investigation was designed to examine the effects of linking methodon detection of DIF under IRT.
Two general classes of linking methods have been developed for this pur-
pore: mean and sigma methods and characteristic curve methods. Mean andsigma methods use the first two moments of the distribution of item diffi-culty estimates to determine the appropriate linear equation (cf., Bejar &Wingersky, 1981; Cook, Eignor, & Hutten, 1979; Linn, Levine, Hasting, &
Wardrop, 1981; Loyd & Hoover, 1980; Marco, 1977; Vale, 1986). One prob-lem with these methods is that they do not use information available from the
estimated item discrimination parameters in obtaining the linking equation.In contrast, characteristic curve methods (cf., Divgi, 1980; Haebara, 1980;Stocking & Lord, 1983) dr) make use of the information available from boththe item discrimination and item difficulty parameters. This second classof methods derives a linking equation by minimizing some measure of the
EFFECTS OF LINKING METHODS 4
difference between the test characteristic curves estimated in each sample.
The minimum chi-square method (Divgi, 1985) is a variation of the charac-
teristic curve method in which the standard errors of the estimates of theitem parameters are included in the linear equation.
Comparisons between the two types of linking methods have not been
conclusive. Stocking and Lord (1983) reported that the characteristic curve
method was more accurate than the robust iterative weighted mean and
sigma method similar to that reported by Linn et al. (1n1). Baker and Al-
Karni (in press), however, noted no differences between the unweighted mean
and sigma method of Loyd and Hoover (1980) and the Stocking and Lord
characteristic curve procedure. Candell and Drasgovi (1988) found that theweighted mean and sigma procedure of Linn et al. (1981) was more accurate
than the characteristic curve method. No studies have yet compared theaccuracy of the minimum chi-square method with these other methods. Since
the minimum chi-square method combines the information used in the mean
and sigma method with that used in the characteristic curve method, one
assumption is that this method will be more accurate than either of the other
two methods alone.
Linking methods may be seriously affected by the presence of D1F items
such that errors in the linking transformation may result in spurious identi-
fication of items as functioning thfferentially (Shepard, Camilli, & Williams,
1984). Lord (1980) outlined the following procedure, suggested by Marco,
5

EFFECTS OF LINKING METHODS 5
for reducing the potential effects of DIF items on parameter estimation and
subsequent detection of DIF:
1. Estimate item parameters for all groups combined, stahiardizing on
item difficulty estimates.
2. Re-estimate item parameters for each group separately holding the
guessing parameters, standardizing on item difficulty estimates.
3. Identify DIF items and remove them.
4. Combine groups and estimate ability for each examinee.
5. Hold ability fixed and re-estimate item difficulty and discrimination for
all items for each group separately.
6. Identify DIF items.
One problem with this approach is that it requires re-estimation of item
and ability parameters. Candell and Drasgow (1988) reported the following
alternative procedure, due to Segall (1983), which is somewhat easier to
implement:
1. Estimate item parameters independently in each group.
2. Link metrics across groups.
3. Estimate DIF indices and remove DIF items.
6

EFFECTS OF LINKING METHODS 6
4. Re link group metrics using only non-DIF items.
5. Re-estimate DIF indices and remove DIF items.
Steps 4 and 5 are continued until either no DIF items are detected or the same
items are identified as DIF items on two successive iterations. The Candell
and Drasgow procedure is somewhat quicker and easier to implement in that
parameters do not have to be re-estimated. This approach to iterative linking
was used in the present study.
The final linking is based only on items which are not identified as DIF
items. Following this linking, DIF indices are then re-estimated for all items.
Clearly, iterative linking is costly, although results indicate that DIF detec-
tion is improved over noniterative linking (Candell & Drasgow, 1988; Candell
& Hu lin, 1986; Drasgow, 1987; Hu lin & Mayer, 1986; Kok, Mellenbergh, &
van der Flier, 1985; van der Flier, Mellenbergh, Ader, & Wijn, 1984).
The present study was designed to compare the effectiveness of three
linking methods on the detection of DIF: (1) the weighted mean and sigma
method (WMS) (Linn et al., 1981); (2) the test characteristic curve method
(TCC) (Stocking & Lord, 1983); and (3) the minimum chi-square method
(MCS) (Divgi, 1985). In addition, the relative contributions of iterative and
noniterative linking to the detection of DIF for different sample sizes were
also examined.
7

EFFECTS OP LINKING METHODS 7
Methods
Data Generation
A two-parameter logistic item characteristic model (2PM) was used to
generate eight simulated data sets using the computer program GENIRV
(Baker, 1978). In this model, the probability of an examinee i giving a
correct response for item j is a functi'an of the discrimination of the item, ai,
the difficulty of the item, bj, and the examinee's unidimensional ability, 9.
This probability is expressed as
131(91) = P(015ai,bi) = (1 + exp{Da;(0; 6AV, (1)
where D is a scaling constant equal to 1 or 1.702. In this study, item and
ability parameters were expressed in the logistic metric (i.e., D = 1).
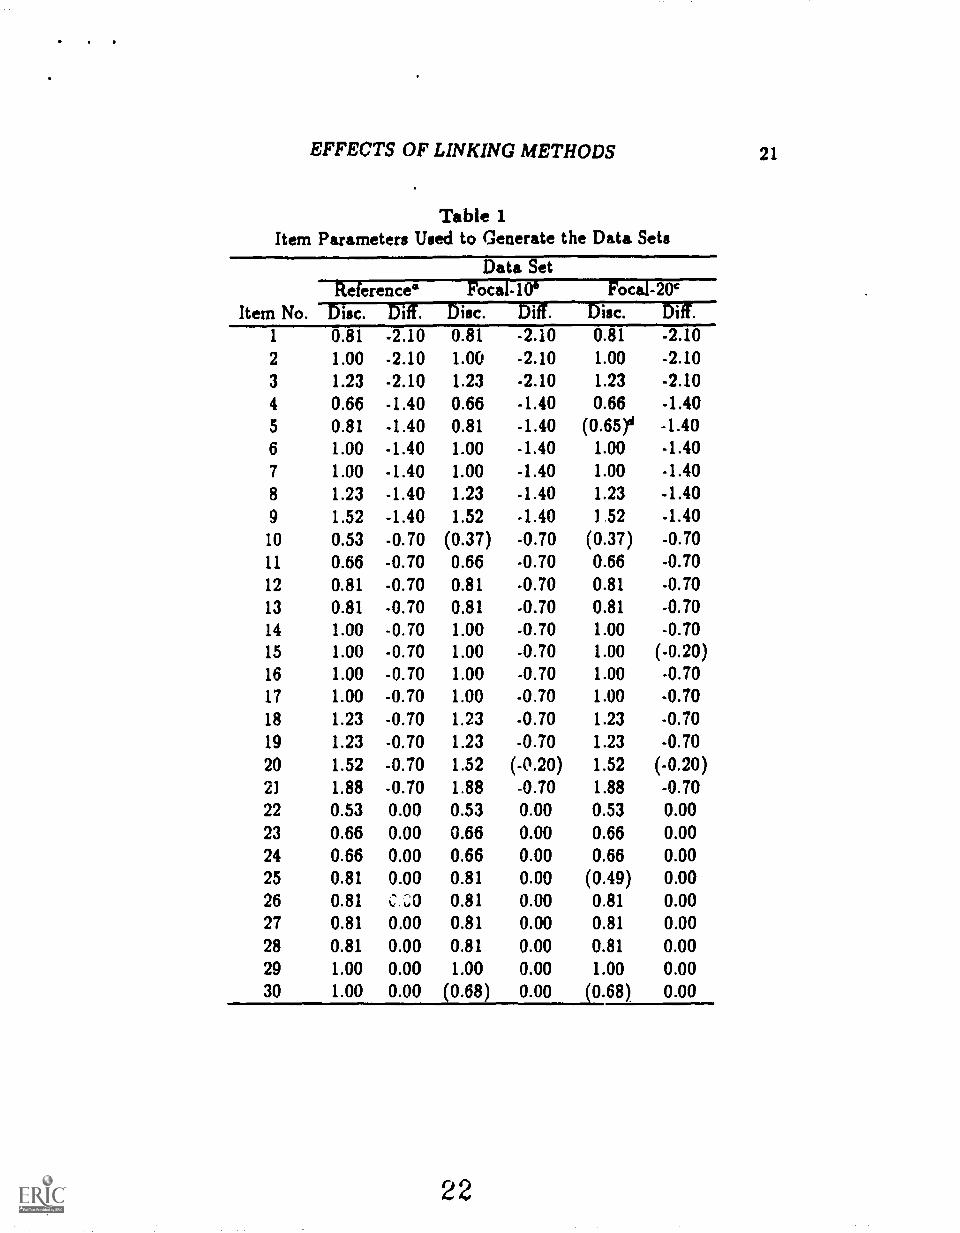
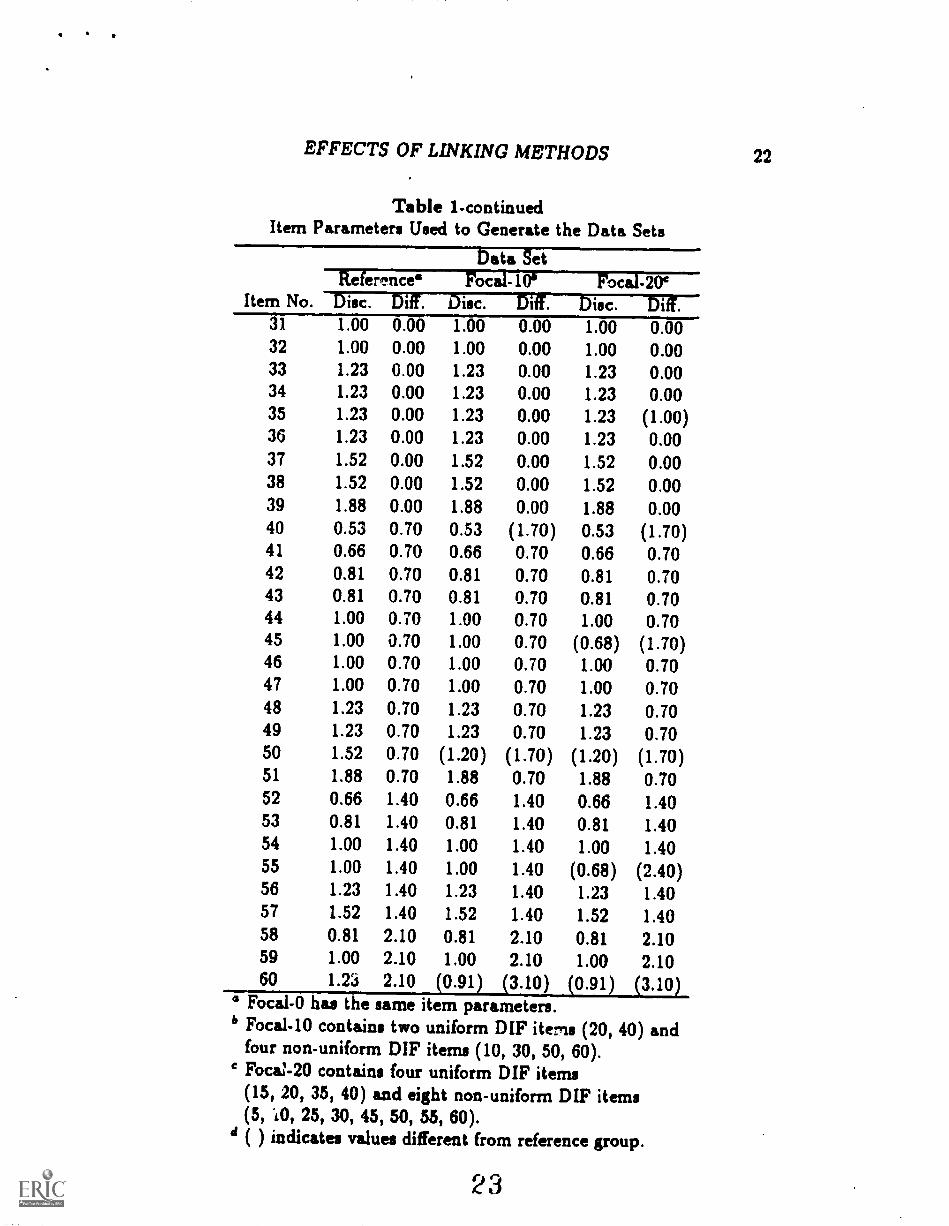
A 60-item test was generated in each data set. Generating parameters for
the underlying ability distributions for both the reference and focal groups
were normal (0, 1). The generated item discrimination parameters were
lognormally distributed (0, .25); that is, log ai was distributed as normal
(0, .25). The generated item difficulty parameters were matched to the 0
distribution and distributed normal (0, 1). Item parameters used to generate
the data sets are given in Table 1.
*************************
Insert Table 1 About Here
*************************
EFFECTS OF LINKING METHODS 8
Hu Ilin, Umiak, and Drasgow (1982) recommend a minimum of 500 exam-
inees for the 2PM. Data sets were generated using two sample sizes, 300 and
600 examinees, to permit a comparison of the effects of sample size. Can-
dell and Drasgow (1988) suggest that the number of DIF items may affect
the metric used for linking. For each sample size, therefore, one reference
group (R.) and three focal groups (F) were generated. Three proportions of
DIF items were used in the simulated tests for the Focal groups: 0 percent
(Focal-0, FO); 10 percent (Focal-10, F10); and 20 percent (Focal-20, F20).
Two types of D1F were simulated in the present study: uniform DIF (for
which aR air and bit 4 bp) and non-uniform DIF (for which aR air and
either bn bp or bn bp).
Parameter Estimation
Item and ability pare meters were estimated via the computer program
BILOG 3 (Mislevy & Bock, 1990). BMOC 3 default conditions implement a
marginal Bayesian estimation (i.e., marginal maximum a posteriori estima-
tion) procedure for the 2PM. Previous research (Mislevy & Bock, 1986; Mis-
levy & Stocking, 1989) has suggested that, when sample sizes are small, the
marginal Bayesian estimation approach appears to provide estimates which
are closer to the underlying values of the generating distributions than those
obtained via other estimation procedures.
Linking Methods
Under the assumption of item parameter invariance, item parameters

EFFECTS OF LINKING METHODS 9
estimated in different groups will differ by a linear transformation from one
group to another. Thus, it is possible to equate the metrics from thesedifferent groups by means of some linear transformation so that between
groups comparisons of parameters can be made.
In the DIF study context, estimates from the calibration of the focal
group are transformed to the metric of the reference group. The transformed
estimates of item discrimination and difficulty parameters for item j are givenby
and
a;p. = aiTIA
= Akar B,
where indicates a transformed value. Further, the estimate of the ability
parameter for examinee i in the focal group can be converted to the reference
group scale using
9:p = AO,p + B. (4)
The task is to determine appropriate coefficients A and B. A brief description
of the three linking methods used in this study for determining these equating
constants is presented in the Appendix.
Iterative Linking
The iterative linking procedure described by Candell and Drasgow (1988)
was used for the present study. Results for the noniterative conditions were
obtained from the first iteration of each linking method.

EFFECTS OF LINKING METHODS 10
Measurement of DIF
A x2 statistic developed by Lord (1980) was used to detect DIF. Lord's
X' simultaneously tests the hypothesis that aj and bi are identical across
groups. This is the same statistic as Q.; which appears in the MCS method.
Evidence has been presented (McLaughlin de Drasgow, 1987) which indicates
that the Type I error rate of this statistic may be seriously viols.ted under
certain conditions. Since the data for this study were simulated, the Type I
error rates could be evaluated.
Results
Recovery of Item and Ability Parameters
A recovery analysis was done to determine the extent to which the gen-
erating parameters were captured in the simulated data sets. The root mean
squared differences (RMSD) and correlations (r) between generating param-
eters and parameter estimates are given in Table 2 for each of the eight data
sets. To assess the adequacy of parameter recovery, the calibrations must
all be transformed to a common metric (Baker SE Al-Karni, in press; Yen,
1987). In the present study, the parameter estimates were transformed to
the underlying metric using the TCC method.
JO* Mit MM. 414 441******
Insert Table 2 About Here
*************************
11
EFFECTS OF LINKING METHODS 11
The RMSDs for the equated values of item difficulty and discriminationin the small sample were larger than those in the larger sample. Recover),as represented by the RMSDs, was better in the larger sample (i.e., 600examinees). The same tendency appeared in the correlations between theitem discrimination estimates and the undtrlying values. The correlationsfor item difficulty and ability showed no differences across all eight datasets. Based on these results, recapture of the underlying item and abilityparameters appeared to be very good.
Detection of DIF
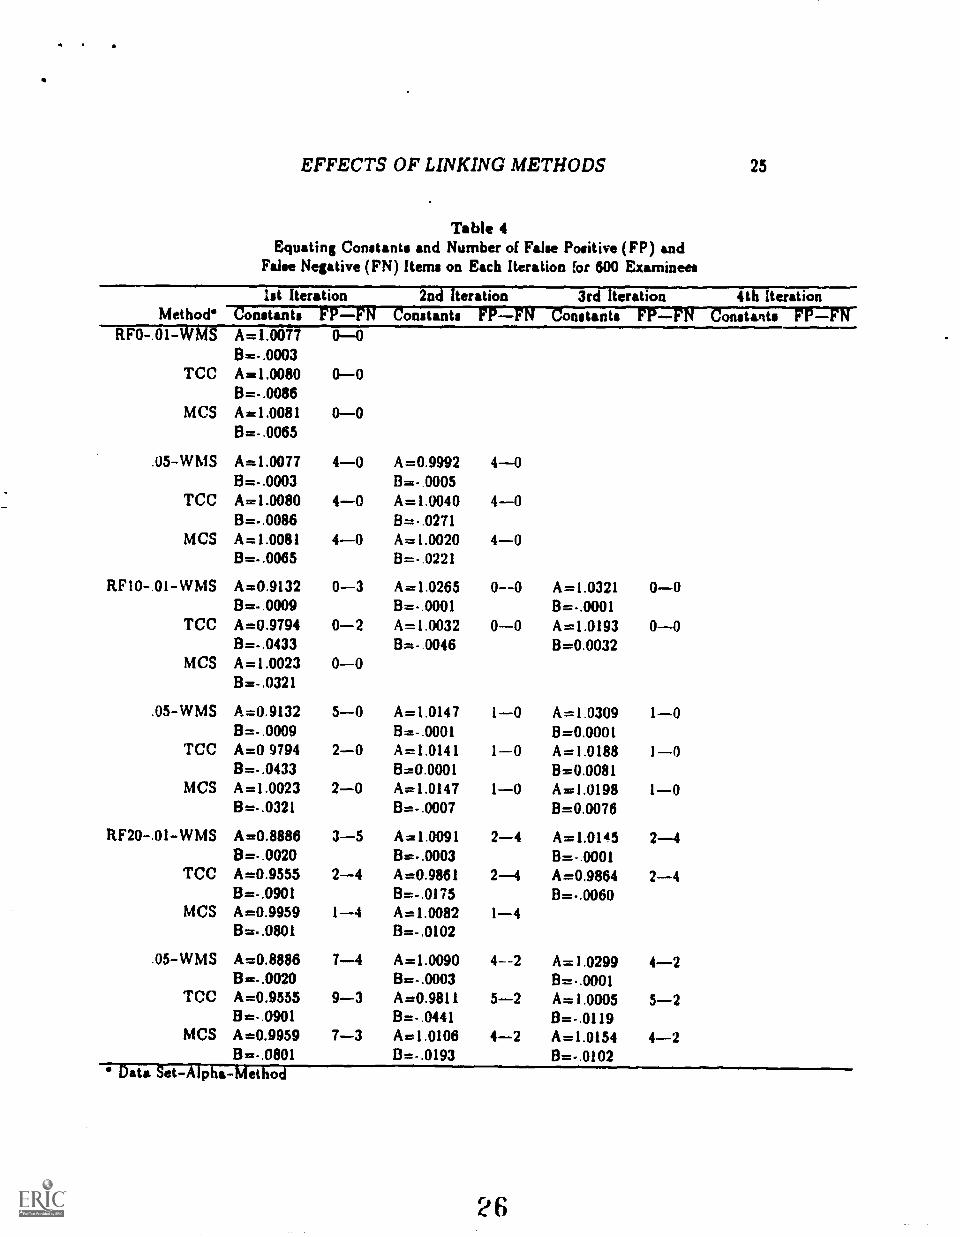
Results of the DIF detection procedures are given in Tables 3 and 4 forthe small and large sample conditions, respectively. The effectiveness of DIFdetection can be seen clearly in the number of false positive (FP) and falsenegative (FN) items identified under each linking method. Results for thesmall sample condition (i.e., 300 examinees) and large sample condition weresirrilar. No FN items were observed under the null condition (i.e., RFO) foreither alpha level. FN identifications (i.e., failures to detect the DIF items)did occur when DIF items were present on the test. Furtheraore, the num-ber of FN identifications increased with an increase in the percentage of DIFitems on the test. The number of FP identifications (i.e., incorrectly identi-fying an item as a D1F item) did not appear to be related to the percentageof DIF items on the test, although it clearly increased as the alpha levelincreased from .01 to .05. Sample size differences were apparent in that the
1 2
EFFECTS OF LINKING METHODS 12
number of FN identifications was lower for the larger sample.
Insert Tables 3 and 4 About Here
.41******************414141414141****4141
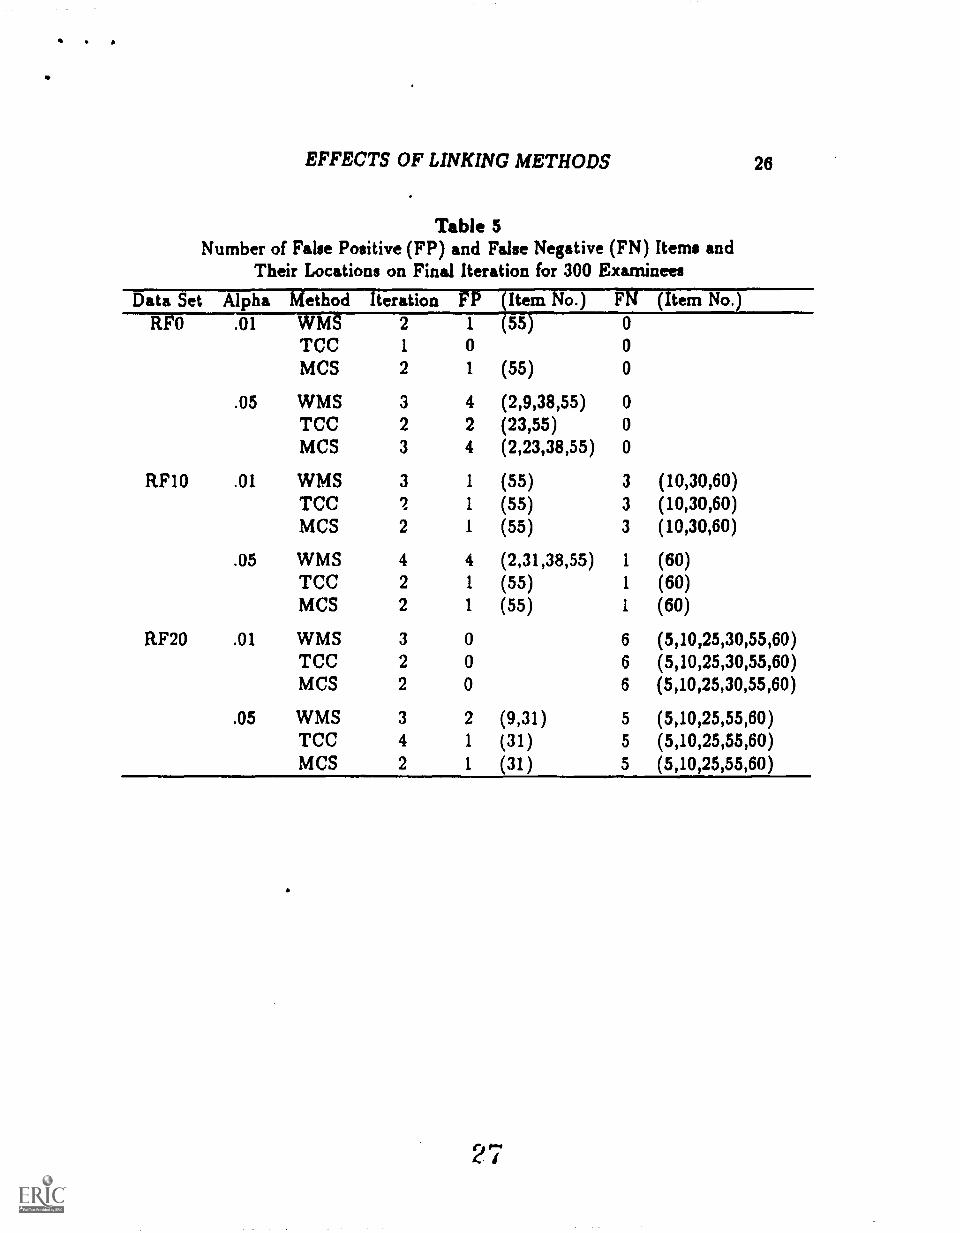
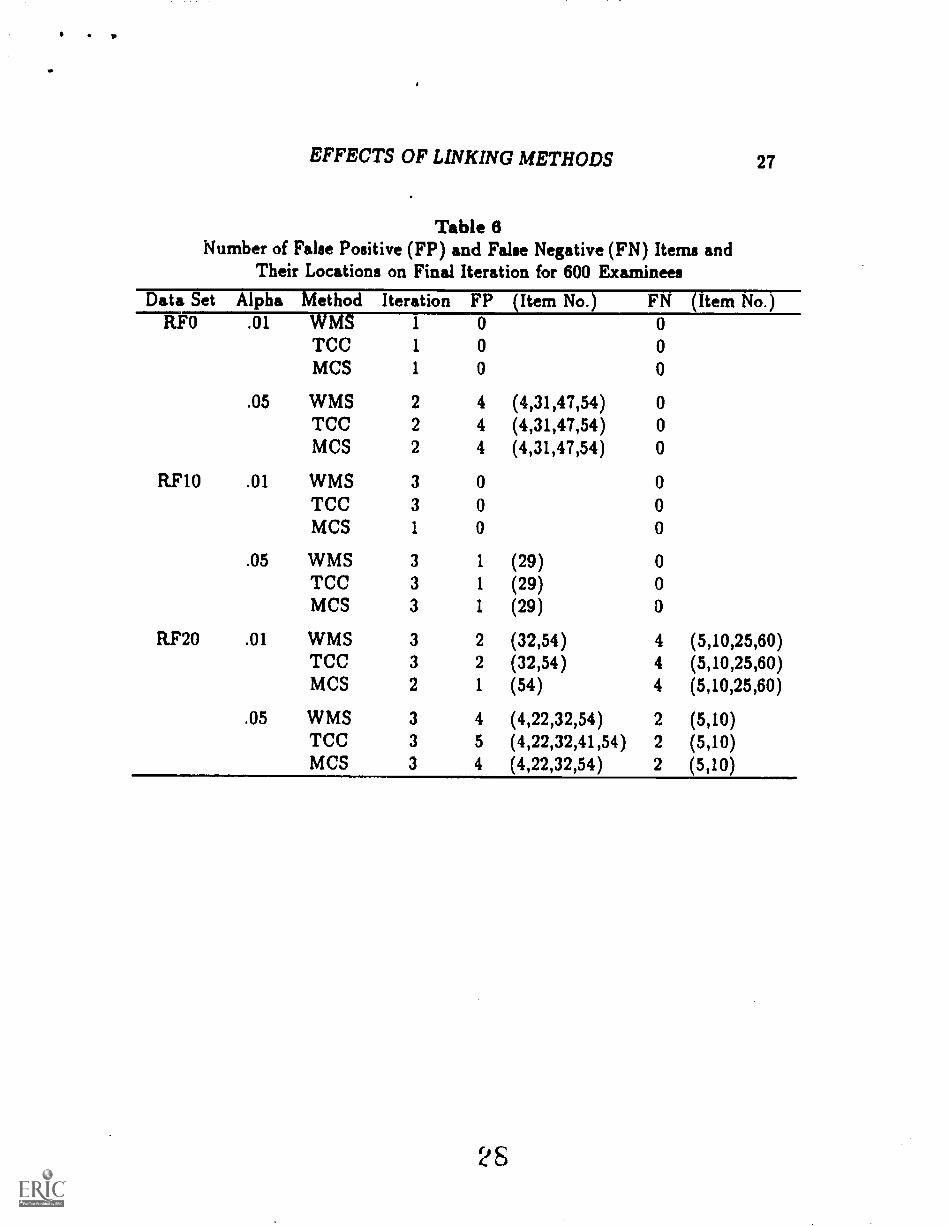
The results from the final iteration, given in Tables 5 and 6 for each linking
method, indicate FN identifications occurred with the same frequency for all
linking method under each condition for each sample size. This was generally
true for the FP identifications as well. More FP items tended to be identified
when the WMS method was used in the presence of DIF. The fewest FP
identifications were generally made following TCC linking, particularly in
the small samples.
********************************
Insert Tables 5 and 6 About Here
********************************
The presence of FN identifications is always a major problem in any DIF
detection study as these are the items which pose a major threat to validity. It
is of interest to note that, when FN identifications did occur, all three linking
methods had the same results. Examination of these items revealed that the
majority were nonuniform DIF items in which the generating item difficulties
were equal in both the reference and focal groups (i.e., aR air,bR = bp).
In fact, of the four items containing this type of DIF (items 5, 10, 25 and
30) under RF20, none were detected in the small samples for the .01 nominal
EFFECTS OF LINKING METHODS 13
alpha level and only one item (30) was detected for the .05 alpha level. In
the large samples, two items (5 and 10) were not detected as DIF items at
both alpha levelb. The other two FN items for the small samples (55, 60)
were also nonuniform DIF items but had bR bp. These items were likely
missed as the values of the item difficulties were 2 10. That is, they were
far from the center of the ability distribution and, consequently, had larger
standard errors.
Iterative vs. Noniterative Linking
Iterative linking had a consistent effect on the estimation of the A con-
stant for the WMS method. The change from first iteration to the lastoccurred in estimates of A from both large and small samples. Under the
null condition, the change was a very slight decrease. When D1F items were
present, however, the estimate of A increased with iterations. No such change
was observed for the other two linking methods. The number of iterations
was lower for the larger sample sizes for all linking methods.
The effect of the use of an iterative procedure also can be seen by com-
parison of the numbers of FP and FN identifications on the first and lastiterations. These results were similar for both the small and large sampleconditions. The FN rate changed only very slightly from first iteration tolast across all linking methods. The FP rate, however, did decrease with theuse of iterative linking procedures. This decrease occurred primarily for theWMS method. A similar decrease occurred for the TCC and MCS methods
1 4
EFFECTS OF LINKING METHODS 14
only under the RF20 condition for a = .05.
Comparison of Linking Methods
The choice of linking method did not appear to have an effect on the rate
of FN identifications. There were some notable differences, however, in the
numbers of FP identifications among the linking methods. The FP rates were
nearly always higher for the WMS method. This was particularly evident in
the small sample results.
*************************
Insert Table 7 About Here
5************************
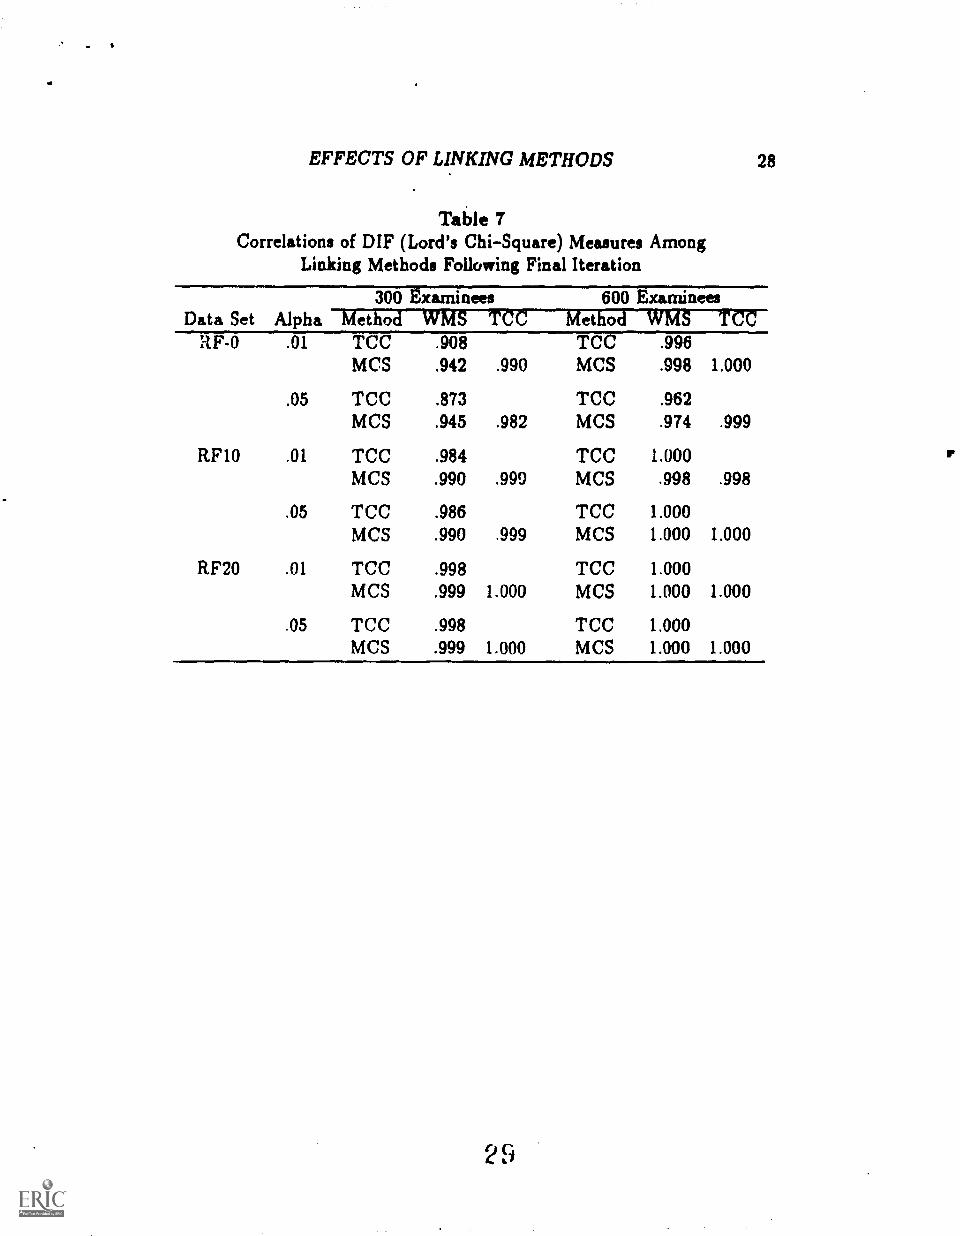
Correlations between values of the DIF statistic, Lord's x2, following the
final iteration provide another indication of the degree of similarity in the
results from each linking method. The correlations in Table 7 are all high
indicating substantial similarity among linking methods. There were no real
differences in correlations for the large sample; all were essentially perfect.
For the small sample, correlations for the RF10 and RF20 conditions were
also quite high, although under the RFO condition, the correlations for the
TCC and MCS methods were relatively higher.
Discussion
The presence of DIF in a test item is a serious problem affecting the
validity of that item as well as of the entire test. If procedures developed to
15
EFFECTS OF LINKING METHODS 15
detect DIF are themselves influenced by the particular linking method used,
then the detection of DIF is also likely to suffer. The results of the present
study give some indication of the differences in detection of DIF associated
with the particular method used to link metrics.
For small samples, the TCC method generally provided the most accurate
detection of DIF, particularly when iterative linking was used. Detection
under MCS linking was nearly as accurate. The TCC method also provided
more accurate linking for both iterative and noniter4tive linking when no
DIF items were present. This result is in disagreement with the findings of
Candell -and Drasgow (1988) who reported that the WMS method provided
more accurate results than the TCC method. The MCS method performed
about as effectively under these conditions as the TCC method.
There were no real differences in DIF detection related to linking meth-
ods in the large sample conditions. In fact, the detection of D1F items under
both TCC and MCS linking transformations was not substantially different
for the different sample sizes. This is somewhat surprising as one wodd
expect standard errors of item parameter estimates to decrease with an in-
crease in sample size. This reduction would, in turn, yield an improvement in
the accuracy of the transformation. If DIF detection is related to the accu-
racy of the linking transformation, therefore, one would expect a subsequent
improvement in detection of DIF when standard errors of item parameter es-
timates are decreased. As the MCS method combines the information used
EFFECTS OF LINKING METHODS 16
by both the WMS and TCC methods, one would expect the MCS methodto yield better detection of DIF. In fact, this did not occur.
The presence of DIF items clearly tended to increase the number of FPitems for the first iteration. This was particularly evident with the WMSmethod. McCauley and Mendoza (1985) and Candell and Drasgow (1988)reported siniilar results. In each case, iterative linking resulted in a decreasein the number of FP and, to a lesser extent, FN identifications.
Choice of a linking method appears to be important primarily in the con-text of small sample sizes. This is often the case, for example, with DIFdetection studies in which a focal group is a minority group. From an irn-plementation point of view, the WMS method is the easiest to adopt as pro-gramming of this method is relatively simple and straight forward. The MCSmethod is also relatively simple to implement. The TCC method, however, is
more difficult as it requires development of some difficult programming code.If software is available for each of the methods, the results of the presentstudy would mitigate in favor of selection of the TCC method. If samplesizes are large, choice of one of these three methods does not seem as critical.
7

EFFECTS OF LINKING METHODS 17
References
Baker, F. B. (1978). CENIRV: A pregram to generate item response vec-
tors. Unpublished manuscript, University of Wisconsin-Madison, Lab-
oratory of Experimental Design.
Baker, F. B. (1990). EQUATE: Computer program for equating two metrics
in item response theory. University of Wisconsin-Madison, Laboratory
of Experimental Design.
13aker, F. B., & Al-Karni, A. (in press). A comparison of two procedures
for computing IRT equating coefficients. Journal of Educationd Mea-surement.
Bejar, I. I., & Wingersky, M. S. (1981). An application of item response
theory to equating the Test of Standard Written English. College Board
Report No. 81-8. Princeton, NJ: Educational Testing Service.
Candell, G. L., & Drasgow, F. (1988). An iterative procedure for link-
ing metrics and assessing item bias in item response theory. Applied
Psychological Measurement, 12, 253-260.
Candell, G. L., & Hulin, C. L. (1986). Cross-language and cross-culturalcomparisons: Independent sources of information about item non-equivalence.Journal of Cross-Cultural Psychology, 17, 417-440.
EFFECTS OF LINKING METHODS 18
Cook, L. L., Eignor, D. R.., de Hutten, L. R. (1979, April). Considerations
in the application of latent trait theory to objectives-based criterion-
referenced tests. Paper presented at the annual meeting of the Ameri-
can Educational Research Association, San Francisco, CA.
Divgi, D. R. (1980, April). Evduation of scales for multilevel test batteries.
Paper presented at the annual meeting of the kmerican Educational
Research Association, Boston, MA.
Divgi, D. R. (1985). A minimum chi-square method for developing a com-
mon metric in item response theory. Applied Psychological Measure-
ment, 9, 413-415.
Drasgow, F. (1987). Study of the measurement bias of two standardized
psychological tests. Journal of Applied Psychology, 72, 19-29.
Haebara, T. (1980). Equating logistic ability scales by a weighted least
squares method. Japanese Psychological Research, 2E, 144-149.
Hulin, C. L., Lissak, R. 1., & Drasgow, F. (1982). Recovery of two- and
three-parameter logistic item characteristic curves: A monte carlo study.
Applied Psychological Measurement, 6, 249-260.
Hulin, C. L., Se Mayer, L. (1986). Psychometric equivalence of a trans-lation of the job descriptive index into Hebrew. Journal of Applied
Psychology, 71 , 83-94.

EFFECTS OF LINKING METHODS 19
Kok, F. G., Mellenbergh, G. J., & van der Flier, H. (1985). Detecting exper-
imentally induced item bias using the iterative logit method. Journal
of Educational Measurement, 2E, 295-303.
Linn, R. L., Levine, M. V., Hastings, C. N., & Wardrop, J. L. (1981).
Item bias in a test of reading comprehension. Applied Psychological
Measurement, 5, 159-173.
Lord, F. M. (1980). Applications of item response theory to practical testing
problems. Hillsdale, NJ: Lawrence Erlbaum Associates.
Loyd, B. H., & Hoover, H. D. (1980). Vertical equating using the Rasch
model. Journal of Educational Measurement, 17, 179-193.
Marco, G. L. (1977). Item characteristic curve solutions to three intractable
testing problems. Journal of Educational Measurement, 14, 139-160.
McLaughlin, M. E., & Drasgow, F. (1987). Lord's chi-square test of item
bias with estimated and with known person parameters. Applied Psy-
chological Measurement, 11, 161-173.
Mislevy, R. J., & Bock, R. D. (1986). PC-BILOG: Item analysis and test
scoring with binary logistic models [computer program]. Mooresville,
IN: Scientific Software.
Mislevy, R. J., & Bock, R. D. (1990). BILOG S. Item analysis and test
scoring with binary logistic models [computer program]. Mooresville,
20
EFFECTS OF LINKING METHODS 20
IN: Scientific Software.
Mitt levy, R. J., & Stocking, M. L. (1989). A consumer's guide to LOGIST
and BILOG. Applied Psychological Measurement, 13, 57-75.
Segall, D. 0. (1983). Test characteristic curves, item bias, and transfor-
mation to a common metric in item response theory: A methodological
artifact with serious consequences and a simple solution Unpublished
manuscript, University of Illinois, Department of Psychology.
Shepard, L., Camilli, G., & Williams, D. M. (1984). Accounting for statis-tical artifacts in item bias research. Journal of Educational Statistics,9, 93-128.
Stocking, M. L., & Lord, F. M. (1983). Developing a common metric initem response theory. Applied Psychological Measurement, 7, 201-210.
Vale, C. D. (1986). Linking item parameters onto a common scale. Applied
Psychological Mewurement, 10, 333-344.
van der Flier, H., Mellenbergh, G. J., Ader, H. J., & Wijn, M. (1984). Aniterative item bias detection method. Journal of Educational Measure-ment, 21, 131-145.
Yen, W. M. (1987). A comparison of the efficiency and accuracy to BILOGand LOGIST. Psychometrika, 52, 275-291.
EFFECTS OF LINKING METHODS 21
Table 1Item Parameters Used to Generate the Data Sets
Item No.
Data SetReferenceG
Disc. Diff. Disc. Diff. Disc. Diff.1 0.81 -2.10 0.81 -2.10 0.81 -2.102 1.00 -2.10 1.00 -2.10 1.00 -2.103 1.23 -2.10 1.23 -2.10 1.23 -2.104 0.66 -1.40 0.66 -1.40 0.66 -1.405 0.81 -1.40 0.81 -1.40 (0.65)4 -1.406 1.00 -1.40 1.00 -1.40 1.00 -1.407 1.00 -1.40 1.00 -1.40 1.00 -1.408 1.23 -1.40 1.23 -1.40 1.23 -1.409 1.52 -1.40 1.52 -1.40 1 52 -1.40
10 0.53 -0.70 (0.37) -0.70 (0.37) -0.7011 0.66 -0.70 0.66 -0.70 0.66 -0.7012 0.81 -0.70 0.81 -0.70 0.81 -0.7013 0.81 -0.70 0.81 -0.70 0.81 -0.7014 1.00 -0.70 1.00 -0.70 1.00 -0.7015 1.00 -0.70 1.00 -0.70 1.00 (-0.20)16 1.00 -0.70 1.00 -0.70 1.00 -0.7017 1.00 -0.70 1.00 -0.70 1.00 -0.7018 1.23 -0.70 1.23 -0.70 1.23 -0.7019 1.23 -0.70 1.23 -0.70 1.23 -0.7020 1.52 -0.70 1.52 (-0.20) 1.52 (-0.20)21 1.88 -0.70 1.88 -0.70 1.88 -0.7022 0.53 0.00 0.53 0.00 0.53 0.0023 0.66 0.00 0.66 0.00 0.66 0.0024 0.66 0.00 0.66 0.00 0.66 0.0025 0.81 0.00 0.81 0.00 (0.49) 0.0026 0.81 %.7,:;0 0.81 0.00 0.81 0.0027 0.81 0.00 0.81 0.00 0.81 0.0028 0.81 0.00 0.81 0.00 0.81 0.0029 1.00 0.00 1.00 0.00 1.00 0.0030 1.00 0.00 (0.68) 0.00 (0.68) 0.00
EFFECTS OF LINKING METHODS 22
Table 1-continuedItem Parameters Used to Generate the Data Sets
ata SetReferences Foc0-106 FocaI-20e
Item No. Disc. Diff. Disc. Da. Disc. Diff.
=1,1=
31 1.00 0.00 1.00 0.00 1.00 0.0032 1.00 0.00 1.00 0.00 1.00 0.0033 1.23 0.00 1.23 0.00 1.23 0.0034 1.23 0.00 1.23 0.00 1.23 0.0035 1.23 0.00 1.23 0.00 1.23 (1.00)36 1.23 0.00 1.23 0.00 1.23 0.0037 1.52 0.00 1.52 0.00 1.52 0.0038 1.52 0.00 1.52 0.00 1.52 0.0039 1.88 0.00 1.88 0.00 1.88 0.0040 0.53 0.70 0.53 (1.70) 0.53 (1.70)41 0.66 0.70 0.66 0.70 0.66 0.7042 0.81 0.70 0.81 0.70 0.81 0.7043 0.81 0.70 0.81 0.70 0.81 0.7044 1.00 0.70 1.00 0.70 1.00 0.7045 1.00 0.70 1.00 0.70 (0.68) (1.70)46 1.00 0.70 1.00 0.70 1.00 0.7047 1.00 0.70 1.00 0.70 1.00 0.7048 1.23 0.70 1.23 0.70 1.23 0.7049 1.23 0.70 1.23 0.70 1.23 0.7050 1.52 0.70 (1.20) (1.70) (1.20) (1.70)51 1.88 0.70 1.88 0.70 1.88 0.7052 0.66 1.40 0.66 1.40 0.66 1.4053 0.81 1.40 0.81 1.40 0.81 1.4054 1.00 1.40 1.00 1.40 1.00 1.4055 1.00 1.40 1.00 1.40 (0.68) (2.40)56 1.23 1.40 1.23 1.40 1.23 1.4057 1.52 1.40 1.52 1.40 1.52 1.4058 0.81 2.10 0.81 2.10 0.81 2.1059 1.00 2.10 1.00 2.10 1.00 2.1060 1.2i 2.10 (0.91) (3.10) (0.91) (3.10)
6 Foca.1-0 has the same item parameters.Focal-10 contains two uniform DIF items (20, 40) andfour non-uniform DIF items (10, 30, 50, 60).Focal-20 contains four uniform DIF items(15, 20, 35, 40) and eight non-uniform DIF items(5, 'LO, 25, 30, 45, 50, 55, 60).
a ( ) indicates values different from reference group.
23

EFFECTS OF LINKING METHODS 23
Table 2Root Mean Squared Differences (RMSD) and Correlation (r)
Between Estimates and True Values
Examinee GroupDiscrimination Difficulty Ability
RM-SD (r)RMSD (T.) RMSD300
600
ReferenceFocal-0Focal-10Focal-20
ReferenceFocal-0Focal-10Foca.1-20
.1517
.1761.1673.1549
.1049.0875.1190.1066
(.9437)(.8775)(.8754)(.9019)
(.9595)(.9708)(.9399)(.9524)
.1183
.1414.1449.1517
.1011
.0915.1067.1166
(.9943)(.9903)(.9910)(.9909)
(.9950)(.9959)(.9952)(.9950)
.2098
.2049.2121.2236
.2109
.2032.2067.2170
(.9784)(.9795)(.9783)(.9756)
(.9775)(.9792)(.9785)(.9765)Note. Estimates were transformed to the true metric using TCC method.
24

EFFECTS OF LINKING METHODS 24
Table 3Equating Constants and Number of False Positive (FP) and
False Negative (FN) Items on Each Iteration for 300 Examinees
1st teration 2nd Iteration 3rd Iteration 4th lieratianMethod" Constants FP-FN Constants FP FN Constants TP-FN Constants 7P-FIN-
R 0-.01- 1 1 A=0.9731B=-.0007
1-0 A=0.9598B=-.0008
1 0
TCC A=1.0254 0-0th---.0293
MCS A=0.9949 1-0 A=0.9961 1-08=-.0397 B=-.0393
.05-WMS A=0.9731 2-0 A=0.9571 4-0 A=0.9465 4-08=-.0007 B=-.0008 B=-.0006
TCC A=1.0254 2-0 A=1.0226 2-0B=-.0293 B=-.0377
MCS A=0.9949 3-0 A=0.9965 4-0 A=0.9927 4-08=-.0397 B=-.0335 B=-.0269
RF10-.01-WMS A=0.8985 2-3 A=0.9994 1-3 A=1.0052 1-3B=-.0014 B=. .0009 B=-.0009
TCC A=0.9891 1-3 A=0.9971 1-38=-.0910 B=-.0654
MCS A =0.9940 1-3 A=0.9885 1-3B=-.0741 B=-.0521
.05-WMS A=0.8985 8-2 A=0.9570 5-2 A=0.9898 4-1 A=1.0003 4-1B=-.0014 B=0.0002 B=- .0005 B =4007
TCC A=0.9891 1-1 A =1.0080 1-1B =- . 0910 13=- .0610
MCS A =0.9940 1-1 A =0.9954 1-1Boo- .0741 B=- .0520
R120- .01--W MS A=0.8335 3-6 A=0.9788 0-6 A=1. 0151 0-6B =- .0023 B=- .0004 B=- . 0008
TCC A=0.9646 0-6 A=0.9913 0-6B=-.1202 B=-.0481
M CS A =0.9702 0-6 A=0.9876 0-6B=. .1012 .13=-.0351
.05-WMS A=0.8335 5--6 A=0.9678 2-5 A=0.9640 2-58 =- .0023 13=- .0004 B=. . 0019
TCC A=0.9646 5-5 A=0.9930 0-5 A=0.9999 1-5 A=0.9958 1-513=-.1202 B=-.0718 B=-.0504 8=-.0449
MCS A=0.9702 2-5 A=0.9882 1-5 A=0.9904 1-5Bm-.1012 13=-.0441 B=-.0313
Data Set-Alpha-Method
EFFECTS OF LINKING METHODS 25
Table 4Equating Constants and Number of False Positive (FP) and
False Negative (FN) Items on Each Iteration for 600 Examinees
Method*1.1 Iteration 2na Iteration 3rd Iteration 4th Iteration
Constants PP-FT Constants FP-PN Croastants PP-FN Constants FP-PNRFO- 01-WMS A=1.0077 0-0
B=-.0003TCC A=1.0080 0-0
B=-.0086MCS A=1.0081 0-0
B=-.0065
.05-WMS A=1.0077 4-0 A=0.9992 4-0B=- .0003 13=. 0005
TCC A=1.0080 4-0 A=1.0040 4-08.-.0086 13=-.0271
MCS A=1.0081 4-0 A=1.0020 4-0B=-.0065 B=- .0221
RF10- 01-WMS A=0.9132 0-3 A=1.0265 0--0 A=1.0321 0-0B=-.0009 B=-.0001 8=-.0001
TCC A=0.9794 0-2 A=1.0032 0-0 A=1.0193 0-0B=-.0433 13=- 0046 B=0.0032
MCS A=1.0023 0-0B=-.0321
.05-WMS A=0.9132 5-0 A=1.0147 1-0 A=1.0309 1-013=-.0009 8=-.0001 13=0.0001
TCC A=0 9794 2-0 A=1.0141 1-0 A=1.0188 1-0B=-.0433 B=0.0001 B=0.0081
MCS A=1.0023 2-0 A=1.0147 1-0 A=1.0198 1-0B=-.0321 B=-.0007 8=0.0076
RF20-.01-WMS A=0.8886 3-5 A=1.0091 2-4 A=1.0145 2-48=-.0020 B=-.0003 B=-.0001
TCC A=0.9555 2-4 A=0.9861 2-4 A=0.9864 2-413=-.0901 B=-.0175 8=-.0060
MCS A=0.9959 1-4 A=1.0082 1-4B=-.0801 B=-.0102
.05-WMS A=0.8886 7-4 A=1.0090 4--2 A=1.0299 4-2B=-.0020 B=-.0003 13=-.0001
TCC A=0.9555 9-3 A=0.9811 5-2 A=1.0005 5-2B=-.0901 B=-.0441 8=-.0119
MCS A=0.9959 7-3 A=1.0106 4-2 A=1.0154 4-28=-.0801 13=-.0193 8=-.0102
Data Scit-Alpha-Method
26
EFFECTS OF LINKING METHODS 26
Table 5Number of False Positive (FP) and False Negative (FN) Items and
Their Locations on Final Iteration for 300 Examinees
Data Set Alpha Method Iteration FP (Item No.)RFO .01 WMS 2 1 (55T
TCC 1 0MCS 2 1 (55)
.05 WMS 3 4 (2,9,38,55)TCC 2 2 (23,55)MCS 3 4 (2,23,38,55)
RFIO .01 WMS 3 1 (55)TCC 2 1 (55)MCS 2 1 (55)
.05 WMS 4 4 (2,31,38,55)TCC 2 I (55)MCS 2 1 (55)
RF20 .01 WMS 3 0
TCC 2 0
MCS 2 0
.05 WMS 3 2 (9,31)TCC 4 1 (31)MCS 2 1 (31)
2 7
FR (Item No.)o
0
0
0
0
0
3 (10,30,60)3 (10,30,60)3 (10,30,60)
I (60)1 (60)1 (60)
6 (5,10,25,30,55,60)6 (5,10,25,30,55,60)6 (5,10,25,30,55,60)
5 (5,10,25,55,60)5 (5,10,25,55,60)5 (5,10,25,55,60)
EFFECTS OF LINKING METHODS 27
Table 8Number of False Positive (FP) and False Negative (FN) Items and
Their Locations on Final Iteration for 600 Examinees
Data Set Alpha Method Iteration FP (Item No.) FN (Item No.)RFO .01 WMS 1 0 0
TCC 1 0 0MCS 1 0 0
.05 WMS 2 4 (4,31,47,54) 0TCC 2 4 (4,31,47,54) 0MCS 2 4 (4,31,47,54) 0
RF10 .01 WMS 3 0 0
TCC 3 0 0MCS 1 0 0
.05 WMS 3 1 (29) 0TCC 3 1 (29) 0MCS 3 1 (29) 0
RF20 .01 WMS 3 2 (32,54) 4 (5,10,25,60)TCC 3 2 (32,54) 4 (5,10,25,60)MCS 2 1 (54) 4 (5,10,25,60)
.05 WMS 3 4 (4,22,32,54) 2 (5,10)TCC 3 5 (4,22,32,41,54) 2 (5,10)MCS 3 4 (4,22,32,54) 2 (5,10)
28
EFFECTS OF LINKING METHODS 28
Table 7Correlations of DIF (Lord's Chi-Square) Measures Among
Linking Methods Following Final Iteration
300 Examinees 600 ExamineesData Set Alpha 'Method WMS TCC ivfethod WMS Tee
RF-0 . 01 TCCMCS
.05 TCCMCS
RF10 .01 TCCMCS
. 05 TCCMCS
RF20 .01 TCCMCS
.05 TCCMCS
.908 TCC .996
.942 .990 MCS .998 1.000
. 873 TCC .962
. 945 .982 MCS .974 .999
. 984 TCC 1.000.990 .999 MCS .998 .998
.986 TCC 1.000
.990 .999 MCS 1.000 1.000
.998 TCC 1.000
.999 1.000 MCS 1.000 1.000
.998 TCC 1.000
. 999 1.000 MCS 1.000 1.000
29

EFFECTS OF LINKING METHODS 29
Appendix
Description of Linking Methods Used in This Study
The following is a description of the three linking methods used in the
present study:
Weighted Mean and Sigma Method (WMS). The two equating
constants are estimated from the first two moments of the distributions of
the weighted estimates of item difficulties. The jth we'ght is the inverse of the
larger of the estimated variances (i.e., squared standard errors) of the item
difficulty computed from the focal group and the item difficulty computed
from the reference group. In this way, items for which the difficulty parameter
was poorly estimated for either of the groups are given relatively less weight
in determining the equating constants. Specifically, if 67 is the weighted
item difficulty of item j in the focal group after equating and PA. is the
corresponding value prior to equating, then
AV!' + B1F. jr (5)
where A and B are selected such that the mean and standard deviation of
the weighted item difficulties in the focal group are Nual to the mean and
standard deviation of the weighted item difficulties in the reference group.
For this transformation
A = crbliabp (6)

and
EFFECTS OF LINKING METHODS 30
B = /.41,1 (7)
where mix is the mean and obx is the standard deviation of the weighted item
difficulties from the referen.:e group and /lb; and ob; are the corresponding
values from the focal group.
Test Characteristic Curve Method (TCC). The TCC method is
based on matching the test characteristic curves yielded by calibrations in
the reference and focal groups. Let T.F. be the true score on the reference
group scale for examinee i from the focal group and let T;ir be the transformed
true score for this examinee. Then
F = E(Tir TisprN i=1(8)
is the quadratic loss-function to be minimized, where N is the number ofexaminees taking the test. Under the 2PM, Tar and 71:F are defined as
Tip E P(Oipi ail?, bin) (9)
and
77,3. = E P(0,p, a;p, b;p), (10)
where n is the number of items used.
The function to be minimized becomes
1NIT rt=
NE P(Oip, am, bin) E a;r, b;r) . (11)j.t j=I
EFFECTS OF LINKING METHODS 31
The task, in other words, is to find the values of A and B used to transform
T:p. into Tar that minimizes F.
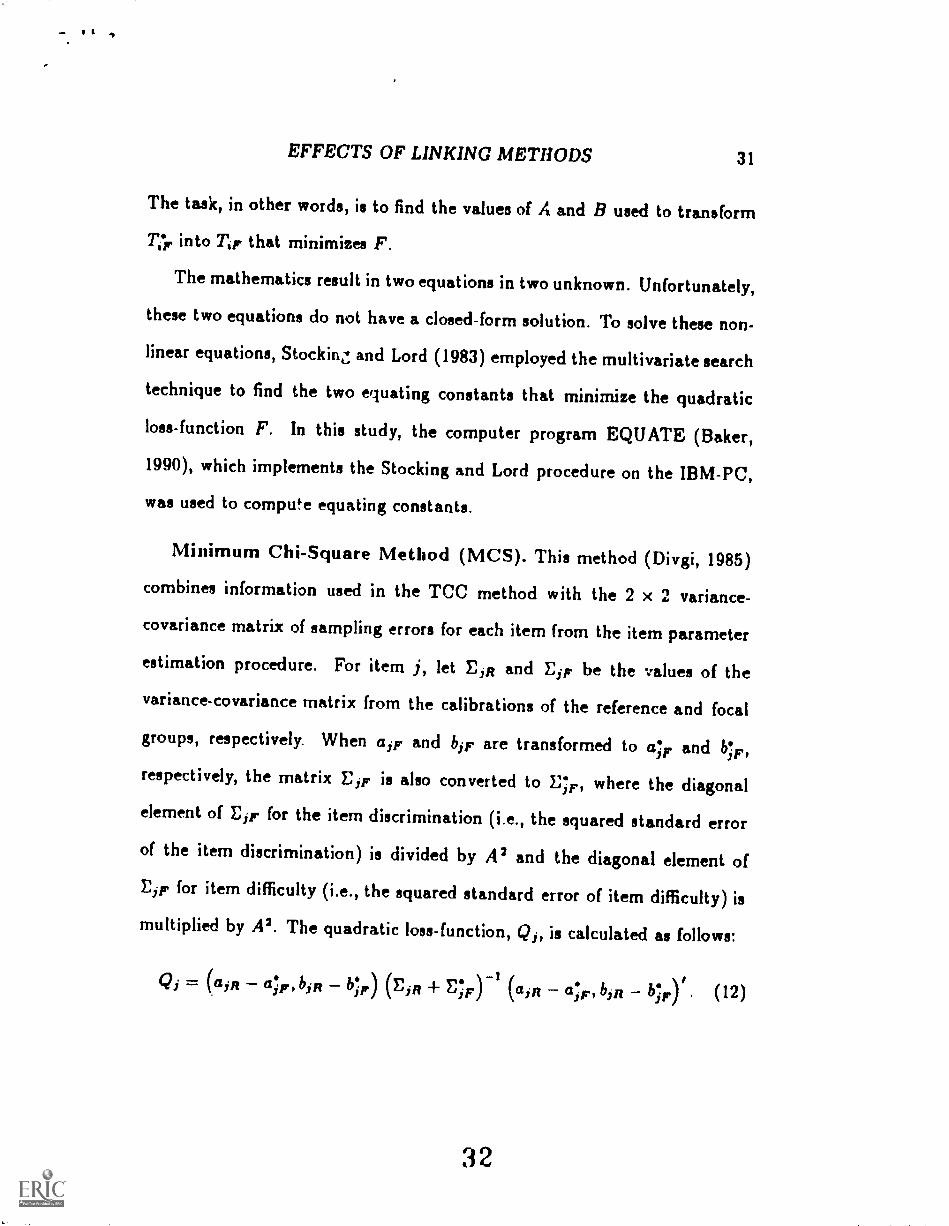
The mathematics result in two equations in two unknown. Unfortunately,
these two equations do not have a closed-form solution. To solve these non-
linear equations, Stockinz and Lord (1983) employed the multivariate search
technique to find the two equating constants that minimize the quadratic
loss-function F. In this study, the computer program EQUATE (Baker,
1990), which implements the Stocking and Lord procedure on the IBM-PC,
was used to compute equating constants.
Minimum Chi-Square Method (MCS). This method (Divgi, 1985)
combines information used in the TCC method with the 2 x 2 variance-
covariance matrix of sampling errors for each item from the item parameter
estimation procedure. For item j, let Ejit and Epp be the values of the
variance-covariance matrix from the calibrations of the reference and focal
groups, respectively. When air and biF are transformed to ti;ir and 1);
respectively, the matrix EjF is also converted to E;F, where the diagonal
element of EjF for the item discrimination (i.e., the squared standard errorof the item discrimination) is divided by A2 and the diagonal element ofEir for item difficulty (i.e., the squared standard error of item difficulty) is
multiplied by A2. The quadratic loss-function, Qi, is calculated as follows:
-IQi = (apt / /biR b;F) (EjR E;F) kain ct;r, b; ) . (12)

Let
EFFECTS OF LINKING METHODS 32
= EQj=1
and be treated as a function of two equating constants A and B. The task
is to find those values of A and B that minimize Q.
Since the partial derivative 0Q/8B = 0 is linear with regard to B and
easily solved as a function of A, the MCS method can be easily implemented
in a computer program than the TCC method which requires the multivariate
search technique. Denote Si., and S, are individual elements from the
(13)
-matrix Sj = (E,n + E;F) 1
. Then
B (S,., ( a,R a1p/A)+ S.4.(bin AbjF))/ E sJ,.. ( 14)
When this value of B is substituted in the expression for Q, we have left a
minimization problem with only a single unknown, A, which is easy to solve
iteratively. A computer program, developed for this study to implement the
MCS method, used an initial value of A from the mean and sigma method to
find the value of B. After obtaining a temporary estimate of B, the Newton-
Raphson method was used to find a subsequent value of A. The updated
value of A was then used to find a new value of B, and so on. The iteration
was repeated until a prespecified criterion for the differences for the values of
A and B between two successive iterations, was met. For the present study,
this criterion was set at .01.
e4 3