eda: results-driven performance · development administration (eda) is one of them. in support of...
TRANSCRIPT
EDA:
Results-driven Performance
United States Department of Commerce
Economic Development Administration
Fiscal Year 2020
Congressional Budget Request
March 18, 2019
PRIVILEGED
The information contained herein must not be disclosed outside the Bureau until made public
by the President or by the Congress.
EDA-i

[THIS PAGE INTENTIONALLY LEFT BLANK]
EDA-ii

Exhibit Number Exhibit Page Number
2 Organization Chart EDA-3
3 Executive Summary EDA-5
4A Program Increases / Decreases / Terminations EDA-7
5 Summary of Resource Requirements: Direct Obligations EDA-9
6 Summary of Reimbursable Obligations EDA-11
7 Summary of Financing EDA-13
10 Program and Performance: Direct Obligations EDA-15
12 Justification of Program and Performance (Public Works) EDA-17
13 Program Change for 2020 EDA-19
10 Program and Performance: Direct Obligations EDA-21
12 Justification of Program and Performance (Partnership Planning) EDA-23
13 Program Change for 2020 EDA-25
10 Program and Performance: Direct Obligations EDA-27
12 Justification of Program and Performance (Technical Assistance) EDA-29
13 Program Change for 2020 EDA-31
10 Program and Performance: Direct Obligations EDA-33
12 Justification of Program and Performance (Research and Evaluation) EDA-35
13 Program Change for 2020 EDA-37
10 Program and Performance: Direct Obligations EDA-39
12 Justification of Program and Performance (Trade Adjustment Assistance) EDA-41
13 Program Change for 2020 EDA-43
10 Program and Performance: Direct Obligations EDA-45
12 Justification of Program and Performance (Economic Adjustment Assistance) EDA-47
13 Program Change for 2020 EDA-49
10 Program and Performance: Direct Obligations EDA-51
12 Justification of Program and Performance (Assistance to Coal Communities) EDA-53
13 Program Change for 2020 EDA-55
10 Program and Performance: Direct Obligations EDA-57
Exhibit 1 DEPARTMENT OF COMMERCE
ECONOMIC DEVELOPMENT ADMINISTRATION
Budget Estimates, Fiscal Year 2020
Congressional Submission
Table Of Contents
EDA-1

Exhibit Number Exhibit Page Number
12 Justification of Program and Performance (Regional Innovation) EDA-59
13 Program Change for 2020 EDA-61
16 Summary of Requirements by Object Class EDA-63
32 Justification of Proposed Language Changes EDA-65
33 Appropriation Language and Code Citations EDA-67
5 Summary of Resource Requirements: Direct Obligations EDA-69
6 Summary of Reimbursable Obligations EDA-71
7 Summary of Financing EDA-73
8 Adjustments-to-Base EDA-75
10 Program and Performance: Direct Obligations EDA-77
11 Program and Performance: Reimbursable Obligations EDA-79
12 Justification of Program and Performance (by Subactivity) EDA-81
13 Program Change for 2020 EDA-85
14 Program Change Personnel Detail EDA-89
15 Program Change Detail by Object Class EDA-91
16 Summary of Requirements by Object Class EDA-93
32 Justification of Proposed Language Changes EDA-95
33 Appropriations Language and Code Citation EDA-97
35 Periodicals, Pamphlets, and Audiovisual Services EDA-99
36 Average Grade and Salaries EDA-101
Annual Performance Plan and Report Backup EDA-103
EDA-2

Exhibit 2 Department of Commerce
Economic Development Administration
ASSISTANT SECRETARY FOR ECONOMIC DEVELOPMENT DEPUTY ASSISTANT SECRETARY FOR ECONOMIC DEVELOPMENT
Office of External Affairs (OEA)
Public Affairs
Legislative Affairs
Office of Information Technology (OIT)
Office of Regional Affairs (ORA)
Performance and National Programs Division
Trade Adjustment Assistance
Austin Regional Office (AURO) Denver Regional Office (DRO)
Atlanta Regional Office (ATRO)
Philadelphia Regional Office (PRO)
Chicago Regional Office (CRO) Seattle Regional Office
(SRO)
Office of Finance and Management Services (OFMS)
Budget and Finance Division
Administrative Division
Office of Innovation and Entrepreneurship (OIE)
Office of the Chief Counsel (OCC)
EDA-3

[THIS PAGE INTENTIONALLY LEFT BLANK]
EDA-4

Exhibit 3
Department of Commerce
Economic Development Administration
Budget Estimates, Fiscal Year 2020
Executive Summary
The Administration’s 2020 Budget prioritizes rebuilding the military and making critical investments in the Nation’s security. It also identifies the savings and efficiencies needed to keep the Nation on a responsible fiscal path. The Administration has made the necessary tradeoffs and choices inherent in pursuing these goals. This means changing the role and size of the Federal Government and prioritizing the programs that provide a good return for the taxpayer, as well as those that serve the most critical functions, while consolidating or eliminating duplicative, ineffective or less critical programs. Many difficult decisions were necessary to reach the funding level provided in this budget, and the elimination of the Economic Development Administration (EDA) is one of them.
In support of these goals, the EDA 2020 budget requests program decreases to provide offsets to rebuild the military and make critical investments in the Nation’s security. This budget requests approximately $30 million to cover the costs associated with closing down the agency. In light of this proposal to close down EDA, the Administration is also including in the general provisions for the Department of Commerce, specific language to allow for the defederalization of its Revolving Loan Fund grants. This language is necessary for the orderly close down of EDA’s operations. Without the authority, EDA or any successor operating unit within the Department, would have to administer and monitor these grants in perpetuity because the federal interest in this type of grant does not end. This is a change to EDA’s authorizing statute that the Department would pursue even if EDA were not eliminated in order to reduce costly grantee reporting requirements and burdensome agency oversight on Revolving Loan Funds that are successful and have demonstrated a strong track record of compliance and effectiveness.
Since EDA’s inception 53 years ago, EDA has led the federal economic development agenda by promoting innovation and competitiveness, preparing American regions for growth and success in the worldwide economy. EDA is proud of the investments it has made in economically distressed regions, based on their locally-driven strategies and needs, and the outcomes of those investments which spurred local innovation and entrepreneurship creating and saving jobs and leveraging private investments.
EDA-5

Performance: The effectiveness of EDA investments is assessed using numerous internal and external performance measures including the Government Performance and Results Act (GPRA) goals. These efforts have been institutionalized in EDA operations to maintain quality control and use objective methods to assess EDA performance. For current GPRA targets please see the 2020/2018 Annual Performance Plan and Report.
Adjustments:
Inflationary Adjustments EDA’s 2020 Base includes a total of $773,000 and 0 FTE/ 0 positions to account for the full funding requirement for inflationary adjustments to current programs for EDA activities. This includes inflationary increases for labor and non-labor activities, including benefits, service contracts, utilities, field office lease payments, and rent charges from the General Services Administration (GSA).
Technical Adjustments (Transfers) Not applicable
EDA-6

Exhibit 4A Department of Commerce
Economic Development Administration FY 2020 PROGRAM INCREASES / DECREASES / TERMINATIONS
(Dollar amounts in thousands) (By Appropriation, Largest to Smallest)
Increases
Budget
Page No Positions Authority
in CJ Appropriation Budget Program Activity/Subactivity
Not Applicable 0 0
Subtotal, Increases 0 0
Decreases
Budget
Page No Positions Authority
in CJ Appropriation Budget Program Activity/Subactivity
EDA-87 Salaries and Expenses Salaries and Expenses Operation -101 (9,823)
Subtotal, Decreases -101 (9,823)
Terminations
Budget
Page No Positions Authority
in CJ Appropriation Budget Program Activity/Subactivity
EDA-37 Economic Development Assistance Programs Research and Evaluation 0 (1,500)
EDA-31 Economic Development Assistance Programs Technical Assistance 0 (9,500)
EDA-43 Economic Development Assistance Programs Trade Adjustment Assistance 0 (13,000)
EDA-61 Economic Development Assistance Programs Regional Innovation 0 (23,500)
EDA-55 Economic Development Assistance Programs Assistance to Coal Communities 0 (30,000)
EDA-25 Economic Development Assistance Programs Partnership Planning 0 (33,000)
EDA-49 Economic Development Assistance Programs Economic Adjustment Assistance 0 (37,000)
EDA-19 Economic Development Assistance Programs Public Works 0 (117,500)
Subtotal, Terminations 0 (265,000)
EDA-7

[THIS PAGE INTENTIONALLY LEFT BLANK]
EDA-8

Exhibit 5 Department of Commerce
Economic Development Administration Economic Development Assistance Programs SUMMARY OF RESOURCE REQUIREMENTS
(Dollar amounts in thousands)
Budget Direct
Positions FTE Authority Obligations
Appropriation Available, 2019 0 0 265,000 0
2020 Adjustments to base:
Plus: Restoration of recoveries/unobligated balances used to offset 2019 appropriation/non-recurring 0
Plus: Inflationary/Adjustments to base 0 0
Less: Estimated recoveries, 2020 (32,000)
2020 Base 0 0 233,000 0
Plus: 2020 Program changes 0 0 (233,000) 0
2020 Estimate 0 0 0 0
Comparison by activity / subactivity 2018 2019 2020 2020 Increase/Decrease
with totals by activity Actual Enacted Base Estimate over 2020 Base
Personnel Amount Personnel Amount Personnel Amount Personnel Amount Personnel Amount
EDA - 15 Public Works Pos./BA 0 117,500 0 117,500 0 117,500 0 0 0 (117,500)
FTE/Obl. 0 138,414 0 134,700 0 134,700 0 0 0 (134,700)
EDA - 21 Partnership Planning Pos./BA 0 33,000 0 33,000 0 33,000 0 0 0 (33,000)
FTE/Obl. 0 37,944 0 33,100 0 33,100 0 0 0 (33,100)
EDA - 27 Technical Assistance Pos./BA 0 9,500 0 9,500 0 9,500 0 0 0 (9,500)
FTE/Obl. 0 9,618 0 10,500 0 10,500 0 0 0 (10,500)
EDA - 33 Research and Evaluation Pos./BA 0 1,500 0 1,500 0 1,500 0 0 0 (1,500)
FTE/Obl. 0 1,099 0 2,200 0 2,200 0 0 0 (2,200)
EDA - 39 Trade Adjustment Assistance Pos./BA 0 13,000 0 13,000 0 13,000 0 0 0 (13,000)
FTE/Obl. 0 13,000 0 13,000 0 13,000 0 0 0 (13,000)
EDA-9
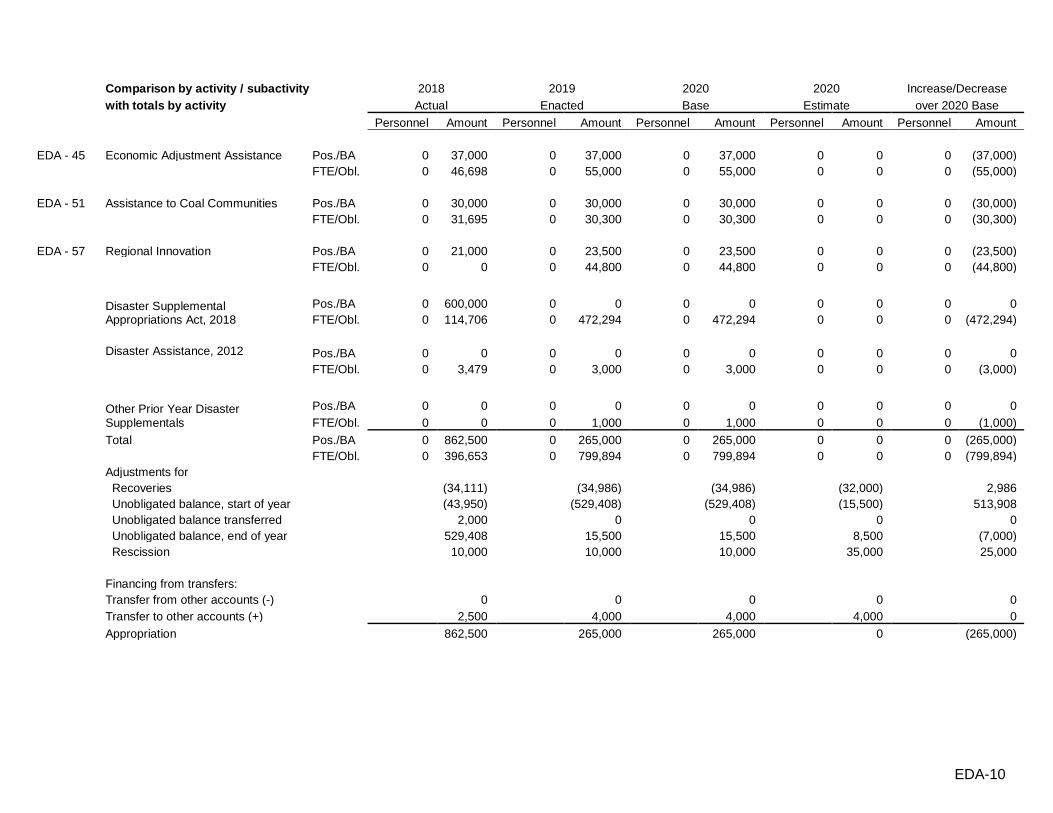
Comparison by activity / subactivity
with totals by activity
2018
Actual
Personnel Amount
2019
Enacted
Personnel Amount
2020
Base
Personnel Amount
2020
Estimate
Personnel Amount
Increase/Decrease
over 2020 Base
Personnel Amount
EDA - 45 Economic Adjustment Assistance Pos./BA
FTE/Obl.
0
0
37,000
46,698
0
0
37,000
55,000
0
0
37,000
55,000
0
0
0
0
0
0
(37,000)
(55,000)
EDA - 51 Assistance to Coal Communities Pos./BA
FTE/Obl.
0
0
30,000
31,695
0
0
30,000
30,300
0
0
30,000
30,300
0
0
0
0
0
0
(30,000)
(30,300)
EDA - 57 Regional Innovation Pos./BA
FTE/Obl.
0
0
21,000
0
0
0
23,500
44,800
0
0
23,500
44,800
0
0
0
0
0
0
(23,500)
(44,800)
Disaster Supplemental Appropriations Act, 2018
Pos./BA
FTE/Obl.
0
0
600,000
114,706
0
0
0
472,294
0
0
0
472,294
0
0
0
0
0
0
0
(472,294)
Disaster Assistance, 2012 Pos./BA
FTE/Obl.
0
0
0
3,479
0
0
0
3,000
0
0
0
3,000
0
0
0
0
0
0
0
(3,000)
Other Prior Year Disaster Supplementals
Total
Adjustments for
Recoveries
Unobligated balance, start of year
Unobligated balance transferred
Unobligated balance, end of year
Rescission
Pos./BA
FTE/Obl.
Pos./BA
FTE/Obl.
0
0
0
0
0
0
862,500
396,653
(34,111)
(43,950)
2,000
529,408
10,000
0
0
0
0
0
1,000
265,000
799,894
(34,986)
(529,408)
0
15,500
10,000
0
0
0
0
0
1,000
265,000
799,894
(34,986)
(529,408)
0
15,500
10,000
0
0
0
0
0
0
0
0
(32,000)
(15,500)
0
8,500
35,000
0
0
0
0
0
(1,000)
(265,000)
(799,894)
2,986
513,908
0
(7,000)
25,000
Financing from transfers:
Transfer from other accounts (-)
Transfer to other accounts (+)
Appropriation
0
2,500
862,500
0
4,000
265,000
0
4,000
265,000
0
4,000
0
0
0
(265,000)
EDA-10
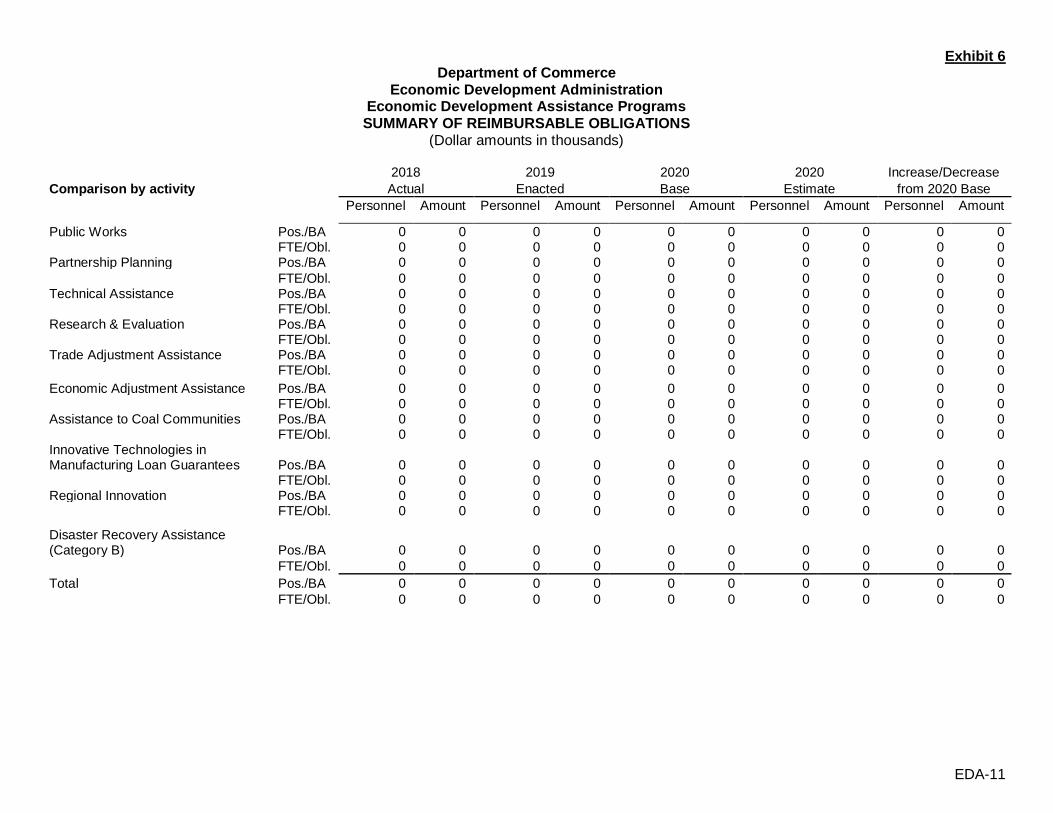
Exhibit 6 Department of Commerce
Economic Development Administration Economic Development Assistance Programs SUMMARY OF REIMBURSABLE OBLIGATIONS
(Dollar amounts in thousands)
2018 2019 2020 2020 Increase/Decrease
Comparison by activity Actual Enacted Base Estimate from 2020 Base
Personnel Amount Personnel Amount Personnel Amount Personnel Amount Personnel Amount
Public Works Pos./BA 0 0 0 0 0 0 0 0 0 0 FTE/Obl. 0 0 0 0 0 0 0 0 0 0
Partnership Planning Pos./BA 0 0 0 0 0 0 0 0 0 0
FTE/Obl. 0 0 0 0 0 0 0 0 0 0 Technical Assistance Pos./BA 0 0 0 0 0 0 0 0 0 0
FTE/Obl. 0 0 0 0 0 0 0 0 0 0 Research & Evaluation Pos./BA 0 0 0 0 0 0 0 0 0 0
FTE/Obl. 0 0 0 0 0 0 0 0 0 0 Trade Adjustment Assistance Pos./BA 0 0 0 0 0 0 0 0 0 0
FTE/Obl. 0 0 0 0 0 0 0 0 0 0
Economic Adjustment Assistance Pos./BA 0 0 0 0 0 0 0 0 0 0 FTE/Obl. 0 0 0 0 0 0 0 0 0 0
Assistance to Coal Communities Pos./BA 0 0 0 0 0 0 0 0 0 0 FTE/Obl. 0 0 0 0 0 0 0 0 0 0
Innovative Technologies in Manufacturing Loan Guarantees Pos./BA 0 0 0 0 0 0 0 0 0 0
FTE/Obl. 0 0 0 0 0 0 0 0 0 0 Regional Innovation Pos./BA 0 0 0 0 0 0 0 0 0 0
FTE/Obl. 0 0 0 0 0 0 0 0 0 0
Disaster Recovery Assistance (Category B) Pos./BA 0 0 0 0 0 0 0 0 0 0
FTE/Obl. 0 0 0 0 0 0 0 0 0 0
Total Pos./BA 0 0 0 0 0 0 0 0 0 0
FTE/Obl. 0 0 0 0 0 0 0 0 0 0
EDA-11

[THIS PAGE INTENTIONALLY LEFT BLANK]
EDA-12
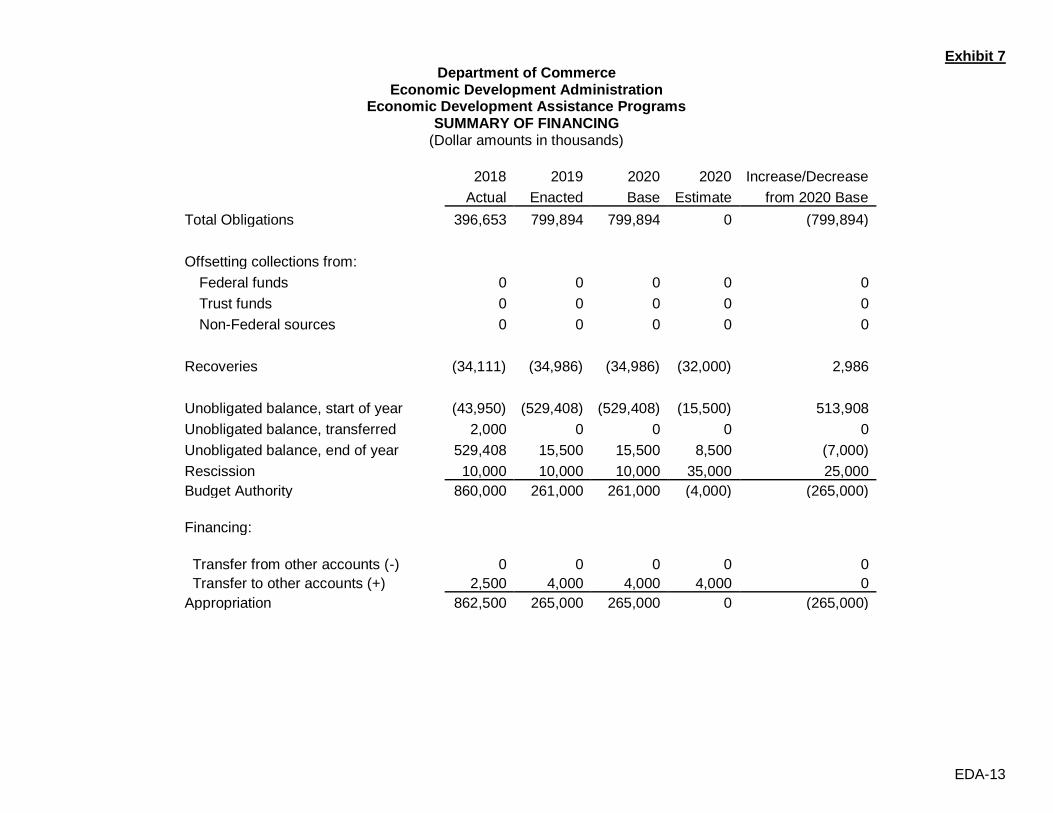
Exhibit 7 Department of Commerce
Economic Development Administration Economic Development Assistance Programs
SUMMARY OF FINANCING (Dollar amounts in thousands)
Total Obligations
2018
Actual
396,653
2019
Enacted
799,894
2020
Base
799,894
2020
Estimate
0
Increase/Decrease
from 2020 Base
(799,894)
Offsetting collections from:
Federal funds
Trust funds
Non-Federal sources
0
0
0
0
0
0
0
0
0
0
0
0
0
0
0
Recoveries (34,111) (34,986) (34,986) (32,000) 2,986
Unobligated balance, start of year
Unobligated balance, transferred
Unobligated balance, end of year
Rescission
Budget Authority
(43,950)
2,000
529,408
10,000
860,000
(529,408)
0
15,500
10,000
261,000
(529,408)
0
15,500
10,000
261,000
(15,500)
0
8,500
35,000
(4,000)
513,908
0
(7,000)
25,000
(265,000)
Financing:
Transfer from other accounts (-)
Transfer to other accounts (+)
Appropriation
0
2,500
862,500
0
4,000
265,000
0
4,000
265,000
0
4,000
0
0
0
(265,000)
EDA-13

[THIS PAGE INTENTIONALLY LEFT BLANK]
EDA-14
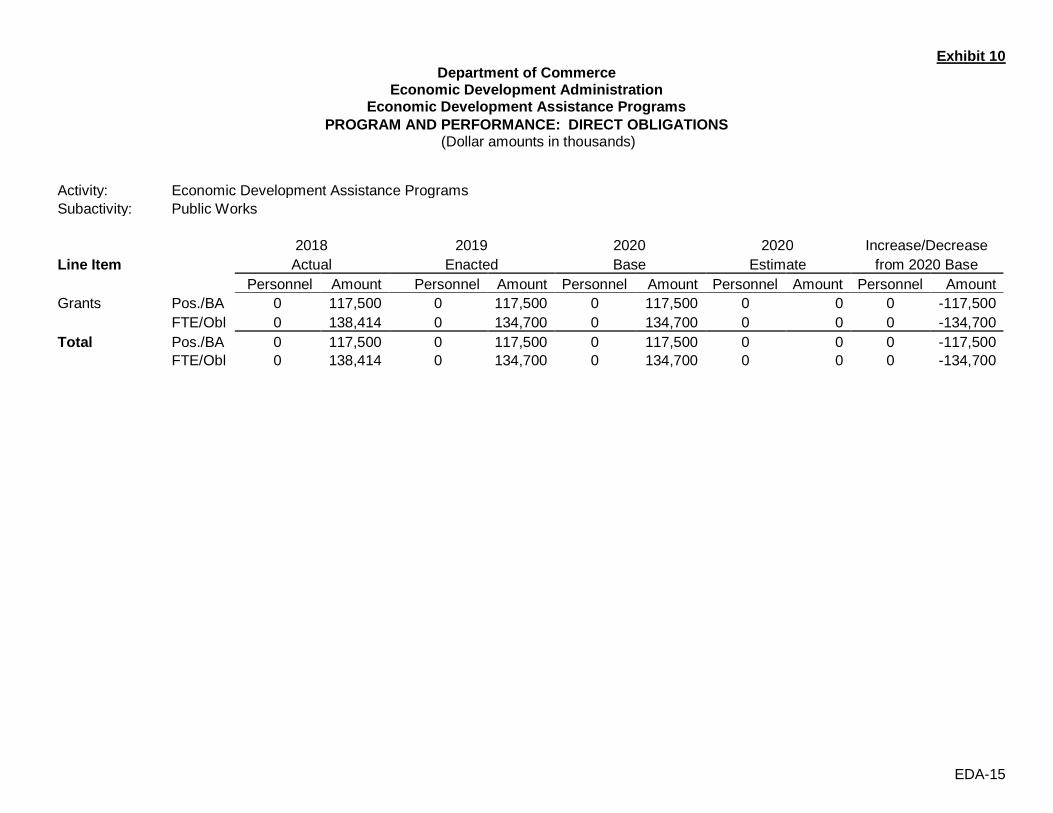
Exhibit 10 Department of Commerce
Economic Development Administration Economic Development Assistance Programs
PROGRAM AND PERFORMANCE: DIRECT OBLIGATIONS (Dollar amounts in thousands)
Activity:
Subactivity:
Economic Development Assistance Programs
Public Works
Line Item
Grants
Total
Pos./BA
FTE/Obl
Pos./BA
FTE/Obl
2018
Actual
Personnel Amount
0 117,500
0 138,414
0 117,500
0 138,414
2019
Enacted
Personnel Amount
0 117,500
0 134,700
0 117,500
0 134,700
2020
Base
Personnel Amount
0 117,500
0 134,700
0 117,500
0 134,700
2020
Estimate
Personnel Amount
0 0
0 0
0 0
0 0
Increase/Decrease
from 2020 Base
Personnel Amount
0 -117,500
0 -134,700
0 -117,500
0 -134,700
EDA-15

[THIS PAGE INTENTIONALLY LEFT BLANK]
EDA-16

Exhibit 12 Department of Commerce
Economic Development Administration Economic Development Assistance Programs
JUSTIFICATION OF PROGRAM AND PERFORMANCE (Dollar amounts in thousands)
Activity: Economic Development Assistance Programs Subactivity: Public Works
Goal Statement
The Administration is not requesting funding for EDA’s grant programs including the Public Works Program.
Base Program
Through the Public Works Program, EDA made strategic co-investments to help communities build or expand access to the infrastructure assets that are the building blocks of an economy. These assets supported the growth and economic development of distressed regions. EDA’s Public Works Program invested in traditional infrastructure through this program including water and sewer system improvements, industrial parks, business incubator facilities, expansion of port and harbor facilities, skill-training facilities, and the redevelopment of brownfields. In addition, EDA provided investments to help facilitate the transition of distressed communities to become competitive in the worldwide economy. This was accomplished through the development of key public infrastructure such as technology-based facilities; research and development commercialization centers; facilities for workforce development; wet labs; multi-tenant manufacturing facilities; research, business and science parks with fiber optic cable; and telecommunications infrastructure and development facilities.
The program’s authorizing statute is the Public Works and Economic Development Act (PWEDA) of 1965, as amended (42 U.S.C. § 3121 et seq.).
Statement of Operating Objectives
N/A
Explanation and Justification
No resources are being requested for this grant program.
EDA-17

[THIS PAGE INTENTIONALLY LEFT BLANK]
EDA-18

Exhibit 13 Department of Commerce
Economic Development Administration Economic Development Assistance Programs
PROGRAM CHANGES FOR 2020 (Dollar amounts in thousands)
Public Works Pos./BA
FTE/Obl.
2020 Base
Personnel Amount
0 117,500
0 134,700
2020 Estimate
Personnel Amount
0 0
0 0
Increase/Decrease
from 2020 Base
Personnel Amount
0 -117,500
0 -134,700
EDA is not requesting any resources for its Public Works Program.
EDA-19

[THIS PAGE INTENTIONALLY LEFT BLANK]
EDA-20

Exhibit 10
Department of Commerce
Economic Development Administration
Economic Development Assistance Programs
PROGRAM AND PERFORMANCE: DIRECT OBLIGATIONS (Dollar amounts in thousands)
Activity:
Subactivity:
Economic Development Assistance Programs
Partnership Planning
Line Item
Grants
Total
Pos./BA
FTE/Obl
Pos./BA
FTE/Obl
2018
Actual
Personnel Amount
0 33,000
0 37,944
0 33,000
0 37,944
2019
Enacted
Personnel Amount
0 33,000
0 33,100
0 33,000
0 33,100
2020
Base
Personnel Amount
0 33,000
0 33,100
0 33,000
0 33,100
2020
Estimate
Personnel Amount
0 0
0 0
0 0
0 0
Increase/Decrease
from 2020 Base
Personnel Amount
0 -33,000
0 -33,100
0 -33,000
0 -33,100
EDA-21

[THIS PAGE INTENTIONALLY LEFT BLANK]
EDA-22
Department of Commerce
Economic Development Administration
Economic Development Assistance Programs
JUSTIFICATION OF PROGRAM AND PERFORMANCE (Dollar amounts in thousands)
Activity: Economic Development Assistance Programs Subactivity: Partnership Planning
Goal Statement
Exhibit 12
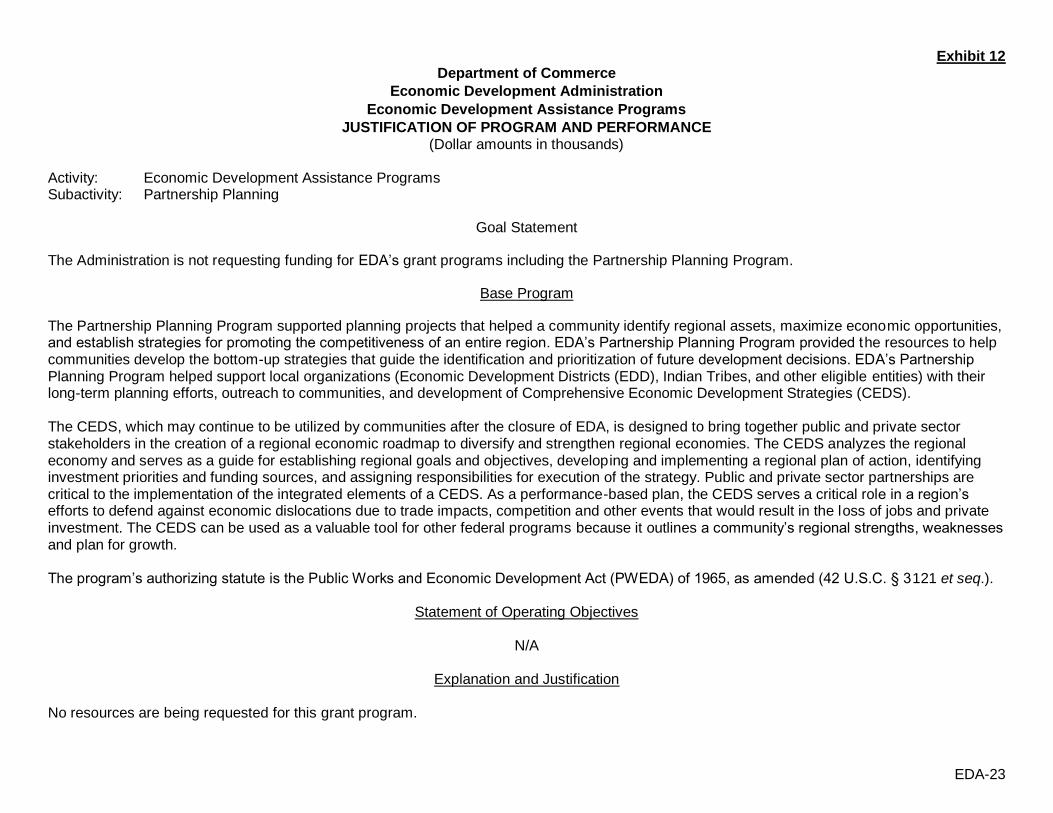
The Administration is not requesting funding for EDA’s grant programs including the Partnership Planning Program.
Base Program
The Partnership Planning Program supported planning projects that helped a community identify regional assets, maximize economic opportunities, and establish strategies for promoting the competitiveness of an entire region. EDA’s Partnership Planning Program provided the resources to help communities develop the bottom-up strategies that guide the identification and prioritization of future development decisions. EDA’s Partnership Planning Program helped support local organizations (Economic Development Districts (EDD), Indian Tribes, and other eligible entities) with their long-term planning efforts, outreach to communities, and development of Comprehensive Economic Development Strategies (CEDS).
The CEDS, which may continue to be utilized by communities after the closure of EDA, is designed to bring together public and private sector stakeholders in the creation of a regional economic roadmap to diversify and strengthen regional economies. The CEDS analyzes the regional economy and serves as a guide for establishing regional goals and objectives, developing and implementing a regional plan of action, identifying investment priorities and funding sources, and assigning responsibilities for execution of the strategy. Public and private sector partnerships are critical to the implementation of the integrated elements of a CEDS. As a performance-based plan, the CEDS serves a critical role in a region’s efforts to defend against economic dislocations due to trade impacts, competition and other events that would result in the loss of jobs and private investment. The CEDS can be used as a valuable tool for other federal programs because it outlines a community’s regional strengths, weaknesses and plan for growth.
The program’s authorizing statute is the Public Works and Economic Development Act (PWEDA) of 1965, as amended (42 U.S.C. § 3121 et seq.).
Statement of Operating Objectives
N/A
Explanation and Justification
No resources are being requested for this grant program.
EDA-23

[THIS PAGE INTENTIONALLY LEFT BLANK]
EDA-24
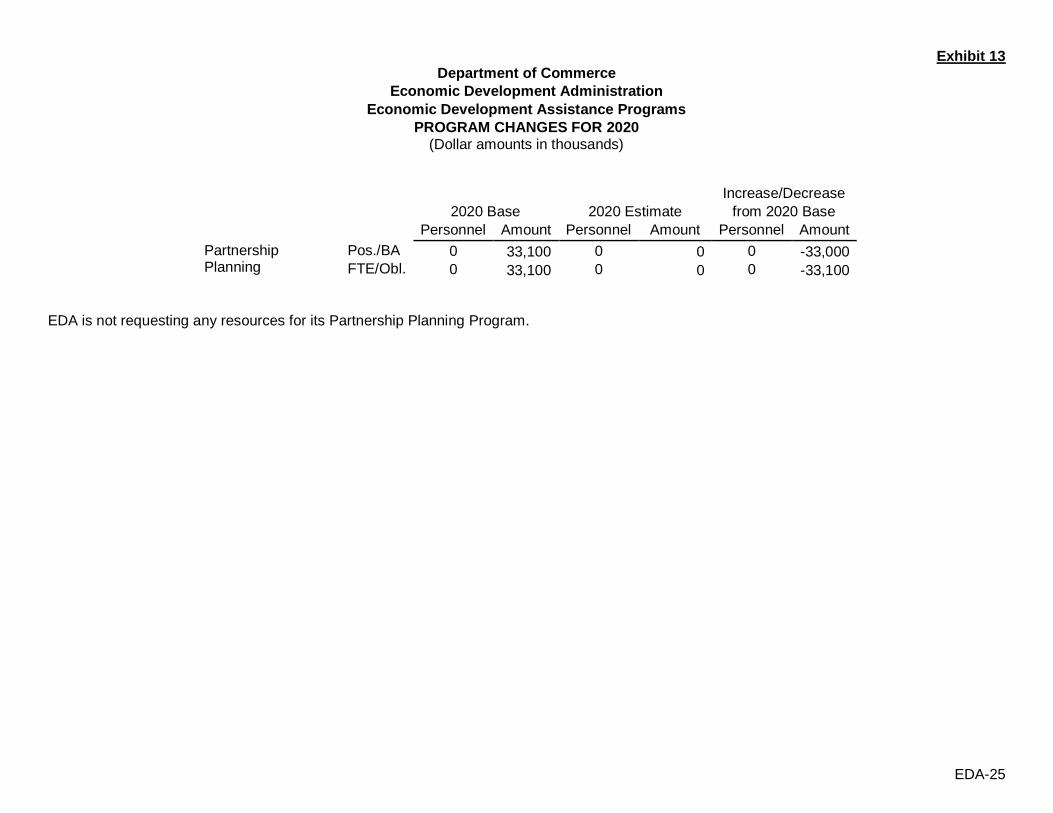
Exhibit 13 Department of Commerce
Economic Development Administration
Economic Development Assistance Programs
PROGRAM CHANGES FOR 2020 (Dollar amounts in thousands)
Partnership Planning
Pos./BA
FTE/Obl.
2020 Base
Personnel Amount
0 33,100
0 33,100
2020 Estimate
Personnel Amount
0 0
0 0
Increase/Decrease
from 2020 Base
Personnel Amount
0 -33,000
0 -33,100
EDA is not requesting any resources for its Partnership Planning Program.
EDA-25

[THIS PAGE INTENTIONALLY LEFT BLANK]
EDA-26

Exhibit 10 Department of Commerce
Economic Development Administration
Economic Development Assistance Programs
PROGRAM AND PERFORMANCE: DIRECT OBLIGATIONS (Dollar amounts in thousands)
Activity:
Subactivity:
Economic Development Assistance Programs
Technical Assistance
Line Item
Grants
Total
Pos./BA
FTE/Obl
Pos./BA
FTE/Obl
2018
Actual
Personnel Amount
0 9,500
0 9,618
0 9,500
0 9,618
2019
Enacted
Personnel Amount
0 9,500
0 10,500
0 9,500
0 10,500
2020
Base
Personnel Amount
0 9,500
0 10,500
0 9,500
0 10,500
2020
Estimate
Personnel Amount
0 0
0 0
0 0
0 0
Increase/Decrease
from 2020 Base
Personnel Amount
0 -9,500
0 -10,500
0 -9,500
0 -10,500
EDA-27

[THIS PAGE INTENTIONALLY LEFT BLANK]
EDA-28

Department of Commerce
Economic Development Administration
Economic Development Assistance Programs
JUSTIFICATION OF PROGRAM AND PERFORMANCE (Dollar amounts in thousands)
Activity: Economic Development Assistance Programs Subactivity: Technical Assistance
Goal Statement
Exhibit 12
The Administration is not requesting funding for EDA’s grant programs including the Technical Assistance Program.
Base Program
EDA oversaw three technical assistance sub-programs (University Center, Local, and National) that promoted economic development and alleviated unemployment, underemployment and out-migration in distressed regions.
The University Center (UC) sub-program was specifically designed to marshal the resources located within colleges and universities to support job creation and economic growth in regions experiencing economic distress. University Centers were required to devote the majority of their funding to respond to technical assistance requests originating from communities and organizations located in the economically distressed areas of their service regions.
The Local Technical Assistance (TA) sub-program was commonly used to analyze the feasibility of a potential economic development project, such as an industrial park or a high-technology business incubator. Economically distressed communities often have a pre-disposition towards the same type of industry that have historically been employers in the area, while market forces may be moving in another direction. Feasibility studies helped determine whether the market would support a particular activity or site.
The National Technical Assistance (TA) sub-program assisted economic development organizations to create new economic development tools that support efforts to attract private investment to regions and local communities. It sought to provide timely information on best practices in economic development critical to practitioners’ efforts to alleviate economic distress and promote economic development. EDA also conducted demonstrations of promising economic development tools and techniques and disseminated the results to state and local organizations as well as urban, rural, and Native American communities. This program identified and funded the collection and dissemination of new knowledge, analysis, and technical information to help communities assess their economic development opportunities.
The National TA sub-program also supported the dissemination and implementation of research and information to economic development policymakers and practitioners.
The program’s authorizing statute is the Public Works and Economic Development Act (PWEDA) of 1965, as amended (42 U.S.C. § 3121 et seq.).
EDA-29

Statement of Operating Objectives
N/A
Explanation and Justification
No resources are being requested for this grant program.
EDA-30

Exhibit 13 Department of Commerce
Economic Development Administration
Economic Development Assistance Programs
PROGRAM CHANGES FOR 2020 (Dollar amounts in thousands)
Technical Assistance
Pos./BA
FTE/Obl.
2020 Base
Personnel Amount
0 9,500
0 10,500
2020 Estimate
Personnel Amount
0 0
0 0
Increase/Decrease
from 2020 Base
Personnel Amount
0 -9,500
0 -10,500
EDA is not requesting any resources for its Technical Assistance Program.
EDA-31

[THIS PAGE INTENTIONALLY LEFT BLANK]
EDA-32
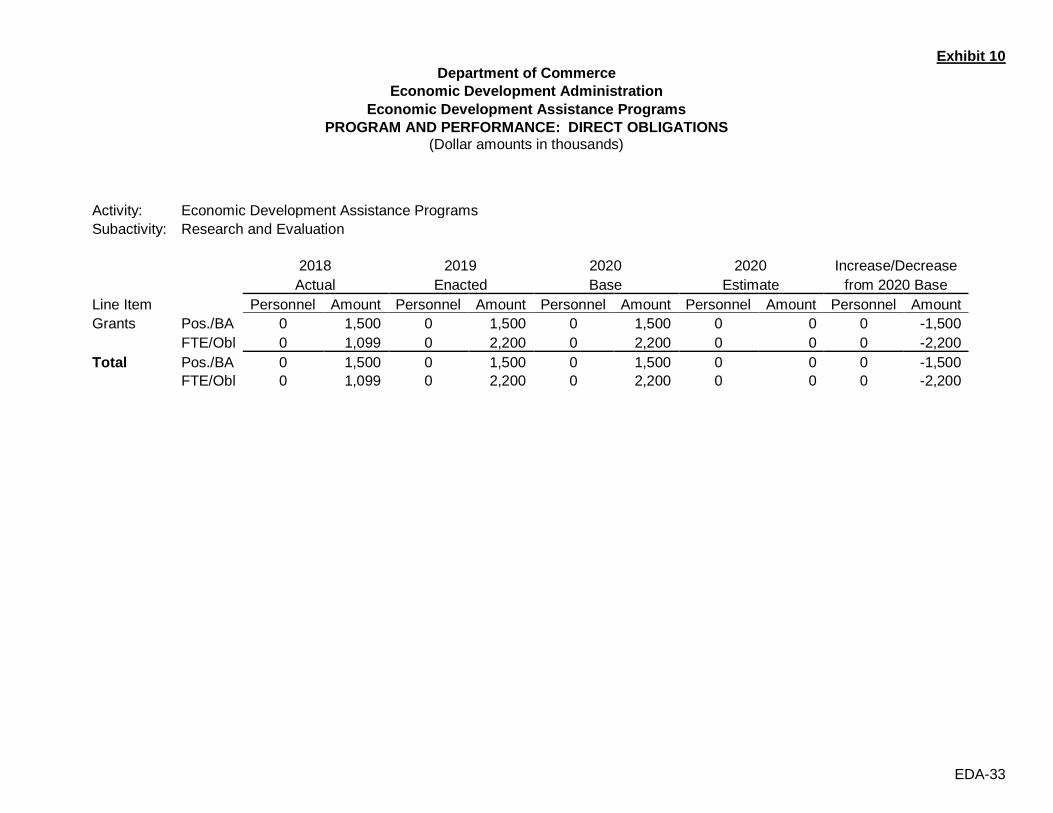
Exhibit 10 Department of Commerce
Economic Development Administration
Economic Development Assistance Programs
PROGRAM AND PERFORMANCE: DIRECT OBLIGATIONS (Dollar amounts in thousands)
Activity:
Subactivity:
Economic Development Assistance Programs
Research and Evaluation
Line Item
Grants
Total
Pos./BA
FTE/Obl
Pos./BA
FTE/Obl
2018
Actual
Personnel Amount
0 1,500
0 1,099
0 1,500
0 1,099
2019
Enacted
Personnel Amount
0 1,500
0 2,200
0 1,500
0 2,200
2020
Base
Personnel Amount
0 1,500
0 2,200
0 1,500
0 2,200
2020
Estimate
Personnel Amount
0 0
0 0
0 0
0 0
Increase/Decrease
from 2020 Base
Personnel Amount
0 -1,500
0 -2,200
0 -1,500
0 -2,200
EDA-33

[THIS PAGE INTENTIONALLY LEFT BLANK]
EDA-34

Department of Commerce
Economic Development Administration
Economic Development Assistance Programs
JUSTIFICATION OF PROGRAM AND PERFORMANCE (Dollar amounts in thousands)
Activity: Economic Development Assistance Programs Subactivity: Research and Evaluation
Goal Statement
Exhibit 12
The Administration is not requesting funding for EDA’s grant programs including the Research and Evaluation Program.
Base Program
EDA’s Research and Evaluation funds supported the development of tools, recommendations, and resources to shape investment decisions and inform policymakers as well as regional planning decision-making at the local level. Research and Evaluation Program investments provided cutting-edge research and evaluation of EDA’s programs, including the identification of best practices, which were disseminated to regional, state, and local practitioners.
EDA’s Research and Evaluation investments were designed to identify and disseminate the best thinking and best practices of economic development in the 21st century. Methodologically sound program evaluations helped to identify the most effective ways to increase the return on taxpayer investment, increase private capital investment, and create higher-skill, higher-wage jobs. The Research and Evaluation Program was carried out through grants and cooperative agreements, as well as through studies conducted in-house by EDA research staff.
The program’s authorizing statute is the Public Works and Economic Development Act (PWEDA) of 1965, as amended (42 U.S.C. § 3121 et seq.).
Statement of Operating Objectives
N/A
Explanation and Justification
No resources are being requested for this grant program.
EDA-35

[THIS PAGE INTENTIONALLY LEFT BLANK]
EDA-36

Exhibit 13 Department of Commerce
Economic Development Administration
Economic Development Assistance Programs
PROGRAM CHANGES FOR 2020 (Dollar amounts in thousands)
Research and Evaluation
Pos./BA
FTE/Obl.
2020 Base
Personnel Amount
0 1,500
0 2,200
2020 Estimate
Personnel Amount
0 0
0 0
Increase/Decrease
from 2020 Base
Personnel Amount
0 -1,500
0 -2,200
EDA is not requesting any resources for its Research and Evaluation Program.
EDA-37

[THIS PAGE INTENTIONALLY LEFT BLANK]
EDA-38
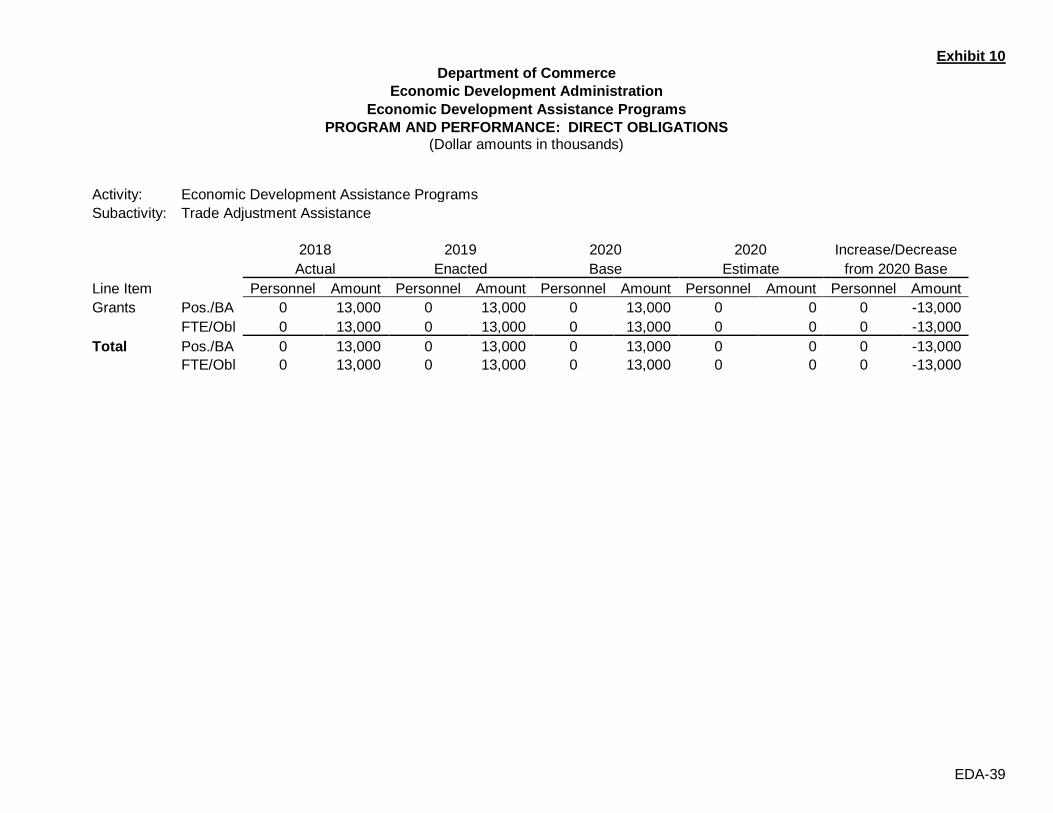
Exhibit 10 Department of Commerce
Economic Development Administration
Economic Development Assistance Programs
PROGRAM AND PERFORMANCE: DIRECT OBLIGATIONS (Dollar amounts in thousands)
Activity:
Subactivity:
Economic Development Assistance Programs
Trade Adjustment Assistance
Line Item
Grants
Total
Pos./BA
FTE/Obl
Pos./BA
FTE/Obl
2018
Actual
Personnel Amount
0 13,000
0 13,000
0 13,000
0 13,000
2019
Enacted
Personnel Amount
0 13,000
0 13,000
0 13,000
0 13,000
2020
Base
Personnel Amount
0 13,000
0 13,000
0 13,000
0 13,000
2020
Estimate
Personnel Amount
0 0
0 0
0 0
0 0
Increase/Decrease
from 2020 Base
Personnel Amount
0 -13,000
0 -13,000
0 -13,000
0 -13,000
EDA-39

[THIS PAGE INTENTIONALLY LEFT BLANK]
EDA-40

Department of Commerce
Economic Development Administration
Economic Development Assistance Programs
JUSTIFICATION OF PROGRAM AND PERFORMANCE (Dollar amounts in thousands)
Activity: Economic Development Assistance Programs Subactivity: Trade Adjustment Assistance
Goal Statement
Exhibit 12
The Administration is not requesting funding for EDA’s grant programs including the Trade Adjustment Assistance for Firms Program.
Base Program
The mission of the Trade Adjustment Assistance for Firms (TAAF) Program was to help import-impacted U.S. firms regain competitiveness in the global marketplace, thereby helping to retain and create U.S. jobs. The program provided cost-shared direct technical assistance in the development of business recovery plans, which are known as Adjustment Proposals (APs) under Section 252 of the Trade Act, as well as federal matching funds to implement projects outlined in the proposals to expand markets, strengthen operations and increase competitiveness. Firms contributed a matching share to create and implement their recovery plans.
The TAAF Program provided technical assistance to help U.S. firms experiencing a decline in sales and employment, resulting in part from the increase in imports of similar or directly competitive articles, to become more competitive in the global marketplace. The TAAF Program was a trade remedy mechanism which, rather than relying on tariffs, quotas or duties, supported free trade by helping trade import-impacted firms and industries regain their economic competitiveness. EDA funded and worked in partnership with a national network of 11 Trade Adjustment Assistance Centers (TAACs).
EDA’s TAAF Program is authorized under chapters 3 and 5 of title II of the Trade Act of 1974, as amended (19 U.S.C. § 2341 et seq.).
Statement of Operating Objectives
N/A
Explanation and Justification
No resources are being requested for this grant program.
EDA-41

[THIS PAGE INTENTIONALLY LEFT BLANK]
EDA-42

Exhibit 13 Department of Commerce
Economic Development Administration
Economic Development Assistance Programs PROGRAM CHANGES FOR 2020
(Dollar amounts in thousands)
Trade Adjustment Assistance Pos./BA
FTE/Obl.
2020 Base
Personnel Amount
0 13,000
0 13,000
2020 Estimate
Personnel Amount
0 0
0 0
Increase/Decrease
from 2020 Base
Personnel Amount
0 -13,000
0 -13,000
EDA is not requesting any resources for its Trade Adjustment Assistance for Firms Program.
EDA-43

[THIS PAGE INTENTIONALLY LEFT BLANK]
EDA-44

Exhibit 10
Department of Commerce
Economic Development Administration
Economic Development Assistance Programs
PROGRAM AND PERFORMANCE: DIRECT OBLIGATIONS (Dollar amounts in thousands)
Activity:
Subactivity:
Economic Development Assistance Programs
Economic Adjustment Assistance
Line Item
Grants
Total
Pos./BA
FTE/Obl
Pos./BA
FTE/Obl
2018
Actual
FTE Amount
0 37,000
0 46,698
0 37,000
0 46,698
2019
Enacted
FTE Amount
0 37,000
0 55,000
0 37,000
0 55,000
2020
Base
FTE Amount
0 37,000
0 55,000
0 37,000
0 55,000
2020
Estimate
FTE Amount
0 0
0 0
0 0
0 0
Increase/Decrease
from 2020 Base
FTE Amount
0 -37,000
0 -55,000
0 -37,000
0 -55,000
EDA-45

[THIS PAGE INTENTIONALLY LEFT BLANK]
EDA-46

Department of Commerce
Economic Development Administration
Economic Development Assistance Programs
JUSTIFICATION OF PROGRAM AND PERFORMANCE (Dollar amounts in thousands)
Activity: Economic Development Assistance Programs Subactivity: Economic Adjustment Assistance
Goal Statement
Exhibit 12
The Administration is not requesting funding for EDA’s grant programs including the Economic Adjustment Assistance (EAA) Program.
Base Program
Part of EDA’s mission was to help distressed communities address problems associated with long-term economic distress, as well as sudden and severe economic dislocations including recovering from the economic impacts of natural disasters, the closure of military installations and other Federal facilities, changing trade patterns, and the depletion of natural resources.
Through the EAA Program, EDA helped local communities design and implement strategies to address evolving economic conditions that were causing or threatened to cause serious structural damage to the underlying economic base or were undermining locally-developed development goals. The EAA Program provided the Agency a robust array of resources that could be brought to bear to support construction, technical assistance, and financing projects that helped distressed communities become more competitive and more prosperous. Specifically, the EAA program provided resources to address the needs of communities impacted by globalization, especially communities that needed to develop and implement collaborative regional innovation strategies to transform and diversify their economies and position them competitively. EAA funds could be used to provide support such as designing a transition strategy, constructing or upgrading public infrastructure, conducting feasibility or environmental studies, supporting construction and operations of incubators and business accelerators, and capitalizing locally or regionally administered Revolving Loan Funds (RLFs).
EDA requires special authority to close down its RLFs (i.e. defederalize), which are designed to run in perpetuity. As of December 2019, EDA oversees about 510 RLFs nationwide, with a combined EDA investment of almost $566 million. EDA’s RLF portfolio has a combined capital base of about $870 million (includes EDA investment plus grantee matching funds plus interest income), of which approximately $331 million is available for lending.
The following language is proposed in the general provisions for the Department of Commerce to allow for the defederalization of EDA’s Revolving Loan Fund grants:
SEC. 543. Section 601(d)(2) of the Public Works and Economic Development Act of 1965, as amended (42 U.S.C. 3211), is amended—
(1) by striking ‘‘(2) RELEASE.—’’ and inserting the following:
EDA-47

‘‘(2) RELEASE.— ‘‘(A) IN GENERAL.—’’; and
(2) by adding at the end the following: ‘‘(B) REVOLVING LOAN FUND PROGRAM.— The Secretary may release, subject to terms and conditions the Secretary determines appropriate, the Federal Government’s interest in
connection with a grant under section 209(d) not less than 7 years after final disbursement of the grant, if— ‘‘(i) the recipient has carried out the terms of the award in a satisfactory manner; ‘‘(ii) any proceeds realized from the release of the Federal Government’s interest will be used for one or more activities that continue to carry
out the economic development purposes of this Act; and ‘‘(iii) the recipient shall provide adequate assurance to the Secretary that at all times after release of the Federal Government’s interest in
connection with the grant, the recipient will be responsible for continued compliance with the requirements of section 602 in the same manner it was responsible prior to release of the Federal Government’s interest and that the recipient’s failure to comply shall result in the Secretary taking appropriate action’’.
The EAA Program provided strategic investments to support economic recovery in regions affected by natural disasters, natural resource depletion, mass layoffs, and other severe economic shocks; assisted communities in restructuring and diversifying regional economies buffeted by steep declines in traditional sources of employment such as manufacturing, agriculture, fishing, or logging; and aided communities suffering from chronic unemployment and underinvestment. EDA also used it to fund investments to respond to communities impacted by military Base Realignments and Closures (BRAC).
The program’s authorizing statute is the EDA’s Public Works and Economic Development Act (PWEDA) of 1965, as amended (42 U.S.C. § 3121 et seq.).
Statement of Operating Objectives
N/A
Explanation and Justification
No resources are being requested for this grant program.
EDA-48
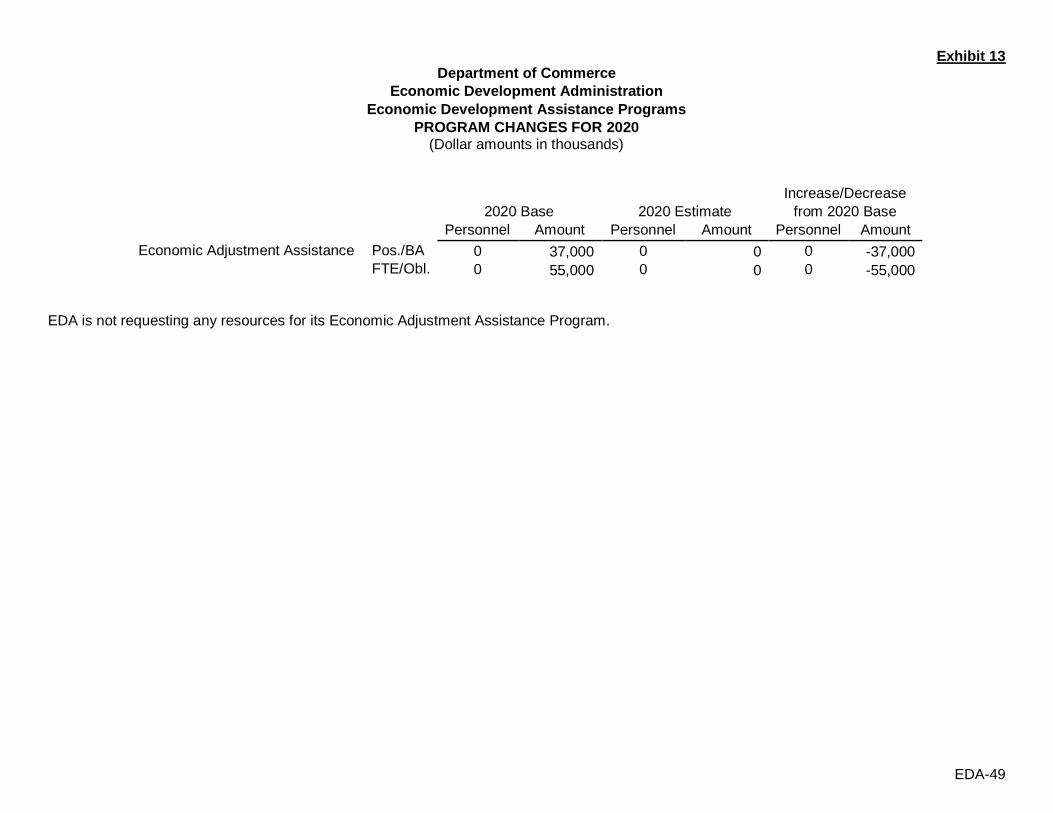
Exhibit 13 Department of Commerce
Economic Development Administration
Economic Development Assistance Programs
PROGRAM CHANGES FOR 2020 (Dollar amounts in thousands)
Economic Adjustment Assistance Pos./BA
FTE/Obl.
2020 Base
Personnel Amount
0 37,000
0 55,000
2020 Estimate
Personnel Amount
0 0
0 0
Increase/Decrease
from 2020 Base
Personnel Amount
0 -37,000
0 -55,000
EDA is not requesting any resources for its Economic Adjustment Assistance Program.
EDA-49

[THIS PAGE INTENTIONALLY LEFT BLANK]
EDA-50
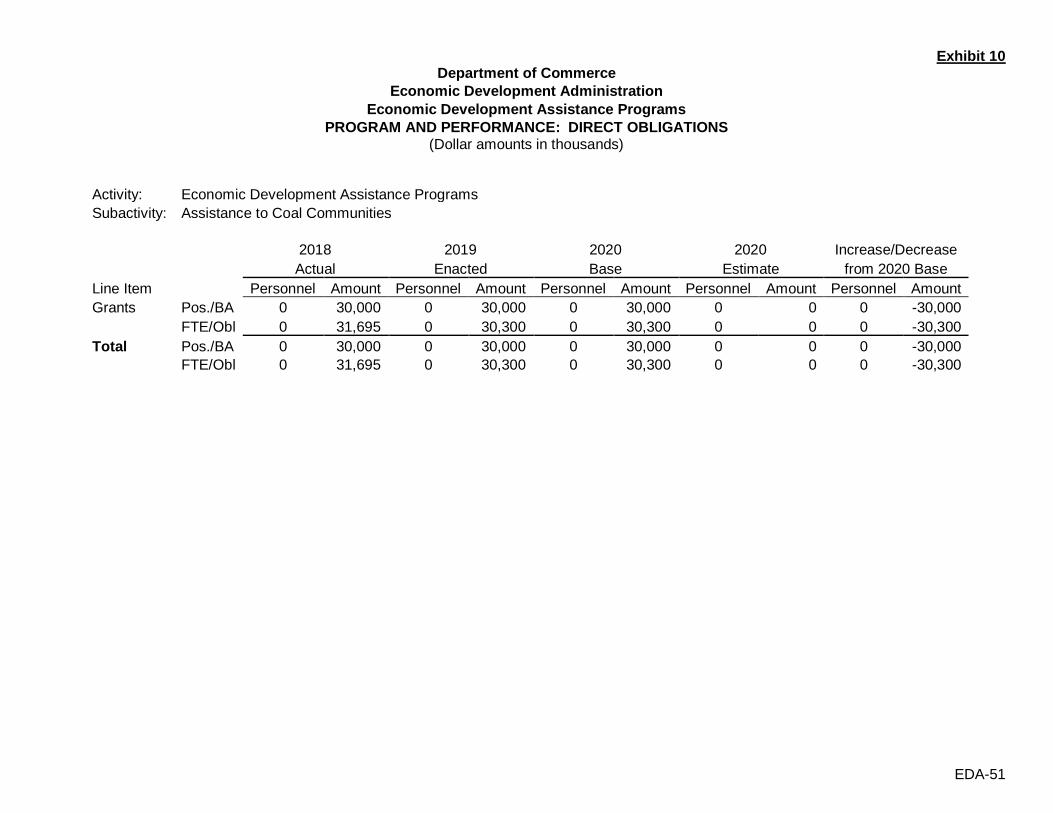
Exhibit 10 Department of Commerce
Economic Development Administration
Economic Development Assistance Programs
PROGRAM AND PERFORMANCE: DIRECT OBLIGATIONS (Dollar amounts in thousands)
Activity:
Subactivity:
Economic Development Assistance Programs
Assistance to Coal Communities
Line Item
Grants
Total
Pos./BA
FTE/Obl
Pos./BA
FTE/Obl
2018
Actual
Personnel Amount
0 30,000
0 31,695
0 30,000
0 31,695
2019
Enacted
Personnel Amount
0 30,000
0 30,300
0 30,000
0 30,300
2020
Base
Personnel Amount
0 30,000
0 30,300
0 30,000
0 30,300
2020
Estimate
Personnel Amount
0 0
0 0
0 0
0 0
Increase/Decrease
from 2020 Base
Personnel Amount
0 -30,000
0 -30,300
0 -30,000
0 -30,300
EDA-51

[THIS PAGE INTENTIONALLY LEFT BLANK]
EDA-52

Department of Commerce
Economic Development Administration
Economic Development Assistance Programs
JUSTIFICATION OF PROGRAM AND PERFORMANCE (Dollar amounts in thousands)
Activity: Economic Development Assistance Programs Subactivity: Assistance to Coal Communities
Goal Statement
Exhibit 12
The Administration is not requesting funding for EDA’s grant programs including the Assistance to Coal Communities Program.
Base Program
This program competitively awarded grants to coalitions of regionally-driven economic development and workforce development organizations anchored in impacted coal communities. These grants enabled grantees to take deliberate and measured steps to build economic resilience and industry diversification, and promote new job creation opportunities. Eligible activities included helping communities: organize themselves to respond on behalf of affected workers and businesses; strengthen or develop targeted industry clusters; prepare and train the existing workforce for new jobs; and help and execute coordinated economic and workforce development activities based on communities’ strategic plans. These activities should result in more competitive and resilient “pipelines” of skilled workers moving into new job opportunities.
This program line was created by the Consolidated and Further Continuing Appropriation Act, 2015 (PL 113-235) and is executed using EDA’s current program authorities pursuant to EDA’s authorizing statute, the Public Works and Economic Development Act (PWEDA) of 1965, as amended (42 U.S.C. § 3121 et seq.).
Statement of Operating Objectives
N/A
Explanation and Justification
No resources are being requested for this grant program.
EDA-53

[THIS PAGE INTENTIONALLY LEFT BLANK]
EDA-54

Exhibit 13 Department of Commerce
Economic Development Administration
Economic Development Assistance Programs
PROGRAM CHANGES FOR 2020 (Dollar amounts in thousands)
Assistance to Coal Communities Pos./BA
FTE/Obl.
2020 Base
Personnel Amount
0 30,000
0 30,300
2020 Estimate
Personnel Amount
0 0
0 0
Increase/Decrease
from 2020 Base
Personnel Amount
0 -30,000
0 -30,300
EDA is not requesting any resources for its Assistance to Coal Communities Program.
EDA-55

[THIS PAGE INTENTIONALLY LEFT BLANK]
EDA-56

Exhibit 10 Department of Commerce
Economic Development Administration
Economic Development Assistance Programs
PROGRAM AND PERFORMANCE: DIRECT OBLIGATIONS (Dollar amounts in thousands)
Activity:
Subactivity:
Economic Development Assistance Programs
Regional Innovation
Line Item
Grants
Total
Pos./BA
FTE/Obl
Pos./BA
FTE/Obl
2018
Actual
Personnel Amount
0 21,000
0 0
0 21,000
0 0
2019
Enacted
Personnel Amount
0 23,500
0 44,800
0 23,500
0 44,800
2020
Base
Personnel Amount
0 23,500
0 44,800
0 23,500
0 44,800
2020
Estimate
Personnel Amount
0 0
0 0
0 0
0 0
Increase/
(Decrease)
Personnel Amount
0 -23,500
0 -44,800
0 -23,500
0 -44,800
EDA-57

[THIS PAGE INTENTIONALLY LEFT BLANK]
EDA-58

Department of Commerce
Economic Development Administration
Economic Development Assistance Programs
JUSTIFICATION OF PROGRAM AND PERFORMANCE (Dollar amounts in thousands)
Activity: Economic Development Assistance Programs Subactivity: Regional Innovation
Goal Statement
Exhibit 12
The Administration is not requesting funding for EDA’s grant programs including the Regional Innovation Program (RIP).
Base Program
The RIP was a distinct program in EDA’s portfolio that awarded funds to a broad range of communities and entities to develop and strengthen high-growth, innovation-based regional economies. The program aimed to build local capacity for economic growth through strategic investment opportunities that leverage the innovation capacity found in America’s regions by supporting sector- and cluster-based, high-growth entrepreneurship.
The RIP had two components identified through its authorizing legislation: Cluster Grants and the Regional Innovation Research and Information (RIRI) Program. Cluster Grants supported activities relating to the formation and development of regional innovation clusters. The RIRI Program was designed to provided research, technical assistance, performance metrics and data pertaining to regional innovation strategies and clusters. To date, all funding had been allocated to the Cluster Grants.
This program’s authorizing statute is Section 27 of the Stevenson-Wydler Technology Innovation Act of 1980, as amended (13 U.S.C. § 3722).
Statement of Operating Objectives
N/A
Explanation and Justification
No resources are being requested for this grant program.
EDA-59

[THIS PAGE INTENTIONALLY LEFT BLANK]
EDA-60

Exhibit 13 Department of Commerce
Economic Development Administration
Economic Development Assistance Programs PROGRAM CHANGES FOR 2020
(Dollar amounts in thousands)
Regional Innovation
Pos./BA
FTE/Obl.
2020 Base
Personnel Amount
0 23,500
0 44,800
2020 Estimate
Personnel Amount
0 0
0 0
Increase/Decrease
from 2020 Base
Personnel Amount
0 -23,500
0 -44,800
EDA is not requesting any resources for its Regional Innovation Program.
EDA-61

[THIS PAGE INTENTIONALLY LEFT BLANK]
EDA-62

Exhibit 16
Department of Commerce
Economic Development Administration
Economic Development Assistance Programs SUMMARY OF REQUIREMENTS BY OBJECT CLASS
(Dollar amounts in thousands)
2018 2019 2020 2020 Increase/Decrease
Object Class Actual Enacted Base Estimate over 2020 Base
41 Grants, subsidies and contributions 396,653 799,894 799,894 0 (799,894)
99.9 Total Obligations 396,653 799,894 799,894 0 (799,894)
Less prior year recoveries 34,111 34,986 34,986 32,000 (2,986)
Less prior year unobligated balance 43,950 529,408 529,408 15,500 (513,908)
Less unobligated balance transferred (4,500) (4,000) (4,000) (4,000) 0
Less unobligated balance, end of year (529,408) (15,500) (15,500) (8,500) 7,000
Less rescission (10,000) (10,000) (10,000) (35,000) (25,000)
Total Budget Authority 862,500 265,000 265,000 0 (265,000)
Personnel Data
Full-Time equivalent Employment:
Full-time permanent 0 0 0 0 0
Other than full-time permanent 0 0 0 0 0
Total 0 0 0 0 0
Authorized Positions:
Full-time permanent 0 0 0 0 0
Other than full-time permanent 0 0 0 0 0
Total 0 0 0 0 0
EDA-63

[THIS PAGE INTENTIONALLY LEFT BLANK]
EDA-64

Exhibit 32
Department of Commerce
Economic Development Administration
Economic Development Assistance Programs JUSTIFICATION OF PROPOSED LANGUAGE CHANGES
(Dollar amounts in thousands)
FY 2020
This language is proposed for the orderly closedown of the Economic Development Administration and its grants and loans previously awarded.
ECONOMIC DEVELOPMENT ASSISTANCE PROGRAMS In addition to amounts made available to the Economic Development Administration under the heading "Salaries and Expenses", unobligated balances previously appropriated under this heading, to remain available until expended, for purposes of the closure of the Economic Development Administration, including but not limited to, ongoing administration, oversight and monitoring of grants and loans previously awarded by the Economic Development Administration, whether expended by the Economic Development Administration or a successor operating unit within the Department of Commerce: provided, that such funds will be available to such successor operating unit in addition to any other amounts that may be appropriated for the necessary expenses of such operating unit from whatever source.
EDA-65

[THIS PAGE INTENTIONALLY LEFT BLANK]
EDA-66

Exhibit 33
Department of Commerce
Economic Development Administration
Economic Development Assistance Programs APPROPRIATION LANGUAGE AND CODE CITATION
FY 2020
Economic Development Assistance Programs
1 For necessary expenses of the economic development assistance programs as provided for by law,
42 U.S.C. 3214(c), 3231
42 U.S.C. 3214(c) - Authorizes the transfer of appropriated funds from other Federal agencies, if such funds are used for the purpose for which (and in accordance with the terms under which) the funds are specifically authorized and appropriated.
42 U.S.C. 3231 - Authorizes funds to be appropriated for economic development assistance programs to carry out 42 U.S.C. 3121 et seq., through fiscal year 2008, to remain available until expended.
2 Authorization of appropriations for defense conversion activities,
42 U.S.C. 3232
42 U.S.C. 3232(a) - In addition to amounts made available under section 3231 of this title, there are authorized to be appropriated such sums as are necessary to carry out section 3149(c)(1) of this title, to remain available until expended.
42 U.S.C. 3232(b) - Funds made available under subsection (a) of this section may be used for activities including pilot projects for privatization of, and economic development activities for, closed or realigned military or Department of Energy installations.
3 Authorization of appropriations for disaster economic recovery activities,
42. U.S.C. 3233
42. U.S.C. 3233(a) - In addition to amounts made available under section 3231 of this title, there are authorized to be appropriated such sums as are necessary to carry out section 3149(c)(2) of this title, to remain available until expended.
42. U.S.C. 3233(b) - The Federal share of the cost of activities funded with amounts made available under subsection (a) of this section shall be up to 100 percent.
4 Funding for grants for planning and grants for administrative expenses,
EDA-67

42 U.S.C. 3234
Of the amounts made available under section 3231 of this title for each fiscal year, not less than $27,000,000 shall be made available for grants provided under section 3143 of this title.
5 Provided, that these funds may be used to monitor projects approved pursuant to title I of the Public Works Employment Act of 1976, as amended,
42 U.S.C. 6710
42 U.S.C. 6710 - Authorized appropriations for the administration of the Local Public Works Capital Development and Investment Act of 1976.
6 Title II of the Trade Act of 1974, as amended, and 19 U.S.C. 2345 – Authorizes appropriations to carry out Trade Adjustment Assistance for Firms (TAAF),
Public Law No: 114-27, Trade Preferences Extension Act of 2015. Title IV of that Act, entitled the “Trade Adjustment Assistance Reauthorization Act of 2015” extends the authorization of appropriations for TAAF through fiscal year 2021.
7 The Community Emergency Drought Relief Act of 1977 (including monitoring and close out),
42 U.S.C. 5184 note
42 U.S.C. 5184 note - Authorized appropriations to carry out those provisions of the Community Emergency Drought Relief Act of 1977.
8 For section 27 of the Stevenson-Wydler Technology Innovation Act of 1980 (15 U.S.C. 3722).
EDA-68

Exhibit 5 Department of Commerce
Economic Development Administration Salaries and Expenses
SUMMARY OF RESOURCE REQUIREMENTS (Dollar amounts in thousands)
Budget Direct
Positions FTE Authority Obligations
FY 2019 CR Annualization 199 0 39,000 43,000
2019 Adjustments to base:
Plus: Restoration of recoveries/unobligated balances used to offset 20CY appropriation/non-recurring 0 0
Plus: Inflationary/Adjustments to base 773 773
Less: Estimated recoveries, 2019 0 0
2020 Base 199 0 39,773 43,773
Plus: 2020 Program changes (101) 0 (9,823) (12,063)
2020 Estimate 98 0 29,950 31,710
Comparison by activity / subactivity 2018 2019 2020 2020 Increase/Decrease
with totals by activity Actual Enacted Base Estimate from 2020 Base
Personnel Amount Personnel Amount Personnel Amount Personnel Amount Personnel Amount
EDA -77 Operations Pos./BA 193 39,000 199 39,000 199 39,773 98 29,950 (101) (9,823)
FTE/Obl. 175 39,745 180 45,000 180 45,773 98 33,710 (82) (12,063)
Total Pos./BA 193 39,000 199 39,000 199 39,773 98 29,950 (101) (9,823)
FTE/Obl. 175 39,745 180 45,000 180 45,773 98 33,710 (82) (12,063)
Adjustments for:
Recoveries 0 0 0 0 0
Unobligated balance, start of year (3,857) (3,860) (3,860) (1,660) 2,200
Unobligated balance transferred 0 0 0 0 0
Unobligated balance, end of year 3,860 1,660 1,660 700 (960)
Unobligated balance expiring 752 200 200 200 0
Financing from transfers:
Transfer from other accounts (-) (1,500) (4,000) (4,000) (3,000) 1,000
Transfer to other accounts (+) 0 0 0 0 0
Appropriation 39,000 39,000 39,773 29,950 (9,823)
EDA-69

[THIS PAGE INTENTIONALLY LEFT BLANK]
EDA-70

Exhibit 6 Department of Commerce
Economic Development Administration Salaries and Expenses
SUMMARY OF REIMBURSABLE OBLIGATIONS (Dollar amounts in thousands)
2018 2019 2020 2020 Increase/Decrease
Comparison by activity: Actual Enacted Base Estimate from 2020 Base
Personnel Amount Personnel Amount Personnel Amount Personnel Amount Personnel Amount
Operations Pos./BA 0 4,600 0 4,000 0 4,000 0 0 0 -4,000
FTE/Obl. 0 3,119 0 3,000 0 3,000 0 2,000 0 -1,000
Total Pos./BA 0 4,600 0 4,000 0 4,000 0 0 0 -4,000
FTE/Obl. 0 3,119 0 3,000 0 3,000 0 2,000 0 -1,000
EDA-71

[THIS PAGE INTENTIONALLY LEFT BLANK]
EDA-72

Exhibit 7 Department of Commerce
Economic Development Administration
Salaries and Expenses
SUMMARY OF FINANCING (Dollar amounts in thousands)
2018 2019 2020 2020 Increase/Decrease
Actual Enacted Base Estimate from 2020 Base
Total Obligations 42,864 48,000 48,773 35,710 (13,063)
Offsetting collections from:
Federal funds (4,600) (4,000) (4,000) 0 4,000
Trust funds 0 0 0 0 0
Non-Federal sources 0 0 0 0 0
Recoveries 0 0 0 0 0
Unobligated balance, start of year (4,575) (6,059) (6,059) (4,859) 1,200
Unobligated balance, transferred 0 0 0 0 0
Unobligated balance, end of year 6,059 4,859 4,859 1,899 (2,960)
Unobligated balance, expiring 752 200 200 200 0
Budget Authority 40,500 43,000 43,773 32,950 (10,823)
Financing:
Transfer from other accounts (-) (1,500) (4,000) (4,000) (3,000) 1,000
Transfer to other accounts (+) 0 0 0 0 0
Appropriation 39,000 39,000 39,773 29,950 (9,823)
EDA-73

[THIS PAGE INTENTIONALLY LEFT BLANK]
EDA-74

Exhibit 8 Department of Commerce
Economic Development Administration
Salaries and Expenses
ADJUSTMENTS TO BASE (Dollar amounts in thousands)
FTE Amount
Transfers of Estimates 0 0
Adjustment 0 0
Financing 0 0
Other Changes
2019 Pay raise 94
2020 Pay raise 0 0
Full-year cost in 2020 of positions financed for part-year in 2019 0 0
Change in compensable days 91
Civil Service Retirement System (CSRS) (28)
Federal Employees Retirement System (FERS) 495
Thrift Savings Plan 8
Federal Insurance Contribution Act (FICA) - OASDI 23
Health insurance 47
Employees Compensation Fund (39)
Travel:
Mileage 6
Per diem 10
Rental payments to GSA 62
Postage 0
Printing and reproduction 0
NARA Storage & Maintenance 3
Other services:
Working Capital Fund 0
Grants 0
Subtotal, other changes 0 773
Total, adjustments to base 0 773
EDA-75

[THIS PAGE INTENTIONALLY LEFT BLANK]
EDA-76

Exhibit 10 Department of Commerce
Economic Development Administration Salaries and Expenses
PROGRAM AND PERFORMANCE: DIRECT OBLIGATIONS (Dollar amounts in thousands)
Activity:
Subactivity:
Salaries and Expenses
Operations
Line Item
2018
Actual
2019
Enacted
2020
Base
2020
Estimate
Increase/Decrease
from 2020 Base
Personnel Amount Personnel Amount Personnel Amount Personnel Amount Personnel Amount
Operations
Total
Pos./BA
FTE/Obl
Pos./BA
FTE/Obl
193
175
193
175
39,000
39,745
39,000
39,745
199
180
199
180
39,000
45,000
39,000
45,000
199
180
199
180
39,773
45,773
39,773
45,773
98
98
98
98
29,950
33,710
29,950
33,710
-101
-82
-101
-82
-9,823
-12,063
-9,823
-12,063
EDA-77

[THIS PAGE INTENTIONALLY LEFT BLANK]
EDA-78
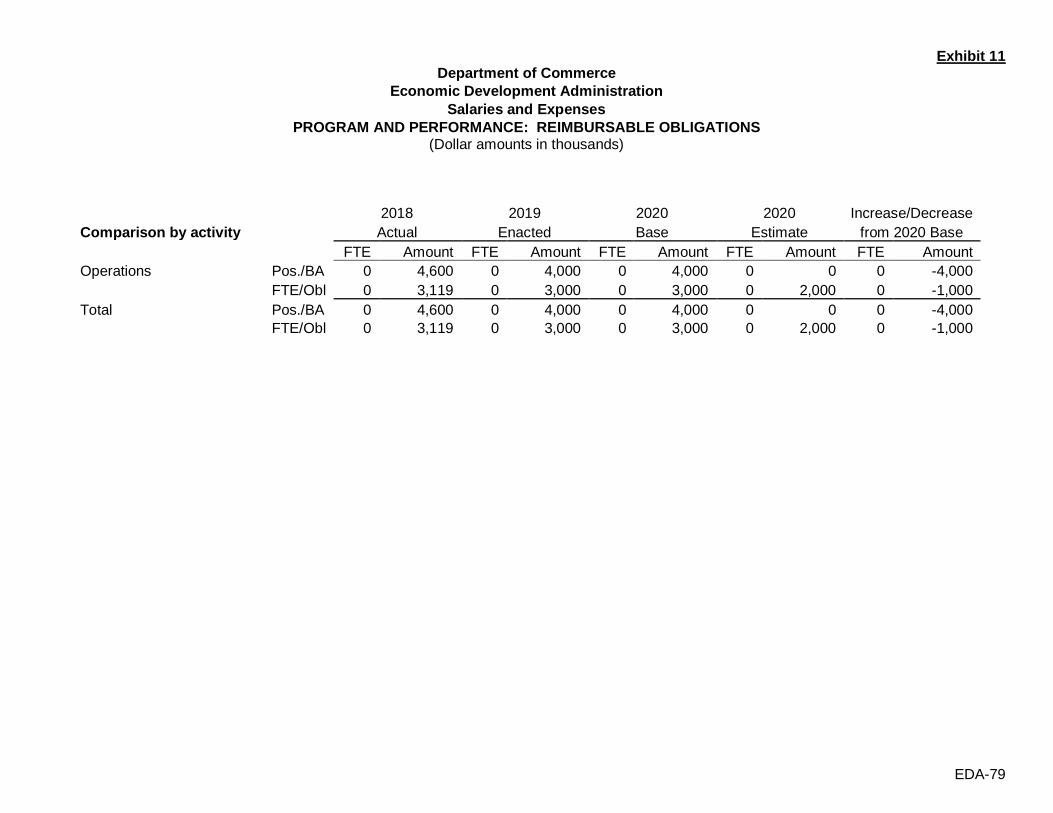
Exhibit 11 Department of Commerce
Economic Development Administration
Salaries and Expenses
PROGRAM AND PERFORMANCE: REIMBURSABLE OBLIGATIONS (Dollar amounts in thousands)
Comparison by activity
2018
Actual
2019
Enacted
2020
Base
2020
Estimate
Increase/Decrease
from 2020 Base
FTE Amount FTE Amount FTE Amount FTE Amount FTE Amount
Operations Pos./BA
FTE/Obl
0
0
4,600
3,119
0
0
4,000
3,000
0
0
4,000
3,000
0
0
0
2,000
0
0
-4,000
-1,000
Total Pos./BA
FTE/Obl
0
0
4,600
3,119
0
0
4,000
3,000
0
0
4,000
3,000
0
0
0
2,000
0
0
-4,000
-1,000
EDA-79

[THIS PAGE INTENTIONALLY LEFT BLANK]
EDA-80

Exhibit 12 Department of Commerce
Economic Development Administration Salaries and Expenses
JUSTIFICATION OF PROGRAM AND PERFORMANCE (Dollar amounts in thousands)
Activity: Subactivity:
Salaries and Expenses Operations
Goal Statement
For 2020, EDA requests a decrease of $9.0 million and 101 positions below the 2019 enacted level, for a total of approximately $30 million and 98 positions for the Salaries and Expenses (S&E) account.
Base Program
The Salaries and Expenses appropriation generally supports the orderly closedown of EDA and the on-going administration, monitoring, and close out of grants and loans previously awarded by EDA. These activities will be carried out through a steadily reducing footprint consisting of headquarters located in Washington, DC, and six Regional Offices located in Atlanta, Austin, Chicago, Denver, Philadelphia, and Seattle.
Executive Direction: The Assistant Secretary directs the Bureau’s programs and is responsible for the conduct of all closedown activities at EDA’s headquarters and Regional Offices, subject to the policies and directives prescribed by the Secretary of Commerce.
The Deputy Assistant Secretary and Chief Operating Officer assists the Assistant Secretary in all matters affecting EDA and performs the duties of the Assistant Secretary during the latter’s absence.
Office of the Chief Counsel: The Office of the Chief Counsel (OCC) prepares and reviews legal documents to ensure that the orderly closedown of EDA and on-going administration of previous grants and loans are consist with applicable legal requirements imposed on EDA programs by statute, regulation, executive order, OMB circular, or controlling policy document. The Chief Counsel directs and supervises the activities of the OCC, including those of EDA’s six Regional Counsels in the field. OCC provides a full range of legal services incident to federal assistance law, such as reviewing the acceptability of title to property, sufficiency of diverse property-related agreements, and post-approval matters, such as resolving complex property issues relating to the use and disposition of project assets.
Office of Information Technology: The Office of Information Technology (OIT) develops and manages strategic information technology (IT) plans, annual IT operating plans and budgets, and IT capital asset plans and budgets. The Chief Information Officer directs and supervises the activities of the IT Office, including information security, maintenance, and oversight of day-to-day operations.
The base program budget includes costs for providing information technology and computer system support for EDA, including those necessary for the on-going administration, monitoring, and close out of previous grants and loans awarded by EDA. This support includes the information
EDA-81
security, maintenance, installation, operation, and support for all major information systems, networks, data bases, computers and office automation tools used in the Bureau by its executives, managers, and employees as EDA closes down.
The base program budget also establishes maintenance and support of the local computer networks that connect personal computers, printers, other devices and file shares, in and among the EDA offices (headquarters, the regional offices, and the remote Economic Development Representatives offices). The network provides the electronic mail system, support for other applications, and linkages to the external network that provides Internet services. The technical expertise and support costs necessary for the establishment, enhancement, and maintenance of the EDA public and internal Web sites that provide services to the government and to the public necessary for an effective closedown of EDA are also included in the base program costs.
Office of Finance and Management Services: The Chief Financial Officer/Chief Administration Officer (CFO/CAO) is the senior official for financial and administrative management within EDA. As such, the CFO/CAO is responsible for managing EDA’s budget execution, managing financial and accounting activities, directs EDA’s efforts related to preparation of financial statements and the annual financial audit, and coordinating and evaluating internal management control systems. The CFO/CAO is also responsible for providing administrative support services for EDA headquarters and oversight of these services at the Regional Offices, for those services not already provided at the Departmental level. These service areas include acquisition management, human capital management, facilities, real and personal property, records management, and other support activities.
The Administration Division provides a full range of non-financial administrative services, unless otherwise provided at the Department level, for EDA headquarters and oversight of these services at the Regional Offices. The Division provides records and property management, human capital management, procurement management, security oversight, loan management, audit oversight and resolution management, continuity of operations planning, and other support activities.
The Budget and Finance Division, in concert with bureau and Departmental officials, develops, prepares, and executes the annual EDA budget. The Division is responsible for the fiscal aspects of EDA programs, including programs entrusted to other Federal agencies, by monitoring fiscal controls for program and administrative expenses including accounting and financial statement preparation, allotment of funds, operating budgets, staffing limitations, and analysis of reports and resource proposals, consistent with the requirements of the Anti-Deficiency Act.
Office of External Affairs: The Director of External Affairs coordinates EDA’s public affairs, legislative affairs and executive secretariat activities, and acts as point of contact for members of Congress, Congressional staff, other Federal agencies, state and local governments, the media, and the general public. The Division provides appropriate and comprehensive bureau information necessary to respond to Secretarial, Congressional, intergovernmental, other Federal bureau, and public requests related to the closedown of EDA, and prepares and processes controlled correspondence relating to grants and other bureau business.
The Public Affairs Division staff interacts with the public on behalf of EDA, and is responsible for the form, appearance, and content of all materials and information provided to EDA stakeholders, partners, customers, and the general public.
The Legislative Affairs Division coordinates all activities relating to EDA relations and interactions with members of Congress, Congressional staff, other federal agencies, state and local elected officials, and other governmental and non-governmental organizations through all manner of written and verbal communication.
EDA-82

Office of Regional Affairs: The Deputy Assistant Secretary for Regional Affairs oversees program operations in the six regional offices, the Performance and National Programs Division, Trade Adjustment Assistance Division, Economic Development Integration, Operations, Policy and Compliance. As part of this responsibility, the Deputy Assistant Secretary for Regional Affairs ensures a bureau-wide focus on closing down EDA effectively; and the development and implementation of adequate internal controls to ensure EDA exercises adequate fiduciary oversight of its programs as it closes down. The Office of Regional Affairs develops and maintains program guidance, policies, directives, and operating procedures to ensure efficient administration of EDA’s financial assistance programs as the bureau closes down.
The Performance and National Programs Division measures EDA program performance with an eye to improving internal controls and promoting best practices that will result in efficient closedown of EDA. The Performance and National Programs staff is also responsible for oversight, monitoring and close out of research and national technical assistance grants as the bureau closes down. They will also handle all close out performance reporting to the Office of Management and Budget, the Department, Congress and other stakeholders.
The Trade Adjustment Assistance Division is responsible for oversight, monitoring and close out of grants to Trade Adjustment Assistance Centers (TAACs) across the nation which provide technical assistance to manufacturing firms to help them increase their global competitiveness.
The six Regional Offices include the six Regional Directors and their supporting operational, technical, and administrative personnel. Regional Directors are responsible for the closedown of EDA’s programs within specific geographic regions, the management of regional resources, and the monitoring and servicing of previously funded projects. The Regional Offices are staffed with Regional Counsels who provide the legal reviews required to administer and closedown EDA investments. The Regional staffs monitor and service approved projects at the local level.
Office of Innovation and Entrepreneurship: The Office of Innovation and Entrepreneurship (OIE) will monitor and service previously funded EDA grants that focused on promoting and supporting high-growth entrepreneurship and accelerating commercialization of federally funded research. OIE will ensure that these grants are closed out in a timely manner consistent with EDA’s overall shutdown plan.
Statement of Operating Objectives
Support the orderly closedown of EDA and the on-going administration, monitoring, and close out of grants and loans previously awarded by EDA.
Explanation and Justification
The EDA worked directly with local economic development officials to support their bottom-up, regionally-owned economic development initiatives. Linking EDA’s investments to a community’s strategic economic development plan enables the federal government to better leverage public and private sector investments to achieve economic development goals. Economic development is about creating the conditions for sustained economic growth and improved quality of life and prosperity for our citizens by expanding the capacity of individuals, firms, and communities to maximize the use of their talents and skills to support innovation, lower transaction costs, and responsibly produce and trade valuable goods and services.
The way in which EDA had such a dramatic impact all across the country is through its Comprehensive Economic Development Strategy planning requirements. Economic development planning through the Comprehensive Economic Development Strategies (CEDS) is not only a cornerstone of EDA’s programs, but successfully serves as a means to engage the community and region in building the regional capacity to ultimately create an environment for regional economic prosperity. EDA’s successful model of economic development included the following key elements: focusing on regional economic ecosystems and bottom-up strategies; and leveraging regional assets to the fullest extent - businesses, existing and emerging industry clusters, supply chains, technology, infrastructure, institutions of higher learning, and human talent.
EDA-83
EDA’s programs were designed to provide a full range of tools and resources that can help communities build the capacity to capitalize on their full economic potential—whether by addressing an immediate critical infrastructure need, assisting with the development of a regional strategic plan, or helping a community connect to the worldwide marketplace. To build long-term capacity for sustained economic growth, EDA invested in partnership with our local communities to build strategic economic development assets which support long-term growth and competitiveness. These partnerships had a laser focus: catalyze private investment; leverage resources to support the establishment and growth of globally competitive businesses; as well as strengthen innovation, manufacturing supply chains, an employer-driven, skilled workforce, exports, and foreign direct investment.
EDA-84

Exhibit 13 Department of Commerce
Economic Development Administration Salaries and Expenses
PROGRAM INCREASES FOR 2020 (Dollar amounts in thousands)
Increase/Decrease
2020 Base 2020 Estimate from 2020 Base
Personnel Amount Personnel Amount Personnel Amount
Elimination of EDA Pos./BA 199 39,773 98 29,950 -101 -9,823
FTE/Obl. 180 45,773 98 33,710 -82 -12,063
Eliminating EDA (-101 positions, -$9,823 – EDA proposes a program decrease of $9,823 thousand for a total of $29,950 and a decrease of 101 positions for a total of 98 positions. The 2020 request assumes 2020 is the first year of closure actions while due to the timing of 2018 full year appropriations the 2019 request assumed closure activities began in 2018 and 2019 was the second year of closure activities. The 2020 request now parallels the original closure assumptions made in 2018.
This request allows for the orderly closure of EDA and ongoing grant monitoring, management, and close out activities. These amounts represent the estimated costs for the first year of closure activities and are intended to cover the following costs:
• Personnel costs, including severance payments, lump sum leave, salaries for essential personnel during the closure, human resources support for conducting the closure, and any legal costs.
• Real property, to cover either early termination fees or the full cost of the lease if necessary. • Miscellaneous costs associated with closing down the agency, including records management, responsible disposal of IT equipment,
furniture removal, and any other costs required for the orderly closure of the agency.
The close down plan includes the reduction of staff through involuntary separation and the transfer to another federal agency the monitoring and servicing of open grants and loans until their close out date. EDA estimates it will take six years to close the projected 3,021 open grants and loans in 2019. This number includes disaster grants that will be awarded in 2019. There will be continued costs to the organization to monitor and service EDA’s over $1.8 billion in grants and loans until they are all closed. Those costs will decrease over time as the number of open grants and loans decreases. After the grants are closed, there is post-close-out work that will need to occur through the useful life of the projects, often up to 20 years. Additional monitoring and final disposition work is required for years after the closeout of a grant to ensure the grantees continue to use the facility for its intended purpose and to release the government interest in the property (e.g., mortgages) at the expiration of the useful life. This monitoring will also need to be performed by the federal grant making organization designated to assume EDA’s grant and management functions.
EDA-85
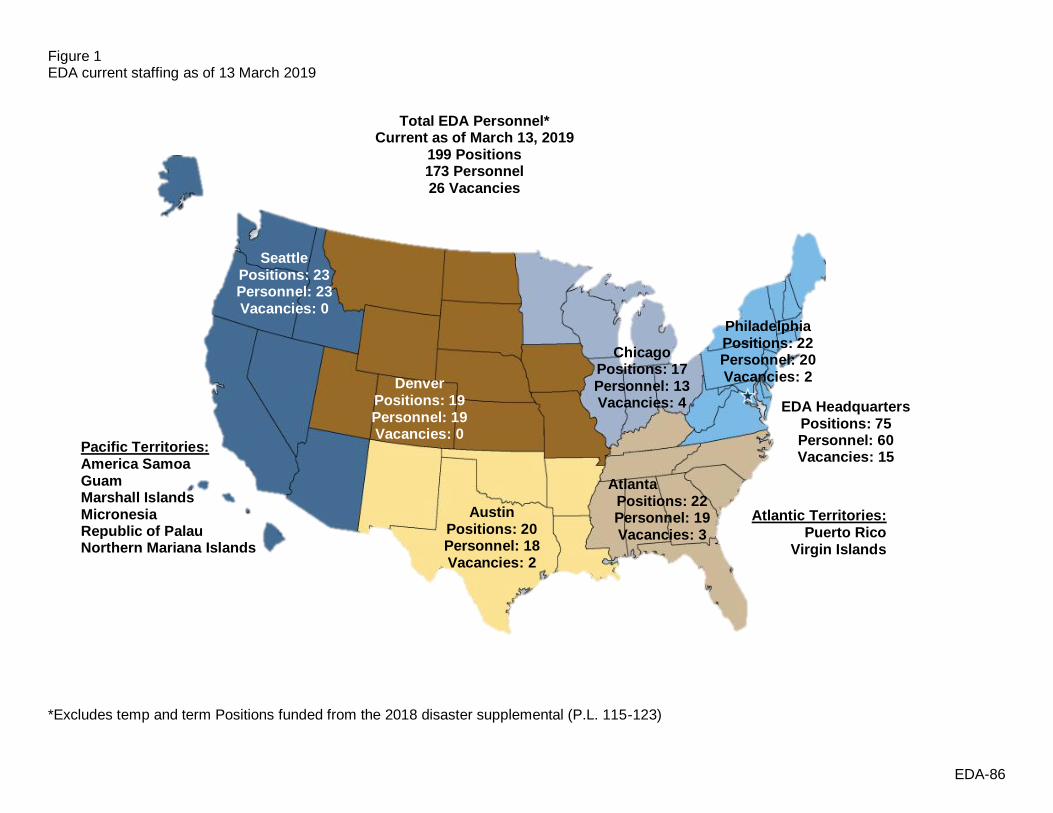
Figure 1 EDA current staffing as of 13 March 2019
Total EDA Personnel* Current as of March 13, 2019
199 Positions 173 Personnel 26 Vacancies
Seattle Positions: 23 Personnel: 23 Vacancies: 0
Philadelphia Positions: 22
Chicago Personnel: 20
Denver Positions: 17 Personnel: 13
Vacancies: 2
Positions: 19 Personnel: 19
Vacancies: 4 EDA Headquarters Positions: 75
Pacific Territories: Vacancies: 0 Personnel: 60
America Samoa Vacancies: 15
Guam Atlanta Marshall Islands Positions: 22 Micronesia Austin Personnel: 19 Atlantic Territories: Republic of Palau Positions: 20 Vacancies: 3 Puerto Rico Northern Mariana Islands Personnel: 18 Virgin Islands
Vacancies: 2
*Excludes temp and term Positions funded from the 2018 disaster supplemental (P.L. 115-123)
EDA-86

Figure 2 EDA planned staffing for FY 2020
Total EDA Personnel FY 2020
98 Positions
Seattle Positions: 11
Philadelphia
Chicago Positions: 11
Denver Positions: 9
Positions: 9 EDA Headquarters
Positions: 37
Pacific Territories: America Samoa Guam Marshall Islands Atlanta Micronesia Republic of Palau Austin
Positions: 11 Atlantic Territories: Puerto Rico
Northern Mariana Islands Positions: 10 Virgin Islands
EDA-87

[THIS PAGE INTENTIONALLY LEFT BLANK]
EDA-88

Exhibit 14 Department of Commerce
Economic Development Administration Salaries and Expenses
PROGRAM CHANGE PERSONNEL DETAIL
Activity:
Subactivity:
Program Change:
Business Development
Business Development
Staff Decrease
Full-time permanent Annual Total
Title
Various
Grade
Various
Number
(101)
Salary
133,817.7
Salaries
(13,515,584)
Total
Less lapse
Total full-time permanent (FTE)
2020 Pay Adjustment (0.0%)
25.00%
(101)
0
(101)
(13,515,584)
3,378,896
(10,136,688)
0
(10,136,688)
Personnel Data Summary
Full-time Equivalent Employment (FTE)
Full-time permanent
Other than full-time permanent
Total FTE
(82)
0
(82)
Authorized Positions
Full-time permanent
Other than full-time permanent
Total Positions
(101)
0
(101)
EDA-89

[THIS PAGE INTENTIONALLY LEFT BLANK]
EDA-90

Exhibit 15 Department of Commerce
Economic Development Administration Salaries and Expenses
PROGRAM CHANGE DETAIL BY OBJECT CLASS (Direct Obligations amounts in thousands)
Activity: Operations
Subactivity: Operations
Object Class 2018 2019 2020 2020 Increase/Decrease
Actual Enacted Base Estimate from 2020 Base
11.1 Full-time permanent compensation 19,110 19,732 19,917 8,983 (10,934)
11.3 Other than full-time permanent 0 0 0 0 0
11.5 Other personnel compensation 338 372 372 8,484 8,112
11.9 Total personnel compensation 19,448 20,104 20,289 17,467 (2,822)
12.1 Civilian personnel benefits 6,256 5,574 6,080 2,807 (3,273)
21 Travel and transportation of persons 1,063 795 812 535 (277)
22 Transportation of things 12 5 5 11 6
23 Rent, communications, and utilities
23.1 Rental payments to GSA 2,672 2,820 2,882 1,820 (1,062)
23.2 Rental payments to others 331 0 0 151 151
23.3 Communications, utilities and misc. charges 416 401 402 237 (164)
24 Printing and reproduction 10 9 9 2 (7)
25 Other contractual services
25.2 Other services from non-Federal sources 2,773 1,322 1,322 1,109 (213)
25.3 Other goods and services from Federal sources 6,657 7,840 7,843 5,746 (2,097)
25.7 Operations and maintenance of equipment 0 0 0 0 0
26 Supplies and materials 107 129 129 65 (65)
31 Equipment 0 0 0 0 0
43 Interest and Dividends 0 0 0 0 0
44 Refunds 0 0 0 0 0
99.9 Total obligations 39,745 39,000 39,773 29,950 (9,823)
EDA-91

[THIS PAGE INTENTIONALLY LEFT BLANK]
EDA-92
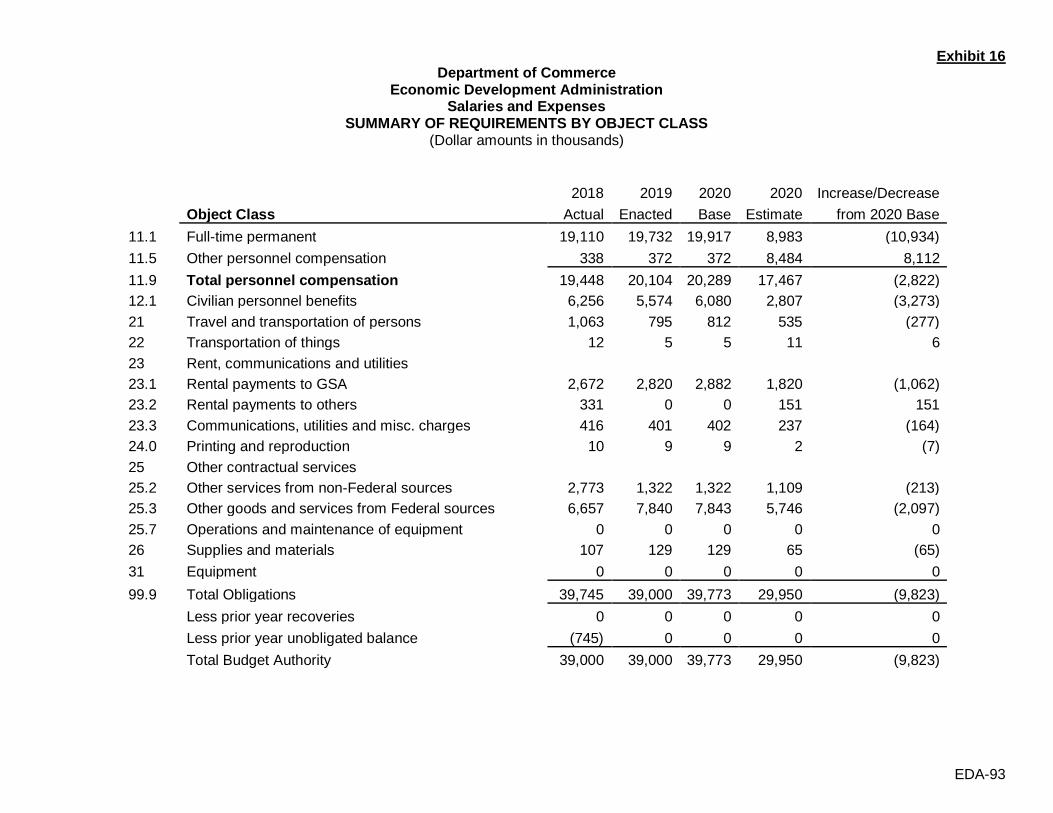
Exhibit 16 Department of Commerce
Economic Development Administration Salaries and Expenses
SUMMARY OF REQUIREMENTS BY OBJECT CLASS (Dollar amounts in thousands)
2018 2019 2020 2020 Increase/Decrease
Object Class Actual Enacted Base Estimate from 2020 Base
11.1 Full-time permanent 19,110 19,732 19,917 8,983 (10,934)
11.5 Other personnel compensation 338 372 372 8,484 8,112
11.9 Total personnel compensation 19,448 20,104 20,289 17,467 (2,822)
12.1 Civilian personnel benefits 6,256 5,574 6,080 2,807 (3,273)
21 Travel and transportation of persons 1,063 795 812 535 (277)
22 Transportation of things 12 5 5 11 6
23 Rent, communications and utilities
23.1 Rental payments to GSA 2,672 2,820 2,882 1,820 (1,062)
23.2 Rental payments to others 331 0 0 151 151
23.3 Communications, utilities and misc. charges 416 401 402 237 (164)
24.0 Printing and reproduction 10 9 9 2 (7)
25 Other contractual services
25.2 Other services from non-Federal sources 2,773 1,322 1,322 1,109 (213)
25.3 Other goods and services from Federal sources 6,657 7,840 7,843 5,746 (2,097)
25.7 Operations and maintenance of equipment 0 0 0 0 0
26 Supplies and materials 107 129 129 65 (65)
31 Equipment 0 0 0 0 0
99.9 Total Obligations 39,745 39,000 39,773 29,950 (9,823)
Less prior year recoveries 0 0 0 0 0
Less prior year unobligated balance (745) 0 0 0 0
Total Budget Authority 39,000 39,000 39,773 29,950 (9,823)
EDA-93
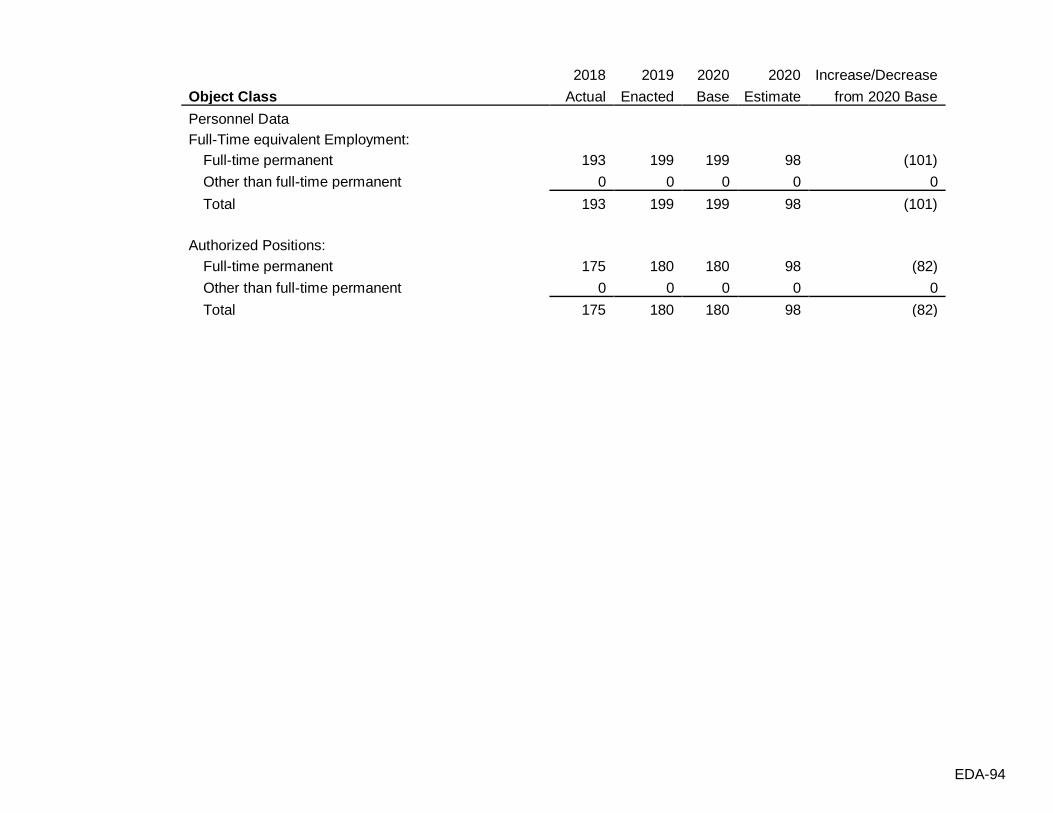
2018 2019 2020 2020 Increase/Decrease
Object Class Actual Enacted Base Estimate from 2020 Base
Personnel Data
Full-Time equivalent Employment:
Full-time permanent 193 199 199 98 (101)
Other than full-time permanent 0 0 0 0 0
Total 193 199 199 98 (101)
Authorized Positions:
Full-time permanent 175 180 180 98 (82)
Other than full-time permanent 0 0 0 0 0
Total 175 180 180 98 (82)
EDA-94

Exhibit 32
Department of Commerce Economic Development Administration
Salaries and Expenses JUSTIFICATION OF PROPOSED LANGUAGE CHANGES
FY 2020
This language is proposed for the orderly closedown of the Economic Development Administration and its grants and loans previously awarded.
SALARIES AND EXPENSES For necessary expenses of the closure of the Economic Development Administration, including, but not limited to, ongoing administration, oversight and monitoring of grants and loans previously awarded by the Economic Development Administration, $29,950,000.
EDA-95

[THIS PAGE INTENTIONALLY LEFT BLANK]
EDA- 96

Exhibit 33
Department of Commerce Economic Development Administration
Salaries and Expenses APPROPRIATION LANGUAGE AND CODE CITATIONS
FY 2020
Salaries and Expenses
1 For necessary expenses of administering the economic development assistance programs as provided for by law,
42 U.S.C. 3214(c), 3231
42 U.S.C. 3214(c) - Authorizes the transfer of appropriated funds from other Federal agencies, if such funds are used for the purpose for which (and in accordance with the terms under which) the funds are specifically authorized and appropriated.
42 U.S.C. 3231 - Authorizes funds to be appropriated for economic development assistance programs to carry out 42 U.S.C. 3121 et seq., through fiscal year 2008, to remain available until expended.
2 Authorization of appropriations for defense conversion activities,
42 U.S.C. 3232
42 U.S.C. 3232(a) - In addition to amounts made available under section 3231 of this title, there are authorized to be appropriated such sums as are necessary to carry out section 3149(c)(1) of this title, to remain available until expended.
42 U.S.C. 3232(b) - Funds made available under subsection (a) of this section may be used for activities including pilot projects for privatization of, and economic development activities for, closed or realigned military or Department of Energy installations.
3 Authorization of appropriations for disaster economic recovery activities,
42. U.S.C. 3233
42. U.S.C. 3233(a) - In addition to amounts made available under section 3231 of this title, there are authorized to be appropriated such sums as are necessary to carry out section 3149(c)(2) of this title, to remain available until expended.
EDA- 97

42. U.S.C. 3233(b) - The Federal share of the cost of activities funded with amounts made available under subsection (a) of this section shall be up to 100 percent.
4 Funding for grants for planning and grants for administrative expenses,
42 U.S.C. 3234
Of the amounts made available under section 3231 of this title for each fiscal year, not less than $27,000,000 shall be made available for grants provided under section 3143 of this title.
5 Provided, that these funds may be used to monitor projects approved pursuant to title I of the Public Works Employment Act of 1976, as amended,
42 U.S.C. 6710
42 U.S.C. 6710 - Authorized appropriations for the administration of the Local Public Works Capital Development and Investment Act of 1976.
6 Title II of the Trade Act of 1974, as amended, and
19 U.S.C. 2345 - Authorizes appropriations to carry out Trade Adjustment Assistance for Firms (TAAF).
Public Law No: 114-27, Trade Preferences Extension Act of 2015. Title IV of that Act, entitled the “Trade Adjustment Assistance Reauthorization Act of 2015” extends the authorization of appropriations for TAAF through fiscal year 2021.
7 The Community Emergency Drought Relief Act of 1977 (including monitoring and close out),
42 U.S.C. 5184 note
42 U.S.C. 5184 note - Authorized appropriations to carry out those provisions of the Community Emergency Drought Relief Act of 1977.
8 For section 27 of the Stevenson-Wydler Technology Innovation Act of 1980 (15 U.S.C. 3722).
EDA- 98

Exhibit 35
Department of Commerce
Economic Development Administration
Salaries and Expenses PERIODICALS, PAMPHLETS, AND AUDIOVISUAL PRODUCTS
2017 2018 2019 2020
Actual Actual Enacted Estimate
Pamphlets 11.0 10.0 9.0 2.0
Total 11.0 10.0 9.0 2.0
Economic Development Administration (EDA) publications include the EDA Annual Report and a booklet to educate the Economic Development Districts, local and State government, stakeholders on their grant and loan responsibilities as EDA closes down.
EDA- 99

[THIS PAGE INTENTIONALLY LEFT BLANK]
EDA-100

Exhibit 36
Department of Commerce Economic Development Administration
Salaries and Expenses AVERAGE GRADE AND SALARIES
2018
Actual
2019
Enacted
2020
Estimate
Average ES Grade
Average GS Grade 13.1 13.1 13.0
Average GS Salary 136.2 131.9 108.9
EDA-101

[THIS PAGE INTENTIONALLY LEFT BLANK]
EDA-102
FY 2020 ANNUAL PERFORMANCE PLAN / REPORT (APPR) BACKUP
1) Summary
i) OVERVIEW
Since EDA’s inception 52 years ago, EDA has led the federal economic development agenda by promoting innovation and competitiveness, preparing American regions for growth and success in the worldwide economy. EDA is proud of the investments it has made in economically distressed regions, based on their locally-driven strategies and needs, and the outcomes of those investments which spurred local innovation and entrepreneurship creating and saving jobs and leveraging private investments.
ii) MISSION STATEMENT
EDA will take actions to conduct the orderly close of the agency.
EDA-103

iii) ORGANIZATIONAL STRUCTURE
ASSISTANT SECRETARY FOR ECONOMIC DEVELOPMENT DEPUTY ASSISTANT SECRETARY FOR ECONOMIC DEVELOPMENT
Office of External Affairs (OEA)
Public Affairs
Legislative Affairs
Office of Information Technology (OIT)
Office of Regional Affairs (ORA)
Performance and National Programs Division
Trade Adjustment Assistance
Austin Regional Office (AURO)
Denver Regional Office (DRO)
Atlanta Regional Office (ATRO)
Philadelphia Regional Office (PRO)
Chicago Regional Office (CRO)
Seattle Regional Office
(SRO)
Office of Finance and Management Services (OFMS)
Budget and Finance Division
Administrative Division
Office of Innovation and Entrepreneurship (OIE)
Office of the Chief Counsel (OCC)
iv) CROSS-AGENCY PRIORITY GOALS
Due to the proposed elimination of EDA, it is not included in any cross-agency priority goals.
EDA-104
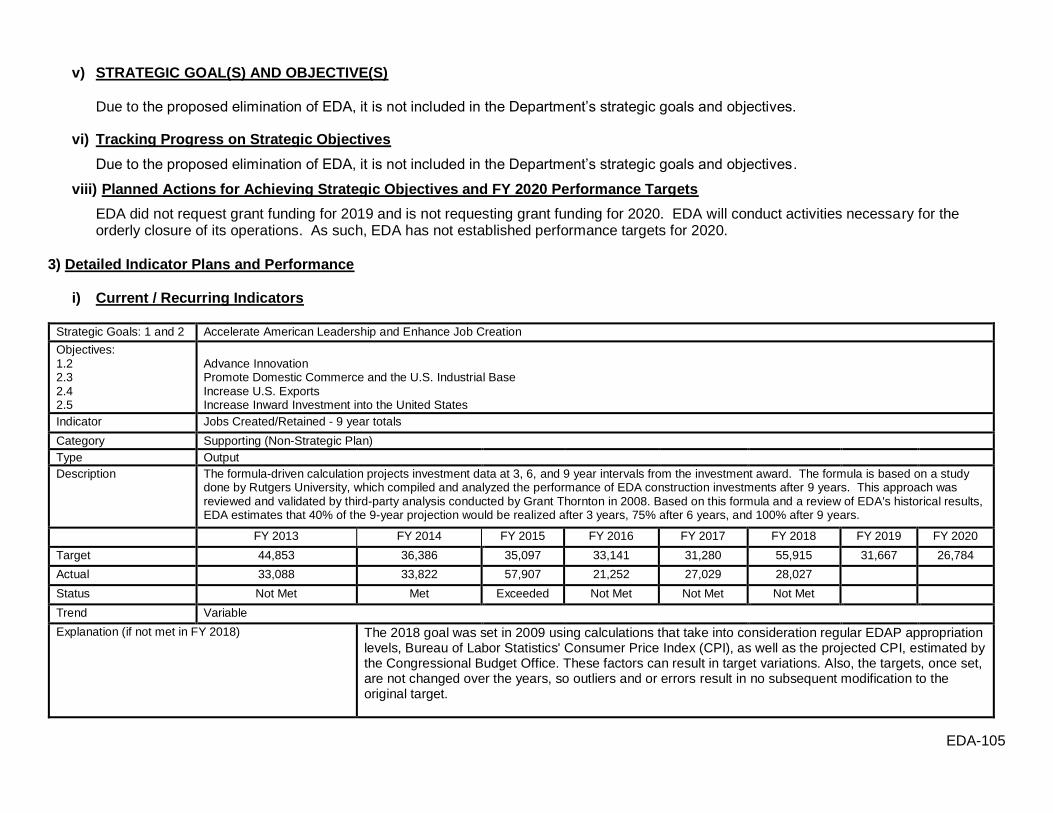
v) STRATEGIC GOAL(S) AND OBJECTIVE(S)
Due to the proposed elimination of EDA, it is not included in the Department’s strategic goals and objectives.
vi) Tracking Progress on Strategic Objectives
Due to the proposed elimination of EDA, it is not included in the Department’s strategic goals and objectives.
viii) Planned Actions for Achieving Strategic Objectives and FY 2020 Performance Targets
EDA did not request grant funding for 2019 and is not requesting grant funding for 2020. EDA will conduct activities necessary for the orderly closure of its operations. As such, EDA has not established performance targets for 2020.
3) Detailed Indicator Plans and Performance
i) Current / Recurring Indicators
Strategic Goals: 1 and 2 Accelerate American Leadership and Enhance Job Creation
Objectives: 1.2 2.3 2.4 2.5
Advance Innovation Promote Domestic Commerce and the U.S. Industrial Base Increase U.S. Exports Increase Inward Investment into the United States
Indicator Jobs Created/Retained - 9 year totals
Category Supporting (Non-Strategic Plan)
Type Output
Description The formula-driven calculation projects investment data at 3, 6, and 9 year intervals from the investment award. The formula is based on a study done by Rutgers University, which compiled and analyzed the performance of EDA construction investments after 9 years. This approach was reviewed and validated by third-party analysis conducted by Grant Thornton in 2008. Based on this formula and a review of EDA's historical results, EDA estimates that 40% of the 9-year projection would be realized after 3 years, 75% after 6 years, and 100% after 9 years.
FY 2013 FY 2014 FY 2015 FY 2016 FY 2017 FY 2018 FY 2019 FY 2020
Target 44,853 36,386 35,097 33,141 31,280 55,915 31,667 26,784
Actual 33,088 33,822 57,907 21,252 27,029 28,027
Status Not Met Met Exceeded Not Met Not Met Not Met
Trend Variable
Explanation (if not met in FY 2018) The 2018 goal was set in 2009 using calculations that take into consideration regular EDAP appropriation levels, Bureau of Labor Statistics' Consumer Price Index (CPI), as well as the projected CPI, estimated by the Congressional Budget Office. These factors can result in target variations. Also, the targets, once set, are not changed over the years, so outliers and or errors result in no subsequent modification to the original target.
EDA-105

The number of jobs that are actually created and or retained is highly dependent upon the grant awards made based on the specific needs of the communities and regions seeking EDA assistance. The types of projects that received EDA funding in that year, while impactful in helping to build the capacity for economic development, may simply have created/retained a smaller number of jobs then what was estimated for that particular year.
Actions to be taken to correct not meeting target EDA is currently working on updating and developing a more robust methodology for estimating the outcomes and setting targets for its investments through a research cooperative agreement with the Urban Institute.
Adjustments to targets Note that EDA’s targets are calculated as the best estimate of future performance, based on prior performance and the most up-to-date data available. For a variety of reasons, including dynamic local economic circumstances, programmatic initiatives, and ongoing target calibration, the calculated targets are subject to fluctuate from one year to the next.
Action(s) to achieve FY 2020 target NA
Notes None
Information Gaps None
Strategic Goals: 1 and 2 Accelerate American Leadership and Enhance Job Creation
Objectives: 1.2 2.3 2.4 2.5
Advance Innovation Promote Domestic Commerce and the U.S. Industrial Base Increase U.S. Exports Increase Inward Investment into the United States
Indicator Jobs Created/Retained - 6 year totals
Category Supporting (Non-Strategic Plan)
Type Output
Description The formula-driven calculation projects investment data at 3, 6, and 9 year intervals from the investment award. The formula is based on a study done by Rutgers University, which compiled and analyzed the performance of EDA construction investments after 9 years. This approach was reviewed and validated by third-party analysis conducted by Grant Thornton in 2008. Based on this formula and a review of EDA's historical results, EDA estimates that 40% of the 9-year projection would be realized after 3 years, 75% after 6 years, and 100% after 9 years.
FY 2013 FY 2014 FY 2015 FY 2016 FY 2017 FY 2018 FY 2019 FY 2020
Target 16,570 15,640 27,958 15,834 13,392 12,348 9,082 10,093
Actual 12,685 12,486 19,526 24,101 18,114 36,456
Status Not Met Not Met Not Met Exceeded Exceeded Exceeded
Trend Variable
Explanation (if not met in FY 2018)
NA
Actions to be taken to correct not meeting target
None
EDA-106

Adjustments to targets Note that EDA’s targets are calculated as the best estimate of future performance, based on prior performance and the most up-to-date data available. For a variety of reasons, including dynamic local economic circumstances, programmatic initiatives, and ongoing target calibration, the calculated targets are subject to fluctuate from one year to the next.
Action(s) to achieve FY 2020 target
NA
Notes None
Information Gaps None
Strategic Goals: 1 and 2 Accelerate American Leadership and Enhance Job Creation
Objectives: 1.2 2.3 2.4 2.5
Advance Innovation Promote Domestic Commerce and the U.S. Industrial Base Increase U.S. Exports Increase Inward Investment into the United States
Indicator Jobs Created/Retained - 3 year totals
Category Supporting (Non-Strategic Plan)
Type Output
Description The formula-driven calculation projects investment data at 3, 6, and 9 year intervals from the investment award. The formula is based on a study done by Rutgers University, which compiled and analyzed the performance of EDA construction investments after 9 years. This approach was reviewed and validated by third-party analysis conducted by Grant Thornton in 2008. Based on this formula and a review of EDA's historical results, EDA estimates that 40% of the 9-year projection would be realized after 3 years, 75% after 6 years, and 100% after 9 years.
FY 2013 FY 2014 FY 2015 FY 2016 FY 2017 FY 2018 FY 2019 FY 2020
Target 6,333 5,357 4,939 3,633 4,037 7,322 7,779 7,436
Actual 13,576 6,538 12,151 4,109 5,510 10,706
Status Exceeded Exceeded Exceeded Exceeded Exceeded Exceeded
Trend Variable
Explanation (if not met in FY 2018) NA
Actions to be taken to correct not meeting target None
Adjustments to targets None
Action(s) to achieve FY 2020 target NA
Notes None
Information Gaps None
Strategic Goals: 1 and 2 Accelerate American Leadership and Enhance Job Creation
Objectives: 1.2 2.3 2.4 2.5
Advance Innovation Promote Domestic Commerce and the U.S. Industrial Base Increase U.S. Exports Increase Inward Investment into the United States
Indicator Private Investment Leveraged - 9 year totals (in millions)
EDA-107

Category Supporting (Non-Strategic Plan)
Type Output
Description The formula-driven calculation projects investment data at 3, 6, and 9 year intervals from the investment award. The formula is based on a study done by Rutgers University, which compiled and analyzed the performance of EDA construction investments after 9 years. This approach was reviewed and validated by third-party analysis conducted by Grant Thornton in 2008. Based on this formula and a review of EDA's historical results, EDA estimates that 40% of the 9-year projection would be realized after 3 years, 75% after 6 years, and 100% after 9 years.
FY 2013 FY 2014 FY 2015 FY 2016 FY 2017 FY 2018 FY 2019 FY 2020
Target ($M) $1,637 $1,349 $1,324 $1,293 $1,223 $2,186 $1,303 $1,122
Actual ($M) $3,466 $2,958 $3,711 $2,783 $4,233 $3,830
Status Exceeded Exceeded Exceeded Exceeded Exceeded Exceeded
Trend Variable
Explanation (if not met in FY 2018) NA
Actions to be taken to correct not meeting target None
Adjustments to targets None
Action(s) to achieve FY 2020 target NA
Notes For 2017, this performance indicator includes the dollar amount of private investment measured in Strategic Objective 1.3 performance indicator “Recipient-estimated dollar amount of private investment generated as a result of grants that support inward investment" and Strategic Objective 2.3 performance indicator "Recipient-estimated dollar amount of private investment generated as a result of infrastructure for industry-driven skills training.”
Information Gaps None
Strategic Goals: 1 and 2 Accelerate American Leadership and Enhance Job Creation
Objectives: 1.2 2.3 2.4 2.5
Advance Innovation Promote Domestic Commerce and the U.S. Industrial Base Increase U.S. Exports Increase Inward Investment into the United States
Indicator Private Investment Leveraged - 6 year totals (in millions)
Category Supporting (Non-Strategic Plan)
Type Output
Description The formula-driven calculation projects investment data at 3, 6, and 9 year intervals from the investment award. The formula is based on a study done by Rutgers University, which compiled and analyzed the performance of EDA construction investments after 9 years. This approach was reviewed and validated by third-party analysis conducted by Grant Thornton in 2008. Based on this formula and a review of EDA's historical results, EDA estimates that 40% of the 9-year projection would be realized after 3 years, 75% after 6 years, and 100% after 9 years.
FY 2013 FY 2014 FY 2015 FY 2016 FY 2017 FY 2018 FY 2019 FY 2020
Target ($M) $647 $612 $1,093 $652 $561 $525 $391 $440
Actual ($M) $2,402 $2,063 $1,744 $2,118 $199 $ 3,226
EDA-108

Status Exceeded Exceeded Exceeded Exceeded Not Met Exceeded
Trend Variable
Explanation (if not met in FY 2018) EDA strives to encourage local economic development organizations to align their grant applications with DOC’s Strategic Plan priorities; however, EDA grants support locally-driven economic development efforts. As a result, despite EDA leading a wide variety of prioritization, training, and outreach efforts to encourage alignment, in any given year the quantity or impact of local economic development organization grants pertaining to a given DOC Strategic Plan priority are subject to fluctuate relative to targeted expectations. These fluctuations are primarily due to local economic circumstances.
Actions to be taken to correct not meeting target NA
Adjustments to targets None
Action(s) to achieve FY 2020 target NA
Notes For 2017, this performance indicator includes the dollar amount of private investment measured in Strategic Objective 1.3 performance indicator “Recipient-estimated dollar amount of private investment generated as a result of grants that support inward investment" and Strategic Objective 2.3 performance indicator "Recipient-estimated dollar amount of private investment generated as a result of infrastructure for industry-driven skills training.”
Information Gaps None
Strategic Goals: 1 and 2 Accelerate American Leadership and Enhance Job Creation
Objectives: 1.2 2.3 2.4 2.5
Advance Innovation Promote Domestic Commerce and the U.S. Industrial Base Increase U.S. Exports Increase Inward Investment into the United States
Indicator Private Investment Leveraged - 3 year totals (in millions)
Category Supporting (Non-Strategic Plan)
Type Output
Description The formula-driven calculation projects investment data at 3, 6, and 9 year intervals from the investment award. The formula is based on a study done by Rutgers University, which compiled and analyzed the performance of EDA construction investments after 9 years. This approach was reviewed and validated by third-party analysis conducted by Grant Thornton in 2008. Based on this formula and a review of EDA's historical results, EDA estimates that 40% of the 9-year projection would be realized after 3 years, 75% after 6 years, and 100% after 9 years.
FY 2013 FY 2014 FY 2015 FY 2016 FY 2017 FY 2018 FY 2019 FY 2020
Target ($M) $261 $224 $210 $156 $176 $323 $350 $350
Actual ($M) $1,076 $951 $2,075 $407 $793 $2,764
Status Exceeded Exceeded Exceeded Exceeded Exceeded Exceeded
Trend Variable
Explanation (if not met in FY 2018) NA
Actions to be taken to correct not meeting target None
Adjustments to targets None
Action(s) to achieve FY 2020 target NA
EDA-109

Notes For 2017, this performance indicator includes the dollar amount of private investment measured in Strategic Objective 1.3 performance indicator “Recipient-estimated dollar amount of private investment generated as a result of grants that support inward investment" and Strategic Objective 2.3 performance indicator "Recipient-estimated dollar amount of private investment generated as a result of infrastructure for industry-driven skills training.”
Information Gaps None
Strategic Goals: 1 and 2 Accelerate American Leadership and Enhance Job Creation
Objectives: 1.2 2.3 2.4 2.5
Advance Innovation Promote Domestic Commerce and the U.S. Industrial Base Increase U.S. Exports Increase Inward Investment into the United States
Indicator Percentage of Economic Development District (EDD) and Indian Tribes implementing economic development projects from the Comprehensive Economic Development Strategy (CEDS) that lead to private investment and jobs.
Category Supporting (Non-Strategic Plan)
Type Output
Description This measure provides an indication of whether the CEDS process is market based and whether EDA is helping to create an environment conducive to the creation and retention of higher skill, higher wage jobs. Research conducted on 2002 data established a baseline measure for subsequent years.
FY 2013 FY 2014 FY 2015 FY 2016 FY 2017 FY 2018 FY 2019 FY 2020
Target 95.0% 95.0% 95.0% 95.0% 95.0% 95.0% 95.0% 95.0%
Actual 89.2% 92.4% 84.0% 80.0% 73.4% 33.6%
Status Met Met Not Met Not Met Not Met Not Met
Trend Stable
Explanation (if not met in FY 2018) EDA strives to encourage local economic development organizations to align their grant applications with DOC’s Strategic Plan priorities; however, EDA grants support locally-driven economic development efforts. As a result, despite EDA leading a wide variety of prioritization, training, and outreach efforts to encourage alignment, in any given year the quantity or impact of local economic development organization grants pertaining to a given DOC Strategic Plan priority are subject to fluctuate relative to targeted expectations. These fluctuations are primarily due to local economic circumstances.
Actions to be taken to correct not meeting target None
Adjustments to targets None
Action(s) to achieve FY 2020 target NA
Notes None
Information Gaps None
Strategic Goals: 1 and 2
Accelerate American Leadership and Enhance Job Creation
Objectives:
EDA-110

1.2 2.3 2.4 2.5
Advance Innovation Promote Domestic Commerce and the U.S. Industrial Base Increase U.S. Exports Increase Inward Investment into the United States
Indicator Percentage of sub-state jurisdiction members actively participating in the Economic Development District (EDD) program.
Category Supporting (Non-Strategic Plan)
Type Output
Description EDDs generally consist of three or more counties that are considered member jurisdictions. Sub-state jurisdiction participation indicates the District’s responsiveness to the area it serves and shows that the services it provides are of value. Active participation was defined as either attendance at meetings or financial support of the EDD during the reporting period. Sub-state jurisdiction members are independent units of government (cities, counties, etc.) and eligible entities substantially associated with economic development, as set forth by the District’s by laws or alternate enabling document.
FY 2013 FY 2014 FY 2015 FY 2016 FY 2017 FY 2018 FY 2019 FY 2020
Target 89.0% 89.0% 89.0% 89.0% 89.0% 89.0% 89.0% 89.0%
Actual 83.7% 80.3% 85.3% 86.2% 91.9% 84.5%
Status Met Met Met Met Exceeded Met
Trend Stable
Explanation (if not met in FY 2018) NA
Actions to be taken to correct not meeting target None
Adjustments to targets None
Action(s) to achieve FY 2020 target NA
Notes None
Information Gaps None
Strategic Goals: 1 and 2 Accelerate American Leadership and Enhance Job Creation
Objectives: 1.2 2.3 2.4 2.5
Advance Innovation Promote Domestic Commerce and the U.S. Industrial Base Increase U.S. Exports Increase Inward Investment into the United States
Indicator Percentage of University Center Clients Taking Action as a Result of the Assistance Facilitated by the University Center (UC).
Category Supporting (Non-Strategic Plan)
Type Output
Description EDA funds UCs to provide technical assistance and specialized services (e.g., feasibility studies, marketing research, and technology transfer) to local officials and communities. UCs develop client profiles and report findings to EDA, which evaluates the performance of each center. “Taking action as a result of the assistance facilitated” means to implement an aspect of the technical assistance provided by the UC in one of several areas: economic development initiatives and training session development; linkages to crucial resources; economic development planning, etc.
FY 2013 FY 2014 FY 2015 FY 2016 FY 2017 FY 2018 FY 2019 FY 2020
Target 75.0% 75.0% 75.0% 75.0% 75.0% 75.0% 75.0% 75.0%
EDA-111

Actual 65.8% 73.2% 79.0% 77.2% 93.7% 89.8%
Status Not Met Met Exceeded Exceeded Exceeded Exceeded
Trend Stable
Explanation (if not met in FY 2018) NA
Actions to be taken to correct not meeting target None
Adjustments to targets None
Action(s) to achieve FY 2020 target NA
Notes None
Information Gaps None
Strategic Goals: 1 and 2 Accelerate American Leadership and Enhance Job Creation
Objectives: 1.2 2.3 2.4 2.5
Advance Innovation Promote Domestic Commerce and the U.S. Industrial Base Increase U.S. Exports Increase Inward Investment into the United States
Indicator Percentage of Those Actions Taken by University Center (UC) Clients that Achieved the Expected Results.
Category Supporting (Non-Strategic Plan)
Type Output
Description This measure is a follow up to the previous measure: "Percentage of UC clients taking action as a result of the assistance facilitated by the UC." This measure determines if the assistance provided by the UC is market based and results in desired outcomes. UCs develop client profiles and report to EDA, which will evaluate and verify the performance of each UC once every three years.
FY 2013 FY 2014 FY 2015 FY 2016 FY 2017 FY 2018 FY 2019 FY 2020
Target 80.0% 80.0% 83.0% 83.0% 83.0% 83.0% 83.0% 83.0%
Actual 90.1% 91.7% 82.1% 90% 89.4% 87.4%
Status Exceeded Exceeded Met Exceeded Exceeded Exceeded
Trend Stable
Explanation (if not met in FY 2018) NA
Actions to be taken to correct not meeting target None
Adjustments to targets None
Action(s) to achieve FY 2020 target NA
Notes None
Information Gaps None
Strategic Goals: 1 and 2
Accelerate American Leadership and Enhance Job Creation
EDA-112
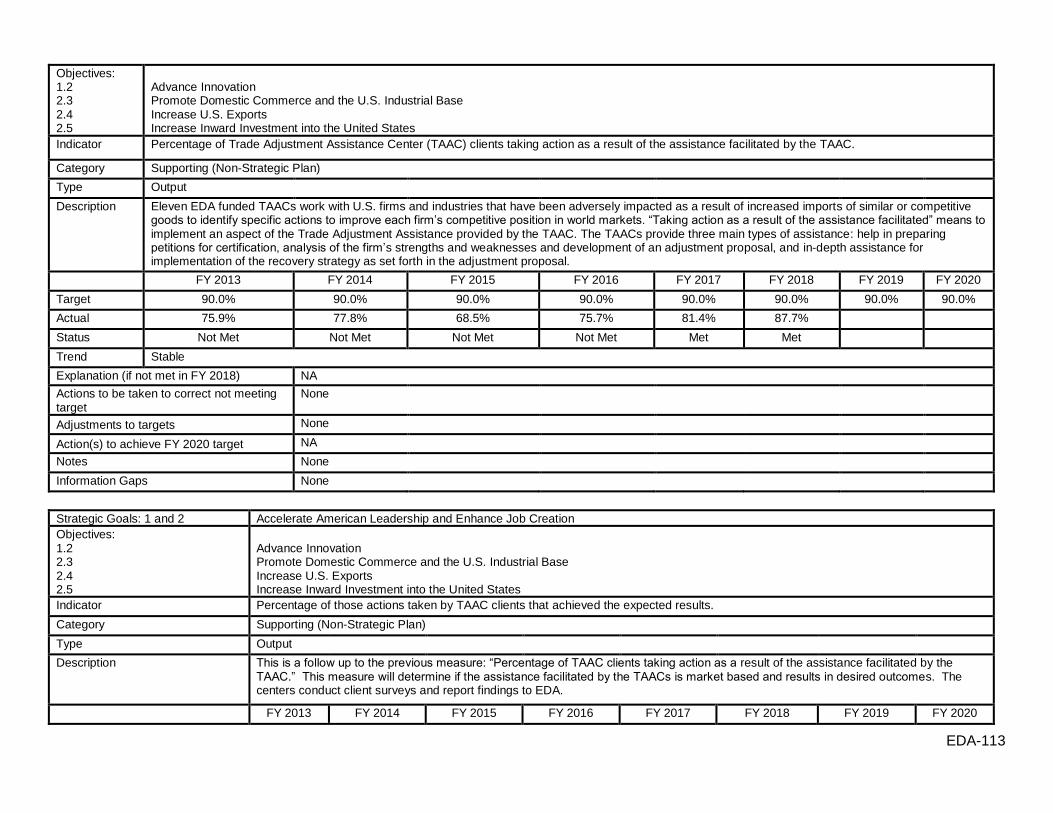
Objectives: 1.2 2.3 2.4 2.5
Advance Innovation Promote Domestic Commerce and the U.S. Industrial Base Increase U.S. Exports Increase Inward Investment into the United States
Indicator Percentage of Trade Adjustment Assistance Center (TAAC) clients taking action as a result of the assistance facilitated by the TAAC.
Category Supporting (Non-Strategic Plan)
Type Output
Description Eleven EDA funded TAACs work with U.S. firms and industries that have been adversely impacted as a result of increased imports of similar or competitive goods to identify specific actions to improve each firm’s competitive position in world markets. “Taking action as a result of the assistance facilitated” means to implement an aspect of the Trade Adjustment Assistance provided by the TAAC. The TAACs provide three main types of assistance: help in preparing petitions for certification, analysis of the firm’s strengths and weaknesses and development of an adjustment proposal, and in-depth assistance for implementation of the recovery strategy as set forth in the adjustment proposal.
FY 2013 FY 2014 FY 2015 FY 2016 FY 2017 FY 2018 FY 2019 FY 2020
Target 90.0% 90.0% 90.0% 90.0% 90.0% 90.0% 90.0% 90.0%
Actual 75.9% 77.8% 68.5% 75.7% 81.4% 87.7%
Status Not Met Not Met Not Met Not Met Met Met
Trend Stable
Explanation (if not met in FY 2018) NA
Actions to be taken to correct not meeting target
None
Adjustments to targets None
Action(s) to achieve FY 2020 target NA
Notes None
Information Gaps None
Strategic Goals: 1 and 2 Accelerate American Leadership and Enhance Job Creation
Objectives: 1.2 2.3 2.4 2.5
Advance Innovation Promote Domestic Commerce and the U.S. Industrial Base Increase U.S. Exports Increase Inward Investment into the United States
Indicator Percentage of those actions taken by TAAC clients that achieved the expected results.
Category Supporting (Non-Strategic Plan)
Type Output
Description This is a follow up to the previous measure: “Percentage of TAAC clients taking action as a result of the assistance facilitated by the TAAC.” This measure will determine if the assistance facilitated by the TAACs is market based and results in desired outcomes. The centers conduct client surveys and report findings to EDA.
FY 2013 FY 2014 FY 2015 FY 2016 FY 2017 FY 2018 FY 2019 FY 2020
EDA-113
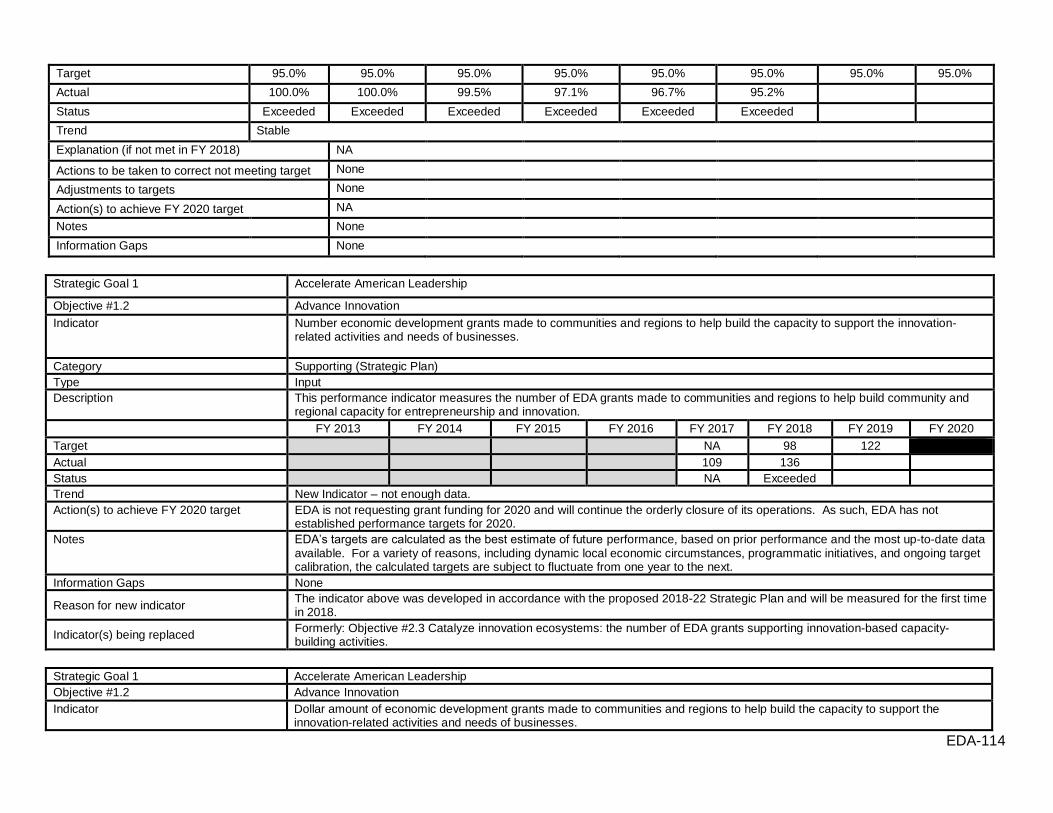
Target 95.0% 95.0% 95.0% 95.0% 95.0% 95.0% 95.0% 95.0%
Actual 100.0% 100.0% 99.5% 97.1% 96.7% 95.2%
Status Exceeded Exceeded Exceeded Exceeded Exceeded Exceeded
Trend Stable
Explanation (if not met in FY 2018) NA
Actions to be taken to correct not meeting target None
Adjustments to targets None
Action(s) to achieve FY 2020 target NA
Notes None
Information Gaps None
Strategic Goal 1 Accelerate American Leadership
Objective #1.2 Advance Innovation
Indicator Number economic development grants made to communities and regions to help build the capacity to support the innovation-related activities and needs of businesses.
Category Supporting (Strategic Plan)
Type Input
Description This performance indicator measures the number of EDA grants made to communities and regions to help build community and regional capacity for entrepreneurship and innovation.
FY 2013 FY 2014 FY 2015 FY 2016 FY 2017 FY 2018 FY 2019 FY 2020
Target NA 98 122
Actual 109 136
Status NA Exceeded
Trend New Indicator – not enough data.
Action(s) to achieve FY 2020 target EDA is not requesting grant funding for 2020 and will continue the orderly closure of its operations. As such, EDA has not established performance targets for 2020.
Notes EDA’s targets are calculated as the best estimate of future performance, based on prior performance and the most up-to-date data available. For a variety of reasons, including dynamic local economic circumstances, programmatic initiatives, and ongoing target calibration, the calculated targets are subject to fluctuate from one year to the next.
Information Gaps None
Reason for new indicator The indicator above was developed in accordance with the proposed 2018-22 Strategic Plan and will be measured for the first time in 2018.
Indicator(s) being replaced Formerly: Objective #2.3 Catalyze innovation ecosystems: the number of EDA grants supporting innovation-based capacity-building activities.
Strategic Goal 1 Accelerate American Leadership
Objective #1.2 Advance Innovation
Indicator Dollar amount of economic development grants made to communities and regions to help build the capacity to support the innovation-related activities and needs of businesses.
EDA-114

Category Supporting (Strategic Plan)
Type Input
Description This performance indicator measures the dollar amount of EDA grants made to communities and regions to help build community and regional capacity for entrepreneurship and innovation.
FY 2013 FY 2014 FY 2015 FY 2016 FY 2017 FY 2018 FY 2019 FY 2020
Target ($M) NA $86.6 $136.8
Actual ($M) $96.2 $151
Status NA Exceeded
Trend New Indicator – not enough data.
Action(s) to achieve FY 2020 target EDA is not requesting grant funding for 2020 and will continue the orderly closure of its operations. As such, EDA has not established performance targets for 2020.
Notes EDA’s targets are calculated as the best estimate of future performance, based on prior performance and the most up-to-date data available. For a variety of reasons, including dynamic local economic circumstances, programmatic initiatives, and ongoing target calibration, the calculated targets are subject to fluctuate from one year to the next.
The indicator above was developed in accordance with the proposed 2018-22 Strategic Plan and will be measured for the first time in 2018. The target for 2018 was determined based on actual results from 2017.
Information Gaps None
Reason for new indicator The indicator above was developed in accordance with the proposed 2018-22 Strategic Plan and will be measured for the first time in 2018.
Indicator(s) being replaced Objective #2.3 Catalyze innovation ecosystems: the dollar amount of EDA grants supporting innovation-based capacity-building activities.
Strategic Goal 2 Enhance Job Creation
Objective #2.3 Promote Domestic Commerce and the U.S. Industrial Base
Indicator Number of economic development grants made to communities and regions to help build the capacity to support the manufacturing-related activities and needs of businesses.
Category Supporting (Strategic Plan)
Type Input
Description This performance indicator measures the number of EDA grants made to communities and regions to help build the capacity to support the manufacturing-related activities and needs of businesses.
FY 2013 FY 2014 FY 2015 FY 2016 FY 2017 FY 2018 FY 2019 FY 2020
Target NA 311 211
Actual 345 234
Status NA Not Met
Trend New Indicator – not enough data.
Action(s) to achieve FY 2020 target EDA is not requesting grant funding for 2020 and will continue the orderly closure of its operations. As such, EDA has not established performance targets for 2020.
Notes EDA’s targets are calculated as the best estimate of future performance, based on prior performance and the most up-to-date data available. For a variety of reasons, including dynamic local economic circumstances, programmatic initiatives, and ongoing target calibration, the calculated targets are subject to fluctuate from one year to the next.
EDA-115

The indicator above was developed in accordance with the proposed 2018-22 Strategic Plan and will be measured for the first time in 2018. The target for 2018 was determined based on actual results from 2017.
Information Gaps None
Reason for new indicator The indicator above was developed in accordance with the proposed 2018-22 Strategic Plan and will be measured for the first time in 2018.
Indicator(s) being replaced None.
Strategic Goal 2 Enhance Job Creation
Objective #2.3 Promote Domestic Commerce and the U.S. Industrial Base
Indicator Dollar amount of economic development grants made to communities and regions to help build the capacity to support the manufacturing-related activities and needs of businesses.
Category Supporting (Strategic Plan)
Type Input
Description This performance indicator measures dollar amount of EDA grants made to communities and regions to help build the capacity to support the manufacturing-related activities and needs of businesses.
FY 2013 FY 2014 FY 2015 FY 2016 FY 2017 FY 2018 FY 2019 FY 2020
Target ($M) NA $137.8 $110.6
Actual ($M) $153.2 $122.9
Status NA Not Met
Trend New Indicator – not enough data.
Action(s) to achieve FY 2020 target EDA is not requesting grant funding for 2020 and will continue the orderly closure of its operations. As such, EDA has not established performance targets for 2020.
Notes EDA’s targets are calculated as the best estimate of future performance, based on prior performance and the most up-to-date data available. For a variety of reasons, including dynamic local economic circumstances, programmatic initiatives, and ongoing target calibration, the calculated targets are subject to fluctuate from one year to the next.
The indicator above was developed in accordance with the proposed 2018-22 Strategic Plan and will be measured for the first time in 2018. The target for 2018 was determined based on actual results from 2017.
Information Gaps None
Reason for new indicator The indicator above was developed in accordance with the proposed 2018-22 Strategic Plan and will be measured for the first time in 2018.
Indicator(s) being replaced None
Strategic Goal 2 Enhance Job Creation
Objective #2.4 Increase U.S. Exports
Indicator Number of economic development grants made to communities and regions to help build the capacity to support the export-related activities and needs of businesses.
Category Supporting (Strategic Plan)
Type Input
EDA-116

Description This performance indicator measures the number of EDA grants made to made to communities and regions to help build the capacity to support the export-related activities and needs of businesses.
FY 2013 FY 2014 FY 2015 FY 2016 FY 2017 FY 2018 FY 2019 FY 2020
Target NA 68 84
Actual 75 93
Status NA Exceeded
Trend New Indicator – not enough data.
Action(s) to achieve FY 2020 target EDA is not requesting grant funding 2020 and will continue the orderly closure of its operations. As such, EDA has not established performance targets for 2020.
Notes EDA’s targets are calculated as the best estimate of future performance, based on prior performance and the most up-to-date data available. For a variety of reasons, including dynamic local economic circumstances, programmatic initiatives, and ongoing target calibration, the calculated targets are subject to fluctuate from one year to the next.
The indicator above was developed in accordance with the proposed 2018-22 Strategic Plan and will be measured for the first time in 2018. The target for 2018 was determined based on actual results from 2017.
Information Gaps None
Reason for new indicator The indicator above was developed in accordance with the proposed 2018-22 Strategic Plan and will be measured for the first time in 2018.
Indicator(s) being replaced Strategic Objective 1.2: Increase U.S. exports the number of EDA grants which support place-based export strategies
Strategic Goal 2 Enhance Job Creation
Objective #2.4 Increase U.S. Exports
Indicator Dollar amount of economic development grants made to communities and regions to help build the capacity to support the export-related activities and needs of businesses.
Category Supporting (Strategic Plan)
Type Input
Description This performance indicator measures the dollar amount of EDA grants made to made to communities and regions to help build the capacity to support the export-related activities and needs of businesses.
FY 2013 FY 2014 FY 2015 FY 2016 FY 2017 FY 2018 FY 2019 FY 2020
Target NA $ 75.5 $96.2
Actual $83.8 $106.8
Status NA Exceeded
Trend New Indicator – not enough data.
Action(s) to achieve FY 2020 target EDA is not requesting grant funding for 2020 and will continue the orderly closure of its operations. As such, EDA has not established performance targets for 2020.
Notes EDA’s targets are calculated as the best estimate of future performance, based on prior performance and the most up-to-date data available. For a variety of reasons, including dynamic local economic circumstances, programmatic initiatives, and ongoing target calibration, the calculated targets are subject to fluctuate from one year to the next.
The indicator above was developed in accordance with the proposed 2018-22 Strategic Plan and will be measured for the first time in 2018. The target for 2018 was determined based on actual results from 2017.
Information Gaps None
EDA-117

Reason for new indicator The indicator above was developed in accordance with the proposed 2018-22 Strategic Plan and will be measured for the first time in 2018.
Indicator(s) being replaced Strategic Objective 1.2: Increase U.S. exports the dollar amount of EDA grants which support place-based export strategies.
Strategic Goal 2 Enhance Job Creation
Objective #2.5 Increase Inward Investment into the United States
Indicator Number of economic development grants made to communities and regions to help build the capacity to attract FDI.
Category Supporting (Strategic Plan)
Type Input
Description This performance indicator measures the number of EDA grants which help communities and regions be better positioned for FDI.
FY 2013 FY 2014 FY 2015 FY 2016 FY 2017 FY 2018 FY 2019 FY 2020
Target NA 31 35
Actual 34 39
Status NA Exceeded
Trend New Indicator – not enough data.
Action(s) to achieve FY 2020 target EDA is not requesting grant funding for 2020 and will continue the orderly closure of its operations. As such, EDA has not established performance targets for 2020.
Notes EDA’s targets are calculated as the best estimate of future performance, based on prior performance and the most up-to-date data available. For a variety of reasons, including dynamic local economic circumstances, programmatic initiatives, and ongoing target calibration, the calculated targets are subject to fluctuate from one year to the next.
The indicator above was developed in accordance with the proposed 2018-22 Strategic Plan and will be measured for the first time in 2018. The target for 2018 was determined based on actual results from 2017.
Information Gaps None
Reason for new indicator The indicator above was developed in accordance with the proposed 2018-22 Strategic Plan and will be measured for the first time in 2018.
Indicator(s) being replaced None
Strategic Goal 2 Enhance Job Creation
Objective #2.5 Increase Inward Investment into the United States
Indicator Dollar amount of economic development grants made to communities and regions to help build the capacity to attract FDI.
Category Supporting (Strategic Plan)
Type Input
Description This performance indicator measures the dollar amount of EDA grants which help communities and regions be better positioned for FDI.
FY 2013 FY 2014 FY 2015 FY 2016 FY 2017 FY 2018 FY 2019 FY 2020
Target ($M) NA $34.5 $43.6
Actual ($M) $38.4 $48.4
Status NA Exceeded
EDA-118

Trend New Indicator – not enough data.
Action(s) to achieve FY 2020 target EDA is not requesting grant funding for 2020 and will continue the orderly closure of its operations. established performance targets for 2020.
As such, EDA has not
Notes EDA’s targets are calculated as the best estimate of future performance, based on prior performance and the most up-to-date data available. For a variety of reasons, including dynamic local economic circumstances, programmatic initiatives, and ongoing target
calibration, the calculated targets are subject to fluctuate from one year to the next. The indicator above was developed in accordance with the proposed 2018-22 Strategic Plan and will be measured for the first time in 2018. The target for 2018 was determined based on actual results from 2017.
Information Gaps None
Reason for new indicator The indicator above was developed in accordance with the proposed 2018-22 Strategic Plan and will be measured for the first time in 2018.
Indicator(s) being replaced None
ii) Proposed New Indicators
None
iii) Other Indicators None
iv) Non-Recurring Indicators
None
EDA-119

NOTE: The reimbursements EDA receives are for service provided to other agencies. Those reimbursements do not support DOC goals and are not included in this resource table.
EDA-120
4) Resource Requirements Tables
Past Funding from FY 2013 to FY 2017
FY 2013 Actual FY 2014 Actual FY 2015 Actual FY 2016 Actual FY 2017 Actual
DOC Goal 1: Trade & Investment
Total Budget Authority
Direct 45.5 52.0 52.9 55.1 65.3
Reimbursable - - - - -
Total 45.5 2.8 2.8 2.6 2.4
Total Positions 44 41 41 49 46
Goal 2: Innovation
Total Budget Authority
Direct 110.2 125.7 127.8 133.2 157.5
Reimbursable - - - - -
Total 110.2 125.7 127.8 133.2 157.5
Total Positions 105 97 98 118 110
Goal 3: Environment
Total Budget Authority
Direct 25.0 29.0 29.9 31.1 37.2
Reimbursable - - - - -
Total 25.0 29.0 29.9 31.1 37.2
Total Positions 26 24 24 29 28

Funding from FY 2018 to FY 2020
FY 2018 Actual
FY 2019 Enacted
FY 2020 Base Increase/
(Decrease) FY 2020 Estimate
DOC Goal 1: Accelerate American Leadership
Total Budget Authority
Direct 75.4 76.0 76.2 (68.7) 7.5
Reimbursable - - - - -
Total 75.4 76.0 76.2 (68.7) 7.5
Total Positions 48.0 50.0 50.0 (25.0) 25.0
DOC Goal 2: Enhance Job Creation
Total Budget Authority
Direct 226.1 228.0 228.6 (206.1) 22.5
Reimbursable - - - - -
Total 226.1 228.0 228.6 (206.1) 22.5
Total Positions 145.0 149.0 149.0 (76.0) 74.0
NOTE: The reimbursements EDA receives are for service provided to other agencies. Those reimbursements do not support DOC goals and are not included in this resource table.
EDA-121