editorial calendar 2009 authentic woman
TRANSCRIPT
_________________________________________________________________________________
Lesson Summary In this lesson, students will build an open spectrograph to calculate the angle the light is transmitted through a holographic diffraction grating. After finding the desired angles, the students will design their own spectrograph using the information learned. Prior Knowledge & Skills • Experience interpreting data • Visible light represents only a small portion of all
light • General understanding of energy • Understanding of Pythagorean theorem • Experience with angle measurements AAAS Science Benchmarks The Nature of Mathematics Mathematics, Science, and Technology Mathematical Inquiry The Nature of Technology Technology and Science Design and Systems The Physical Setting Motion The Mathematical World Shapes NSES Science Standards Science and Technology: Understandings about Science and Technology NCTM Mathematics Standards • Geometry: Analyze characteristics and properties of
two- and three-dimensional geometric shapes and develop mathematical arguments about geometric relationships
• Algebra: Understand patterns, relations, and functions
Colorado State Standards • Mathematics Standards 3, 4
• Science Standard 1, 4, 5
Suggested background reading Light
Teaching Time: Two 50-minute periods Materials Each group needs: • 25.5 x 76 cm (10” x 30”) rectangular of 5mm (3/16”) thick
foam core board • 2-Styrofoam cups • Holographic diffraction grating (1000 lines/mm or 25,400
groves/in) • Incandescent flashlight with focusing beam • Ruler • Meter stick • Exact-o knife To Share with Class: • Role of masking tape • Black fine point permanent marker • Red, green and violet markers or colored pencils • Sheets of paper from legal to poster sized, metric graph
paper Advanced Planning Preparation Time: 30 minutes 1. Complete “Building a Fancy spectrograph” to give the
students a good idea of how a spectrograph works. 2. Print copies of the student instructions.
3. Cut poster board for each group
4. Place tables or desks lengthwise against the wall for a
work surface
5. Gather materials
6. Set up the experiment as an example for students. Why Do We Care? Spectrographs are used to study atmospheres of stars, planets and even components of other galaxies. There are a lot of key factors that engineers must look at to make a spectrograph works properly. They must carefully measure out all angles, and sometimes engineers use computers to do these calculations for a spectrograph. Engineers also discuss with other engineers and scientists how to make improvements to the design in order to create an instrument that is most efficient and effective.
_________________________________________________________________________________ Activity Dependency Building a Fancy Spectrograph and Using a Fancy Spectrograph activities from the Spectroscopy curricular unit Group Size 2-3 students Expendable Cost per Group $3 Pre-Requisite Knowledge Students should have an understanding of geometry (i.e. triangles, Pythagorean theorem, use of a protractor, etc.) Students should also be able to work with sharp cutting utensils and rulers. Learning Objectives After this lesson, students should be able to: • Explain a practical use of the Pythagorean theorem. • Design a simple light experiment • Explain how a spectrograph works Materials Materials Notes: Mini Maglite flashlights are recommended. LED flashlights will not work. Holographic diffraction gratings can be purchased in sheets or on card-mounted slides (Prices are from 2007) from: Rainbow Symphony Store http://store.rainbowsymphonystore.com A set of 10 12” x 6” linear sheets with 1000 line/mm. cost $25.00 A set of 50 2” x 2” linear calibrated card mount slides with 1000 line/mm. cost $20.00 A set of 100 2” x 2” linear calibrated card mounted slides with 500 line/mm. $35.00 Introduction / Motivation
(Set up an example of the experiment and have students look through a diffraction grating toward an incandescent light bulb (it’s best to turn off overhead lights). Let them see how the light is diffracted, creating a rainbow. Make sure to use an incandescent light.)
Scientists today study the planets and stars around us, painting a picture of the universe we live in and are a part of. To study such far away places, they must use different techniques since they simply cannot go to the nearest star or planet easily. The nearest planet is about 40 million kilometers away. That’s about 23 million miles! To observe the properties of objects so far away, engineers develop tools like space telescopes. Sometimes they create instrumentation, called spectrographs, which help determine what gasses make up the atmospheres of planets, stars, and other objects. A spectrograph shows the colors of light that correspond with a particular gas. We call these spectral lines, and each gas has a different set of lines. A spectrograph uses a diffraction grating like the ones we are using today. A diffraction grating acts like a prism. White light in this light bulb does not have gas around it, so we see a rainbow when we look through the diffraction grating. Light that we see in a neon or
_________________________________________________________________________________ florescent light bulb shows specific spectral lines, so we wouldn’t see a rainbow, we would only see some colors of the rainbow.
When light enters a spectrograph, it comes in through a slit and transmits through the diffraction grating. The light is transmitted at an angle, and produces the spectrum. You can see when you hold the diffraction grating up to your eye and stand in front of the light bulb the rainbows are off to the side, and not in the middle. The grating produces two spectra on either side of the grating, and when engineers design their spectrographs, they simply choose one or the other. When engineers begin to build a spectrograph, the most important thing they do first is find the angle between the light source and one of the spectral lines. Once they find this angle, they can design a box that will best fit the spectrograph. They want to make sure the light falls onto the detector in the instrument. A detector is what collects the data from the spectrograph.
Today, you will be an engineer. You will set up an experiment that will allow you to find the angle that the light transmits through the diffraction grating and then using this information, you will design and build your very own spectrograph. Vocabulary / Definitions
Word Definition Incandescent light bulb A standard light bulb found in most households Spectrum (plural: spectra) The pattern light produces as can be seen through a
spectrograph Spectrograph (also A tool that allows the components of light to be seen Spectroscope) easily with the eye. Diffraction When light bends, as through a prism or diffraction
grating. Diffraction Grating Usually a piece of film designed to act like a prism.
Procedure: Background See Also: Backgrounds from “Building a Fancy Spectrograph” and “Using a Fancy Spectrograph” activities. A spectrograph is a device that takes the incoming light and transforms it into a spectrum. The first spectrographs used photographic paper, which is paper that is coated with light-sensitive chemicals. Today, most spectrographs use what is called a Charge-coupled device or a CCD camera.
_________________________________________________________________________________
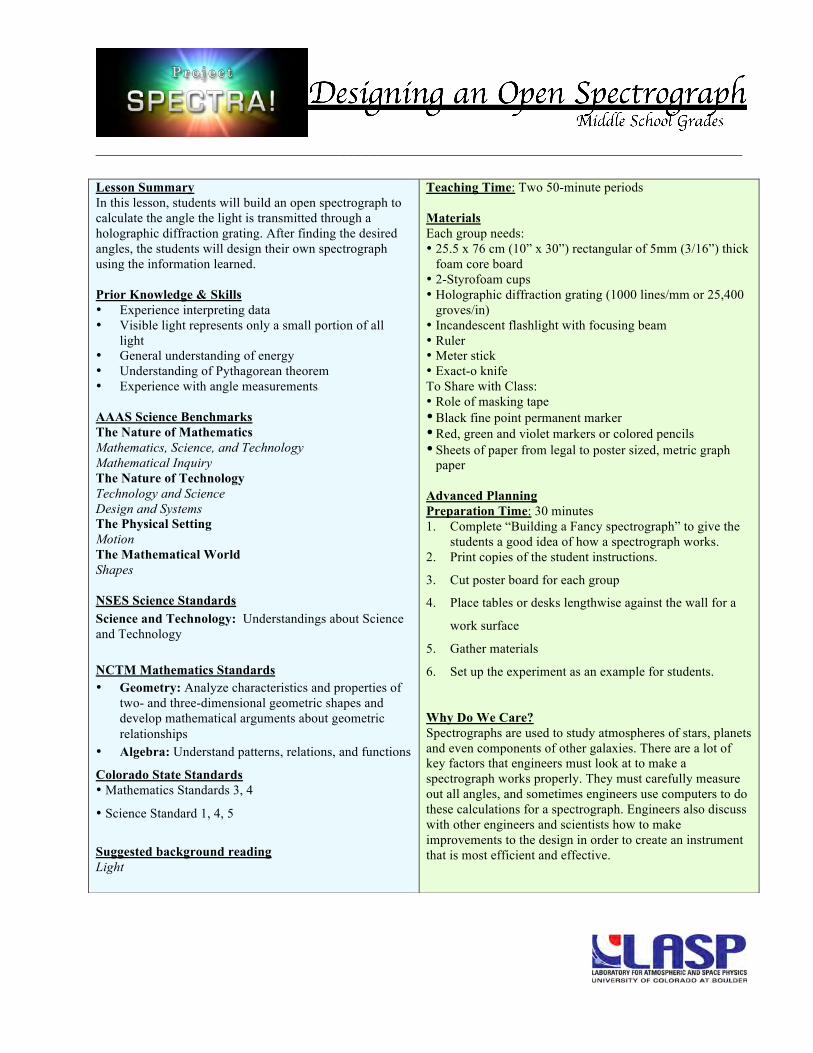
Image 1 Light passes through the slit, creating a spectrum
Here is a diagram of how a simple spectrograph works:
The light passes through the slit. It then makes its way to the Holographic diffraction grating. The holographic diffraction grating used in this experiment is a transmission grating that has 1000 groves/mm. With this number of grooves, the students will only be able to view light with wavelengths between 400 nm and 700 nm, or the visible portion of the spectrum. When the light reaches the holographic grating, the many grooves present on the grating’s surface cause the light to diffract, and separate into a rainbow--or continuous spectrum.
Once the light reaches the grating, it will bend at a certain angle represented by the Greek letter Theta (θ). This angle is different for every wavelength and it is determined through the equation λ = d * sin (θ) where d is 1÷number of lines per mm, and the Greek letter Lambda (λ) is the wavelength of light. What this means is that light hitting the diffraction grating will diffract onto a surface, and the position of the color on that surface is dependent on the color itself! For example, green transmits through the grating at a different angle than violet, etc. The color that diffracts at the biggest angle is red, and the color that has the smallest angle is violet. Using this knowledge, students can construct a rough scale for the grating.
_________________________________________________________________________________
Image 3: The grating stand
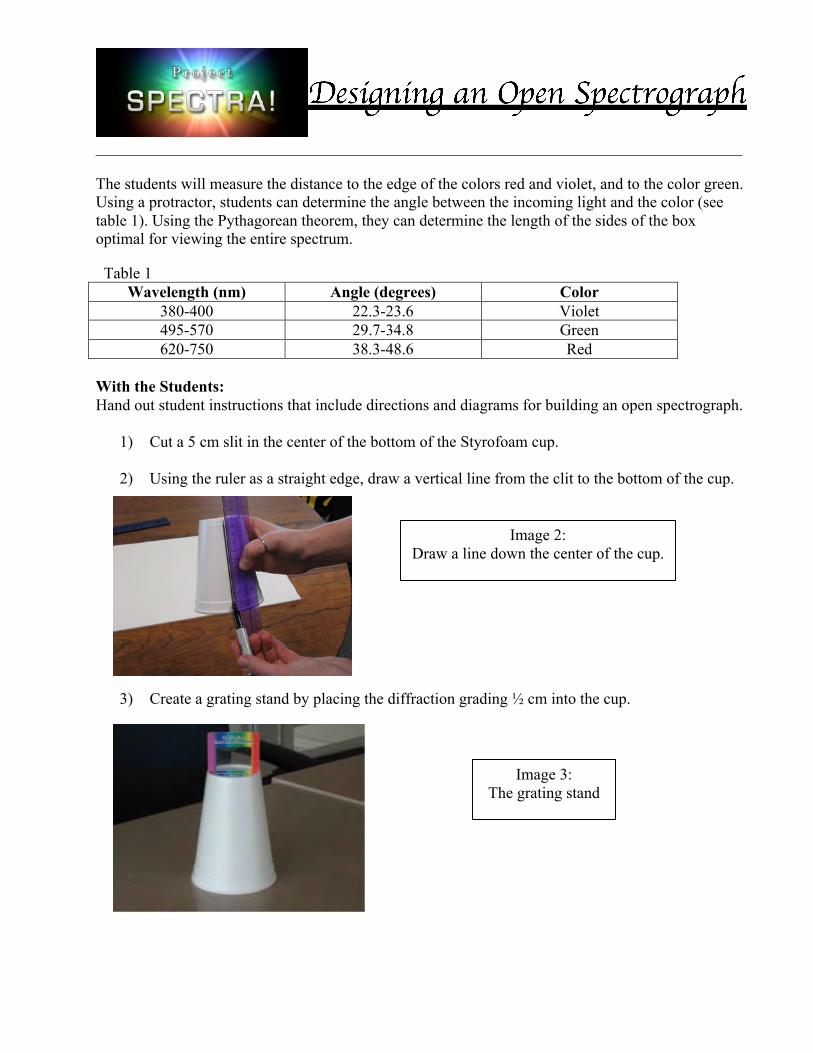
The students will measure the distance to the edge of the colors red and violet, and to the color green. Using a protractor, students can determine the angle between the incoming light and the color (see table 1). Using the Pythagorean theorem, they can determine the length of the sides of the box optimal for viewing the entire spectrum.
Table 1 Wavelength (nm) Angle (degrees) Color
380-400 22.3-23.6 Violet 495-570 29.7-34.8 Green 620-750 38.3-48.6 Red
With the Students: Hand out student instructions that include directions and diagrams for building an open spectrograph.
1) Cut a 5 cm slit in the center of the bottom of the Styrofoam cup. 2) Using the ruler as a straight edge, draw a vertical line from the clit to the bottom of the cup.
Image 2: Draw a line down the center of the cup.
3) Create a grating stand by placing the diffraction grading ½ cm into the cup.
_________________________________________________________________________________
Image 5: The screen
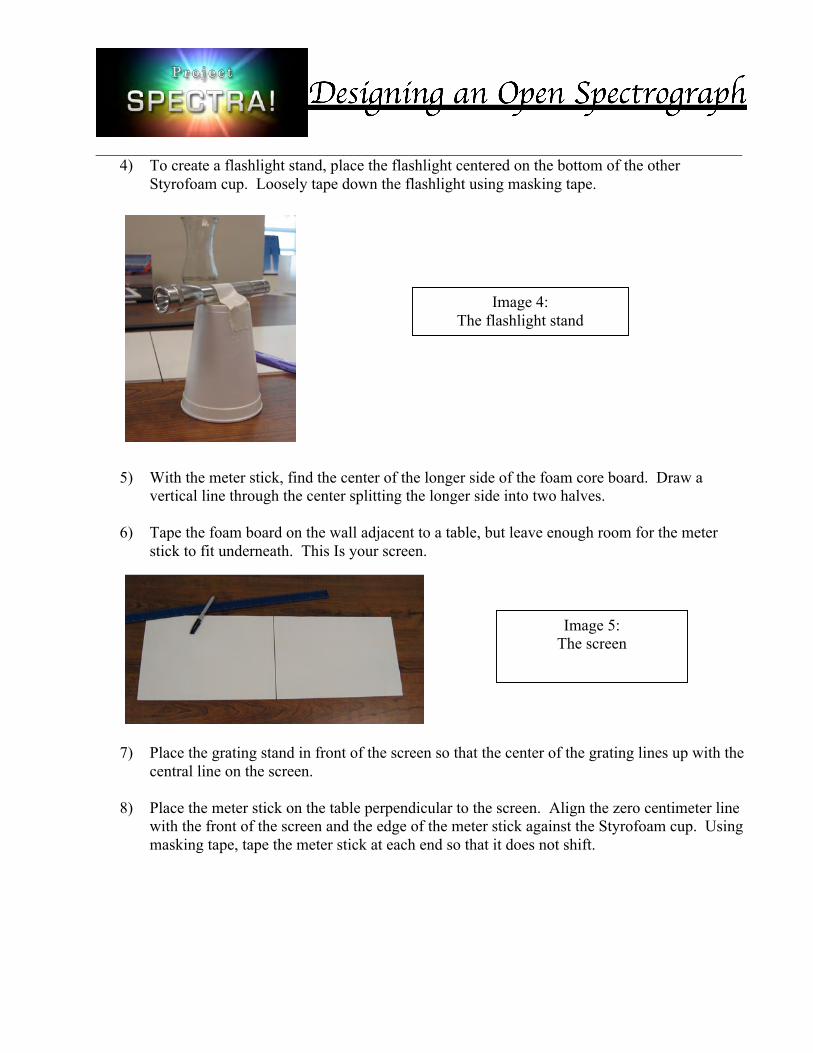
4) To create a flashlight stand, place the flashlight centered on the bottom of the other Styrofoam cup. Loosely tape down the flashlight using masking tape.
Image 4: The flashlight stand
5) With the meter stick, find the center of the longer side of the foam core board. Draw a
vertical line through the center splitting the longer side into two halves. 6) Tape the foam board on the wall adjacent to a table, but leave enough room for the meter
stick to fit underneath. This Is your screen.
7) Place the grating stand in front of the screen so that the center of the grating lines up with the
central line on the screen. 8) Place the meter stick on the table perpendicular to the screen. Align the zero centimeter line
with the front of the screen and the edge of the meter stick against the Styrofoam cup. Using masking tape, tape the meter stick at each end so that it does not shift.
_________________________________________________________________________________
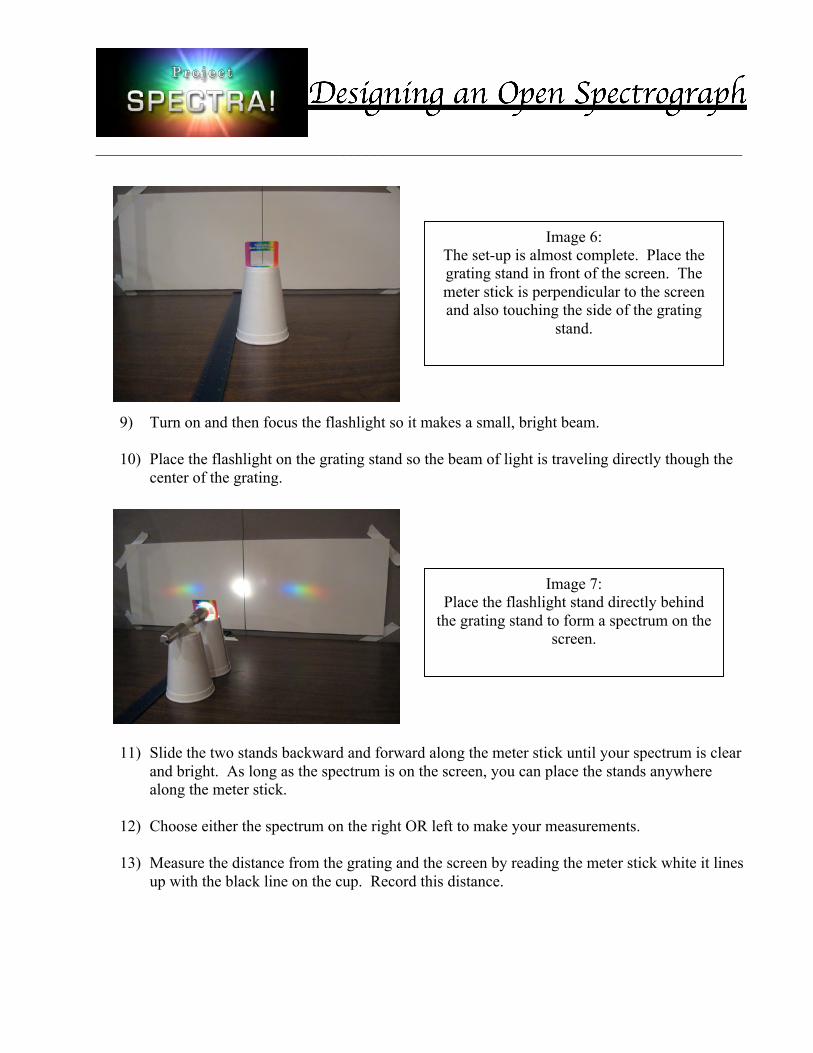
Image 6: The set-up is almost complete. Place the grating stand in front of the screen. The meter stick is perpendicular to the screen and also touching the side of the grating
stand.
9) Turn on and then focus the flashlight so it makes a small, bright beam. 10) Place the flashlight on the grating stand so the beam of light is traveling directly though the
center of the grating.
Image 7: Place the flashlight stand directly behind
the grating stand to form a spectrum on the screen.
11) Slide the two stands backward and forward along the meter stick until your spectrum is clear
and bright. As long as the spectrum is on the screen, you can place the stands anywhere along the meter stick.
12) Choose either the spectrum on the right OR left to make your measurements. 13) Measure the distance from the grating and the screen by reading the meter stick white it lines
up with the black line on the cup. Record this distance.
_________________________________________________________________________________
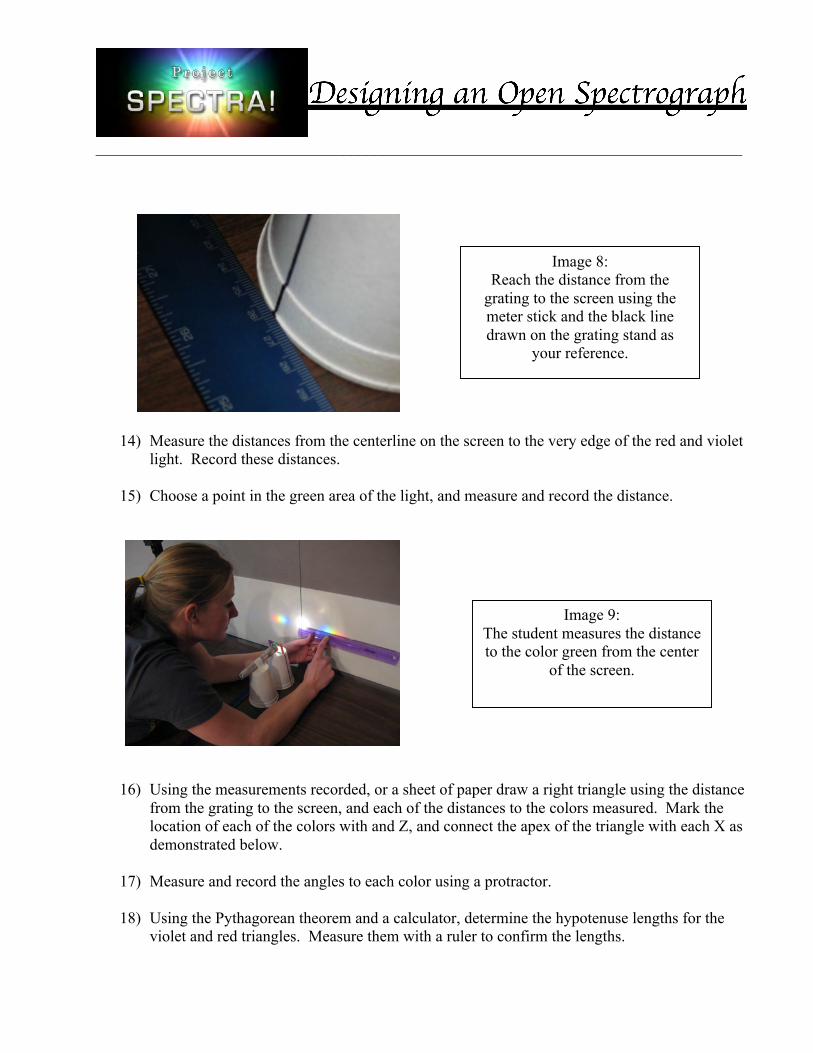
Image 9: The student measures the distance to the color green from the center
of the screen.
Image 8: Reach the distance from the
grating to the screen using the meter stick and the black line drawn on the grating stand as
your reference.
14) Measure the distances from the centerline on the screen to the very edge of the red and violet
light. Record these distances. 15) Choose a point in the green area of the light, and measure and record the distance.
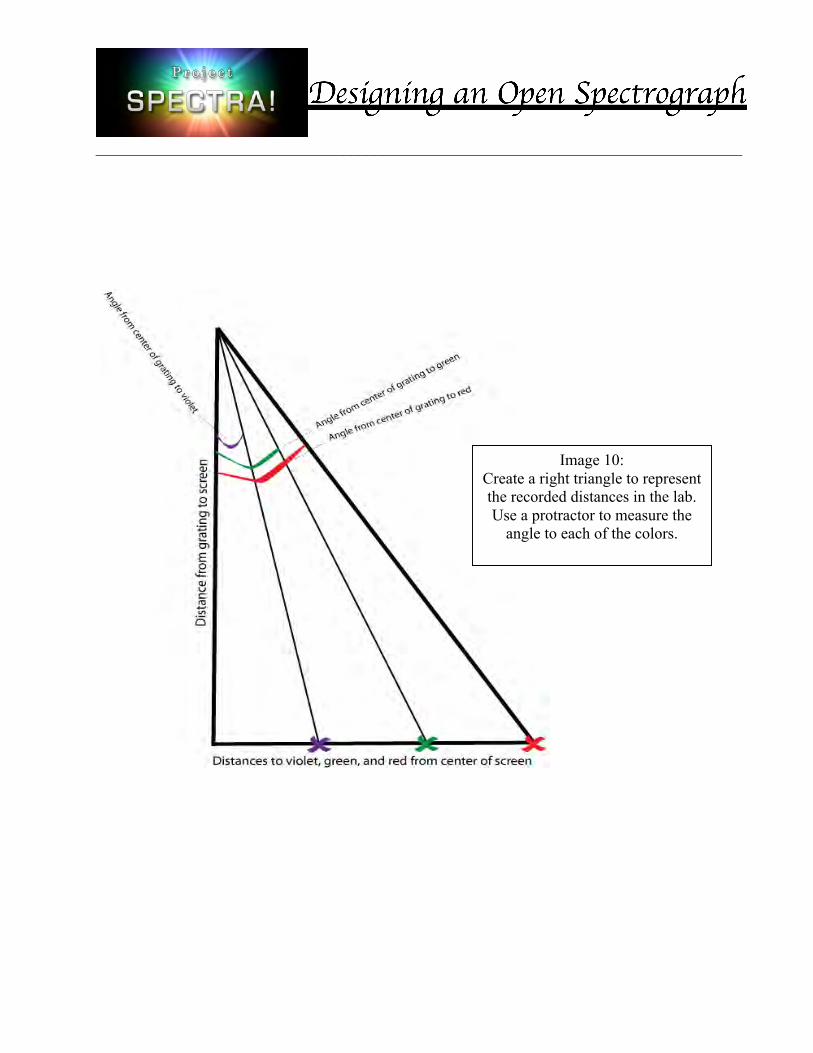
16) Using the measurements recorded, or a sheet of paper draw a right triangle using the distance
from the grating to the screen, and each of the distances to the colors measured. Mark the location of each of the colors with and Z, and connect the apex of the triangle with each X as demonstrated below.
17) Measure and record the angles to each color using a protractor. 18) Using the Pythagorean theorem and a calculator, determine the hypotenuse lengths for the
violet and red triangles. Measure them with a ruler to confirm the lengths.
_________________________________________________________________________________
Image 10: Create a right triangle to represent the recorded distances in the lab. Use a protractor to measure the
angle to each of the colors.
_________________________________________________________________________________
Safety Issues
• Students should know the proper handling procedures for exacto-knives. • Never have students look directly at the Sun, and advise students not to look at the Sun.
Troubleshooting Tips Colorblind and vision-impaired children will have difficulty with portions of this lab. Students with corrective lenses will not have difficulty. Colorblind students can be paired with a student to assist them with the activity. Students may be confused that they see two spectra through the slit. The diffraction grating produces two spectra, and both are a complete spectrum of the source. Make sure the students choose one or the other, but not both. The values for red, violet, and green will vary from group to group. This is because the “edge of the red” etc. is not a concrete definition. It depends on where the students perceive this to be. Students may also be choosing a green color that is more blue or yellow as well. As long as the values for the angles are somewhere in the correct range, the answers are accurate (see table 1). When the students design an enclosed spectrograph, they will need to design a box that is similar to “Building a Fancy Spectrograph” where the light comes through a slit, and the student looks through the grating. In this format, the image forms in the eye, and is not a projection Assessment
Pre-Lesson Assessment
Brainstorming: When making a spectrograph, engineers brainstorm different ideas to make the spectrograph properly. They study the properties of light. Today, you will be like engineers. Brainstorm what you know about light, and also discuss how you think a spectrum forms.
Post-Introduction Assessment
Class Discussion: Have students discuss missions using spectrographs or spectrometers they have heard about and what information the spectrograph or spectrometer helped to find out. If time permits, students can conduct Internet research on missions that use spectrographs.
Post-Activity
Design project: Students can design and build a box for their spectrograph using the measurements from the lab and the knowledge gained from the “Building a Fancy Spectrograph” lesson.
Engineering presentation: Many engineers make presentations to show their ideas and designs for a client’s desired product. Have the students create a presentation and explain to the rest of the class how their spectrograph works. Have a light source so the students can look through each spectrograph. Allow time after each presentation for questions. Make note of these questions and address any conceptual misunderstandings at the end of the presentations. Have the students create a
_________________________________________________________________________________ mission that would be perfect for their new spectrograph. Have the students use their imaginations, making either a realistic or non-realistic mission. Owner Integrated Teaching and Learning Program and Laboratory, University of Colorado at Boulder Contributors Laboratory for Atmospheric and Space Physics, University of Colorado at Boulder Designing an Open Spectrograph: Student Directions Part I Creating an open spectrograph Each team needs: 1- piece of foam core board 2- Styrofoam cups 1- Holographic diffraction grating (1000 lines/mm or 25,400 groves/in) 1- Ruler 1-Meter stick 1-Protractor 1- Exact-o knife 1-Black fine point permanent marker Red, green, and violet markers or colored pencils 1-Incandescent flashlight with focusing beam (LED flashlights will not work. Mini Maglights are recommended) To Share with Class: 1- Role of masking tape Red, green, and violet markers Sheets of paper
_________________________________________________________________________________ Instructions:
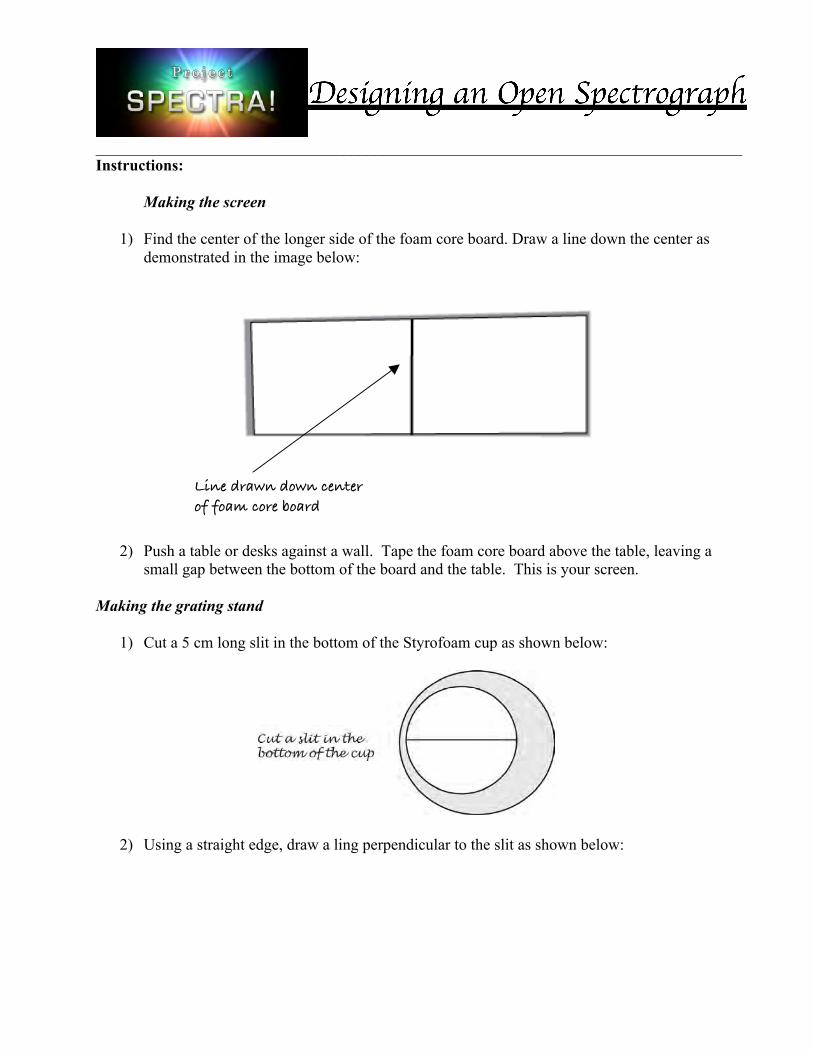
Making the screen
1) Find the center of the longer side of the foam core board. Draw a line down the center as demonstrated in the image below:
Line drawn down center of foam core board
2) Push a table or desks against a wall. Tape the foam core board above the table, leaving a
small gap between the bottom of the board and the table. This is your screen. Making the grating stand
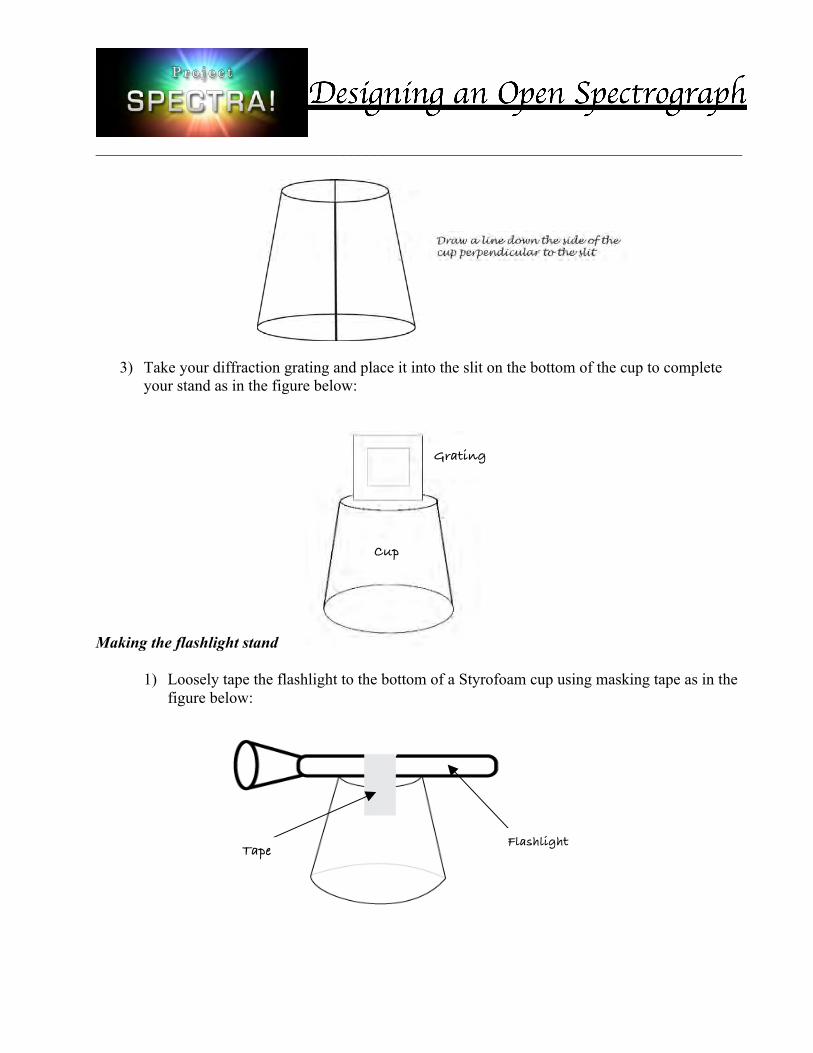
1) Cut a 5 cm long slit in the bottom of the Styrofoam cup as shown below: 2) Using a straight edge, draw a ling perpendicular to the slit as shown below:
_________________________________________________________________________________
3) Take your diffraction grating and place it into the slit on the bottom of the cup to complete
your stand as in the figure below:
Grating
Cup
Making the flashlight stand
1) Loosely tape the flashlight to the bottom of a Styrofoam cup using masking tape as in the figure below:
Flashlight Tape
_________________________________________________________________________________ Experiment:
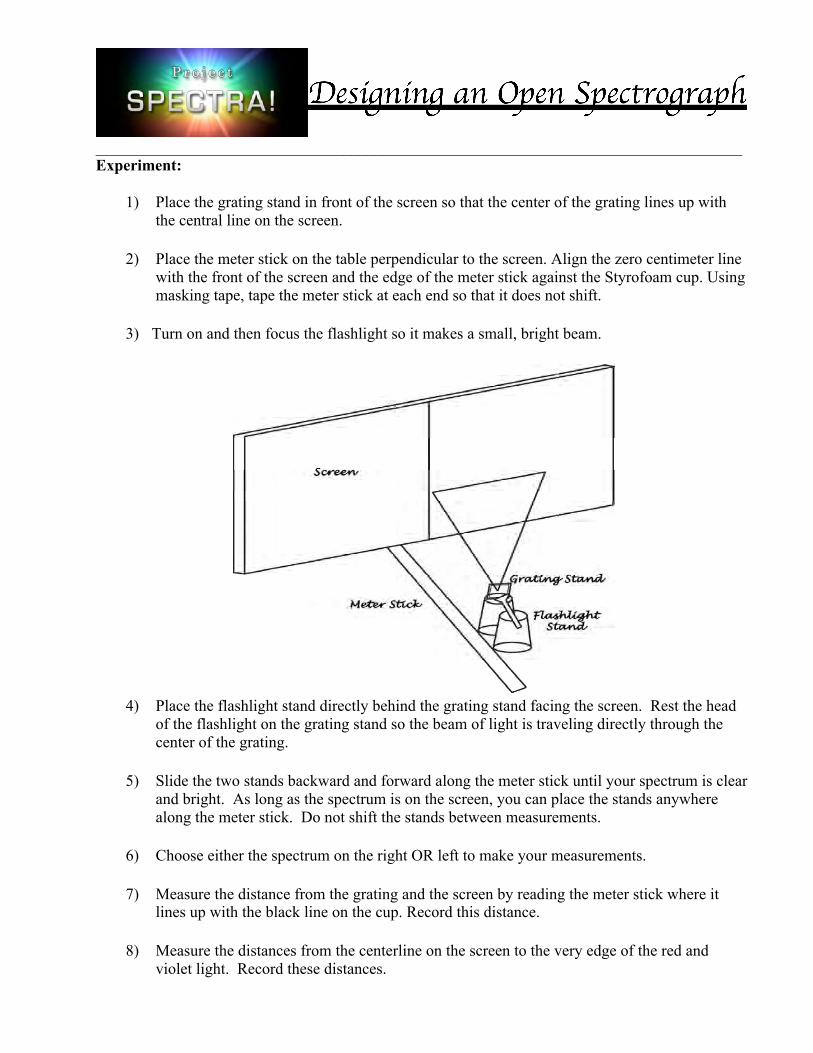
1) Place the grating stand in front of the screen so that the center of the grating lines up with the central line on the screen.
2) Place the meter stick on the table perpendicular to the screen. Align the zero centimeter line with the front of the screen and the edge of the meter stick against the Styrofoam cup. Using masking tape, tape the meter stick at each end so that it does not shift.
3) Turn on and then focus the flashlight so it makes a small, bright beam.
4) Place the flashlight stand directly behind the grating stand facing the screen. Rest the head
of the flashlight on the grating stand so the beam of light is traveling directly through the center of the grating.
5) Slide the two stands backward and forward along the meter stick until your spectrum is clear and bright. As long as the spectrum is on the screen, you can place the stands anywhere along the meter stick. Do not shift the stands between measurements.
6) Choose either the spectrum on the right OR left to make your measurements.
7) Measure the distance from the grating and the screen by reading the meter stick where it lines up with the black line on the cup. Record this distance.
8) Measure the distances from the centerline on the screen to the very edge of the red and violet light. Record these distances.
_________________________________________________________________________________
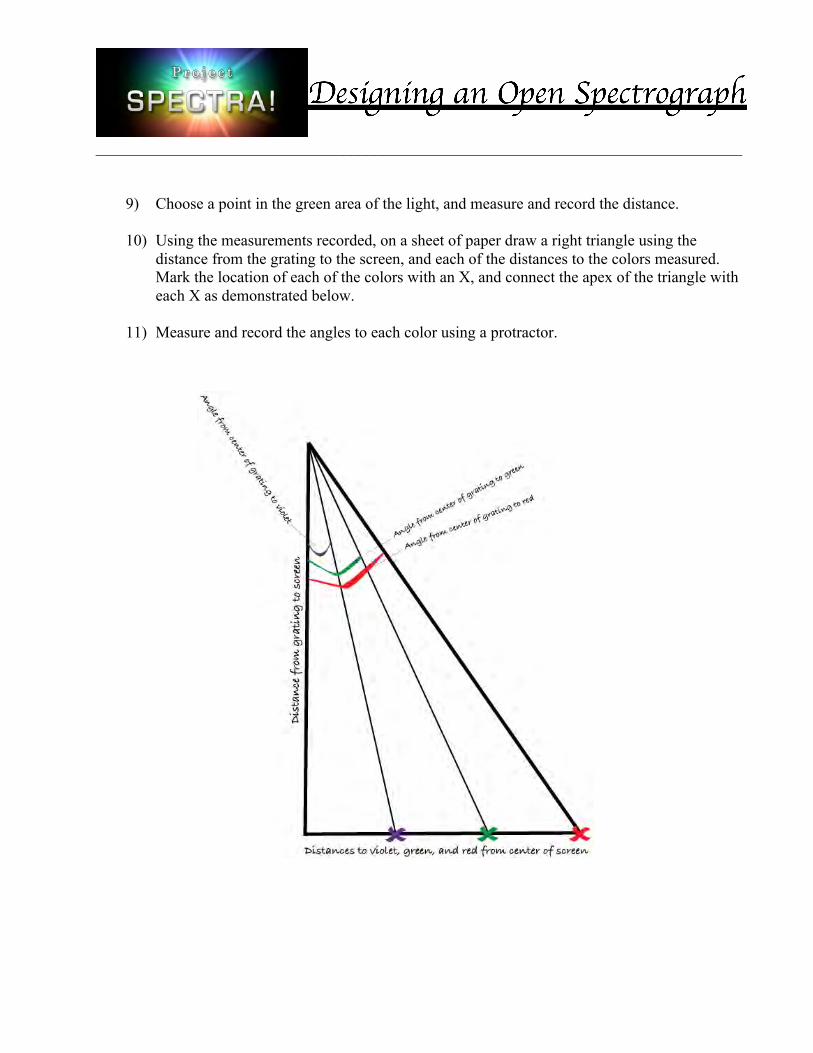
9) Choose a point in the green area of the light, and measure and record the distance. 10) Using the measurements recorded, on a sheet of paper draw a right triangle using the
distance from the grating to the screen, and each of the distances to the colors measured. Mark the location of each of the colors with an X, and connect the apex of the triangle with each X as demonstrated below.
11) Measure and record the angles to each color using a protractor.
_________________________________________________________________________________
12) Using the Pythagorean theorem and a calculator, determine the hypotenuse lengths of the
violet and red triangles. Measure them with a ruler to confirm the lengths. Do your numbers match? Why or why not?
Part II Designing and building a closed spectrograph Now that you have found the angles to the colors in the spectrum, design an enclosed spectrograph with your group. As a group, explore these questions before your start. Shape and size
o What shape will make your spectrum lie on a flat surface? o What is the simplest design to build and look through? o How big does a spectrograph need to be to work? o Is there a limit to how big it could be? o Do you want a smaller spectrograph that is easy to take with you? o What is the best size to use for it to be useful and portable?
Placement and design of Parts
o Where will you place your diffraction grating? o How will the light come through, and how much light is needed? o Where will the light come through, and where will you see the spectrum? o Where will your spectrum be when you look into the spectrograph? o Is there anything you can do to make your spectrum easier to see?
_________________________________________________________________________________
Designing your mission Conduct research and create an imaginary mission your spectrograph might undertake. Consider the following questions as a group:
o Is your mission ground or space-based? o If your mission is space-based, will it orbit the Earth or travel to another planet? o What will your mission goals be? o What limitations does your spectrograph have? o What will the spacecraft look like? o Are there size or weight restrictions you need to consider? o How much will the mission cost?
Presenting your findings Present your design and mission to the rest of the class. Have the class give you feedback, and be open to suggestions. Building your spectrograph
Gather the materials needed to make your spectrograph with your group. Create a materials list for items your teacher needs to buy. Use materials from around your home or school whenever possible. Keep a record of how much the items cost. Estimate cost when necessary. After building the spectrograph, present it to the class along with your mission outcomes, and final cost analysis.