editor’s note - central michigan university 2015... · editor’s note . i am pleased to ......
TRANSCRIPT

Editor’s Note
I am pleased to present for your professional enjoyment and consideration this
edition of The Charter Schools Resource Journal. We had one article that made the cut,
“The Efficacy Of Charter Schools In The San Bernardino City Unified School District
Meeting The Needs Of Students With Disabilities,” written by Gregory A. Jones, California
State University – San Bernardino. Congratulations, Dr. Jones, on your excellent
contribution.
Along with our editorial board, I strive to make this online journal relevant and
important in the field of charter school policy, research, and practice. To that end, we are
contacting various educational databases for inclusion. Thus far, and it is still early, we
have received a positive response from EBSCOhost. We are working with several others.
Our goal continues to be to published two high-quality issues per academic year.
To that end, we ask all of our readers and contributors to please keep us in mind for your
charter school-related research.
Thank you for your interest in this journal!
Respectfully,
David E. Whale, Ed.D.
Editor
Spring 2015

Editor David Whale, Ed.D. Associate Professor Central Michigan University [email protected] Associate Editors Brenda Kallio, Ed.D. Associate Professor University of North Dakota [email protected] Diane Newby, Ed. D. Professor Emeritus Central Michigan University [email protected] Editorial Board Mary Frances Agnello, Ph.D. Assistant Professor Texas Tech University [email protected] Carolyn Brown, B. S. 2nd Grade Teacher Avondale, AZ [email protected] Jabari Paul Cain, Ph.D. Mercer University Assistant Professor [email protected]
Larry Corbett, Ed.D. Associate Professor Central Michigan University [email protected]
Sharon J. Damore, Ed. D. Assistant Professor DePaul University [email protected]
William Leibfritz, Ph.D. Professor Central Michigan University [email protected] Aretha Marbley, Ph.D. Associate Professor Texas Tech University [email protected] Robin Ward, Ph. D. Clinical Assistant Professor Rice University [email protected]
Kathy Lynn Wood, Ph.D. Assistant Professor [email protected] Xiaoping Li, Ed.D. Associate Professor Central Michigan University [email protected]

The Efficacy Of Charter Schools In The San Bernardino City Unified School District Meeting
The Needs Of Students With Disabilities
Gregory A. Jones Ed.D.
California State University, San Bernardino
Biography Dr. Gregory Jones obtained his doctorate in educational leadership at California State University, San Bernardino. He has taught regular, special, and adult education. He assisted in setting up a charter school for the California Conservation Corps, was a principal for a school specifically for emotionally disturbed and special education students. His current research centers on correctional and special education and the changes necessary to prevent those with learning disabilities from becoming incarcerated.
2
Abstract
Charter schools now play a key part in Americans being gainfully employed. This is
essential because young adults with disabilities face difficulties in obtaining employment and
earning a living. Some charter school students fare better than traditional school students, while
others do worse. The exception is students with disabilities, in that they excel and outperform in
the charter school environment. This is not the case with San Bernardino City Unified School
District charter school students with disabilities. Not only do they not outperform their regular
education peers, but actually regress in their academic performance. The results of this study
showed that only one charter school of the eight examined met all its target goals. The four of
eight charter schools were not meeting their target goals, but in fact their students learning
outcomes decreased, which is unacceptable by the standards set by NCLB.
Key words: charter school students with disabilities, learning outcomes, San Bernardino City
Unified School District, and proponents and critics.
3

Introduction
A major step toward adulthood for Americans is employment. "Getting and keeping a
good job is a major benchmark of adult status" (Fourqurean, Meisgeier, Swank, & Williams,
1991, pp. 400; Furstenburg, Kennedy, McLoyd, Rumbaut, & Settersten, 2004; Hendey &
Pascall, 2001) Being gainfully employed and functionally independent is expected after high
school (Harvey, 2001). This means meeting the needs of employment, housing, and healthcare
(Hendey & Pascall, 2001). In order to accomplish these goals, today's global economy calls for
new technological skills, which should be provided by vocational counselors and educators
(Rojewski, 1999; Johnson, Stodden, Emanuel, Luecking, & Mack, 2002). Unfortunately, this has
proven difficult for those with special needs.
Vulnerability of Those with Special Needs
Young adults with disabilities face significant difficulties in obtaining employment,
accessing postsecondary education, and living independently (Johnson, Stodden, Emanuel,
Luecking, & Mack, 2002). Those with severe disabilities have a 30.7% chance of obtaining
employment, compared to 75.2% for those with nonsevere disabilities, and 83.5% for those with
no disability. Of those with severe disabilities, 27.1% live in poverty compared to 12% of those
with nonsevere disability, and 9.1% of those with no disabilities (Brault , 2008).
No Child Left Behind (NCLB) Correcting Educational Imbalance
A report by the National Commission on Excellence in Education, titled "A Nation at
Risk," asserted that America's educational system was not preparing its students for the labor
market and was falling short of providing equitable opportunities for all U.S. children. It stated
3
that nothing short of a major structural change will fix these problems (Goldberg & Harvey,
1983). The goal of No Child Left Behind of 2002 (NCLB) is to improve public school programs
for all students from diverse, multicultural, and poverty backgrounds, with emphasis in special
education (Rhim, Lange, & Ahearn, 2005). Any schools that chronically did not make Adequate
Yearly Progress (AYP) are to be restructured. Charter schools now play a key part in the high-
stakes accountability of NCLB (Nelson, Rosenberg, & Van Meter, 2004).
Parents who enroll their children in a charter school do so because of its attractive
features and negative experiences with the previous school. Regrettably, because of their lack of
extracurricular activities and transportation, staff at some charter schools counsel parents against
enrolling their child if he/she has a disability (Prothero, 2014). The Department of Education
mandates that "charter schools may not ask or require students or parents to waive their right to a
free appropriate public education in order to attend the charter school. Additionally, charter
schools must provide non-academic and extracurricular services and activities in such a manner
that students with disabilities are given an equal opportunity to participate in these services and
activities" (Lhamon, 2014, p.5). Parents of children with disabilities go to great lengths to see
that their needs are met. Diana Diaz-Harrison enrolled her son who has autism into a charter
school because she felt the traditional public schools are not addressing his needs. Some charter
schools are designed specifically for children with disabilities or are considered at-risk (Nelson,
Rosenberg, & Van Meter, 2004). While this may be acceptable to some, others feel that this does
not allow SPED students to interact with other children. The concern that some in the special
education community have is that this is a step backwards towards segregating this student
population. To address the matter of segregation, some charter schools have a 30-70 split
between special and general education students. Still, parents such as Diana Diaz-Harrison, feel
4

that the benefits outweigh the risks. As of 2012, there are 100 charter schools that are specifically
for the disabled (Prothero, 2014).
History and Operations of Charter Schools
History.
Charter schools are public schools that operate under the authority of a state charter
statute, but are exempt from specific state or local regulations. This grants them greater
autonomy to create successful learning environments, but with this autonomy comes increased
accountability (Rhim, Lange, & Ahearn, 2005). In 1988, Albert Shanker first introduced charter
schools as a means to improve public school education. They would be created by groups of
teachers and/or parents wanting to improve on both instruction and student learning. Over time,
this would set in motion a "cycle of curriculum improvement and renewal” (American
Federation of Teachers, 2002. p.9). The intended purpose behind public charter schools was to
"provide opportunities for teachers, parents, pupils, and community members to establish and
maintain schools that operate independently from the existing school district structure” (Green,
2011). The assumption is that greater autonomy, such as teacher autonomy and types of
instruction, will promote innovation and change (Finnegan, 2007).
Charter schools are based on the premise that the "market-based reforms" of parental
choice will introduce competition into public education and, thereby, foster improved schools
and student achievement (Rhim, Lange, & Ahearn, 2005). The American Federation of Teachers
(AFT) first supported the creation of charter schools in the beginning, with the goal of providing
parents with alternative schools that would be held accountable and would offer teachers new
professional opportunities. The AFT also insisted that charter schools protect the rights of
5

teachers. According to this report, charter schools have failed to live up to these goals. Although
they do not make a point of selecting only the best students, they have neglected low-income,
English language learners, and special education students (American Federation of Teachers,
2002).
In 1992, California became the second state to allow the creation of charter schools. The
Charter Schools Act of 1992 was the original legislation authorizing the creation of charter
schools and allowing them to be exempt from existing education laws (Hill, 2004). The first
charter schools opened in the 1993-94 school year. It has been found that charter schools are
cost-effective in that their students achieve the same academic results as those of traditional
public schools, even though their cost of operation is less. The California Legislature's intent
behind establishing charter schools was to provide opportunities for teachers, parents/guardians,
pupils, and community members to establish charter schools for the purpose of:
1. Improving student learning.
2. Increasing learning opportunities for all students.
3. Encouraging use of different and innovative teaching methods.
4. Creating new professional opportunities for teachers.
5. Providing parent/guardians and pupils with more varied choices of education.
6. Holding charter schools accountable for student performance.
7. Providing competition within the public school system. (California School Boards
Association, 2009)
6
Supporters and Non-supporters of Charter Schools
There are opposite views as to the efficacy of charter schools in addressing the needs of
their students. Supporters of charter schools claim that charter schools will encourage innovation,
be more accountable and focus on results, expand school choice, provide new professional
opportunities for teachers, require little or no additional money, and act as a catalyst for
improvement (American Federation of Teachers, 2002). Non-Supporters of charter schools
believe that charter schools will, enroll more affluent students, be no more innovative than public
schools, rely on low-paid and inexperienced teachers, exploit teachers and other educational
personnel, reduce resources to traditional schools, be no more accountable, and maybe even less
accountable, and undermine the democratic nature of public schooling in America (American
Federation of Teachers, 2002).
Percentage of Students with Disabilities Enrolled In Charter Schools vs. Traditional Schools
The study done by Rhim and Lange (2005) shows that the percentage of students with
disabilities enrolled in charter schools is essentially that of the national average, which counters
critics' assertions that charter schools are not enrolling a proportionate number of students with
disabilities. The overall charter school population of students with disabilities was a mean of
12.76%, which is higher than the national average of 11.5% (Rhim, Lange, & Ahearn, 2006).
The study did not show the types of disabilities, which may support the criticism of enrolling
students with less severe disabilities (Rhim, Lange, & Ahearn, 2005). As of 2011, 7% of
California's K-12 student population is now enrolled in charter schools (Green, 2011).
One significant difference is that charter schools are more likely to mainstream special
education students (39%), with 64% for start-up schools in comparison to 19% for traditional
7

schools, and are less likely to use pull-out programs (37%), compared with traditional schools
(61%). One reason might be the number of special education teachers: only 2% make up the
teaching staff for start-up charter schools, with 16% for conversion charter schools (Hill, 2004).
The Government Accountability Office (GAO) found that the special education services that
were provided in charter school regular classrooms were "pull-out" sessions. This service, along
with others, were provided to compensate for not having self-contained classrooms available
(United States Government Accountability Office, 2012).
Results of Educational Efforts toward Students With/Without Disabilities Student Success
A report by the National Assessment of Education Progress in 2004 showed conflicting
results of charter school student outcomes (Rhim, Lange, & Ahearn, 2005). A study by the
RAND Corporation for the 2001-02 school year found that charter schools' API scores were not
significantly different from traditional public schools. While another study showed charter
schools attained higher test scores than traditional public schools in almost every grade level and
subject (Hill, 2004).
A recent study by the RAND Corporation (2009) showed that charter schools compared
with traditional schools are able to raise student achievement levels, but they vary greatly.
Virtual charter schools tend to have lower test scores compared to traditional schools. First-year
charter schools have a negative impact on student scores, but this is also common for first-year
traditional schools. It was shown that charter school students have higher rates of graduation and
attending college (RAND, 2009).
8

However, the American Federation of Teachers found charter school students generally
do not do better, but in fact are often worse when compared with traditional school students.
Charter schools have not been held to the agreement that they will trade freedom for increased
accountability. Charter schools are supposed to experiment with new curricula and classroom
practices, but have proven no more innovative than traditional schools. In fact, they sometimes
import existing programs from the school districts they are in (American Federation of Teachers,
2002). Loveless's study (2002) discovered that, nationally, charter schools scored significantly
lower than traditional public schools, whereas, Greene, Forster, and Winters (2003) encountered
that charter schools outperform traditional public schools (Finnigan, Adelman, Anderson,
Cotton, Donnelly, & Price, 2004).
A report issued by the Center for Research on Education Outcomes (2009) found that
17% of California charter schools reported academic gains significantly higher than traditional
schools, 37% showed gains that were worse, and 46% showed no significant difference (Rhim,
Faukner, & McLaughlin, 2006).
An additional study done by the Center for Educational Reform in 2010 showed more
positive results. Eighty-five percent of Colorado's charter elementary schools made Adequate
Yearly Progress (AYP) compared to 75% of traditional elementary schools. Eighty-one percent
of charter middle schools made AYP, compared to 49% of traditional middle schools. Eighty-
one percent of Georgia's charter school students made AYP compared to 79% of their traditional
school peers. From 2004 to 2007, 17 percent of California's charter schools gained over 50 API
points, compared to only 6 percent for traditional schools. In 2008, Los Angeles charter schools
9
had a median API score of 728 compared to 663 for traditional schools (Center for Education,
2013).
Proponents and Critics of Charter Schools
There are arguments for and against charter schools. The proponents:
• Traditional schools fail to provide students with adequate educational opportunities.
• School districts become mired in bureaucracy and are ineffective in responding to these
limitations.
• Charter schools have greater academic and financial autonomy and more direct
community accountability.
The critics:
• Charter schools divert financial and teaching resources.
• Charter schools serve only a small fraction of California's students and have not proven
to be academically secure.
• Charter schools lack proper accountability. (Green, 2011)
Accountability.
One of the concerns expressed by charter schools includes accountability measures and
how this applies to children with disabilities. Accountability should not force charter schools to
counsel-out children from enrolling (Nelson, Rosenberg, & Van Meter, 2004). Advising families
of students with disabilities that they should not attend because the school cannot provide
modifications and accommodations is discriminatory and illegal (California Department of
Education, 2007).
10

One way of reducing the number of students with disabilities enrollment is by having
parents sign a contract that they are committed to working at the school for a certain number of
hours or to monitor their children's homework every night. For upper and middle-class parents
this may not pose a problem, but can act as a deterrent for parents that are forced to work two or
more jobs. Moreover, charter schools have elected not to offer free or affordable transportation
and school lunch programs which can also act as a deterrent (American Federation of Teachers,
p. 17, 2002).
As a final point, approximately 6,700 charter schools have been opened nationwide with
1,036 being closed since 1992, and out of the 1,100 charter schools that have been approved in
California, only 17% of them have been closed (Consoletti, 2011).
California Charter School Association
In response to the statements leveled against charter schools, it would be only fair to
allow the California Charter School Association (CCSA) to address these various accusations.
Some say that charter schools are unwilling to service students with disabilities by often
"counseling out" or referring students with disabilities to other schools. Others accuse charter
schools of enrolling only students with mild to moderate disabilities. CCSA contends that charter
schools take seriously their responsibility to service all students, even those with exceptional
needs. To accomplish this goal, CCSA works with its charter school members to provide and
ensure compliance of special education services by building a statewide infrastructure of
resources available to all charter schools (California Charter School Association, 2013).
In response to the accusations that charter schools only accept the "cream of the crop"
and reject underperforming students, the CCSA asserts that charter schools do not recruit and
11

select the best students. Charter schools are required by law to hold a public lottery to determine
who will enroll and so cannot engage in selective admission policies. It is argued that California
charter schools serve a large number of low-achieving and at-risk students (California Charter
School Association, 2013).
To answer the charge that charter schools do not provide special education services,
CCSA states that charter schools are committed to serving students with disabilities because they
are designed to be more flexible and are therefore uniquely situated to provide innovative, high-
quality educational services (California Charter School Association, 2013).
In reply to the myth that charter schools do not reflect the diversity of the communities
they serve, CCSA states that between 2010 and 2011, 45% of charter school students were
Hispanic/Latino, 33% were white, 11% were African-American, 4% Asian, and 5% other
(Indian, Pacific Islander, and Multi-racial subgroups) (California Charter School Association,
2013).
Finally, it is claimed that charter schools are not held accountable for academic
performance. CCSA maintains this is completely false in that charter schools are held
accountable by the local school districts and the families they represent. When a charter school
submits its petition, it must define its academic goals. In order to continue, they must meet or
exceed those goals. Secondly, families can remove their children if they are dissatisfied with the
school (California Charter School Association, 2013).
Reason behind Students With/Without Disabilities Performance Levels
It is interesting to note that one feature stands out, the academic performance between
regular and special education students; regular charter school students perform below their
12

traditional school peers, whereas, special education charter school students outperform their
traditional school peers.
In California, special education students are achieving academic proficiency slightly
higher than their peers in traditional schools, particularly in English, while proficiency levels for
general education students scored the same or below students in traditional public schools (Rhim,
Faukner, & McLaughlin, 2006). Charter schools are reducing the number of special education
students by using early intervention strategies to keep students performing at grade level, along
with providing quality education in a regular classroom setting (Rhim, Faukner, & McLaughlin,
2006).
Kolderie's blueprint for charter schools states that these new schools must be "clear of
traditional requirements" in order to "produce a different school; not a replica of the school that
exists today" (Kolderie, 1990, p.8). One of the possible reasons for this difference is that the
parents tend to have a higher level of education and are more involved in their child's schooling
(Rhim, Faukner, & McLaughlin, 2006). Another reason is a general shortage of qualified special
education teachers and specialists. Charter schools struggle to hire and retain special education
staff (Nelson, Rosenberg, & Van Meter, 2004). This forces charter schools to place their students
with disabilities in general education classroom. The services offered in this setting are
individual and small-group instruction, assistive technology, and resource specialists (Rhim,
Faukner, & McLaughlin, 2006).
This instruction is appropriate, adaptive, accommodative, and modified by including:
changing the manner in which the material is presented; creating personalized study guides;
adapting textbooks; arranging the classroom environment; altering task requirements; selecting
13
alternative tasks; managing classroom behavior; promoting social acceptance; and using assistive
technology (California Department of Education, 2007). Charter schools’ approach toward
adaptive and individualized instruction may not have benefited regular education students, but
has proven effective for students with disabilities. Nevertheless, the question remains as to the
gap between special and regular education students attending charter schools.
Gap between Charter School Special and Regular Education Students
The Government Accountability Office (GAO) found that twenty-three percent of charter
school students were classified with disabilities compared to thirty-four percent of traditional
schools (United States Government Accountability Office, 2012). The study found that the
explanations are complex and not attributed to SPED students leaving charter schools. The
findings of this study gave a number of explanations for this difference. Students with autism and
those who have a speech or language impairment are less likely to enroll in a charter school. This
gap in special education enrollment continues from kindergarten up to third-grade, but a major
contributor behind this is that charter schools are more likely to declassify eighty percent of their
special education students. The other twenty percent of those students have transferred between
charter and traditional schools (Winters, 2013). Instead of pushing SPED students out, more are
enrolled in charter schools rather than leaving them. Special education students in traditional
schools tend to change schools more often than those of charter schools. About sixty-five percent
of charter school students stayed in their original school, compared to thirty-seven percent of
traditional school students (Winters, 2014). This gap can also be attributed to the increase of the
enrollment of general education students.
14
The study also showed the longer a special education student attends a charter school the
more likely he/she will be declassified (Winters, 2013). This is meaningful since this is the
primary goal of special education. More attention should be placed on identifying and replicating
the effective academic and behavioral practices that allow charter and traditional schools to
declassify students. Charter schools should be commended rather than penalized for this
accomplishment. Another contributing factor is that students with special needs are less likely to
enroll in a charter school in kindergarten and sixth grade which is often the time when students
enroll in a new school (Winters, 2014).
Design and Theoretical Framework
Methodology
The study was an intrinsic case study dealing with charter schools operating in the San
Bernardino City Unified School District. A quantitative approach was employed using Data
Quest, a California database that collects the API scores of all charter schools and the district.
This data was analyzed using the quantitative analysis program SPSS to compare the
performance of charter schools with the district.
Hypothesis
The hypothesis was formed from a number of concerns as to the efficacy of charter
schools. States rarely hold charter schools accountable. Many charter schools do not enroll a
child if they have special needs. Charter schools often use outside sources to service students
with disabilities; this can prove to be below par. Out of these concerns came the research
question, "how effective are SBCUSD charter schools in meeting the needs of students with
15

disabilities?" From this question the hypothesis was derived that SBCUSD charter schools are
meeting the needs of students with disabilities.
The study answered the question, "How effective are SBCUSD charter schools in
meeting the needs of students with disabilities?" This was accomplished by examining if charter
schools have met their API target goals of 2011-2013 for regular, special education, and
socioeconomically disadvantaged students.
Settings and Context
The San Bernardino City Unified School District was founded in 1964 when it merged
with the San Bernardino High School District (Wikipedia, 2012). It is the eighth largest school
district in California, with over 54,379 students, of which 70.8% are Hispanic, 14.9% are
African-American, 9.2% are Caucasian, 1.7% are Asian, and 1% are multiple races. The district
is made up of 44 elementary schools, 10 middle schools, 8 high schools, 3 special education
schools, and 1 adult school. Of these, 13 are charter schools authorized by the district. The
charter schools are composed of different grade levels: 3 are grades K-12, 2 are grades K-8, 1 is
grades K-7, 2 are grades K-6, 2 are grades 7-12, 1 is grades 6-12, 1 is grades 6-8, and 1 is grades
9-12 (San Bernardino City, 2013).
Data Collection
Out of the 13 charter schools, only eight had API scores: ASA, Casa Ramona, EXCEL
Prep, Hardy Brown, New Vision, Options for Youth, Public Safety, SOAR, and SBCUSD. The
dataset was taken from Data Quest, which shows the individual scores for charter schools and
SBCUSD for 2011-2013 and whether the projected growth targets were met. The State separates
16

growth targets into three groups: schoolwide; all student groups; and all targets. To gauge the
performance levels between charter schools and district the data was divided into four sets:
overall API scores; API scores for Learning Disabilities (LD) ; charter versus SBCUSD overall
scores; charter versus SBCUSD API scores for LD. Missing values were replaced by substituting
them with new values by using the Replaced Missing Values function of SPSS, this was
compared with listwise values (missing values that were not replaced) to see if the difference
was significant. This was critical since 8 of 24 values were replaced.
Data Analysis
The study examined:
• How the District's charter schools are performing.
• Are some charter schools outperforming others?
• The differences of the API scores between regular, special education, and socio-
economically disadvantaged students by comparing the mean of the charter schools with
the district to see if there was any significant difference.
Results
To measure student performance of these eight charter schools, an analysis of their API
scores for the past three years, from 2011-2013 was performed. One-way ANOVA (analysis of
variance) was used to measure the differences of the individual schools in comparison to each
other to see if they were statistically significant at the p<.05 level. The ANOVA is a statistical
technique which compares different sources of variance within a dataset to determine if there are
significant differences between two or more groups. The theory behind ANOVA is that it
17

calculates the ratio of the actual difference to the difference expected. This ratio is called F ratio
which is the actual difference in the variance between groups and the expected difference in
variance among groups.
Charter School Performance
This data analysis dealt with whether charter schools outperform each other and the
district. This was addressed by the use of one-way ANOVA to compare the differences between
charter schools and the district to see if there was a significant difference. This was separated
into combined regular and special education, and specifically special education.
Regular and Special Education
Overall Individual API Scores
The one-way between-subjects analysis of variance produced a significant difference in
API scores F (8, 17) = 10.053, P =. 000, indicating that there was a difference among of the
means between individual mean scores of charter schools and SBCUSD. This difference in the
API scores is shown in the Multiple Comparisons table. Four out of the eight API scores for the
charter schools and district were significantly different from those of SOAR's API scores.
Table 1
Overall Individual API Scores
SMEAN (Scores) Sum of Squares df Mean Square F Sig. Between Groups Within Groups Total
67885.628 14349.333 82234.962
8 17 25
8485.704 844.078
10.053 .000
F (8, 17) = 10.053, P =. 000
18
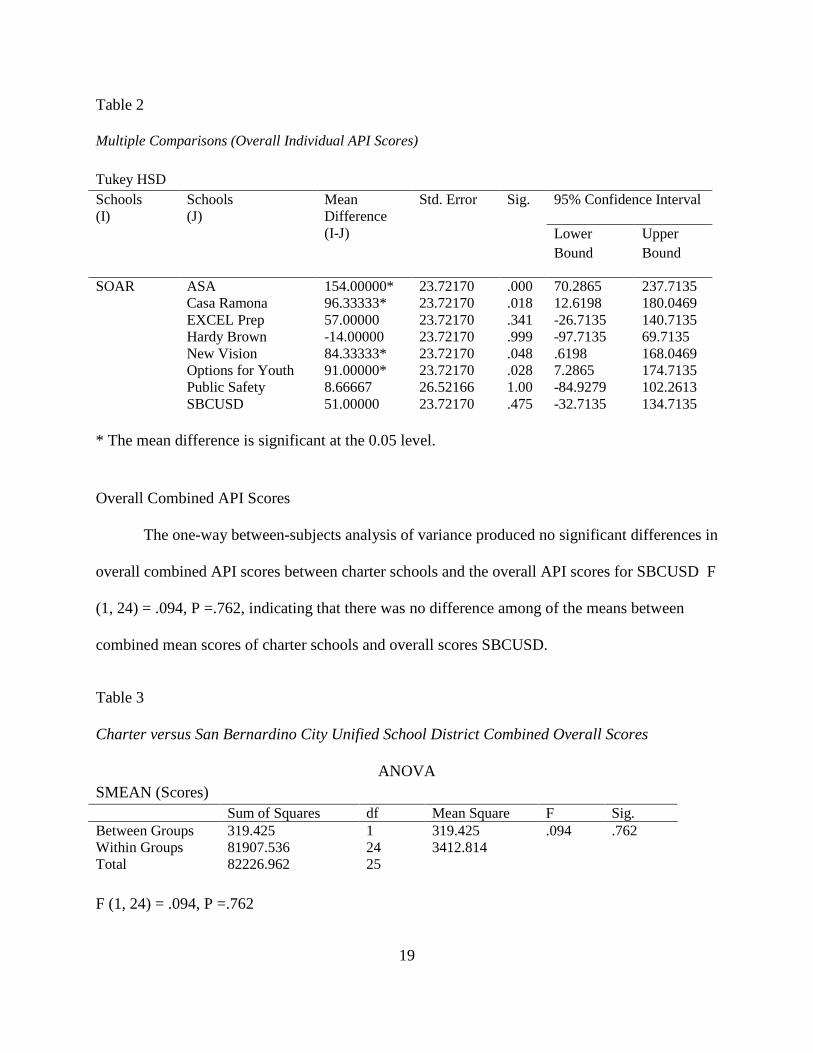
Table 2
Multiple Comparisons (Overall Individual API Scores) Tukey HSD Schools (I)
Schools (J)
Mean Difference (I-J)
Std. Error Sig. 95% Confidence Interval
Lower Bound
Upper Bound
SOAR ASA Casa Ramona EXCEL Prep Hardy Brown New Vision Options for Youth Public Safety SBCUSD
154.00000* 96.33333* 57.00000 -14.00000 84.33333* 91.00000* 8.66667 51.00000
23.72170 23.72170 23.72170 23.72170 23.72170 23.72170 26.52166 23.72170
.000
.018
.341
.999
.048
.028 1.00 .475
70.2865 12.6198 -26.7135 -97.7135 .6198 7.2865 -84.9279 -32.7135
237.7135 180.0469 140.7135 69.7135 168.0469 174.7135 102.2613 134.7135
* The mean difference is significant at the 0.05 level.
Overall Combined API Scores
The one-way between-subjects analysis of variance produced no significant differences in
overall combined API scores between charter schools and the overall API scores for SBCUSD F
(1, 24) = .094, P =.762, indicating that there was no difference among of the means between
combined mean scores of charter schools and overall scores SBCUSD.
Table 3
Charter versus San Bernardino City Unified School District Combined Overall Scores
ANOVA SMEAN (Scores) Sum of Squares df Mean Square F Sig. Between Groups Within Groups Total
319.425 81907.536 82226.962
1 24 25
319.425 3412.814
.094 .762
F (1, 24) = .094, P =.762
19
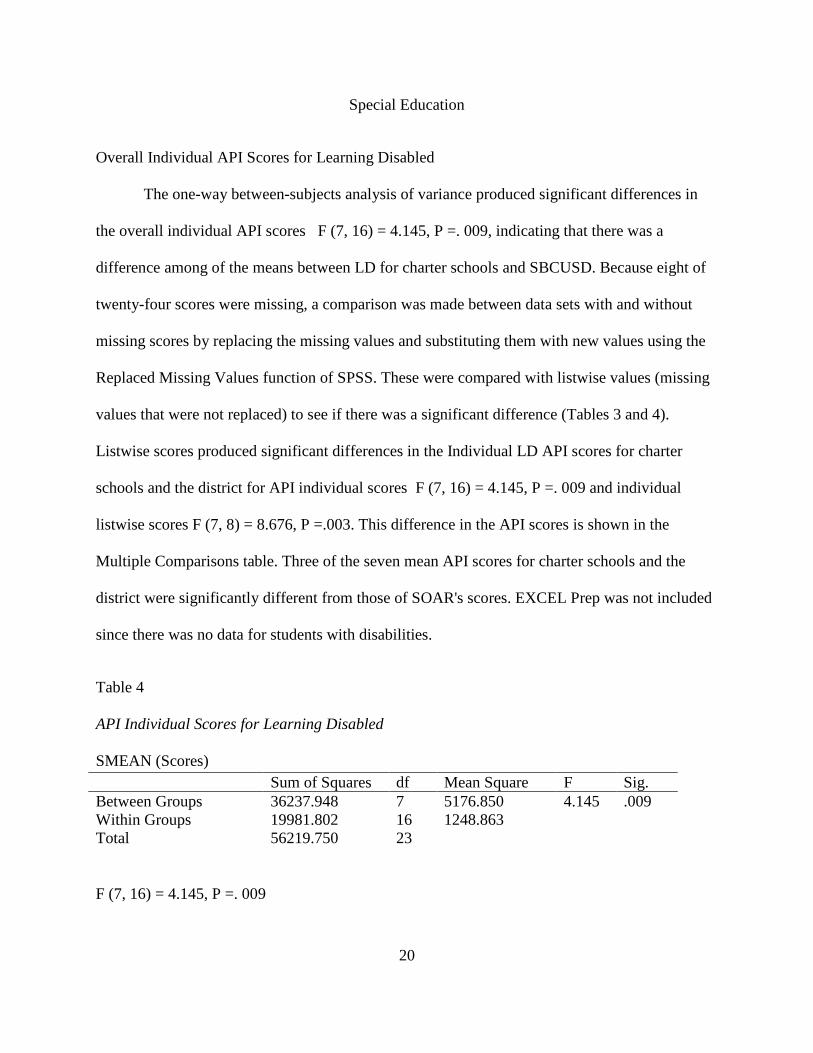
Special Education
Overall Individual API Scores for Learning Disabled
The one-way between-subjects analysis of variance produced significant differences in
the overall individual API scores F (7, 16) = 4.145, P =. 009, indicating that there was a
difference among of the means between LD for charter schools and SBCUSD. Because eight of
twenty-four scores were missing, a comparison was made between data sets with and without
missing scores by replacing the missing values and substituting them with new values using the
Replaced Missing Values function of SPSS. These were compared with listwise values (missing
values that were not replaced) to see if there was a significant difference (Tables 3 and 4).
Listwise scores produced significant differences in the Individual LD API scores for charter
schools and the district for API individual scores F (7, 16) = 4.145, P =. 009 and individual
listwise scores F (7, 8) = 8.676, P =.003. This difference in the API scores is shown in the
Multiple Comparisons table. Three of the seven mean API scores for charter schools and the
district were significantly different from those of SOAR's scores. EXCEL Prep was not included
since there was no data for students with disabilities.
Table 4
API Individual Scores for Learning Disabled
SMEAN (Scores) Sum of Squares df Mean Square F Sig. Between Groups Within Groups Total
36237.948 19981.802 56219.750
7 16 23
5176.850 1248.863
4.145 .009
F (7, 16) = 4.145, P =. 009
20

Table 5
API Individual Listwise Scores for Learning Disabled
ANOVA SMEAN (Listwise Scores) Sum of
Squares df Mean Square F Sig.
Between Groups Within Groups Total
49676.417 6543.333 56219.750
7 8 15
7096.631 817.917
8.676 .003
F (7, 8) = 8.676, P =.003
Table 6
Multiple Comparisons (API Individual Scores for Learning Disabled Scores) Tukey HSD Schools (I)
Schools (J)
Mean Difference (I-J)
Std. Error Sig. 95% Confidence Interval Lower Bound
Upper Bound
SOAR ASA Casa Ramona Hardy Brown New Vision Options for Youth Public Safety SBCUSD
94.75000 119.20833* 54.54167 43.66667 106.75000* 61.41667 114.00000*
28.85438 28.85438 28.85438 28.85438 28.85438 28.85438 28.85438
.070
.014
.575
.790
.032
.438
.020
-5.1482 19.3101 -45.3565 -56.2315 6.8518 -38.4815 14.1018
194.6482 219.1065 154.4399 143.5649 206.6482 161.3149 213.8982
* The mean difference is significant at the 0.05 level.
Overall Combined API Scores for Learning Disabled (LD)
The one-way between-subjects analysis of variance produced no significant differences in
the overall combined API scores for LD between individual charter schools and SBCUSD F (1,
22) = 2.341, P =.140, indicating that there was no difference among of the means between LD
for charter schools and SBCUSD. In addition, because eight of twenty-four scores were missing,
21
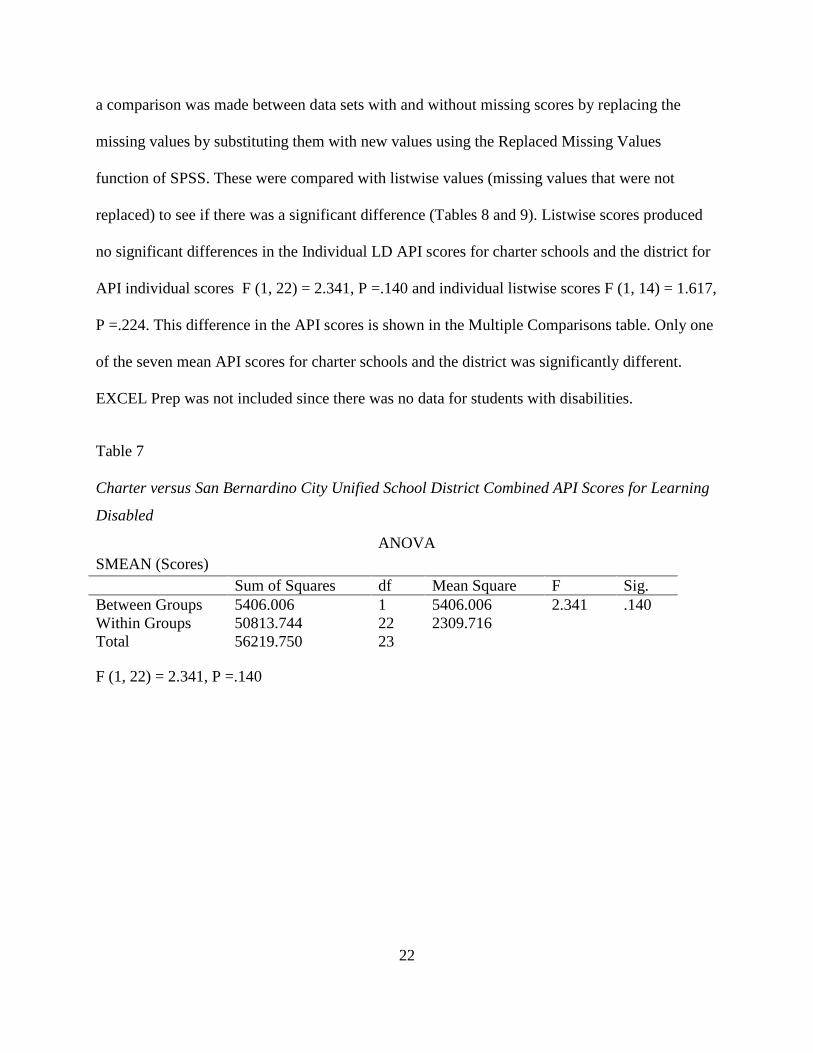
a comparison was made between data sets with and without missing scores by replacing the
missing values by substituting them with new values using the Replaced Missing Values
function of SPSS. These were compared with listwise values (missing values that were not
replaced) to see if there was a significant difference (Tables 8 and 9). Listwise scores produced
no significant differences in the Individual LD API scores for charter schools and the district for
API individual scores F (1, 22) = 2.341, P =.140 and individual listwise scores F (1, 14) = 1.617,
P =.224. This difference in the API scores is shown in the Multiple Comparisons table. Only one
of the seven mean API scores for charter schools and the district was significantly different.
EXCEL Prep was not included since there was no data for students with disabilities.
Table 7
Charter versus San Bernardino City Unified School District Combined API Scores for Learning
Disabled
ANOVA SMEAN (Scores) Sum of Squares df Mean Square F Sig. Between Groups Within Groups Total
5406.006 50813.744 56219.750
1 22 23
5406.006 2309.716
2.341 .140
F (1, 22) = 2.341, P =.140
22

Table 8
Charter versus San Bernardino City Unified School District Combined API Listwise Scores for Learning Disabled
ANOVA SMEAN (Listwise Scores) Sum of Squares df Mean Square F Sig. Between Groups Within Groups Total
5821.853 50397.897 56219.750
1 14 15
5821.853 3599.850
1.617 .224
F (1, 14) = 1.617, P =.224
Table 9
Multiple Comparisons (API Scores for Learning Disabled Scores)
Tukey HSD Schools (I)
Schools (J)
Mean Difference (I-J)
Std. Error Sig. 95% Confidence Interval Lower Bound
Upper Bound
SBCUSD ASA Casa Ramona Hardy Brown New Vision Options for Youth Public Safety SOAR
-19.25000 5.20833 -59.45833 -70.33333 -7.25000 -52.58333 -114.00000*
28.85438 28.85438 28.85438 28.85438 28.85438 28.85438 28.85438
.997 1.00 .476 .288 1.00 .615 .020
-119.1482 -94.6899 -159.3565 -170.2315 -107.1482 -152.4815 -213.8982
80.6482 105.1065 40.4399 29.5649 92.6482 47.3149 -14.1018
* The mean difference is significant at the 0.05 level.
Discussion
The study showed that individual APIs scores for SBCUSD charter schools were
significantly different from one another and the district. The same was true for students with
learning disabilities. In contrast, the combined overall API mean scores for charter schools and
23
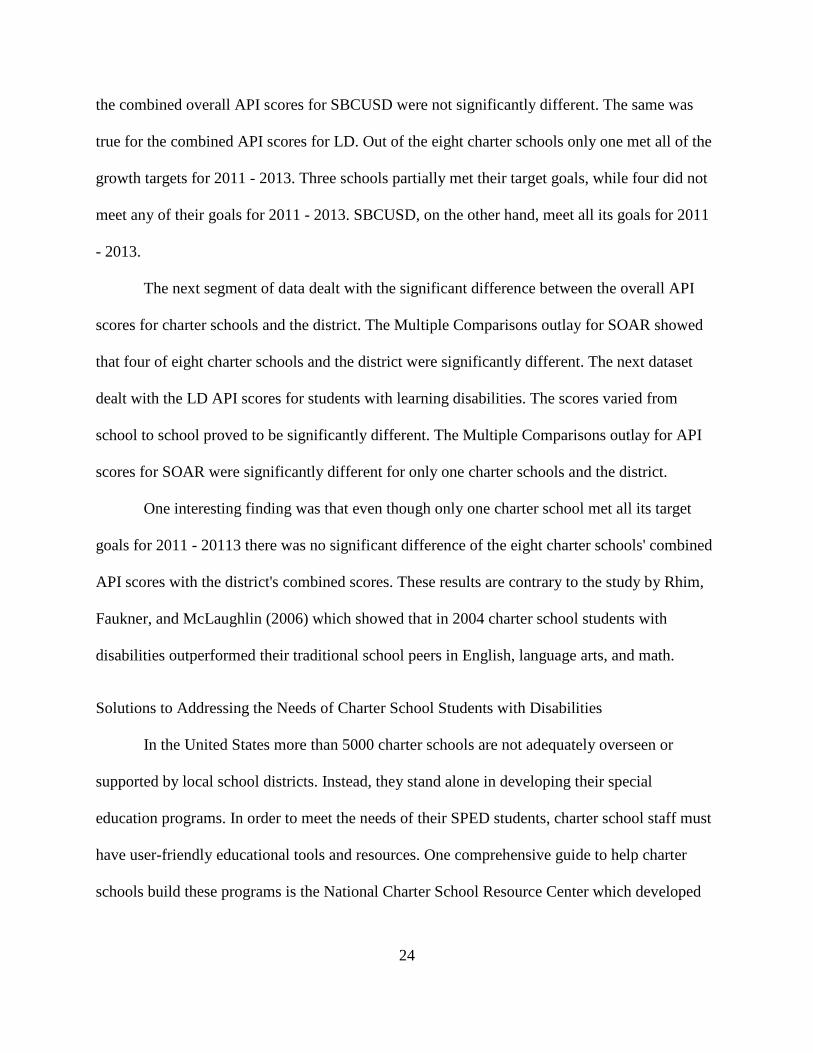
the combined overall API scores for SBCUSD were not significantly different. The same was
true for the combined API scores for LD. Out of the eight charter schools only one met all of the
growth targets for 2011 - 2013. Three schools partially met their target goals, while four did not
meet any of their goals for 2011 - 2013. SBCUSD, on the other hand, meet all its goals for 2011
- 2013.
The next segment of data dealt with the significant difference between the overall API
scores for charter schools and the district. The Multiple Comparisons outlay for SOAR showed
that four of eight charter schools and the district were significantly different. The next dataset
dealt with the LD API scores for students with learning disabilities. The scores varied from
school to school proved to be significantly different. The Multiple Comparisons outlay for API
scores for SOAR were significantly different for only one charter schools and the district.
One interesting finding was that even though only one charter school met all its target
goals for 2011 - 20113 there was no significant difference of the eight charter schools' combined
API scores with the district's combined scores. These results are contrary to the study by Rhim,
Faukner, and McLaughlin (2006) which showed that in 2004 charter school students with
disabilities outperformed their traditional school peers in English, language arts, and math.
Solutions to Addressing the Needs of Charter School Students with Disabilities
In the United States more than 5000 charter schools are not adequately overseen or
supported by local school districts. Instead, they stand alone in developing their special
education programs. In order to meet the needs of their SPED students, charter school staff must
have user-friendly educational tools and resources. One comprehensive guide to help charter
schools build these programs is the National Charter School Resource Center which developed
24

the manual, "Special Education Start-Up and Implementation Tools for Charter School Leaders
and Special Education Managers." This manual lists various tools that charter schools can utilize
that are available on the U.S. Department of Education website (National Charter School
Resource Center, 2012).
After two decades, charter schools have introduced innovation and educational
opportunities. Nevertheless, they have not used their autonomy in regards to students with
special needs. Since many charter schools are small and have limited budgets they need to form
partnerships with various community organizations, traditional public schools, and each other to
extend their role with respect to special education. Because of this growing pressure, a group of
charter schools in California contracted the nonprofit Seneca Family of Agencies to serve as a
provider for special education services, These schools use their federal and state special
education funds to finance this endeavor. In 2012, Massachusetts passed legislation permitting
charter schools to form collaboratives (Rhim & O’Neill, 2013).
Finally, one other support comes from charter school authorizers: local school boards or
districts, state boards of education, universities or colleges, and independent special charter
school boards (Finnigan, Adelman, Anderson, Cotton, Donnelly, & Price, 2004). Authorizers
monitor schools in the following areas: 1) compliance with federal or state regulations; 2) student
achievement results by means of statewide assessments; 3) enrollment numbers; 4) financial
record keeping; and 5) special education services. Authorizers monitor charter schools either
annually or more than once a year in the areas of financial record-keeping, enrollment numbers,
and special education services (Finnigan, Adelman, Anderson, Cotton, Donnelly, & Price, 2004).
While charter school operators develop proposals that outline the goals and objectives for their
school, it is the authorizers who hold the school responsible for their charter (Rhim, Lange, &
25
Ahearn, 2006). One way of accomplishing this is to provide a rubric that outlines the duties that
are placed upon charter schools. The first component of this is to allow authorizers to have the
responsibility to determine whether an applicant is qualified to operate a public charter school.
The second component outlines the means to track charter school performance by regularly
monitoring their activities. The third component addresses renewing a charter school’s contract
with the school district. In order to renew a charter school’s application an authorizer has to
examine the quality of its special education program. If the school does not meet the required
expectations, closure may be a necessary action (Rhim & O’Neill, 2012).
Conclusion
The results of this study have shown that only one charter school of the eight examined
had met all of its target goals. The four that did not meet their goals, actually showed a decrease
in student achievement. While overall scores varied, they were not significantly different from
the district's scores. Still, four of eight charter schools were not meeting their target goals, but in
fact their students learning outcomes decreased, which is unacceptable by the standards set by
NCLB. Charter schools are to act as a place where new and innovative teaching strategies are to
be developed and shared. Unfortunately, half of the schools examined did not accomplish this. It
would be appropriate for the district to take responsibility and investigate why and take
corrective measures. It is beyond the scope of this study to examine the reasons for such
deficient performance. Nevertheless, these performance levels must be addressed and corrected
if learning is to take place.
Some of the solutions offered have proven successful meeting the needs of students with
disabilities. In 1930, Stanley Davies wrote Social Control of the Mentally Deficit. Davies
26

predicted that if measures were not taken to ensure a proper education for the mentally disabled,
society would pay "for this either by supporting these persons for the rest of their lives in
institutions, or more likely in a larger bill for crime, latency, pauperism, and social degradation"
(Osgood, 2005, p. 36). Even though Davies' predictions made sense, no efforts were made
during the 1930s. It behooves us not to give up this undertaking.
Limitations
The study was not able to answer the question, why for three years (2011 - 2013) did half
of the SBCUSD charter schools examined not meet their growth target goals, but in fact
regressed? This is critical because America's future rests on the shoulders of its educated youth.
Future Study
A qualitative study can be conducted that will focus on why SBCUSD charter schools are not
addressing the needs of their students with disabilities.
27
References
American Federation of Teachers. (2002). Do charter schools measure up? The charter school
experiment after 10 years (Item No. 39-0241, pp. 1-57). Washington, DC: American
Federation of Teachers Years.
Brault, M. (2008). Americans with disabilities: 2005. In Current Population Report.
Washington, DC/USA: U.S. Census Bureau.
California Charter School Association. (2013, February 21). Charter schools: Myth vs. reality.
Retrieved February 21, 2013, from California Charter School Association (CCSA) Web
site: CCSAhttp://www.calcharters.org/understanding/faqs/myths.html
California Charter School Association. (2013, February 21). Special education in California.
Retrieved February 21, 2013, from California Charter School Association (CCSA Web
site: http://www.calcharters.org/advocacy/special-education-adv/
California Department of Education (CDE). (2007). Technical assistance for California charter
schools on implementing special education requirements (Grant #U282U030007, pp. 1-
79). Washington, DC: U.S. Department of Education, Office of Elementary and
Secondary Education Charter Schools Program.
California School Boards Association. (2009). Charter schools: A manual for governance teams
[Brochure]. West Sacramento, CA: Author.
Consoletti, A. (2011). The state of charter schools: What We know—and what we do not—
about performance and accountability. Washington, DC: The Center for Education
Reform.
42
Finnigan, K. S. (2007). Charter school autonomy: The mismatch between theory and practice.
Educational Policy, 21(3), 503-527.
Finnigan, K., Adelman, N., Anderson, L., Cotton, L., Donnelly, M. B., & Price, T. (2004).
Evaluation of the public charter schools program: Final report (Doc #2004–08, pp. 1-
147). Washington, DC: U.S. Department of Education.
Fourqurean, J., Meisgeier, C., Swank, P., & Williams, R. (1991). Correlates of postsecondary
employment outcomes for young adults with learning disabilities. Journal of Learning
Disabilities. 24(7), 400-405.
Furstenburg, F., Jr., Kennedy, S., McLoyd, V., Rumbaut, R., & Settersten, R. (2004). Growing
up is harder to do. Contents, 3(3), 33-41.
Goldberg, M., & Harvey, J. (1983). A nation at risk: The report of the national commission on
excellence in education. Phi Delta Kappan, 65(1), 14–18.
Green, M. (2011). Why does California have so many charter schools? Retrieved February 21,
2013, from blogs.kqed.org Web site: http://blogs.kqed.org/lowdown/2011/11/23/whats-
the-deal-with-californias-charter-schools/
Greene, J., Forster, G., & Winters, M. (2003). Apples to apples: An evaluation of charter
(Education Working Paper 1). New York: Manhattan Institute for Policy Research.
Harvey, M. (2001). The efficacy of vocational education for students with disabilities concerning
post-school employment outcomes: A review of the literature. Journal of Industrial
Teacher Education, 38(3), 1-20.
Hendey, N., & Pascall, G. (2001). Disability and transition to adulthood: Achieving independent
living. Brighton, England: pavilion Publishing.
43
Hill, E. (2004). Assessing California’s charter schools. Retrieved February 7, 2013, from
Legislative Analyst’s Office Web site: http://www.lao.ca.gov/2004/charter_schools/
012004_charter_schools.htm
Johnson, D., Stodden, R., Emanuel, E., Luecking, R., & Mack, M. (2002). Current challenges
faces secondary education and transition services: What research tells us. Exceptional
Children, 68(4), 519-531.
Kolderie, T. (1990). Beyond choice to new public schools: Withdrawing the exclusive franchise
in public education. Retrieved February 21, 2013, from Progressive Policy Institute Web
site: www.ppionline.org/ndol/print.cfm?contentid=1692
Lhamon, C. E. (May 14, 2014). U.S. Department of Education dear colleague letter: Charter
schools. Retrieved November 26, 2014, from U.S. Department of Education Office for
Civil Rights Web site: http://www2.ed.gov/about/offices/list/ocr/letters/colleague-
201405-charter.pdf?utm_source=JFSF%20Newsletter&utm_campaign=ead71e6b0e-
Newsletter_July_2013&utm_medium=email&utm_term=0_2ce9971b29-ead71e6b0e-
328812633
Loveless, T. (2002). The 2002 Brown Center report on American education: How well are.
Washington, DC: The Brookings Institution.
Merriam-Webster. (2013, March 21). Definition of charter. Retrieved March 21, 2013, from
Merriam-Webster Web site: http://www.merriam-webster.com/dictionary/charter
National Charter School Resource Center. (2012). Special education start-up and implementation
tools for charter school leaders and special education managers. Washington, DC/USA:
American Institutes for Research.
44
Nelson, F. H., Rosenberg, B., & Van Meter, N. (2004). Charter school achievement. Retrieved
February 21, 2013, from National Assessment of Educational Progress EPSL Web site:
http://www.asu.edu/educ/epsl/EPRU/articles/EPRU-0408-63-OWI.pdf
Osgood, R. (2005). The history of inclusion in the United States. Washington, DC/USA:
Gallaudet University Press.
Prothero, A. (2014). Special charters target students with disabilities: Special education charters
renew inclusion debate. Education Week, 34(04), 1-4.
RAND Corporation. (2009). Improving education (Policy Brief). Santa Monica, CA/USA:
RAND Corporation.
Rhim, L. M., & O’Neill, P. (2012). Charter school authorizer rubrics for assessing special
education capacity: Schools operating within a local education agency (LEA).
Washington, DC/USA: National Charter School Resource Center.
Rhim, L. M., & O’Neill, P. (2013). Improving access and creating exceptional opportunities for
students with disabilities in public charter schools. Washington, DC/USA: The National
Alliance for Public Charter Schools.
Rhim, L., Faukner, J., & McLaughlin, M. (2006). Research Report #5: Access and accountability
for students with disabilities in California charter schools. College Park,: Institute for the
Study of Exceptional Children and Youth University of Maryland.
Rhim, L., Lange, C., & Ahearn, E. (2005, April 11-15). Congestion at the intersection of federal
and state policy implementation: An analysis of special education in the charter school
sector. Paper presented at the American Education Research Association, Montreal,
Canada.
45
Rhim, L., Lange, C., & Ahearn, E. (2006). Research report #4: Charter schools’ special
education infrastructures (No. 4, pp. 1-50). College Park: Institute for the Study of
Exceptional Children and Youth University of Maryland.
Rojewski, J. (1999). Occupational and educational aspirations and attainment of young adults
with and without ID 2 years after high school completion. Journal of Learning
Disabilities, 32(6), 533-552.
San Bernardino City Unified School District. (2013). Fact sheet [Brochure]. San Bernardino,
CA/USA: Author.
United States Government Accountability Office. (2012). Charter schools: Additional federal
attention needed to help protect access for students with disabilities. In Report to
Congressional Requesters (GAO-12-543 Serving Special Populations, pp. 1-41).
Washington, DC/USA: United States Government Accountability Office.
Winters, M. A. (2013). Why the gap? Special education and New York City charter schools.
Seattle, WA/USA: Center on Reinventing Public Education, University of Washington.
Winters. (2014). Understanding the charter school special education gap: Evidence from
Denver, Colorado. Seattle, WA/USA: Center on Reinventing Public Education,
University of Washington.
46