edo analytical report - edo home - european drought observatory - jrc...
TRANSCRIPT

EDO Analytical Report
1
Severe drought in Italy – July 2017 JRC Drought Team and ERCC Analytical Team – 27/07/2017
Table of Contents
Executive Summary ........................................................................................................... 1
Geographical Context ........................................................................................................ 1
EDO Analysis: Combined Drought Indicator (CDI) .............................................................. 2
EDO Analysis: Precipitation ............................................................................................... 3
EDO Analysis: Standardized Precipitation Index (SPI) ......................................................... 5
EDO Analysis: fAPAR .......................................................................................................... 6
EDO Analysis: Soil Moisture ............................................................................................... 7
From the Media ................................................................................................................ 9
Information Sources: ......................................................................................................... 9
Executive Summary
� A severe drought is currently affecting up to two-thirds of Italy, causing major
agricultural losses, water restrictions in urban areas and higher fire hazard and intensity
in forests.
� The current drought is due to the consistent lack of rain since December 2016, especially
during spring 2017, and is exacerbated by the heatwaves in June and July.
� According to long-term statistics, there is little chance of recovery before autumn, which
is usually the wettest period of the year.
Geographical Context
The severe drought that is currently affecting Italy follows one of the country’s driest springs
in 60 years, with some regions reportedly receiving 80% less total rainfall than normal. Up to
two-thirds of Italy is currently affected by the drought, including all of the central regions. Of
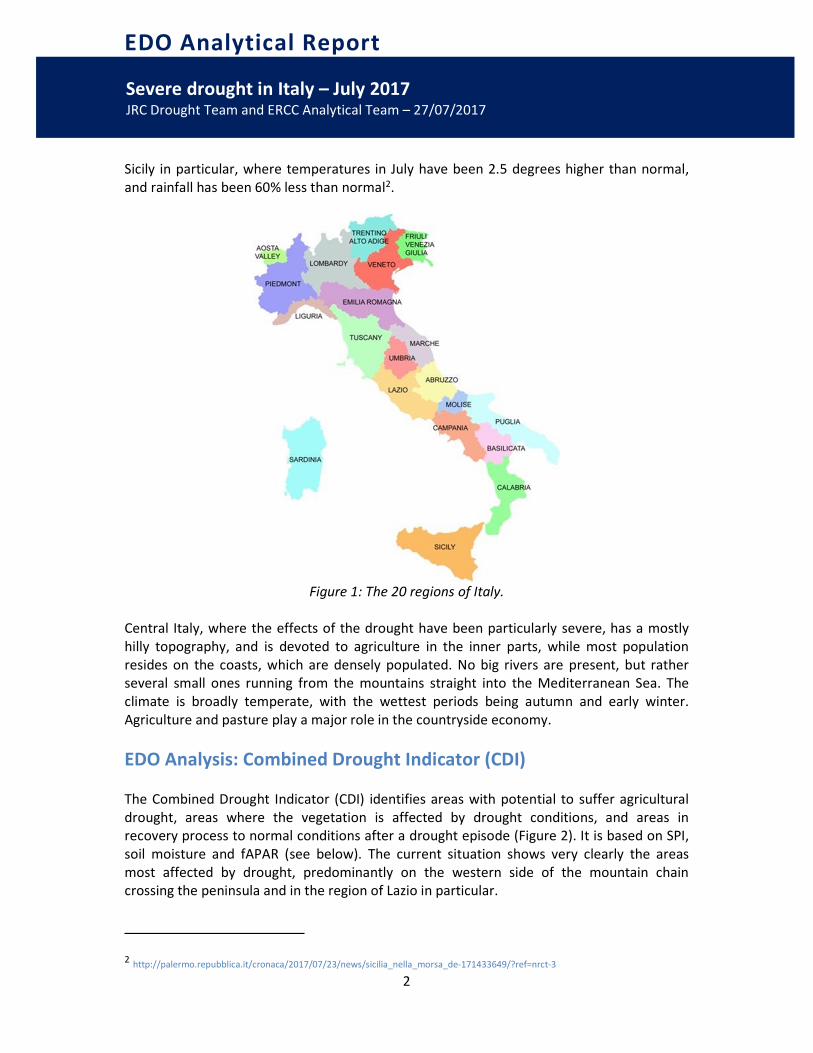
Italy’s 20 regions (see Figure 1) the following ten are reported by Coldiretti, Italy’s main
farming organisation, as having already declared or preparing to declare, a state of natural
disaster because of the drought: Toscana, Marche, Umbria, Lazio (in Central Italy);
Lombardia (in the North-West); Trentino Alto Adige and Veneto (in the North-East); La
Campania and Puglia (in the South); and the island of Sardegna. According to analysis by
Coldiretti, the 2017 drought in Italy has so far caused an estimated 2 billion Euros of damage
to Italian agriculture1. The effects of the drought in Italy have been exacerbated by
heatwaves during June and July, which have led to forest fires across southern Italy, and
1 http://www.repubblica.it/cronaca/2017/07/23/news/siccita_10_regioni_pronte_a_chiedere_stato_di_calamita_-171448375/
EDO Analytical Report
2
Severe drought in Italy – July 2017 JRC Drought Team and ERCC Analytical Team – 27/07/2017
Sicily in particular, where temperatures in July have been 2.5 degrees higher than normal,
and rainfall has been 60% less than normal2.
Figure 1: The 20 regions of Italy.
Central Italy, where the effects of the drought have been particularly severe, has a mostly
hilly topography, and is devoted to agriculture in the inner parts, while most population
resides on the coasts, which are densely populated. No big rivers are present, but rather
several small ones running from the mountains straight into the Mediterranean Sea. The
climate is broadly temperate, with the wettest periods being autumn and early winter.
Agriculture and pasture play a major role in the countryside economy.
EDO Analysis: Combined Drought Indicator (CDI)
The Combined Drought Indicator (CDI) identifies areas with potential to suffer agricultural
drought, areas where the vegetation is affected by drought conditions, and areas in
recovery process to normal conditions after a drought episode (Figure 2). It is based on SPI,
soil moisture and fAPAR (see below). The current situation shows very clearly the areas
most affected by drought, predominantly on the western side of the mountain chain
crossing the peninsula and in the region of Lazio in particular.
2 http://palermo.repubblica.it/cronaca/2017/07/23/news/sicilia_nella_morsa_de-171433649/?ref=nrct-3

EDO Analytical Report
3
Severe drought in Italy – July 2017 JRC Drought Team and ERCC Analytical Team – 27/07/2017
Figure 2: Combined Drought Indicator (CDI) for 1st “dekad” (ten days) of July 2017.
EDO Analysis: Precipitation
Precipitation includes total cumulative monthly measurements of both rainfall and snow
(Figures 3 and 4). December 2016 triggered a sequence of monthly lows in Central Italy,
where five out of the last seven months recorded rainfall below the normal fluctuations for
the same period (Figure 3). During these months, the cumulated deficit reached almost
300mm for some areas (Figure 4). Considering the first six months of 2017, less than half of
the expected rain fell, with the whole spring being very dry. During August precipitation is
usually modest, so there are limited chances of recovery before September at least.

EDO Analytical Report
4
Severe drought in Italy – July 2017 JRC Drought Team and ERCC Analytical Team – 27/07/2017
Figure 3: Monthly total precipitation (blue bars) near Civita Castellana (Lazio, Italy,
coordinates: N42.29, E12.27). Dots represent the long-term monthly average (1981-2010),
vertical segments are one standard deviation, and connecting line shows the historical
precipitation pattern.
Figure 4: Cumulative precipitation and precipitation deficit over a period of 9 months near
Civita Castellana (Lazio, Italy, coordinates: N42.29, E12.27). The bar colors indicate the
cumulative deficit (red gradient) compared to the cumulated monthly long-term average
(blue line), for the same time span and location. The overlapping boxes are the monthly
totals stacked.

EDO Analytical Report
5
Severe drought in Italy – July 2017 JRC Drought Team and ERCC Analytical Team – 27/07/2017
EDO Analysis: Standardized Precipitation Index (SPI)
The Standardized Precipitation Index (SPI) is an indicator that is used to monitor the
occurrence of meteorological drought. The lower the SPI, the more intense is the drought
(Figure 5). Precipitation in Central Italy has been poor since December 2016 and the SPI for
3- and 6-month rainfall accumulation periods (SPI-3 and SPI-6) are the most appropriate to
describe the current drought conditions. Although SPI does not reach extremely low values
at the selected location, indicating a moderate drought, Figure 6 shows how widespread the
drought is, with areas at much lower SPI.
Figure 5: SPI for a cumulative period of 3 and 6 months (SPI-3 and SPI-6) near Civita
Castellana (Lazio, Italy, coordinates: N42.29, E12.27).

EDO Analytical Report
6
Severe drought in Italy – July 2017 JRC Drought Team and ERCC Analytical Team – 27/07/2017
Figure 6: Map of SPI-3 for the period April, May, and June 2017 across Italy.
EDO Analysis: fAPAR
The fraction of Absorbed Photosynthetically Active Radiation (fAPAR) represents the
fraction of the solar energy that is absorbed by leaves. Anomalies of fAPAR, and specifically
negative deviations from the long-term mean over the corresponding time-period, are a
good indicator of the drought impacts on vegetation productivity (Figure 7). Figure 7 shows
that wide areas of Lazio region are affected, extending to locally lows southwards as well.
Such negative fAPAR values suggest strong negative impacts on vegetation development,
including crops.

EDO Analytical Report
7
Severe drought in Italy – July 2017 JRC Drought Team and ERCC Analytical Team – 27/07/2017
Figure 7: fAPAR anomaly across Italy for 1st “dekad” (10 days) of July 2017.
EDO Analysis: Soil Moisture
Soil moisture anomaly refers to soil water availability compared to its long-term average.
This is a very direct measurement of the water availability for plants and shows a picture
even worse than the previous indicators (Figure 8). In fact, dry soil conditions affect
northern Italian plains too, where indeed issues of water provisioning for agriculture have
emerged since June. The time series centered at a location in Lazio region (Figure 9) reflects
the dynamics of soil moisture since early 2016, with wide fluctuations but a consistent trend
towards high negative anomalies. Given that soil moisture incorporates the effect of
temperature, the heat waves recorded in mid-June and during the second week of July have
contributed strongly to enhance the current anomaly of soil moisture levels.

EDO Analytical Report
8
Severe drought in Italy – July 2017 JRC Drought Team and ERCC Analytical Team – 27/07/2017
Figure 8: Soil moisture anomaly across Italy for 2nd “dekad” (10 days) of July 2017.
Figure 9: Soil moisture anomaly near Civita Castellana (Lazio, Italy, coordinates: N42.29,
E12.27).

EDO Analytical Report
9
Severe drought in Italy – July 2017 JRC Drought Team and ERCC Analytical Team – 27/07/2017
From the Media
The Central Italian drought has been reported widely in the media, in relation to the impacts
on public water supply, agriculture and forest fires. Some examples:
� One of worst droughts in decades devastates South Europe crops (Reuters, 14/07/2017)
� Heat and drought feed wildfires in Italy, beaches near Rome threatened (Reuters,
18/07/2017)
� Emergenza siccità e roghi, turni per l'acqua a Roma. Coldiretti: due terzi d'Italia a secco
(RAI, 23/07/2017)
� Siccità, 10 Regioni pronte a chiedere lo stato di calamità e le misure di sostegno per le
aziende (La Repubblica, 23/07/2017)
� Rome facing water rationing as Italy suffers driest spring for 60 years (The Guardian,
24/07/2017)
Information Sources:
Joint Research Centre, European Commission: European Drought Observatory (EDO) -
http://edo.jrc.ec.europa.eu/
Distribution: ERCC and related partners, EDO Web Site
Authors: Masante D., Vogt J., McCormick N., Cammalleri C., Magni D., de Jager A.
Disclaimer: The present JRC products are still under development. Therefore, they are subject to
changes. The views expressed here may not in any circumstances be regarded as stating an official
position of the European Commission (EC). Geographic borders are purely a graphical representation
and are only intended to be indicative. These boundaries do not necessarily reflect the official EC
position.
Legal Notice: Neither the European Commission nor any person acting on behalf of the Commission
is responsible for the use, which might be made of this publication.