edu210-01 brown khuntia-notimings.pptpredictive value of mgmt mgmt rt +tmz rt +tmz overall 36 54 10...
TRANSCRIPT

Adult Brain Tumors
Paul Brown, MDMD Anderson Cancer Center
Houston, TX
Deepak Khuntia, MDWestern Radiation Oncology
San Mateo‐Mountain View‐Pleasanton‐San Jose, CA
Disclosure
• Deepak Khuntia– Consultant for Procertus, Inc– Speaker and grant support from Tomotherapy– Advisory board and consultant for Radion Global
• Paul Brown– None
Learning Objectives• Discuss the incidence, prevalence, mortality, morbidity, and clinical
impact of the major malignant and benign adult primary CNS tumors• Recognize the substantial heterogeneity that exists within these
tumor types and understand the prognostic and predictive variables allowing for appropriate selection of therapeutic choices, tailored for a specific patient
• Explain the major levels of evidence for therapeutic decision‐making• Appreciate the role of various therapies, especially surgery
radiotherapy and chemotherapy in managing these tumors

GlioblastomaGrade 3 Glioma
– Anaplastic Astrocytoma– Oligodendroglioma
Low-grade GliomaPilocytic AstrocytomaEpendymoma
–Intracranial–Spine
Spinal Cord Astrocytoma
Gliomas: Median Survival –Importance of Histologic GradingTumor Type MS (mos)
Pilocytic Astrocytoma --
Low-grade oligodendroglioma ~120
Low-grade astrocytoma ~60
Anaplastic oligodendroglioma ~60
Anaplastic astrocytoma ~36
Glioblastoma <12
GlioblastomaGrade 3 Glioma
– Anaplastic Astrocytoma– Oligodendroglioma
Low-grade GliomaPilocytic AstrocytomaEpendymoma
–Intracranial–Spine
Spinal Cord Astrocytoma

Glioblastoma• Rapid progression
• Enhancing tumor
• Surrounding edema
– Contains tumor
T1 post-contrast T2
•Median Survival
9-12 months
External Beam Radiotherapy for GBM
• Current standard is 60 Gy/2 Gy/fx on GTV + 2 - 3 cm margin
• 3D: conformal, multiple fields
• Pooling of 6 randomized trials (RT vs no RT) improved survival
• Mean survival time 3 - 6 months without RT; 9 -12 months with RT*
*Walker MD, et al. N Engl J Med. 1980;303:1323-1329.
Radiotherapy: Randomized TrialsAuthor N Schema Results
Andersen 1978 108 RT vs best supportive care
Post-op RT signif improves OS
Walker 1978 303 BCNU vs RT vs BCNU +RT, vs best supportive
care
RT significantly longer MS than BCNU or best supportive care
Walker 1980 467 Semustine vs RT vs semustine + RT vs
BCNU +RT
RT significantly longer survival than semustine alone
Kristiansen 1981 118 RT vs RT + bleomycin vs supportive care
MS with RT alone 10.2 mo compared to 5.2 mo supportive care
Andersen AP. Acta Radiol Oncol Radiat Phys Biol. 1978;17:475-484. Walker MD, J Neurosurg. 1978;49:333-343.
Walker MD, NEJM 1980;303:1323-1329. Kristiansen K, Cancer. 1981;47:649-652.

K. KRISTIANSEN,Cancer 47:649-652, 1981.
What about elderly patients?
Do they benefit from radiotherapy?
Elderly GBM TrialRadiotherapy vs. Supportive Care
Keime-Guibert (France) et al. NEJM 356:1527-35, 2007.*Trial discontinued early due to planned interim analysis
GBM>70 yo KPS >70n=85*
RANDOMIZE
Supportive Care
50.4 Gy

Elderly GBM TrialRadiotherapy vs. Supportive Care
Control RT P-value
Median OS 3.9 mo 6.7 mo 0.002
Keime-Guibert (France) et al. NEJM 356:1527-35, 2007.
Is it worth 5 ½ weeks of RT?
Can we do the RT quicker?
“Elderly” GBM TrialAbbreviated vs. Standard Course RT
Roa (Canada) et al. JCO 22:1583-88, 2004.*KPS = 70
GBM>60 yo n=100*
RANDOMIZE
60 Gy/30
40 Gy/15

“Elderly” GBM TrialAbbreviated vs. Standard Course RT
60 Gy 40 Gy French
Median OS 5.1 mo 5.6 mo 6.7 mo
Roa (Canada) et al. JCO 22:1583-88, 2004.
How about chemotherapy instead?
Chemo has to be better!
“Elderly” HGG Trial NOA-08Temozolomide vs. Standard Course RT
Wick (German) et al. JCO 28:180S, 2010.*~90% were GBM. Median age 71
HGG>65 yo n=373*
RANDOMIZE
54-60 Gy
TMZ week on/week off

“Elderly” HGG Trial NOA-08Temozolomide vs. Standard Course RT
TMZ increased risk death (HR 1.24: 0.94-1.63)TMZ more toxicity than RT
RT TMZ
Median OS 9.6 mo 8 mo
Wick (German) et al. JCO 28:180S, 2010.
“Elderly” GBM TrialTMZ vs. Standard Course RT vs. Hypofrac RT
Malmstrom et al. JCO 28:180S, 2010.*Median age 70
HGG>60 yo n=342*
RANDOMIZE
60 Gy/30
TMZ d1-5q28d
34 Gy/10
“Elderly” GBM TrialTMZ vs. Standard Course RT vs. Hypofrac RT
60 Gy 34 Gy TMZ
Median OS 6 mo 7.5 mo 8 mo*
EORTC 26062-22061 RT+TMZ vs. TMZ and NCIC CTG CE.6 RT vs. RT +TMZ should answer next questions (planned accrual 560 for both)
Malmstrom et al. JCO 28:180S, 2010.*p=0.14

Attempts at Improving the Spectrum of Radiotherapy
Technical• Brachytherapy• IMRT• Intraoperative RT• Radiosurgery• Proton-beam therapy
Biological• Hypofractionation• Hyperfractionation• Accelerated RT• Radiolabeled
antibodies• Radiosensitizers
Radiotherapy for GBM Dose
• RTOG 7401: No benefit 70 vs. 60 Gy (600+ patients)
• RTOG 9006: No benefit 72 (1.2 BID) vs. 60 Gy (700+ patients)
• U Mich: No benefit 90 Gy (90% failed in-field)
• Multiple negative Phase III (e.g. brachy)
• MRC: OS 9 mo 45 Gy vs. 12 mo 60 Gy
60 Gy is standard. No proof for higher doses that increase toxicity
Radiosurgery• Focal, single-fraction RT
delivery method– Linear accelerator– Gamma knife – Charged particles
• Does not use the advantages of fractionation
• Delivers high dose RT to small, discrete, well-defined target, with rapid dose fall-off

RTOG 9305: Newly Diagnosed GBM Radiosurgery Phase III Trial
• 203 patients with GBM• 60 Gy + BCNU +/- RS boost (15 - 24 Gy)• Median follow up: 61 months• MS: 13.5 vs 13.6 months• General QOL & cognitive function comparable
Souhami L. et al. Int J Radiat Oncol Biol Phys. 2004;60:853-860.
Radiosurgery has not been proven to prolong survival of GBM patients.
How can we improve Results?
How about surgery?
Surgical ManagementNeed Tissue confirmationControversy benefit greater extent of resection high-grade gliomas– Conflicting retrospective studies– Small prospective Finnish study– Significant concerns regarding selection bias
The role of maximal resection controversial
Vuorinen V et al. Acta Neurochir 145:5-10, 2003
Survival benefit, trend benefit time to deterioration, p=0.057.

Impact of Resection on Survival in Malignant Glioma
Stummer W (Germany) et al. Lancet Oncology 7:392-401, 2006.5-ALA=aminolevulinic acid*97% GBM
HGG* n=322
RANDOMIZE
Resection w/ 5-ALA
Resection w/ White Light
Impact of Resection on Survival in Malignant Glioma
Stummer W (Germany) et al. Lancet Oncology 7:392-401, 2006.
5-ALA Standard P-value
GTR 65% 36% <0.001
6 mo PFS 41% 21% <0.001
Median OS 15.2 mos 13.5 mos 0.1
How can we improve Results?
How about chemotherapy?

1. Gilbert M, et al. J Clin Oncol. 1998;16:3851-3857.2. Newlands ES, et al. 33rd Ann. Mtg. of ASCO. May 17-21, 1997. Abstract 1403.3. van Rijn J, et al. Int J Radiat Oncol Biol Phys. 2000;47:779-784.4. Stupp R, et al. J Clin Oncol. 2002;20:1375-1382.5. Combs, et al. ASCO 2004.
TMZ Plus XRT: Rationale• Newly diagnosed glioma, TMZ alone high
response rates 1• In-vitro glioma cells, RT + TMZ is largely
additive or synergistic 2,3
• TMZ can be added to RT with manageable toxicity 4
• RT + continuous TMZ showed benefit 4,5
Focal RT daily — 30 x 200 cGyTotal dose 60 Gy
Temozolomide 75 mg/m2 po qd for 6 weeks,then 150-200 mg/m2 po qd day 1-5 q 28 days for 6 cycles
Concomitant TMZ/RT*
Adjuvant TMZ
Weeks6 10 14 18 22 26 30
RT Alone
R 0
*PCP prophylaxis was required for patients receiving TMZ during the concomitant phase.
Phase III Study: New GBM Radiation +/- Temozolomide
EORTC/NCIC Phase III GBM Trial: Overall Survival
months0 6 12 18 24 30 36 42
0102030405060708090
100
TMZ/RT
RT
Per
cent
age
Note: Progression varied from center to center
P<0.0001
Stupp R, et al. N Engl J Med. 2005;352:987-996.
N=573

Predictive Value of MGMT
MGMT RT +TMZ RT +TMZ
Overall 36 54 10 26
Unmethylated 35 40 2 14
Methylated 48 69 23 46
GBM patients with methylated MGMT from EORTC trial 2-year survival 14% vs 46%.
% 6-mo PFS % 2-yr survival
Hegi ME, et al. N Engl J Med. 2005;352:997-1003.
EORTC/NCIC Phase III GBM Trial Updated Results: OS by MGMT Status
Stupp ME, et al. Lancet Oncology. 2009;10:459-66.5 yr OS for entire RT/TMZ arm -> 10%
mMGMT MGMT
TMZ/RT vs RT in Newly Diagnosed GBM: Greek Trial
• Randomized Phase II trial (N = 110) RT vs. RT/TMZ • Temozolomide same as Stupp Trial
Median TTP 10.8 vs 5.2 mos (P = .0001)1-yr survival 56 vs 16%Median OS 13.4 vs 7.7 mos (P < .0001)
Athanassiou, et al. JCO 23(10): 2372-2377, 2005

Athanassiou, H. et al. J Clin Oncol; 23:2372-2377 2005
How Improve on These Results?
Recently Completed Study

Randomized Phase III GBMRTOG 0525
Gilbert, et al. abstract #2006, oral presentation ASCO 2011.
NOTE: All had resection (NO biopsy only)
All eligible 1120
All randomized 833
Randomized Phase III GBMRTOG 0525
Total patients enrolled 1173• RTOG 918• EORTC 188• NCCTG 67
Gilbert, et al. abstract #2006, oral presentation ASCO 2011
Randomized Phase III GBMRTOG 0525 - Radiation Technique
RTOGCone down GTV1 T2 and T1+Gad + 2 cm=PTV* to 46 Gy
GTV2 T1+Gad + 2,5 cm = PTV to 14 Gy
EORTCNo cone down GTV T1+Gad (without edema) on pre or postopMRI** CTV GTV plus a margin 2-3 cm (T2 ABNL include within margin)
*No defined CTV. ** Whichever larger

Randomized Phase III GBMRTOG 0525-TOXICITY
• Grade 3- 5 Adverse events more common dose-dense, Arm 2 (p < 0.0001)
• Mostly lymphopenia (107 vs. 51) and fatigue (33 vs 12)
Gilbert, et al. abstract #2006, oral presentation ASCO 2011
Randomized Phase III GBMRTOG 0525-Results
Overall survival Arm 1 vs Arm 2 Prog free survival Arm 1 vs Arm 2
Arm 1 = standard adjuvant. Arm 2 = dose dense
Courtesy of Dr. Gilbert
Randomized Phase III GBMResults - MGMT Unmethylated
Overall survival Arm 1 vs Arm 2 Prog free survival Arm 1 vs Arm 2
Arm 1 = standard adjuvant. Arm 2 = dose dense
Courtesy of Dr. Gilbert

Randomized Phase III GBMResults - MGMT Methylated
Overall survival Arm 1 vs Arm 2 Prog free survival Arm 1 vs Arm 2
Arm 1 = standard adjuvant. Arm 2 = dose dense
Courtesy of Dr. Gilbert
Randomized Phase III GBMResults – By MGMT Status
Courtesy of Dr. Gilbert
Randomized Phase III GBMCOX Proportional Hazards Modeling
Gilbert, et al. abstract #2006, oral presentation ASCO 2011. Arm 1 = standard adjuvant. Arm 2 = dose dense
Variable Overall Survival Progression free survival
P-value HR (95% CI) P-value HR (95% CI)
TreatmentArm 2 vs 1
0.51 1.06 (0.90-1.24) 0.12 0.89(0.77-1.03)
MethylationUnmeth vs meth
< 0.0001 1.81 (1.51-2.17) < 0.0001 1.70(1.44-2.01)
RadiationEORTC vs RTOG
NA NA NA NA
RPA (IV vs III) < 0.0001 1.63 (1.32-2.03) < 0.0001 1.57(1.28-1.91)
RPA (V vs III) < 0.0001 2.89 (2.22-3.75) < 0.0001 2.31(1.81-2.96)

Randomized Phase III GBMCOX Proportional Hazards Modeling
Gilbert, et al. abstract #2006, oral presentation ASCO 2011. Arm 1 = standard adjuvant. Arm 2 = dose dense
PatientGroup
N Overall survival
Prog free survival
All eligible 1120 16.0 mo. 7.5 mo.
All randomized 833 17.7 mo. 8.2 mo.
Arm 1Arm 2
411422
18.9 mo16.8 mo.
7.5 mo.8.8mo.
MGMT MethylatedUnmethylated
245517
23.2 mo.16.0 mo.
10.5 mo.7.8 mo.
MethylatedArm 1Arm 2
122123
23.5 mo.21.9 mo.
8.8 mo.11.7 mo.
UnmethylatedArm 1Arm 2
254263
16.6 mo.15.4 mo.
7.1 mo.8.2 mo.
Randomized Phase III GBMRTOG 0525-CONCLUSION
Dose-dense adjuvant TMZ no improvement OS or PFS
MGMT methylation status did not predict response to treatment
Gilbert, et al. abstract #2006, oral presentation ASCO 2011
Randomized Phase III GBMRTOG 0525-CONCLUSION
MGMT methylation status was prognostic for OS and PFS
Dose-dense more AEs, primarily lymphopeniaand fatigue
Gilbert, et al. abstract #2006, oral presentation ASCO 2011

Randomized Phase III GBMRTOG 0525-CONCLUSION
Feasibility large scale randomized international clinical trial
Await symptom burden, neurocognitive function and QOL results
Gilbert, et al. abstract #2006, oral presentation ASCO 2011
Background
• Recurrent High Grade Gliomas (HGG) low response rate standard chemo
• HGG high VEGF expression• Bevacizumab monoclonal Ab VEGF
Goli (Duke), et al. abstract #2003, Clinical Science Symposium ASCO 2007.
Vredenburgh JCO, 2007
Randomized Phase II Recurrent GBM Comparisons
Yung WKA, et al. Br J Cancer. 2000;83:588-593.
Goli, et al. abstract #2003, Clinical Science Symposium ASCO 2007.
Cloughesy, et al. abstract #2010, oral presentation ASCO 2008.
TMZ BV-Phase IIR BV-Duke
6 mo PFS 21% 50% 43%
Median OS 7.3 mos 8.9 mos 9.2 mos

GBM Tissue
available
30 Gy +TMZ (75
mg/m2 qd x 21 d)*
R#ANDOMIZE
30 Gy +TMZ (75
mg/m2 qd x 21 d) + Bev (10 mg/kg q
2wks)
30 Gy +TMZ (75
mg/m2 qd x 21 d) + Placebo
TMZ (200 mg/m2) d 1-5 of 28-d cycle + Placebo12 cycle max
# Stratify by: (Random 10d post start RT)Recursive partitioning analysis (RPA) class (III vs IV vs V)MGMT methylation statusMolecular profile
TMZ (200 mg/m2) d 1-5 of 28-d cycle + Bev12 cycle max
Closed 978 pts
*Analysis for MGMT methylation, molec profile
R0825: Phase III Randomized Newly Dx GBM:RT+TMZ +/- Bevacizumab
R0825: Phase III Randomized Newly Dx GBM:RT+TMZ +/- Bevacizumab
Pre-RT and TMZ 4 wks after RT/TMZ

Pre-RT and TMZ 4 wks after RT/TMZ
Progressive Disease?
Pseudo-ProgressionImaging progression shortly after RT + TMZ – Unknown if “true disease progression”– Should one continue adjuvant TMZ or declare
progression and switch to different chemo
Very Common– 1/3 to 1/2 of patients– 1/2 stabilize/improve with further TMZ
Taal W., et al. abstract #2009, oral presentation ASCO 2007.
Pre-RT and TMZ 4 wks after RT/TMZ3 mo after RT/TMZ

Pre-RT and TMZ 4 wks after RT/TMZ3 mo after RT/TMZ
NOT Progressive Disease
GBM - Conclusions
• Significant benefit RT but not for dose escalation
• Benefit for maximal safe debulking• TMZ and RT currently standard for
newly diagnosed GBMs– Well tolerated
GBM - Conclusions
• MGMT status prognostic• No benefit dose-dense TMZ • Be aware of “pseudo-progression”• Anti-angiogenesis agents intriguing
– Await results RTOG 0825

GlioblastomaGrade 3 Glioma
– Anaplastic Astrocytoma– Oligodendroglioma
Low-grade GliomaPilocytic AstrocytomaEpendymoma
–Intracranial–Spine
Spinal Cord Astrocytoma
Anaplastic AstrocytomaKey Features
• Incidence:2,000 diagnosed annually in US- Median age 5th decade
•Median Survival:2 - 3 years
•Histology:Increased astrocytic cellularityCellular atypia and mitosis, no necrosis
Anaplastic AstrocytomaKey Features
Notes:Tissue sampling a major issueProgression to glioblastoma frequentSignificant difficulties with pathological
identification- In contrast to GBM,
~30% “AA patients” misdiagnosed
GeneticsLess than 5% 1p19q co-deleted…
Stupp et al., Onc Hem 63:72-80, 2007.

Wolfgang et al. JCO 27:5874-5880, 2009. RT 60 Gy/30
•318 patients – 1/2 Astrocytoma, 1/3 oligoastrocytoma, 1/8 oligodendroglioma
80% power to detect 50%improvement TTF w/ chemo one sided level 0.05
NOA-04 Phase III Anaplastic glioma
Wolfgang et al. JCO 27:5874-5880, 2009.
* TTF defined as failure after both chemo AND RT requiring new chemotherapy
PCV/TMZ RT
Median TTF* 43.8 mo 42.7 mo
Median PFS 31.9 mo 30.6 mo
4 year OS 64.6% 72.6%
NOA-04 Phase III Anaplastic gliomaGenetics
Wolfgang et al. JCO 27:5874-5880, 2009.
AO AOA AA
1p19q 77% 59% 15%
mMGMT 71% 71% 50%
IDH1 mut 71% 73% 57%

Side Note
Remember Organic Chemistry?
Whole genome sequencing identifies mutation Isocitrate Dehydrogenase 1 (IDH1)
Parsons DW, et al. Science 2008; 321: 1807-12
Sequence of 22 GBMs for 20,661 genes
BRUTE STRENGTH

Predictive value IDH1 mutation
43 WHO grade 3 oligodendrogliomas– IDH1 mutation by immunohistochemistry (IHC) – IDH1 mutation 51% of patients
Median OS:– 108 months IDH1 mutated patients – 12 months wild type – p=0.00002; Hazard Ratio 0.1
Frenel (France), et al. abstract #2002, Clinical Science Symposium ASCO 2011
Isocitrate Dehydrogenase 1 (IDH1)
NOA-04 Phase III Anaplastic glioma
• TMZ vs. PCV, no diff TTF
• Gr 3-4 Heme toxicity signif higher for PCV (18%) than TMZ (4%; p<0.01)
• MVA: 1p19q, mMGMT, IDH1 mut, <50 yo, oligo, GTR better prognosis• IDH1 and mMGMT better prog independent of
treatmentWolfgang et al. JCO 27:5874-5880, 2009.
NOA-04 Phase III Anaplastic glioma Conclusions
• PCV more toxic than TMZ
• TTF similar between chemotherapy and RT and similar between TMZ + PCV
• IDH1 and mMGMT predict better prognosis independent of treatment
Wolfgang et al. JCO 27:5874-5880, 2009.

NOA-04 Phase III Anaplastic glioma Conclusions
• Which patients treat first with chemo or RT or both?• Heterogeneous, small study • EARLY results*• Need further study…
*Maximal F/U 54 months
Wolfgang et al. JCO 27:5874-5880, 2009.
Anaplastic AstrocytomaIntergroup-9813:Phase I/III AA Trial
Phase I
Arm 1: XRT + BCNU 200 mg/m2 + TMZ 150 mg/m2 x 5d q 8 wks15 pts enrolled: 7/10 eligible pts needed dose mods
Arm 5: XRT + TMZ 150 mg/m2 x 5d + BCNU 150 mg/m2 q 8 wks15 pts enrolled. Combination produces unacceptable toxicity
Phase III n=480
Arm 3: XRT + BCNU 80 mg/m2 q 8 wks*Arm 2: XRT + TMZ 150 mg/m2 x 5d q 4 wks
Closed early: 201 patients enrolled
Chang SM, et al. Neuro-Onc 10:826, 2008. *CCNU allowed
Anaplastic AstrocytomaIntergroup-9813:Phase I/III AA Trial-
TOXICITY
TMZ BCNU P-valueGrade 3+4 45% 70% P<0.01
Grade 5 2% 1% NS
TMZ combined with RT significantly
better tolerated than BCNU
Chang SM, et al. Neuro-Onc 10:826, 2008

Radiotherapy and TMZ
Isn’t this what we should do?
Focal RT daily — 30 x 200 cGyTotal dose 60 Gy
Temozolomide 75 mg/m2 po qd for 6 weeks,then 150-200 mg/m2 po qd day 1-5 q 28 days for 6 cycles
Concomitant TMZ/RT*
Adjuvant TMZ
Weeks6 10 14 18 22 26 30
RT Alone
R 0
*PCP prophylaxis was required for patients receiving TMZ during the concomitant phase.
573 patients accrued. 76% received adjuvant TMZ, 36% all 6 cycles
Phase III Study: New GBMRadiation +/- Temozolomide
EORTC/NCIC Phase III GBM Trial: Overall Survival
months0 6 12 18 24 30 36 42
0102030405060708090
100RT TMZ/RT
Median OS: 12.1 mos 14.6 mos2-yr survival: 10% 26%HR [95% CI]: 0.63 [0.52-0.75]
P<0.0001
TMZ/RT
RT
%
Stupp NEJM 352(10): 987-96.

AA: More May Not Be Better
3
2.3
1.7
0
0.5
1
1.5
2
2.5
3
RT RT/CHEMO RT/Neut
RTOG database163 patients3 groups– RT alone– RT + BCNU or MeCCNU
or DTIC– RT + Neutrons
Laramore GE, et al. Int J Radiat Oncol Biol Phy. 1989;17:1351-1356.
AA: More May Not Be BetterIV versus IA BCNU
Shapiro W (BTCG) et al. J Neursurg 7:392-401, 2006.
HGG* n=315
RANDOMIZE
IV BCNU
IA BCNU
GBM
AA
Shap
iro W
(BTC
G) e
t al.
J N
eurs
urg
7:39
2-40
1, 2
006.

AA: More May Not Be BetterIV versus IA BCNU
Why worse OS– Remember AA live long enough to
develop toxicity… IA worse toxicity– 9.5% irreversible encephalopathy– 15.5% ipsilateral vision loss– 5% stroke
Shapiro W (BTCG) et al. J Neursurg 7:392-401, 2006.
AA: More May Not Be Better Conclusions
Temozolomide– Less toxic than Nitrosureas– Active in AA*– Survival advantage combined w/RT for GBMBut…– More not always better and may be worse
Yung WKA, et al. J Clin Oncol. 1999;17:2762-2771.
EORTC 26053/22054
SchemaRT
Observation
Observation
Adjuvant TMZ 200mg/M2
5 D/28D
Anaplastic Glioma without 1p/19q
deletions
N=680
Adjuvant TMZ 200mg/M2
5 D/28D
RT + TMZ
75mg/M2/D• RT = 5940/33fx • Adjuv. TMZ to 12 mo in
responders

GlioblastomaGrade 3 Glioma
– Anaplastic Astrocytoma– Oligodendroglioma
Low-grade GliomaPilocytic AstrocytomaEpendymoma
–Intracranial–Spine
Spinal Cord Astrocytoma
Impact of 1p 19q LOH in Oligodendroglioma
• Impact LOH most notable for histologic diagnosis of anaplastic oligodendroglioma
• 1p 19q less prognostic significance with other gliomas
100% response to chemotherapy with 1p 19q LOH.
*Ino Y, et al. Clin Cancer Res. 2001;17:839-845.
• Randomized trial 4 neoadjuvant cycles intensive PCV followed by RT vs RT alone
• Central review of neuropathology
• Tissue for 1p 19q available for 70%
• Randomized trial 6 cycles postradiation standard PCV vs RT alone
• Central review of neuropathology
• Tissue for 1p 19q available for 85%
RTOG 9402 EORTC 26951
Cairncross G, et al. J Clin Oncol. 2006;24:2707-2714.van den Bent MJ, et al. J Clin Oncol. 2006;24:2715-2722.
• 291 patients • 70% pure AO• 68% age <50• Median PFS favor PCV
– 2.6 vs. 1.7 years (P=.004)
• 368 patients • 72% pure AO• Median age 49• Median PFS favor PCV
– 1.9 vs. 1.1 years (P=.002)
ResultsRTOG 9402 EORTC 26951
Cairncross G, et al. J Clin Oncol. 2006;24:2707-2714.van den Bent MJ, et al. J Clin Oncol. 2006;24:2715-2722.
Cairncross G, et al. J Clin Oncol. 2006;24:2707-2714.
Overall Survival
van den Bent MJ, et al. J Clin Oncol. 2006;24:2715-2722.
Results
• Toxicity– 65% Grade III or IV toxicity
with PCV, 1 death• 1p 19 q
– 46% with 1p 19q LOH: median survival not reached
– 1p 19q intact: median OS 2.8 years (P<.001)
• Toxicity– 46% Grade III or IV heme
toxicity• 1p 19q
– 25% with 1p 19q LOH; median survival not reached
– 1p 19q intact: median OS 1.9 years (P<.001)
Studies confirm importance of 1p 19q LOH in prospective trials.
RTOG 9402 EORTC 26951

Overall Survival in Both Treatment Arms with & without Combined 1p 19q Loss
Cairncross G, et al. J Clin Oncol. 2006;24:2707-2714. van den Bent MJ, et al. J Clin Oncol. 2006;24:2715-2722.
EORTC-26951Genetic and Molecular Results
• 80+% mMGMT– Strongly correlated with 1p19q co-deletion
• mMGMT predicted better prognosis– Med OS ~60 vs. 12 months
• Prognostic significance equally strong RT alone vs. RT + PCV
van den Bent JCO 27:5881-5886, 2009
Conclusions on AO Studies• Neoadjuvant or adjuvant PCV
– Prolong PFS but…– Substantial PCV-related acute toxicity
• Benefit in PFS limited to patients 1p 19q deletions
– Survival not prolonged• 1p and 19q LOH significantly longer survival –
this is independent of initial treatment• How do we go forward?

Newly Diagnosed AO / AOA:
Assess 1p/19q
No (or single) 1p/19q deletion
1p/19q deletion
PROPOSED NEWLY DIAGNOSED ANAPLASTIC
GLIOMA INTERGROUP TRIALS
EORTC 26503
NCCTG N0577
NCCTG N0577: Intergroup Phase III 1p/19q Co-deleted Anaplastic Oligodendroglioma
Newly Diagnosed
AO/AO1p/19q
co-deletion
RT (5960cGy)
TMZ x 12 cycles
RT + TMZ → TMZ (Stupp)
N=245
N=245
N=50
Translational correlates- 1p/19q translocation- MGMT promotor methylation- Neurocog/QOL
Primary endpoints:- RT vs RT/TMZ: OS- TMZ: Neurocog/Clin/MRI
GlioblastomaGrade 3 Glioma
– Anaplastic Astrocytoma– Oligodendroglioma
Low-grade GliomaPilocytic AstrocytomaEpendymoma
–Intracranial–Spine
Spinal Cord Astrocytoma

Low-Grade Gliomas
Low-Grade GliomasKey Features
• 1,900 low-grade gliomas annually• Mean age: 37 years • Heterogenous population - wide range of
median survival times – Diffuse astrocytomas 5 years– Oligoastrocytomas 7.5 years– Oligodendrogliomas 10 years
Shaw EG, et al. J Neuro Oncology 1997;31:273-278.
RadiotherapyIs More Always Better?
1950s 2000s 1950s 2000s

EORTC “Believers” Trial 2284445 Gy vs 59.4 Gy
*Only stratification factor institution
LGG*n=343
RANDOMIZE
45 Gy
59.4 Gy
Karim AB, et al. Int J Radiat Oncol Biol Phys. 1996;36:549-556.
EORTC “Believers” Trial 22844 45 Gy vs 59.4 Gy
45 Gy 59.4 Gy P-value
5-yr PFS 47% 50% 0.94
5-yr OS 58% 59% 0.73
Intergroup 86-72-5150.4 Gy vs 64.8 Gy
LGGn=203
STRATIFY
AgeGradeHistologyResectionTumor sizeInstitution
RANDOMIZE
50.4 Gy*
64.8 Gy
*Focal fields: Tumor volume (by CT and/or MRI) + 2 cm margin to 50.4 GyBoost: Tumor volume + 1 cm margin

Intergroup 86-72-5150.4 Gy vs 64.8 Gy
• Patterns of Failure (65 pts data available/114 failures)
– 92% within treatment field– 3% outside field but within 2 cm– 5% beyond 2 cm from treatment field
Shaw E, et al. J Clin Oncol. 2002;20:2267-2276.
Intergroup 86-72-51Overall Survival
*Arm A: 50.4 Gy vs Arm B: 64.8 Gy
*Arm A: 50.4 Gy vs Arm B: 64.8 Gy
Radiotherapy
What’s it good for?
EORTC “Non-Believers” Trial 22845Immediate vs Delayed
Karim AB, et al. Int J Radiat Oncol Biol Phys. 2002;52:316-324.
LGGn=290
STRATIFY
InstitutionHistologyResection
RANDOMIZE
54 Gy
Observation PROG RT
EORTC “Non-Believers” Trial 22845 Immediate vs Delayed
Control RT P-value
5-yr PFS 35% 55% <0.0001
5-yr OS 66% 68% 0.87Van den Bent, et al. Lancet. 2005.Updated results 7.8 median F/U

EORTC “Non-Believers” Trial 22845 Immediate vs Delayed
• Median PFS improved 3.3 to 5.3 years (2+20)
• Seizures @ 1yr-25% RT vs 41% (p=0.03)
Van den Bent, et al. Lancet. 2005.
EORTC “Non-Believers” Trial 22845 Immediate vs Delayed
• Patterns of Failure– 91% within treatment field– 5% marginal– 4% outside treatment field
• Histological confirmation recurrence (80 patients) revealed high-grade 72% RT and 66% control
Van den Bent, et al. Lancet. 2005.
1p19q
Prognostic for Grade III, what about Grade II?

Oligo(O)
Mixed OA
Astro Total
Total 47 31 13 911p- & 19q- 57% 32% 0% 41%
5 year OSDeleted 96% 90% -- 95%
Not deleted 70% 62% 38% 59%• 91 patients 93-72-02 and 86-72-51
Jenkins et al, Cancer Research; 66: 9852-9861 2006. t(1;19)(q10;p10) mediates the combined 1p/19q deletion and is associated with superior OS and progression-free survival
Caveats: Phase III Multicenter Trials
• 45 to 54 Gy standard
• LGG continually grow*
• Delayed RT not elimination RT
*~4 mm/year. Mandonnet E. Ann Neuo 2003:53:524-528.
Caveats: Phase III Multicenter Trials
• CT vs MRI (target definition)
• Clinical significance of PFS benefit indeterminate since neurologic, QOL outcomes unknown

Caveats: Phase III Multicenter Trials
• RT does not cause or inhibit dedifferentiation
• Significant heterogeneity– Median OS 9.2 yrs No clinical risk factors vs.
0.7 yrs with 5 risk factors
• What about chemotherapy?
Pign
atti
F, e
t al.
J C
lin O
ncol
.200
2;20
:207
6-20
84
RTOG 98-02 Intergroup Trial
LGG
Low risk:Arm 1
Age <40 and GTR
observe
High risk:
Age >40 or STR/biopsy
R
Arm 2: RT 54 Gy
Arm 3: RT + 6 cycles PCV
~111 low risk 254 high risk P60 mg/m2
CCNU 110mg/m2
VCR 1.4 mg/m2
98-02: Survival by Arm

RTOG 98-02 Intergroup TrialLow-risk LGG - Prognostic Factors PFS
Shaw E, et al. JNS 109:835-841, 2008.
*Residual Tumor on MR: 59% <1cm , 32% 1-2 cm, 9% > 2 cm
Hazard RatioPreop tumor size:>4 cm vs <4cm* 1.98Histology:Astro vs Oligo/OA 2.09Imaging Residual:> 1 cm vs < 1cm 3.54
RTOG 98-02 Intergroup TrialLow-risk LGG
*Shaw E, et al. JNS 109:835-841, 2008. 5 Yr PFS 70%* and 13%**
<4cm, oligo, <1cm imaging residual*
>4cm, astro, >1cm imaging residual**
RTOG 98-02 Intergroup Trial
LGG
Low risk:Arm 1
Age <40 and GTR
observe
High risk:
Age >40 or STR/biopsy
R
Arm 2: RT 54 Gy
Arm 3: RT + 6 cycles PCV
~111 low risk 254 high risk P60 mg/m2
CCNU 110mg/m2
VCR 1.4 mg/m2

RTOG 98-02 Intergroup TrialHigh-risk LGG
• 251 high risk patients – 2/3 enhancing and 2/3 O/OA
• Originally compared survival data Wilcoxan test– sensitive early separation of curves
Shaw E, et al. abstract #2006, oral presentation ASCO 2008.
PCV=Procarbazine, CCNU, vincristine
RTOG 98-02 Intergroup TrialHigh-risk LGG – Progression Free Survival
RTOG 98-02 Intergroup TrialHigh-risk LGG
• Exploratory compared Log Rank test– sensitive late separation of curves
Shaw E, et al. abstract #2006, oral presentation ASCO 2008.
PCV=Procarbazine, CCNU, vincristine

RTOG 98-02 Intergroup TrialHigh-risk LGG - Log Rank Test
*Wilcoxan P-value OS = 0.33, PFS = 0.06
Shaw E, et al. abstract #2006, oral presentation ASCO 2008.
Ad hoc-Inclusion of only 2 year survivors-improved PFS + OS
RT RT + PCV P-Value
5 yr OS 63% 72% p=0.13*
5 yr PFS 46% 63% p=0.005
RTOG 98-02 Intergroup TrialCONCLUSIONS
• Adjuvant PCV with radiotherapy – Improved Progression Free Survival– Did NOT improve Overall Survival– Increased toxicity with PCV
• Little impact on practice*, most centers use temozolomide at recurrence, or instead of RT, or with radiotherapy
• EORTC Phase III trial; RT vs. Temozolomide
Shaw E, et al. abstract #2006, oral presentation ASCO 2008.
*Low-risk arm big impact on practice
Ongoing Study

EORTC 22033-26033
LGGn=466
STRATIFY
1p Statusetc.
RANDOMIZE
50.4 Gy*
TMZ x 12
*Age> 40 years; radiologically proven progressive lesion, new or worsening neurological symptoms, intractable seizuresCompleted accrual 03/2010
Focal RT daily — 28 x 180 cGyTotal dose 50.4 Gy
Temozolomide 75 mg/m2 po qd for 6 weeks,then 150-200 mg/m2 po qd day 1-5 q 28 days for 12 cycles
Concomitant TMZ/RT
Adjuvant TMZ
Weeks6 10 14 18 22 26 30
RT Alone
R 0
*Symptomatic = uncontrolled headaches or seizures, focal deficits, cognitive symptoms
E3F05 Phase III Symptomatic* or Progressive LGG: RT +/- Temozolomide
N= 540
What About Brain Damage?
• LGG ideal population to study– Long PFS
• Cause Neurocognitive Deficits Multifaceted

Etiology Neurocognitive Deficits
• Radiation• Chemotherapy• Surgery• Tumor location and
progression• Medications• Nutritional deficiency
states
• Trauma• Infections• Vascular disease• Intrinsic neurologic
diseases • Metabolic• Hydrocephalus • Depression
Neurocognitive Toxicity• Retrospective trials neurocognitive decline in
adults– Outdated, primitive technique (whole brain RT)– Large fraction sizes– Unknown denominator– Most important- LACK OF BASELINE TESTING
Gregor A, et al. Radiother Oncol 1996;41:55-59. Surma-aho O. Neurology 2001;56:1285-1290. Curnes JT. Am J Roentgenol 1986;147:119-124. Imperato JP, et al. Ann Neurol 1990;28:818-822. Brown PD, et al. Neuro-oncol2003;5:161-167. DeAngelis LM, et al. Neurology 1989;39:789-796.
Neurocognitive Toxicity
• NCCTG 86-72-51 corollary study• 20 patients (10 Arm 50.4 Gy, 10 Arm 64.8 Gy)• Underwent extensive battery
neurocognitive tests* at baseline (after surgery, before RT), and q18 months up to 5 years
Laack N, et al. Int J Radiat Biol Oncol Phys. 2005; 63:1361-7.
*MMSE, the WAIS-R (factors), AVLT, BVRT, TMT, Stroop, COWAT

Neurocognitive Toxicity• No differences in neurocognitive function
between the two arms or compared to baseline
• Results consistent with other prospective trials– tumor progression most important cause of
deterioration
Laack N, et al. Int J Radiat Biol Oncol Phys. 2005; 63:1361-7.
Prospective Trials Extensive Neurocognitive Testing Low-Grade Brain Neoplasms
Author # Pts Dose Neurotoxicity After RT? Glosser 17 68.4 Gy No, mild ↓↓ motor speed*Vigliani 17 54 Gy NoArmstrong 26 54.6 Gy No, mild ↓↓ visual memory**Torres 15 54 Gy No***Steinvorth 40 57.6 Gy No
*Predominately at higher doses; **at 5 years; ***Decline in memory and attention only if tumor progressed
Glosser G, et al. Int J Radiat Oncol Biol Phys 1997;38:231-239. Vigliani C, et al. Int J Radiat Oncol Biol Phys1996;35:527-533. Armstrong CL, et al. Neurology 2002;59:40-48. Torres IJ, et al. Neurology 2003;60:1113-1118. Steinvorth S, et al. Radiother Oncol 2003;69:177-182.
LGG – More Conclusions• Incorporation of chemotherapy into
treatment regimens – prospective trials needed– Support E3F05 (RT vs. RT + TMZ)
• Modern, focal RT low risk cognitive deficits

GlioblastomaGrade 3 Glioma
– Anaplastic Astrocytoma– Oligodendroglioma
Low-grade GliomaPilocytic AstrocytomaEpendymoma
–Intracranial–Spine
Spinal Cord Astrocytoma
Pilocytic Astrocytomas
• WHO grade I tumors • Well circumscribed,
enhancing cerebellar lesions typically in kids– Few adult studies
• Surgical resection alone 10 yr OS >80%– Most important intervention
• Observation after GTR or STR
• Radiation (50.4 Gy SRT) recommended after biopsy or recurrence after STR– Especially if symptomatic
• Malignant transformation rare event– As many reports malignant transformation after radiation
as after surgery alone
Brown et al., IJROBP 58 (4):1153-1160, 2004
Pilocytic AstrocytomasRecommendations

GlioblastomaGrade 3 Glioma
– Anaplastic Astrocytoma– Oligodendroglioma
Low-grade GliomaPilocytic AstrocytomaEpendymoma
–Intracranial–Spine
Spinal Cord Astrocytoma
Intracranial Ependymoma
• 5% brain tumors• Image entire CNS axis• Historical standard post-op RT
• Barrow Neurologic Institute –– 45 posterior fossa image defined resection
• 71% GTR• 29% STR
Mork, Loken Cancer 40:907-915, 1977Rogers (Barrow Neurologic Institute) JNS 102:629-636, 2005. 96% Low grade tumors.
Ependymoma – Barrow
• Extent of resection image defined
Rogers (Barrow Neurologic Insitute) JNS 102:629-636, 2005. Median RT dose 54 Gy*P=0.018 compare to GTR and P=0.003 compared to STR + RT
10 yr LC 10 yr OSGTR + RT 100%* 83%GTR 50% 67%STR + RT 36% 43%

Intracranial Ependymoma
• Failure predominately local • RT
– Low Grade – local fields 55.8 Gy– High Grade – local fields 59.4 Gy
GlioblastomaGrade 3 Glioma
– Anaplastic Astrocytoma– Oligodendroglioma
Low-grade GliomaPilocytic AstrocytomaEpendymoma
–Intracranial–Spine
Spinal Cord Astrocytoma
Intraspinal Ependymoma
• 63% intramedullary spine tumors
• Image entire CNS axis
• En bloc resection (not piecemeal) curative– Up to 95% DFS Grade II
Hanbali (MDAH) 51:1162-1174, 2002
Intraspinal Ependymoma
• Failure predominately local
• RT– STR – local fields 50.4 Gy– High Grade – local fields 55.8 Gy (?CSA 36 Gy)– Myxopapillary Ependymoma – local fields 50.4
Gy if not en bloc resection
Myxopapillary Ependymoma – MDAH
• Authors recommend post-op RT for all patients due to irregular shape, nerve root involvement of Myxopapillary
Akyurek J Neuro-Onc 80:177-183, 2006. Median RT dose 50.4 Gy*P<0.05
Adjuvant RT ObservationGTR 45% 85%10 yr Local Control 86% 46%*
10 yr PFS 75% 37%*
Myxopapillary EpendymomaRARE CANCER NETWORK
Pica, Miller, et al. IJROBP 74:1114–1120, 2009. Median RT dose 50.4 Gy* P=0.4 compared to surgery alone **P=0.05 compared to surgery aloneSchild et al, IJROBP 53(3): 787, 2002. Mayo also found benefit >50 Gy
Observation <50.4 Gy >50.4 Gy
5 yr PFS 50% 68%* 82%**

Pilocytic AstrocytomaLow-grade GliomaGrade 3 Glioma
– Anaplastic Astrocytoma– Oligodendroglioma
GlioblastomaEpendymoma
–Intracranial–Spine
Spinal Cord Astrocytoma
Spinal Cord Astrocytoma
Spinal Cord Astrocytoma - Mayo Clinic
• 200-300 intramedullary spinal cord astrocytomas annually
• Controversial due to rarity
• Reviewed 136 consecutive patients treated Mayo Clinic between 1962 and 2005
Minehan, Brown, Scheitauer IJROBP 73(3):727-33, 2009

P<.001P<0.01
Median OS Grade I – NR Grade II – 4.1 years
Grade III – 1.6 years Grade IV – 0.8 years
P=.04
P=.52
> 35 Gy< 35 Gy
P=0.04
Pilocytic
Spinal Cord Astrocytoma - Mayo Clinic
• No proven role adjuvant RT pilocytic• RT for all infiltrative astrocytomas
– Grade 2 – 50.4 Gy local field– Grade 3 – 55.8 Gy local field– Grade 4 – 59.4 Gy local field
Minehan, Brown, Scheitauer IJROBP 73(3):727-33, 2009

Part 2 ‐ Outline
• Craniopharyngioma• Pituitary Adenoma• Vestibular Schwannoma• Meningioma
CRANIOPHARYNGIOMAEpidemiology
• Benign tumor arising from remnant of Rathke’s pouch• 1‐3% of all intracranial tumors• 10% of peds• Biomodal distribution
– Childhood 5‐14 years– Adult 55‐65 years
• Male = Female• No risk factors
HISTOLOGYAdamantinomatous
• 65% of adults and 95% of children• Originate from ectopic remnants of Rathke’s pouch
• High lipid/cholesterol content: “crank case oil”• Calcifications

Squamous Papillary
• Almost always in adults• Less likely to have cystic component• Rarely calcified• Some believe it has a better prognosis
Anatomy
Info-radiologie.ch
Anatomy

Presentation
• Vision changes (40‐70%)– Bitemporal hemianopsia
• HA (50%)• N/V (35%)• Papilledema (25‐40%)• Hormonal changes secondary to pituitary hypofunction• ED in men and amenorrhea in women for 90% of adults• Overall 80% with endocrine abnormalities
Work up
• H&P• Hormone levels• Electrolytes• UA/urine lytes• CT/MRI
Imaging• Plain films– enlarged distorted sella; calcifications
• CT– partially cystic, low density, contrast enhancing lesion with calcs
• MRI– Solid component isointense on T2 but enhances with gadolinium
– Cystic component hyperintense to CSF on T2 and hypointense on T1
– cyst rim enhances with gadolinium.

Differential Diagnosis
• Meningiomas• Pituitary adenoma• Metastasis• Optic gliomas• Teratomas• Chordomas• Systemic histiocytosis• Sarcoidosis

TREATMENTSurgery
• Decompression via ventriculostomy or VP shunt; urgent decompressive resection if acute visual deterioration
• Diagnosis• Resection if small tumor where GTR possible without much morbidity
Surgery• GTR most likely for
– <3cm– Pre or intrachiasmatic lesions– Solid component– No hypothalamic extension
• Retrochiasmatic tumors have higher mortality with sx
• Trans‐sphenoid approach gives higher GTR• 10 yr LC with GTR=90%, STR=30%
Surgery
• Often difficult to resect because of the cystic nature• Considerable morbidity with non‐trivial operative mortality (as high
as 20% in older series)– Long‐term neurologic, endocrine, and ophthalmic complications– Often surgeons will offer less aggressive surgery followed by XRT
• 10 year survival >90% with about 90% local control for STR resected tumors followed by radiation
Fahlbusch et al. J Neurosurg. 90(2):237-50. Feb 1999

Surgery RT
• Recurrence after STR about 50%• Richmond series
– STR vs. STR + RT reduced recurrence from 37% to 4% at 5 years• Weiss series
– STR vs. STR + RT reduced recurrence from 60% to 13% at 5 yrs• Karavitaki series
– STS vs. STR + RT reduced recurrence from 62% to 23%• Modern series suggest a local recurrence after Sx and RT to be less than 10%• Timing of radiation is controversial, but some argue immediate radiation with
increased local control
Richmond et al. Neurosurgery. 6(5):513-17. 1980Weiss et al. IJROBP. 17(6):1313-21Karavitaki et al. Clin Endocrinol. 62(4):397-409. Apr 2005Mark et al. Radiology. 197(1):195-8. Oct 1995
Radiation• Used for inoperable, partial resection, or recurrent disease
• 3DC, FSRT, SRS, intracavitary brachytherapy• 54 Gy/1.8 Gy per fraction recommended
– Doses >55 Gy with increased optic neuropathy– Doses <54Gy lower control rates (44% vs 16% recurrence)*
– PTV=GTV + 5‐10mm*Regine et al. IJROBP. 24(4):611-7.1992Habrand et al. IJROBP. 44(2):255-63. May 1999Cavazzuti et al. J Neurosurg. 59(3):409-17. 1983
Toxicity after STR + XRTDeficiency ADH Growth
HormoneThyroid Hormone
Sex Hormone Steroids
Pre Treatment 19% 30% 10% 12% 11%
Post Treatment
25% 41% 66% 39% 59%
• Optic neuropathy rare if dose <60Gy and <2.5 Gy per fx• Hypothalamic obesity as high as 50%
Rajan et al, IJROBP 1997; 37:517-21Flickinger et al. IJROBP, 1990; 9:117-22

SRS• Treat GTV only• Doses range between 11‐20Gy based on size and location
• chiasm < 8Gy‐10Gy• Brainstem <14Gy• Margin dose must be higher than 6Gy
– (95% recurrence rate when lower*)
*Ulffarson et al. J Neurosurgery. 2002;97(5 suppl):613-22
Outcomes
• STR + XRT 84% LC if >54Gy used• 78% 20 year OS for those treated for primary disease versus 25% for recurrence
Regine et al. IJROBP 1992; 24:611-17
Treatment: Cyst Management
• Can be resected or scerlosed with chemotherapy or radio‐isotope infusion
• Recurrent cysts may require aspiration and placing an Ommaya

Cystic Tumors
• P32 to a dose of 189‐250 Gy• 90% 5 yr OS• 70% LC at 10 years• Risk of intracavitary solution leaks
Hasegawa et al. Neurosurgery 2004: 54(4):813‐20; 820‐22
Pituitary Adenoma
Epidemiology
• Represent between 10‐15% of CNS neoplasms• Females>males (especially microadenomas)• Usually between ages 45‐55• Benign, invasive, or carcinoma
– Majority are benign (greater than 60%)– Invasive adenomas make up 35%– True carcinomas are rare (<0.2%)

Genetic• MEN 1—loss of function of this tumor suppressor genes
can cause tumors in parathyroid, pancreatic islets, or pituitary gland
• Gs-alpha—an activating mutation of the alpha subunit of the guanine nucleotide stimulatory protein found in 40% of somatotroph adenomas
• PTTG—pituitary tumor transforming gene is over-expressed in most pituitary adenomas
• FGF receptor-4—A truncated for of the receptor for fibroblast growth factor-4 identified in pituitary adenoma
Associated Syndromes• MEN‐1• Carney complex—rare inherited condition with spotty skin pigmentation, myxomas, endocrine over activity, and schwannomas
• Isolated familial somatotropinomas (IFS)—two or more cases of acromegaly in a family in the absence of MEN‐1 or Carney complex
Size
• Microadenomas are <10mm– Majority are microadenomas
• Macro adenomas >10 mm• Giant adenoma > 40 mm

Secretory
• 70% Secretory– Prolactinomas the most common
• 30% Non‐secretory (non functioning)
Histologic Classification
• Immunocytochemical staining correlates with hormone levels– 20% have no identifiable hormone production– Ultrastructure criteria can confirm nonfunctional lesions originated from pituitary (GH and Prolactinoma!)
– Categorize cytological differentiation of tumor cells in terms of different pituitary cell types
Functional Criteria
1. Prolactinomas2. ACTH‐producing adenomas (somatotrophs)3. GH‐producing adenomas (somatotrophs)4. TSH‐producing adenomas (thyrotrophs)5. Non functioning adenomas (usually
gonadotrophs)

Pathology
• GH and prolactin are derived from subtypes of acidophilic cells, whereas ACTH, TSH, LH, and FSH are secreted by different basophilic cells)
• Chromophobic are non‐secreting however PRL may be increased due to compression
• Ki‐67 elevated• WHO uses IHC and secretory pattern (somatotroph,
lactotroph, gonadotroph, corticotroph, thryotroph, plurihormonal, null‐cell)
Prolactinomas
• >250 μg/L common (Normal <15 μg/L)– Symptoms not correlated with level
• Microadenomas are found in 11% of autopsies with prolactinomas making up 44%
Klibanski, A. NEJM. 262;13, April 1, 2010
Work Up
• H&P with special attention to neurologic exam including visual field testing
• Endocrine workup– Serum prolactin, ACTH, IGF‐1, GH, 24 Hr urine free cortisol, dexamethasone suppression test, serum LH/FSH, thyroid function, testosterone, estradiol
• For tumors <10 mm in an asymptomatic patient, consider just checking prolactin levels
• Imaging– MRI with Gad (pituitary protocol), CT for bone destruction, skull films

Differential Diagnosis of Sellar Lesions
• Pituitary adenoma• Pituitary hyperplasia• Craniopharyngioma• Meningioma• Chordoma• Lymphoma
• Germ cell tumors• Metastasis• Inflammatory • Cysts (Rathke’s cleft, arachnoid, dermoid)
Prognostic Factors
• Tumor size• Extent of endocrine dysfunction• Suprasellar extension• Age (younger is better)
Clinical Presentation
• Endocrine changes• Headaches• Bitemporal hemianopsia• Ophthalmoplegia (CN III palsy)• Ptosis• Diplopia• Facial numbness

Hormone Syndrome
ACTH Nelson’s syndrome, Cushing’s disease
Growth Hormone
Acromegaly, gigantism
LH, FSH Clinical syndromes uncommon; variable and inefficient hormone production
Prolactin Amenorrhea, galactorrhea, infertility, impotence. Usually start with medical management (effective in 80‐90%).
TSH Hyperthyroidism
Acromegaly
Treatment• Medical Management
– Bromocriptine and cabergoline (a dopamine agonist) for prolactin secreting tumors
– Can reduce secretion and size in 80%– Can stop after 2 years of normal hormones levels and close f/u
– Somatostatin analogs (octreotide, lanreotide) for growth hormone secreting
– 50-60% success rate in those not responding to surgery– Mitotane, ketoconazole, metapyrone for ACTH secreting,
– Usually less effective than local therapies

Surgery
• Allows prompt decompression of mass effect• Histology• Rapid normalization of hormone levels• Long term control of 80‐90% of microadenoma and 25‐50% with macroadenomas
Surgery
• Transsphenoidal microsurgery particularly effective for microadenomas and adenomas that extend outside of the sella
• Contraindications to transsphenoidal approach• dumbbell‐shaped adenomas with constriction of the diaphragm of the sella, lateral suprasellar extension, massive suprasellar tumors, and an incompletely pneumatized sphenoid
• Often will start prolactinomas with medical management first
• Minimally invasive technique
• Microscope, endoscope visualization
• Neuro-navigational guidance
• Short hospital stay and quick recovery
• 70-90% of microadenomas are cured
• 60% of macroadenomas recur > 5 years
• Low complication rate
• Surgical complications <10%
• CSF leak
• Infection
• Hemorrhage
• Stroke
• Pituitary dysfunction
• Cranial neuropathies
• <1% mortality for experienced surgeons
Modern Trans-sphenoidal surgery

Indications for Radiation
• Incomplete resection• Recurrent tumors• Inoperable patients• Refractory secretory tumors
Radiation
• Cavernous sinus invasion is probably not amenable to surgery and is better treated with radiation
• EBRT controls hypersecretion in about 80% of patients with acromegaly, 50‐80% of those with Cushing’s disease, and about 1/3 of those with hyperprolactinemia
• Local control versus biochemical control
SRS
• First used in 1968 for pituitary adenoma• Indications for SRS include:
– Extension to cavernous sinus– Small (<4cm inoperable tumors)– Incomplete surgical extripation– Recurrence after EBRT

SRS• Reverses endocrinopathies faster and more predictably than EBRT
• Need to hold drug therapy before and during SRS especially for prolactinomas*
• Doses range between 12‐28 Gy based on size and location– RR suggest doses higher than 15Gy increases LC for secreting tumors (try to achieve 20 Gy if can be done safely)
– Secretary tumors 24‐28 Gy marginal dose– Non‐secretary 14‐16 Gy *Landolt et al. J Neurosurgery. 2000;93,14-18
*Pouratian et al. Neurosurgery. 2006;59(2):255-266
Prolactinomas• Surgery recommended for the following:
– Increasing tumor size despite medical therapy– Pituitary apoplexy– women seeking fertility, macroadenoma in close proximity to optic
chiasm despite optimal medical therapy (prepregnancy debulking recommended
– CSF leak after dopamine agonist– Dopamine agonist contraindicated (psychiatric conditions)
Klibanski, A. NEJM. 262;13, April 1, 2010
Prolactinomas
• Medical therapy normalizes and shrink tumors in 90% of cases – Returns in 90% once discontinued
• Resection for salvage effective in 75-90% of microadenomas and 20-50% of macroadenomas
• 45Gy/1.8Gy per fx normalized prolactin levels in 50% but can take years
• SRS controls tumors in 90% but hormone control in only 20-50%– Hold dopamine agonist for 2 months

ACTH Secreting Adenoma (Cushing Disease)
• Account for 70% of patient with Cushing syndrome
• Primary resection yields 65-90% control vs 45-60% with primary XRT
• XRT for STR
Growth Hormone Secreting Adenoma (Acromegaly)• Resection often curative• Somatostatin analogs used for second-line therapy• Radiation can yield 80% normalization of growth hormone with
time (delayed)• SRS yields LC in excess of 95%• Time to normalization is 1.4 years with SRS versus 7.1 years
with EBRT• Concurrent octreotide with SRS delays hormonal normalization
and should be discontinued 1-2 months prior
Jenkins et al. J Clin Endocrinol Metab 2006;91(4)1239-1245Landolt et al. J Neurosurg. 1998;88(6)1002-08Landolt et al. J Clin Endocrinol Metab. 2000;85(3):1287-89
Non Functioning Adenomas
• Most macroadenoma• Usually present with vision changes so usually
surgery is advocated (80-90% LC)• 50% recurrence after STR• Immediate postop RT yields LC >90% versus LR
after STR of 33% at 15 years• SRS yields LC>90% with less than 25% new
endocrinopathiesGittoes et al. Clin Endocrinol. 1998;48(3):331-37Van den Bergh et al. IJROBP. 2007;67(3):863-69

XRT Technique• Techniques include:
– wedged laterals with a coronal field– moving arc fields– 360‐degree rotational fields– IMRT– SRS/FSRT
• In general, the portals are 5x5 or 6x6 cm (use a pituitary board for 3DC)
• Fraction sizes >2 Gy increase risk of chiasmal damage
Brada et al. Clinical Endo. 61(5):531-43. Nov 2004
Technique
• Dose– 45 Gy/1.8 Gy fx for nonsecreting microadenomas– 50.4‐54 Gy/1.8 Gy fxfor macroadenomas or secreting tumors
– SRS 14‐16Gy for non secreting (no benefit above 20Gy) and 24‐28Gy for secreting tumors
– Local control non secreting tumors 90‐100%, GH secreting 80‐90%, ACTH secreting 60‐80%, prolactinomas 80‐90%
Successful Treatment
• Based on resolution of symptoms• Stable disease to complete response• Peak nadir GH <1.0 μg/L (two‐site assay) with oral glucose tolerance test (OGTT)
• IGF‐1 levels normal for age and sex
Consensus statement, JCEM 89: 3099-3102, 2004

Outcome‐Radiosensitivity
1. GH2. GnRH3. TSH4. ACTH
OutcomeStudy n Technique Follow-up Biochemical
responseLC
Mackley 2006 IJROBP
34 IMRT 42.5 m 100% 89%
Minigione 2006Neurosurgery
100 SRS 45 m -- 92%
Collin 2005IJROBP
110 Arc/FSRT 82 m 100% 89%
Pollock 2003 Neurosurgery
55 SRS 43 m -- 97%
Petrovich 2003 Neurosurgery
78 SRS 41 m -- 96%
Estrada1997NEJM
30 3DC 42 m 83% 83%
Acute Toxicity
• Fatigue• Otitis• Alopecia• Ocular hypersensitivity

Late Effects• Up to 75% have GH deficiency• 50% have deficiency in FSH, LH
– TSH and ACTH or least likely to be affected
• Vascular injury <5%• Optic neuropathy (<2%)• Radiation necrosis (1%)• Secondary malignancies (1%)• Neuropsychological (1%)
Brada M, et al. IJROBP 45:693-698, 1999Becker G, et al. Strahlenther Onkol 178:173-186, 2002
Endocrine Deficits after SRS
• Retrospective review of 128 pts undergoing GKS at Mayo Clinic
• Risk of ant pit deficit was 16% and 45% at 2 and 5 years, respectively
• Poor visualization and mean dose to pituitary predictive of endocrinopathy– ≤7.5 Gy, 0% (0/7); 7.6 to 13.2 Gy, 29% (7/24); 13.3 to 19.1 Gy, 39% (9/23); >19.1 Gy, 83% (5/6)
Leenstra et al. Neurosurgery. 67:27-33, 2010
Vestibular Schwannoma

Incidence
• Symptomatic incidence is ~1/100,000– 0.2% of MRIs with VS– Represent 80‐90% of CPA tumors– Rising incidence
• Almost always unilateral– Bilateral is a pathognomonic feature of NF2 patients
Risk Factors
• Acoustic Trauma• Parathyroid Adenoma• NF‐2
– 1 in 25K
• Cell phones…controversial– Contradictory studies– Probably a long latent period
Pathology
• Derived from epineural Schwann cell of 8th CN• Arise from Obersteiner‐Redlich zone• Stain positive for S100 protein• Antoni A and B areas

Biology
• Biallelic inactivating mutations of tumor suppressor gene NF2 on x‐some 22q12 seen in sporadic and NF2‐associated VS
• NF2 encodes for merlin (protein involved in cell proliferation)
• Merlin may be a target for future therapies
Natural History
• Variable growth rate– Avg 1.9 mm/year– 40% will show no growth or even spontaneous shrinkage on serial images.
Clinical Presentation
• Symptoms related to CN involvement and local progression
Vestibular schwannomas usually arise from the cells of the VIII nerve within the internal auditory canal (usually superior and inferior branches)

Clinical PresentationAcoustic Nerve Symptomatic involvement in 95%.
Hearing loss, tinnitus. Vestibular Nerve
Involve 60% of patients. Mild to moderate unsteadiness with gait. Vertigo uncommon.
Trigeminal Nerve
Occur in 15%. Facial numbness, hypesthesia, and pain.
Facial Nerve 5%. Facial paresis and taste disturbances.
Posterior Fossa
Compression on cerebellum or brainstem results in ataxia.
Work‐up
• Physical exam• Audiometry• Imaging
– Contrast enhanced MRI
Diagnostic Tools
Gadolinium‐enhanced MRI– Uniformly enhanced density– Can expand the internal auditory meatus

Growth Pattern• Acoustic neuromas usually
grow very slowly over a period of many years (1‐2mm/year)
• The tumor first distorts the 8th nerve, then presses on the adjacent 7th nerve
• The 7th nerve is gradually stretched into a ribbon like structure over the enlarging tumor
• It is at this stage that the tumor presses adjacent nerves like the trigeminal responsible for facial sensation
• Cystic lesions are more aggressive
Intracanalicular stage
Confined entirely inside the internal auditory canal. Pts often complain of difficulty with hearing in one ear, which may begin suddenly or insidiously. Hearing loss may be accompanied by noise inside the ear (tinnitus), dizziness and vertigo.
Extension out of IAC into the CPA
The tumor has a characteristic shape, with a root like extension in the internal auditory canal and a globular portion in the intracranial cavity, just touching the brainstem, cerebellum and some of the cranial nerves.

Brainstem compressive stage
The brainstem, cerebellum and cranial nerves are being compressed by the tumor. This can lead to increased headaches and numbness of the face.
Hydrocephalus or blockage of CSF drainage
Can lead to severe symptoms such as double vision , difficulty with speech and swallowing, and even difficulty with breathing, and eventually death
Treatment Options
• Observation• Surgery• Radiation

Observation
• 5% will spontaneously shrink• ~25% of cases are treated medically• Some tumors grow only 1‐2 mm / year (3mm for NF2)• Serial audiometry and MRI every 1‐2• May be reasonable in some pts:
– Elderly pts with slow‐growing tumors confirmed on serial scans
– Pts with a lesion in the dominant or sole side of hearing where an intervention would render hearing loss
• Risks:– Hearing loss despite minimal growth– 75% of tumors grow within 1 year
Surgery• 50% of patients are treated surgically
– Steep learning curve (20‐60 cases) • Mortality ~ 2%• Cure rates > 95%• Preservation of facial nerve and hearing is goal
– Influenced significantly by tumor size and approach• Facial nerve function is electrically monitored during surgery.
Three Surgical ApproachesApproach Indications Advantages/DisadvantagesRetrosigmoid/suboccipital Any size with attempted
hearing preservationLower risk of facial injury. Increased HA,leaks,cerebellar injury
Middle Fossa <2cm, involve lateral IAC, hearing preservation
High hearing preservation, increased risk to facial nerve and temporal lobe
Translabyrinthine Nonserviceable hearing in affected ear
Complete visualization of IAC allows higher GTR rates, no hearing preservation

Surgery Complications
Post‐op complications ~ 20%1. CSF leak – 5‐15%2. Meningitis – 2‐10%3. Facial weakness – 4‐15%4. Hearing loss varies according to approach5. Headache – 10‐34%6. Stroke7. Brain injury
Microsurgery Results
Year #Pts LC FM HP Comp. DeathOJEMANN 1993 410 97% 96% 36% 10.5% 0.5%HOUSE 1982 216 99.5% 83% 40% 10.6% 0.4%HARDY 1989 100 97% 82% 16% 18% 3%TOS 1988 300 87% 10.5% 2%EBERSOLD 1992 256 97% 92% 49% 28% 0.7%SCRIPPS 1994 11 91% 91% 18% 9% 0%SAMII 1997 1000 98% 15% 20% 1.1%
AVERAGE 2293 98% 90% 27% 17% 1.1%
LC=Local control; FM=Facial movement; HP=Hearing preservation
Three Radiation Approaches
1. Stereotactic Radiosurgery – Gamma Knife or Linac Based– Viable option for patients with tumors <3cm or for
growing tumors in medically inoperable– 12.5 to 13 Gy
• Typically prescribe to 50% IDL with GKS• TV is macroscopic volume seen on MRI
– 5 year PFS correlated with tumor size (1.5% decrease per 1 cm3)

Noren et al.• Largest single physician experience• 669 pts from 1969 to 1997• Long‐term growth control of 95%• Facial numbness/weakness ↓ over time
– (32% to 2%) • Hearing preservation 65‐70%
Noren G et al. Stereotactic & Functional Neurosurgery. 70 Suppl 1:65-73, 1998 Oct
Post Treatment Imaging
Nakamura H. et al. American Journal of Neuroradiology. 21(8):1540‐6, 2000
• Analyzed the evolution of follow‐up MR imaging findings after gamma knife radiosurgery.
• Changes in tumor volume and enhancement were assessed on 341 follow‐up MR studies obtained in 78 of 86 consecutive patients
• Follow‐up MR studies were obtained between 10 and 63 months (mean, 34 months) after treatment.
• Tumor control rate was 81%.
Serial axial T2‐weighted images in a 52‐year‐old woman.Note the hyperintensity in the adjacent brain tissue at 6 months and remarkable
improvement at 10 months.
Nakamura H. et al. American Journal of Neuroradiology. 21(8):1540-6, 2000
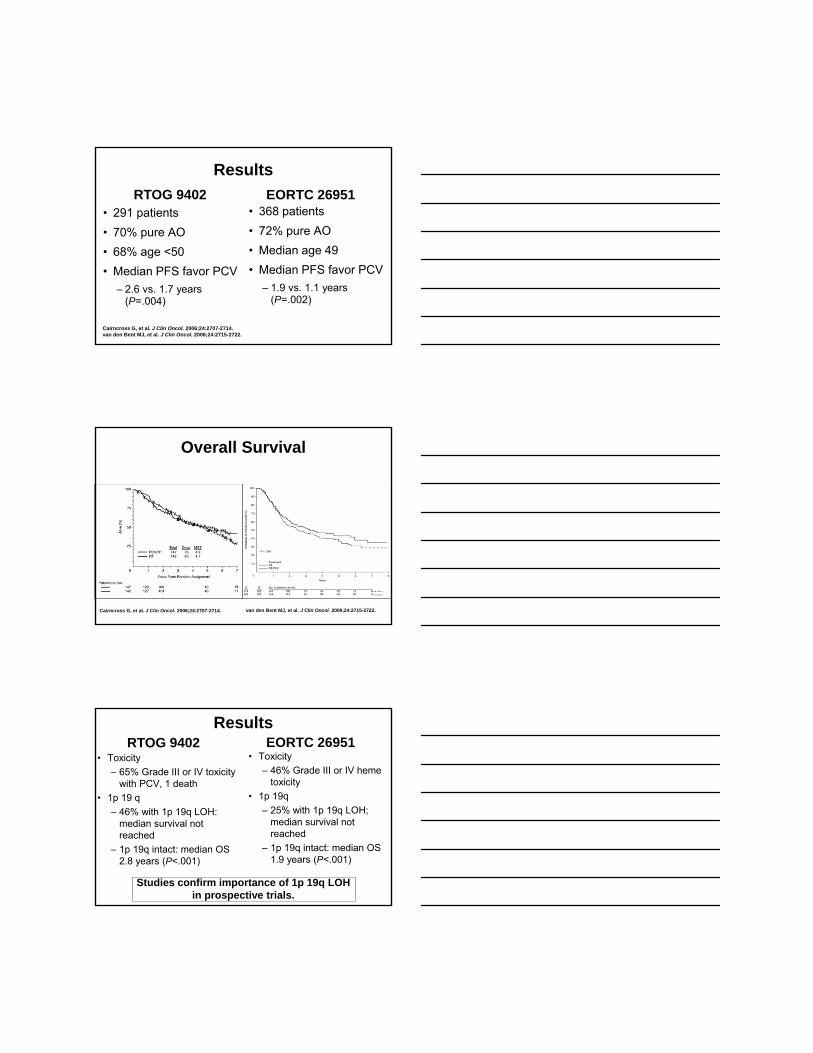
Serial contrast‐enhanced axial T1‐weighted images (450/17/5) in a 51‐year‐old man. Note that the tumor shows temporary enlargement with transient loss of contrast enhancement 3 months after treatment.
Temporary enlargement (41%)
Nakamura H. et al. American Journal of Neuroradiology. 21(8):1540-6, 2000
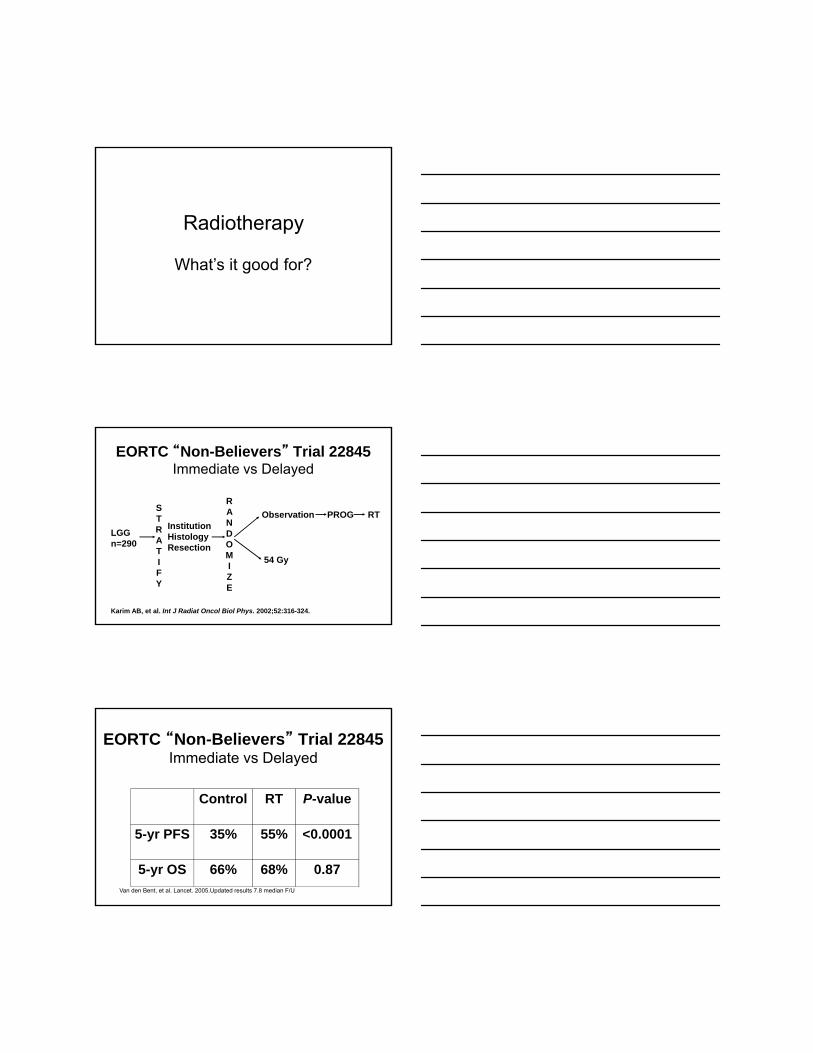
Serial contrast‐enhanced axial T1‐weighted images in a 25‐year‐old woman. Note that the tumor shows no change in size with transient loss of contrast enhancement 6 months after treatment and thereafter the tumor shows continuous regression with recovery of contrast
enhancement.
No change or sustained regression (34%)
Nakamura H. et al. American Journal of Neuroradiology. 21(8):1540-6, 2000
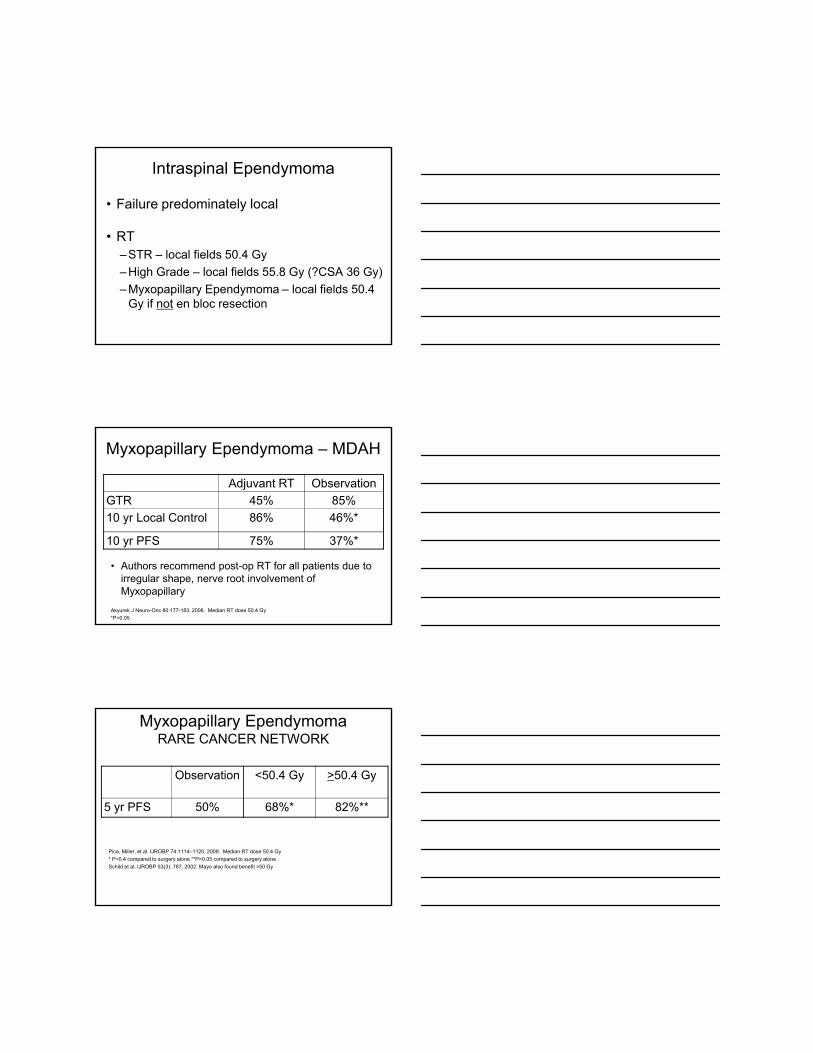
Serial contrast‐enhanced axial T1‐weighted images in a 64‐year‐old woman show enlargement of the cystic component and transient loss of contrast enhancement in the solid component at 3 months; regression of the cystic component, slight enlargement and recovery of contrast enhancement of the solid component, and slight regression of the overall tumor at 18 months; further enlargement of the solid component, no change in the cystic component, and regression of
the overall tumor at 24 months; and remarkable regression of the tumor at 50 months.
Alternating enlargement and regression (13%)
Nakamura H. et al. American Journal of Neuroradiology. 21(8):1540-6, 2000

SRS vs. Microsurgery: France
Treatment CN VII Motor disturbance
CN V Disturbance
Hearing Pres
Functional disturbance
Hosp stay
Work missed
Surgery 37% 29% 37.5% 39% 23 130GK 0% 4% 70% 9% 3 7
Regis et al. J Neurosurgery. 2002 Nov; 97(5):1091-100
• Non Randomized prospective series using pre‐ and post‐ Rx questionnaires• Minimum follow up 3 years• GKS=97 pts• Microsurgery 110 pts
SRS vs. Surgery
• Prospective cohort of 82 patients with unilateral VS <3cm
• GK mean dose 12.2Gy to tumor margin• No difference in tumor control (100% vs. 96%)• GK better facial nerve preservation (63% vs. 5%)
Pollack et al. Neurosurgery. 2006 58(7) 77-85
Three Radiotherapy Options
2. Fractionated Stereotactic Radiosurgery– 50‐55 Gy in 25‐30 fractions– 20‐25 Gy in 4‐5 fractions– Typically 80% isodose line
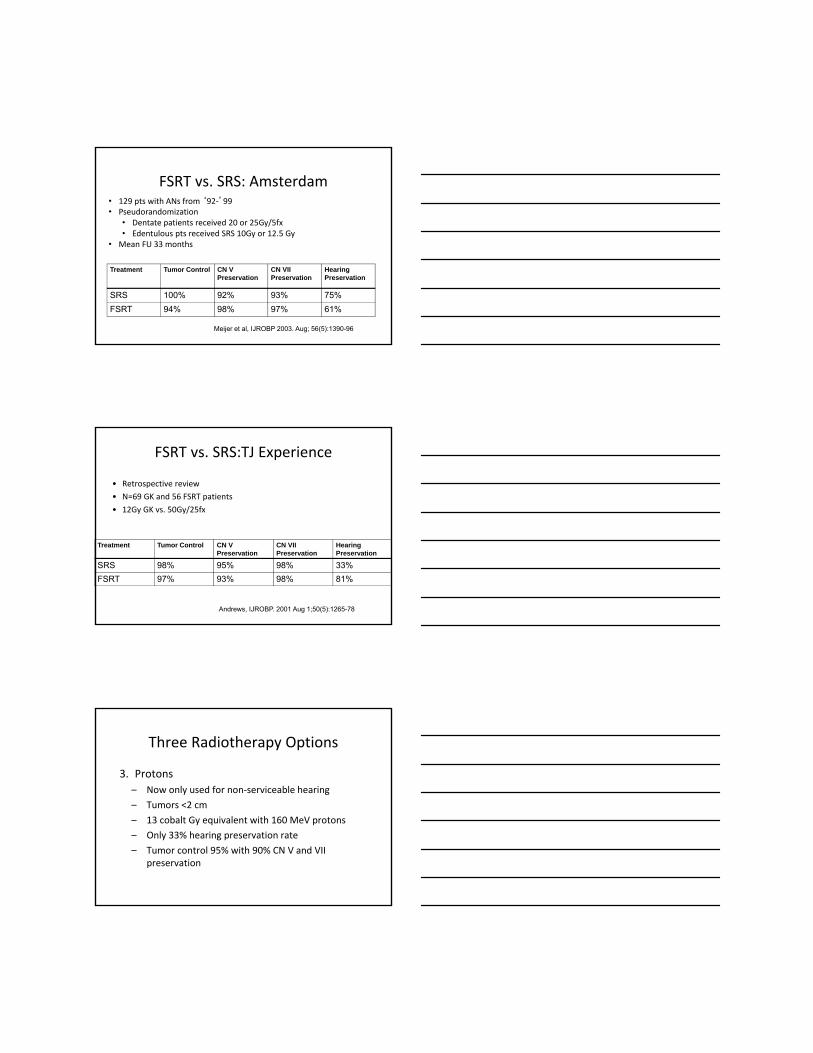
FSRT vs. SRS: Amsterdam
Treatment Tumor Control CN V Preservation
CN VII Preservation
Hearing Preservation
SRS 100% 92% 93% 75%FSRT 94% 98% 97% 61%
Meijer et al, IJROBP 2003. Aug; 56(5):1390-96
• 129 pts with ANs from ‘92‐’99• Pseudorandomization
• Dentate patients received 20 or 25Gy/5fx• Edentulous pts received SRS 10Gy or 12.5 Gy
• Mean FU 33 months
FSRT vs. SRS:TJ Experience
• Retrospective review• N=69 GK and 56 FSRT patients• 12Gy GK vs. 50Gy/25fx
Treatment Tumor Control CN V Preservation
CN VII Preservation
Hearing Preservation
SRS 98% 95% 98% 33%FSRT 97% 93% 98% 81%
Andrews, IJROBP. 2001 Aug 1;50(5):1265-78
Three Radiotherapy Options
3. Protons– Now only used for non‐serviceable hearing– Tumors <2 cm– 13 cobalt Gy equivalent with 160 MeV protons– Only 33% hearing preservation rate– Tumor control 95% with 90% CN V and VII
preservation

SRS
Adapted from Chan, Rogers, Anderson, Khuntia: Chapter 26 Benign Brain Tumors. Clinical Radiation Oncology. In Press 2011.
FSRT
Adapted from Chan, Rogers, Anderson, Khuntia: Chapter 26 Benign Brain Tumors. Clinical Radiation Oncology. In Press 2011.
Surgery vs SRS and FSRT
Adapted from Chan, Rogers, Anderson, Khuntia: Chapter 26 Benign Brain Tumors. Clinical Radiation Oncology. In Press 2011.

Treatment Algorithm
Adapted from Chan, Rogers, Anderson, Khuntia: Chapter 26 Benign Brain Tumors. Clinical Radiation Oncology. In Press 2011.
NF‐2: A Special Situation
Asthagiri, AR et al. Lancet 2009
NF‐2
• Autosomal dominant multiple neoplasia syndrome• Results from mutations on NF2 tumor suppressor gene on chromosome 22q
• 1 in 25,000• Schwannomas, meningiomas, ependymomas, astrocytomas, and neurofibromas

Management of the NF2 Patient
• Image entire cranial spinal axis• More aggressive course• Worse functional outcome
– *81% LC with SRS, but only 48% hearing preservation rate at 5 years
– Recommend limiting treatment to large symptomatic tumors
*Mathieu et al. Neurosurgery 2007. 60(3):p460‐468
Is Bevacizumab a Game Changer?
Background
• VEGF is a critical mediator of tumor angiogenesis and vessel permeability– Detected in schwannoma and increased levels of these factors correlate with increased growth rate
– Increased levels of VEGF and VEGFR‐1 correlated with increased tumor growth rate
– RR of 10 consecutive patients with NF‐2 associated VS treated with bevacizumab
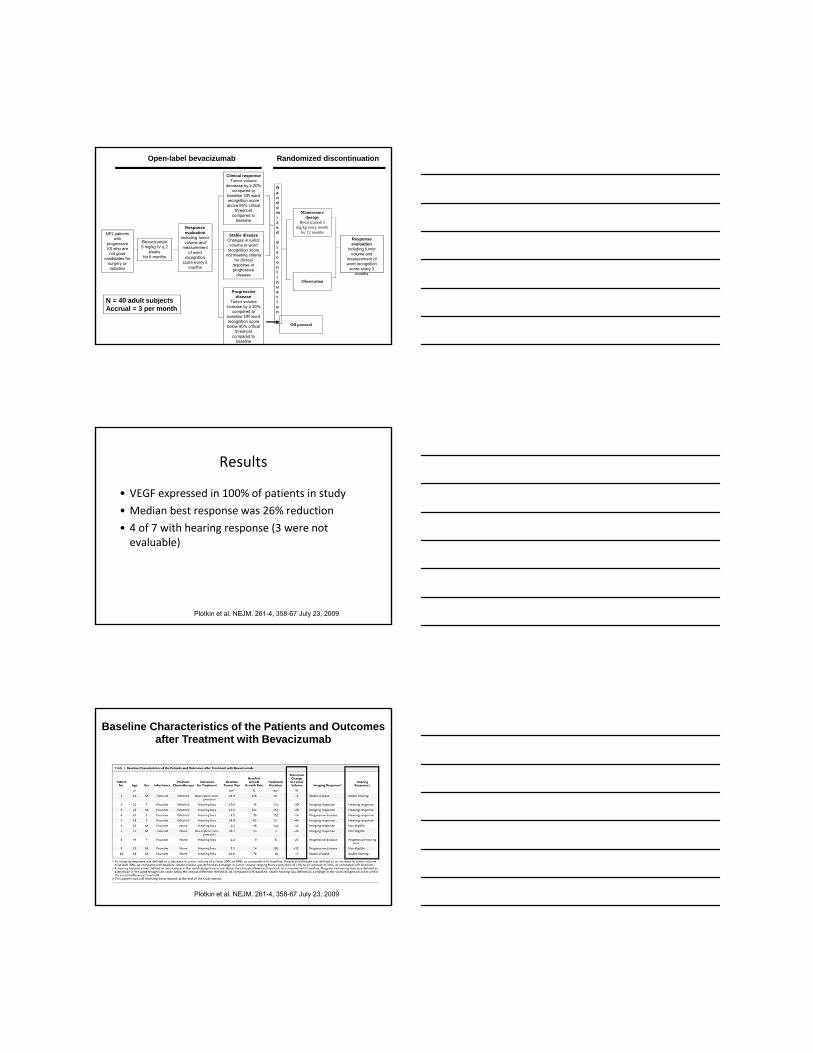
NF2 patients with
progressive VS who are
not good candidates for
surgery or radiation
Bevacizumab5 mg/kg IV q 2
weeks for 6 months
Response evaluation
including tumor volume and
measurement of word
recognition score every 3
months
Clinical responseTumor volume
decrease by ≥ 20% compared to
baseline OR word recognition score above 95% critical
threshold compared to
baseline
Stable diseaseChanges in tumor volume or word
recognition score not meeting criteria
for clinical response or progressive
disease
Progressive disease
Tumor volume increase by ≥ 20%
compared to baseline OR word recognition score below 95% critical
threshold compared to
baseline
Randomized
discontinuation
Maintenance therapy
Bevacizumab 5 mg/kg every month
for 12 months
Observation
Off protocol
Response evaluation
including tumor volume and
measurement of word recognition
score every 3 months
Open-label bevacizumab Randomized discontinuation
N = 40 adult subjectsAccrual = 3 per month
Results
• VEGF expressed in 100% of patients in study• Median best response was 26% reduction• 4 of 7 with hearing response (3 were not evaluable)
Plotkin et al. NEJM. 261-4, 358-67 July 23, 2009
Baseline Characteristics of the Patients and Outcomes after Treatment with Bevacizumab
Plotkin et al. NEJM. 261-4, 358-67 July 23, 2009

Best Radiographic Response to Bevacizumab
* * * * *
Six of ten patients experienced radiographic responses; four of sixremain smaller at 11-16 months
Cha
nge
from
bas
elin
e (%
)
*Plotkin et al. NEJM. 261-4, 358-67 July 23, 2009
RTOG 1011: rationale
• Designed to confirm the clinical response rate of bevacizumab in a larger cohort of NF2 patients treated at multiple centers (open‐label phase)
• Exploratory aim is to determine the durability of clinical response (randomized discontinuation phase)
Meningiomas

Epidemiology
• Second commonest primary brain tumor– ~30% of all primary intracranial tumors
• Incidence is about 6/100K• Incidence increases with age• May be higher based on autopsy series (up to 2%)
• 90% benign
Risk Factors
• Female• NF2 (1/2 will have meningiomas)• Increased risk with breast cancer• Prior radiation (tinea capitus, acne, WWII survivors, XRT)– Higher doses higher incidence and shorter latency
• Prior meningioma
Presentation• Seizures (most common, 30‐40%)• Increased ICP symptoms (HA, N/V, etc)• Neurologic deficits (CN deficits, hearing loss from
CPA meningiomas, mental status changes, weakness)

Growth Factors, Receptors, and Women
• May increase during pregnancy• Increased in women who use hormones• Express progesterone, androgen, and estrogen alpha and beta receptors
• Associated with lymphangioleiomyomatosis (LAM)• Express peptide growth factors like insulin‐like growth factors I and II, PDFG, VEGF, and EGF
Prognostic Factors
• Grade• Extent of surgery• Brain involvement• Large tumor volume• Recurrence• MIB‐1 index (controversial)
Pathology• Benign
– Less than 4 mitoses per high powered field
• Atypical– 4 or more mitoses per hpf plus 3 of the following: increased cellularity, small cells with high nuclear:cytoplasm ratio, prominent nucleoli, uninterrupted patternless or sheet‐like growth, or foci of necrosis
• Anaplastic– Similar to atypical, but to a higher degree
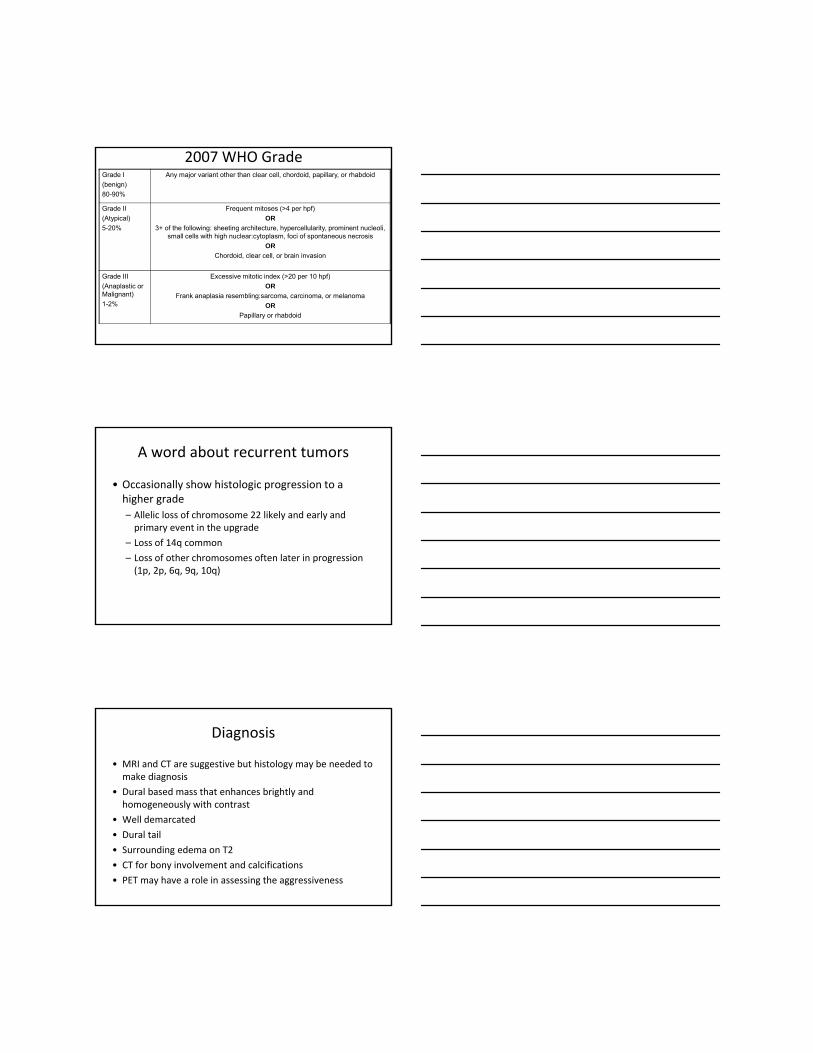
2007 WHO GradeGrade I(benign)80-90%
Any major variant other than clear cell, chordoid, papillary, or rhabdoid
Grade II(Atypical)5-20%
Frequent mitoses (>4 per hpf) OR
3+ of the following: sheeting architecture, hypercellularity, prominent nucleoli, small cells with high nuclear:cytoplasm, foci of spontaneous necrosis
ORChordoid, clear cell, or brain invasion
Grade III(Anaplastic or Malignant)1-2%
Excessive mitotic index (>20 per 10 hpf)OR
Frank anaplasia resembling:sarcoma, carcinoma, or melanomaOR
Papillary or rhabdoid
A word about recurrent tumors
• Occasionally show histologic progression to a higher grade– Allelic loss of chromosome 22 likely and early and primary event in the upgrade
– Loss of 14q common– Loss of other chromosomes often later in progression (1p, 2p, 6q, 9q, 10q)
Diagnosis
• MRI and CT are suggestive but histology may be needed to make diagnosis
• Dural based mass that enhances brightly and homogeneously with contrast
• Well demarcated• Dural tail• Surrounding edema on T2• CT for bony involvement and calcifications• PET may have a role in assessing the aggressiveness
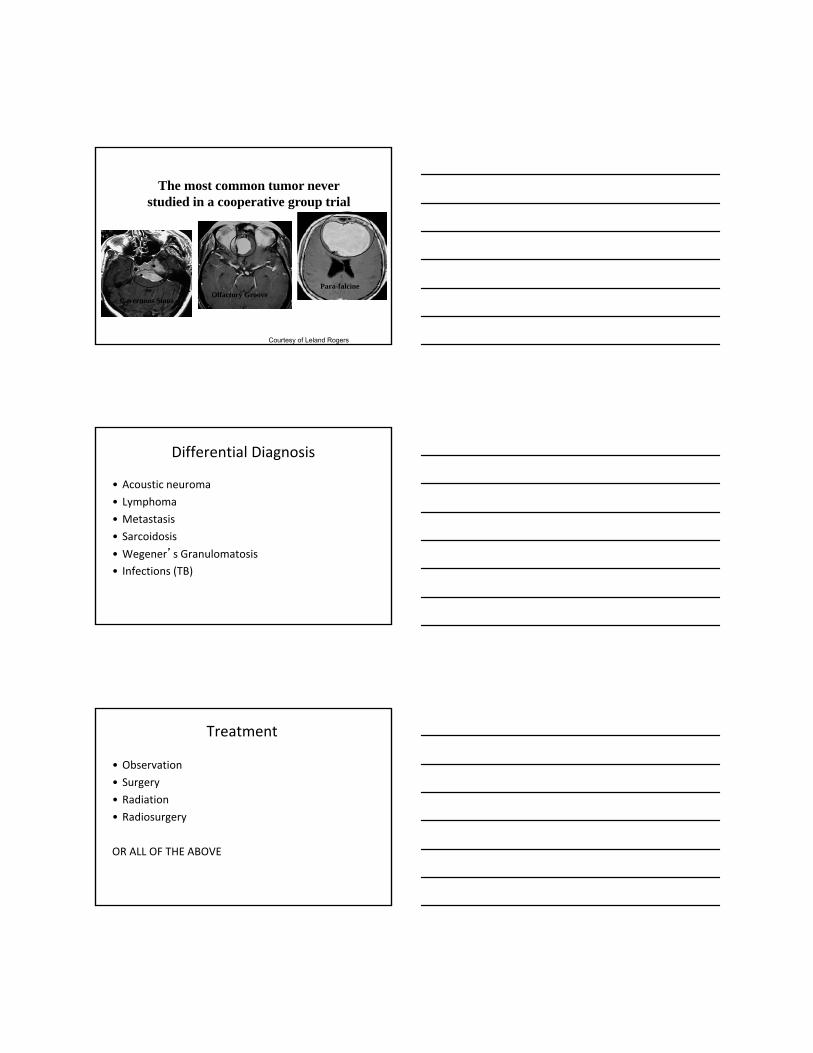
Para-falcine
The most common tumor neverstudied in a cooperative group trial
Cavernous SinusOlfactory Groove
Courtesy of Leland Rogers
Differential Diagnosis
• Acoustic neuroma• Lymphoma• Metastasis• Sarcoidosis• Wegener’s Granulomatosis• Infections (TB)
Treatment
• Observation• Surgery• Radiation• Radiosurgery
OR ALL OF THE ABOVE

Observation• Asymptomatic• Slower growth
– Calcifications– Homogeneous enhancement– Iso to hypo‐intense adjacent T2 signal
• Benign
Nakamura et al, Neurosurgery. 53:62-71, 2003McDermott et al, Brain Cancer, p333-364, 2002Yano S et al, J Neurosurg. 105(4)538-43, 2006
Observation
• Retrospective review of 1,434 patients from 1989‐2004
• 603 had asymptomatic lesions• Size, growth over time, appearance of symptoms• 58% of the asymptomatic lesions were observed
– Progression noted in 37%, but symptomatic progression in only 16%
Yano S et al, J Neurosurg. 105(4)538-43, 2006
Surgery
• Gross total resection if medically operable• GTR generally thought to give 90% RFS, but depends on Simpson Grade
• Recommended for younger patients with surgically accessible lesions
• IN GENERAL, convexity lesions are managed with surgery, while base of skull lesions and optic nerve sheath meningiomas are generally not

Simpson GradeGrade 5 year recurrence
rateI Removal of tumor bulk, surrounding
dura, involved bone10%
II Removal of tumor with diathermy of involved dura
20%
III Small focus left in situ 30%
IV Macrosocopic residual disease 40%
V Simple decompression
MeningiomaRECURRENCE after GTR alone
Author n (GTR) Local Recurrence
Mirimanoff (MGH)Stafford (Mayo)Condra (U Florida)
Total:
145465175785
5-year7%12%7%
7-12%
10-year20%25%20%
20-25%
15-year32%
-24%
24-32%
Mirimanoff et al, Neurosurg 62:18, 1985Stafford et al, Mayo Clin Proc 73:936, 1998Condra et al, IJROBP 39:427, 1997
*
Author Local Progression
Wara (UCSF)Condra (U Florida)Mirimanoff (MGH)Stafford (Mayo)*
5-year47%47%37%39%
10-year63%60%55%61%
15-year-
70%91%
-
20-year75%
---
Wara et al, Am J Roentgenol Ther Nucl Med 123:453, 1975Stafford et al, Mayo Clin Proc 73:936, 1998Condra et al, IJROBP 39:427, 1997Mirimanoff et al, J Neurosurg 1985; 62: 18-24
MeningiomaPROGRESSION after STR alone
*581 pts 1978 -1988 (116 STR)Only 10 had post-op RT
TOTAL: 37-47% 55-63% 70-91% 75%*

Aghi et al. Neruosurgery 64(1):56‐60, January 2009
• RR of 108 atypical meningiomas after GTR from ‘93 to ‘04
• 28% recurred after GTR; 8 pts had adjuvant RT and none of these 8 had a recurrence
• RPA showed that men with mitoses and prominent nucleoli had a 70% chance of recurrence
• 10 of the 30 patients that recurred had recurrence related mortality
Recurrence Rate after GTR +/‐ XRT
5 yr PFS after EBRT
Rogers L. Radiation Therapy for Intracranial Meningiomas. 2010
Radiation
• Indications– Subtotal resection– Unresectable tumor– High grade– Recurrent

Radiation
• Grade 1– 50.4 to 54 Gy at 1.8 to 2 Gy fractions (1‐2 cm margin)
• Grade 2– 54 to 59.4 Gy at 1.8 to 2 Gy fractions (2‐3 cm margin)
• Grade 3– 59.4 to 60 Gy at 1.8 to 2 Gy fractions (2‐3 cm margin)
Radiation‐Optic Nerve Sheath Meningioma
• 1‐2% of total • Surgery with high morbidity• 40‐54Gy with 1.6 to 1.8 Gy fractions used. • Stabilization or improvement of visual acuity in up to 90% with local control >90%
Turbin et al. Ophthalmology. 109:890-899, 2002
Radiosurgery
• Excellent outcomes with SRS for patients with – Tumors <35 mm– <15cc volume (<7.5 cc even better)
• No randomized data comparing SRS with surgery, but for small lesions, the results appear to be similar
Pollock, Stafford et al. IJROBP 2003; 55: 1000 - 1005Kondziolka et al. Neurosurgery 1998; 43: 405 - 414

SRS and EBRT by Grade
Adapted from Chan, Rogers, Anderson, Khuntia: Chapter 26 Benign Brain Tumors. Clinical Radiation Oncology. In Press 2011.
Treatment Algorithm
Adapted from Chan, Rogers, Anderson, Khuntia: Chapter 26 Benign Brain Tumors. Clinical Radiation Oncology. In Press 2011.
Systemic therapy for recurrent disease
• Limited data– Mifepristone—progesterone and glucocorticoid receptor antagonist
– Hydroxyurea—induces apoptosis and inhibits cell growth in culture
– Interferon alpha 2b—inhibits growth of meningioma cells exposed to mitotic stimuli
Schrell et al. J Neurosurg. 86(5): 845-52. May 1997Kiode. J Reprod Med. 43(7): 551-60. Jul 1998Chamberlain et al. Cancer. 113(8):2146-51. Oct 2008

On Going Trials
• EORTC 26021‐22021– Phase III randomized study of adjuvant conventional fractionated radiotherapy or radiosurgery versus observation only in patients with newly diagnosed, incompletely resected, benign intracranial grade 1 meningioma• PI John Wolbers (N=478)
• RTOG – 0539 (activated June 2009)– Phase II study of observation for low‐risk meningiomas and of radiotherapy for intermediate and high risk meningiomas• PI Leland Rogers
RTOG - 0539 SchemaGroup 1 (Low Risk): New Grade 1, GTR or STR
Group 2 (Interm Risk): Recurrent Grade 1, GTR or STRNew Grade 2, GTR
Group 3 (High Risk): Any Grade 3Recurrent Grade 2New Grade 2, STR
N=165
3D CRT or IMRT 54 Gy / 30 fxs Strata
ObservationGroup 1
Group 2
Group 3 IMRT 60 Gy / 30 fxs
Opened June 19, 2009Required Sample Size: 165
55 for each Group
Group 1 closed to accrual on Sept 29, 2010
RTOG 0539 ObjectivesPrimary: 3-year progression-free survival
Secondary:• Histopathologic concordance, parent vs central
- diagnosis, grade, subtype
• Incidence of grade 2+ acute and late adverse events- Groups II and III, who receive RT, analyzed separately
• Histopathologic correlates of progression-free survival- light microscopy, immunohistochemical, and microarray
• MRI Imaging correlates via central imaging review- at diagnosis, at any failure, and at 3-yrs
• Molecular correlative studies- FISH: 1p, 14q, p16 region (CDKN2A) on 9p21- IHC: MIB-1, PR, NDRG2- Serum: HGF/SF, EGF, IGF VEGF- Urine: VEGF MMP levels and dynamic trend
• Adherence to protocol-specific target and normaltissue IMRT parameters
• Overall survival at 3-years

Thank You