educating students with disabilities in california kristin w… · tom torlakson state...
TRANSCRIPT

TOM TORLAKSONState Superintendent of Public Instruction
Educating Students with Disabilities in California
Moving the Needle: Improving Outcomes for
Students with Autismin California
Kristin Wright, DirectorSpecial Education Division
California Department of EducationCalifornia Autism Professional Training and
Information Network (CAPTAIN) Annual Summit January 23, 2018

TOM TORLAKSONState Superintendent of Public Instruction
“Each child is a unique person, with unique needs, and the purpose of the education system of this state is to enable each child to develop all of his or her own potential.”California Education Code, Section 33080,Purpose of the Educational System
California’s “Why” in theEducation Code

TOM TORLAKSONState Superintendent of Public Instruction
• Protects the rights of children with disabilities
• Ensuring students with disabilities have access to a free and appropriate public education (FAPE) in the least restrictive environment.
• Ensuring schools must teach students with disabilities in a general education classroom whenever possible.
• Gives parents a voice in their child’s education
• Procedural Safeguards ensure parents specific rights and protections
Federal Backdrop:Individuals with Disabilities
Education Act (IDEA)

TOM TORLAKSONState Superintendent of Public Instruction The need for one unified, coherent
system of education supporting all students
The need for all educators to be prepared to work effectively with allstudents
Statewide commitment to serve allstudents and recognize all students are general education students first
Special Education Taskforce Recommendations

TOM TORLAKSONState Superintendent of Public Instruction
California Students with Individualized Education Programs by
Primary Disability Category
Disability Number of Students PercentageSpecific Learning Disability (SLD) 293,231 38.87Speech or Language Impairment (SLI) 160,024 21.21Autism (AUT) 104,573 13.86Other Health Impairment (OHI) 90,195 11.96Intellectual Disability (ID) 43,978 5.83Emotional Disturbance (ED) 24,560 3.26Orthopedic Impairment (OI) 11,153 1.48Hard of Hearing (HH) 10,528 1.4Multiple Disability (MD) 6,887 0.91Visual Impairment (VI) 3,565 0.47Deafness (DEAF) 3,346 0.44Traumatic Brain Injury (TBI) 1,689 0.22Established Medical Disability (EMD) 497 0.07Deaf Blindness (DB) 111 0.01
Students with Disabilities Total Population forAges 0 to 22: 754,337Source: California Special Education Management Information System (CASEMIS) December 2016

TOM TORLAKSONState Superintendent of Public Instruction
Snapshot: Who are our students with disabilities (SWD) in California?
Of the more than 754,337 SWD ages 0 to 22
• Nearly half (49 percent) are between the ages of 6to 12
• Boys comprise 68 percent
• English Learners comprise 29 percent
• Top 3 primary disability categories:
Specific Learning Disability (38.87 percent)
Speech and Language (21.21 percent)
Autism (13.86 percent)

TOM TORLAKSONState Superintendent of Public Instruction
California Department of EducationSpecial Education Division
Special Education Enrollment by Autism asPrimary or Secondary Disability
December 2010 Reporting Cycle: 69,022December 2011 Reporting Cycle: 75,507December 2012 Reporting Cycle: 82,855December 2013 Reporting Cycle: 89,509December 2014 Reporting Cycle: 96,036December 2015 Reporting Cycle: 102,784
December 2016110,486 Students
14.65 Percent of Total Special Education PopulationStudents with DisabilitiesTotal Population for Ages 0 to 22: 754,337Source: CASEMIS December 2016

TOM TORLAKSONState Superintendent of Public Instruction
0
20,000
40,000
60,000
80,000
100,000
120,000
2010 2011 2012 2013 2014 2015 2016
Prevalence of Autism Spectrum Disorderin California Schools
Total Students with Autism as Primary or Secondary Disability for Ages 0 to 22: 110,486Source: CASEMIS December 2016

TOM TORLAKSONState Superintendent of Public Instruction
California Students with Disabilitiesby Age
Ages 0 to 512%
Ages 13 to 1837%
Ages 19 to 222%
Ages 6 to 1249%
Students with Disabilities Total Population for Ages 0 to 22: 754,337Source: CASEMIS December 2016

TOM TORLAKSONState Superintendent of Public Instruction
Ages 0 to 518%
Ages 6 to 1248%
Ages 13 to 1830%
Ages 19 to 224%
California Students with Autismby Age
Total Students with Autism as Primary or Secondary Disability for Ages 0 to 22: 110,486Source: CASEMIS December 2016

TOM TORLAKSONState Superintendent of Public Instruction
California Students with Disabilitiesby Gender
32%Female
68%Male
Students with Disabilities Total Population for Ages 0 to 22: 754,337Source: CASEMIS December 2016

TOM TORLAKSONState Superintendent of Public Instruction
Female17%
Male83%
California Students with Autismby Gender
Total Students with Autism as Primary or Secondary Disability for Ages 0 to 22: 110,486Source: CASEMIS December 2016

TOM TORLAKSONState Superintendent of Public Instruction
California Students with Disabilitiesby Race/Ethnicity
1%
6%
8%
56%
4%
0.38%
25%
American Indian orAlaska NativeAsian
Black or AfricanAmericanHispanic/Latino
Two or More Races
Native Hawaiian orOther Pacific IslanderWhite
Students with Disabilities Total Population for Ages 0 to 22: 754,337Source: CASEMIS December 2016

TOM TORLAKSONState Superintendent of Public Instruction
California Students with Autismby Race/Ethnicity
1%
14%
7%
44%5%
0.37%
29%
American Indian orAlaska NativeAsian
Black or AfricanAmericanHispanic/Latino
Two or More races
Native Hawaiian orOther Pacific IslanderWhite
Total Students with Autism as Primary or Secondary Disability for Ages 0 to 22: 110,486Source: CASEMIS December 2016
TOM TORLAKSONState Superintendent of Public Instruction
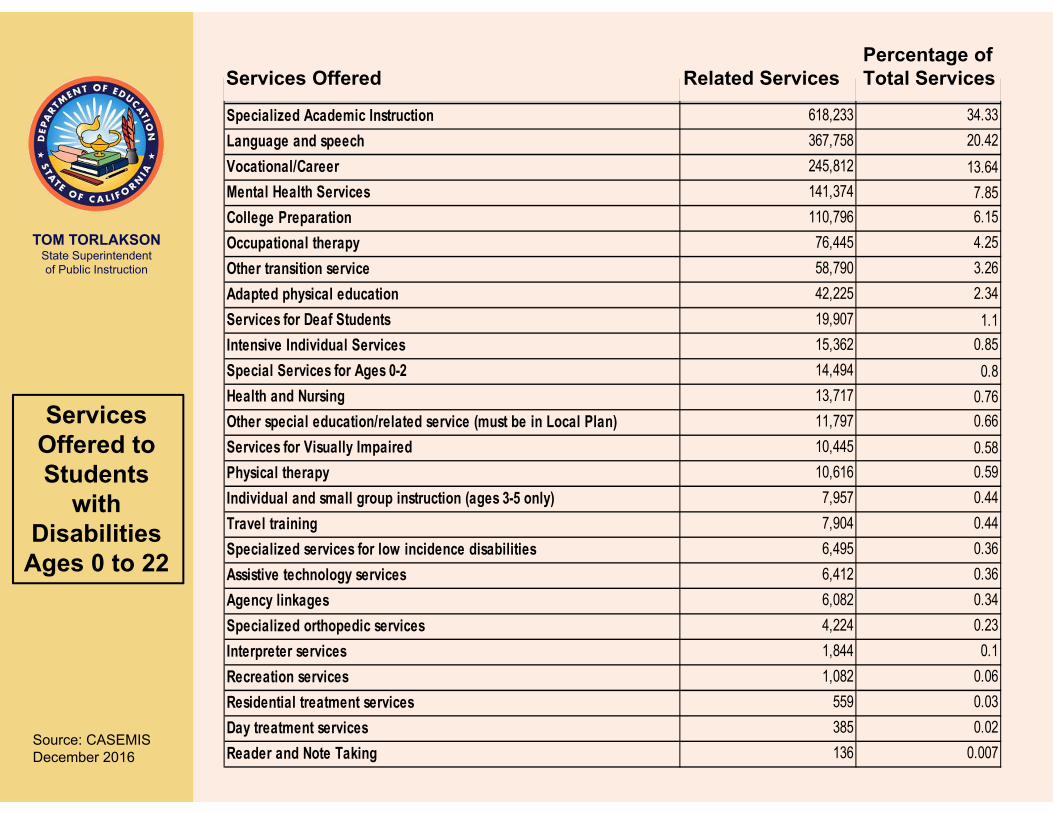
gSpecialized Academic Instruction 618,233 34.33Language and speech 367,758 20.42Vocational/Career 245,812 13.64Mental Health Services 141,374 7.85College Preparation 110,796 6.15Occupational therapy 76,445 4.25Other transition service 58,790 3.26Adapted physical education 42,225 2.34Services for Deaf Students 19,907 1.1Intensive Individual Services 15,362 0.85Special Services for Ages 0-2 14,494 0.8Health and Nursing 13,717 0.76Other special education/related service (must be in Local Plan) 11,797 0.66Services for Visually Impaired 10,445 0.58Physical therapy 10,616 0.59Individual and small group instruction (ages 3-5 only) 7,957 0.44Travel training 7,904 0.44Specialized services for low incidence disabilities 6,495 0.36Assistive technology services 6,412 0.36Agency linkages 6,082 0.34Specialized orthopedic services 4,224 0.23Interpreter services 1,844 0.1Recreation services 1,082 0.06Residential treatment services 559 0.03Day treatment services 385 0.02Reader and Note Taking 136 0.007
Percentage ofServices Offered Related Services Total Services
Services Offered to Students
with Disabilities
Ages 0 to 22
Source: CASEMISDecember 2016

TOM TORLAKSONState Superintendent of Public Instruction
Services Offered toStudents
with Autismas Primary
or Secondary Disability
Total Students with Autism as Primary or Secondary Disability for Ages 0 to 22: 110,486Source: CASEMISDecember 2016
Related ServiceServices Offered
Percent ofTotal Services
Specialized Academic Instruction 104,207 29.87Language and Speech 85,676 24.56Mental Health Services 34,963 10.02Occupational Therapy 33,188 9.51Vocational/Career 32,044 9.19Adapted Physical Education 14,430 4.14College Awareness/Preparation 10,837 3.11Other Transition Service 9,595 2.75Intensive Individual Services 7,357 2.11Other Special Education/Related Service (must be in Local Plan) 3,315 0.95Travel training 2,647 0.76Individual and Small Group Instruction (ages 3 to 5 only) 2,417 0.69Health and Nursing 1,821 0.52Assistive Technology Services 1,750 0.50Agency Linkages 1,379 0.40Physical Therapy 917 0.26Recreation Services 548 0.16Services for Students who are Deaf 502 0.14Special Services for Ages 0 to 2 494 0.14Services for Visually Impaired 442 0.13Specialized Services for Low Incidence Disabilities 140 0.04Residential Treatment Services 65 0.02Specialized Orthopedic Services 53 0.02Interpreter Services 39 0.01Day Treatment Services 33 0.01Reader and Note Taking 3 0.00

TOM TORLAKSONState Superintendent of Public Instruction
Educational Placement ofCalifornia Students with Disabilities
School Type Number of Students PercentagePublic Day School 643,632 85.32Charter School (Operated by a LEA) 29,008 3.85Charter School (Operated as a LEA) 22,078 2.93Nonpublic Day School 11,489 1.52Special Education Center or Facility 8,793 1.17Continuation School 5,714 0.76No School 5,655 0.75Other Public School or Facility 5,013 0.66Private Day School 2,942 0.39Child Development or Child Care Facility 2,901 0.38Community School 2,163 0.29Home Instruction 2,144 0.28Parochial School 1,858 0.25Adult Education Program 1,696 0.22Independent Study 1,575 0.21Head Start Program 1,522 0.2State Preschool Program 1,469 0.19Juvenile Court School 1,383 0.18Private Preschool 657 0.09Nonpublic Residential School 675 0.09Alternative Work Education Center/Work Study Program 613 0.08Extended Day Care 355 0.05Hospital Facility 272 0.04Correctional Institution or Incarceration Facility 192 0.03Community College 210 0.03Public Residential School 183 0.02Nonpublic 128 0.02Private Residential School 17 0
Students with Disabilities Population for Ages 0 to 22: 754,337Source: CASEMIS December 2016

TOM TORLAKSONState Superintendent of Public Instruction
Educational Placement ofCalifornia Students with Autism
School Type Number of Students PercentagePublic Day School 93,467 84.60Nonpublic Day School 4,803 4.35Charter School (Operated by a LEA/District/COE) 3,233 2.93Charter School (Operated as a LEA/District) 2,451 2.22Special Education Center or Facility 2,267 2.05Child Development or Child Care Facility 737 0.67Other Public School or Facility 703 0.64
Private Day School (not certified by Special Education Division) 421 0.38
Adult Education Program 393 0.36No School 345 0.31Continuation School 227 0.21State Preschool Program 227 0.21Parochial School 196 0.18Home Instruction 164 0.15
Alternative Work Education Center/Work Study Program 161 0.15
Head Start Program 146 0.13Nonpublic 104 0.09Private Preschool 99 0.09Independent Study 97 0.09Nonpublic Residential School 87 0.08Community College 59 0.05Community School 31 0.03Hospital Facility 22 0.02Extended Day Care 20 0.02Juvenile Court School 12 0.01Public Residential School 10 0.01Private Residential School 4 0.00
Total Students with Autism as Primary or Secondary Disability for Ages 0 to 22: 110,486Source: CASEMIS December 2016

TOM TORLAKSONState Superintendent of Public Instruction
12%
88%
Socioeconomically Disadvantaged
16%
84%
English Learners
25%
75%
Foster Youth
Source CALPADS data 2016–17 Total Student Population = 6,228,235
11%
89%
All Students
Students with Disabilities Represented in Local Control Funding Formula (LCFF) Subgroups Compared to
Students without Disabilities

TOM TORLAKSONState Superintendent of Public Instruction
Percent of Students with Disabilitiesin One or More of the LCFF Subgroups
69.50%
30.50%
0.00%
10.00%
20.00%
30.00%
40.00%
50.00%
60.00%
70.00%
80.00%
Students in LCFF Subgroups Students NOT in LCFF subgroups
Source: CALPADS data 2016–17 Total Student Population: 6,228,235

TOM TORLAKSONState Superintendent of Public Instruction
Local Control and Accountability Plan (LCAP): The Basics
• A tool for local educational agencies (LEAs) to set goals, plan actions, and leverage resources to meet those goals to improve student outcomes
• Is designed to provide LEAs and communities with more local control and make it easier to respond to the needs of students
• Makes LEAs more accountable to provide the necessary programs and resources to create a level playing field for all students
• Supports parent access to the LEA’s budget and planning process and allows parents to help determine local priorities and approach

TOM TORLAKSONState Superintendent of Public Instruction
LCAP: The Basics
The LCAP is measured according to eight priorities:1. Implementation of the academic content and performance
standards adopted by the State Board of Education
2. Parent involvement and participation
3. Teachers appropriately assigned and fully credentialed in the subject areas
4. Improving student achievement and outcomes along multiple measures
5. Supporting student engagement

TOM TORLAKSONState Superintendent of Public Instruction
LCAP: The Basics
The LCAP is measured according to eight priorities:6. Highlighting school climate and connectedness through a
variety of factors, such as suspension and expulsion rates and other locally identified means
7. Ensuring all students have access to classes that prepare them for college and careers, regardless of what school they attend
8. Measuring other important student outcomes related to required areas of study, including physical education and the arts

TOM TORLAKSONState Superintendent of Public Instruction
How Do We Advance the Needle?
• Understand how students with disabilities and autism spectrum disorder (ASD) are being represented within the LCAP so that implementation can be aligned with broader initiative(s)
• Know where you are aiming. What is the baseline data for students with ASD?
• Strategically conduct staff development and implement coaching of evidence-based practices to target those specific students and needs that can improve outcomes
• Weave training of ASD evidence-based practices into the broader initiative(s)

TOM TORLAKSONState Superintendent of Public Instruction
California Students with Autism byLeast Restrictive Environment
Total Students with Autism as Primary or Secondary Disability for Ages 0 to 22: 110,486Source: CASEMIS December 2016
Correctional Facilities0.01% Homebound/Hospital
0.18%
Parentally Placed in Private Schools
0.45%
Inside Regular Class Less than 40% of the Day
46.83%
Inside Regular Class 40% to
79% of the Day15.63%
Inside Regular Class 80% or
More of the Day30.11%
Residential Facility0.07% Separate
School6.72%

TOM TORLAKSONState Superintendent of Public Instruction
Reading Achievement Levels forStudents with Autism
Standard Not Met56%
Standard Nearly Met24%
Standard Met14%
Standard Exceeded
5%
No Score1%
Students with Autism as Primary DisabilityAssessments: Smarter English Language Arts (ELA), CAA ELA, CALPADS, CAASPP 2016 P3 (FY 2015–2016)Standard and Alternative Assessment

TOM TORLAKSONState Superintendent of Public Instruction
Math Achievement Levels forStudents with Autism
Standard Not Met63%
Standard Nearly Met20%
Standard Met9%
Standard Exceeded
7%
No Score1%
Students with Autism as Primary DisabilityAssessments: Smarter Mathematics, CAA MathematicsCALPADS, CAASPP 2016 P3 (FY 2015-–2016)Standard and Alternative Assessment

TOM TORLAKSONState Superintendent of Public Instruction
Suspensions and Expulsionsfor Students with Disabilities
Autism (Primary and Secondary)
6%
Other Disabilities
94%
Students with Disability in Table C (Disciplinary) for Ages 0 to 22: 109,773 incidentsSource: California Longitudinal Pupil Achievement Data System (CALPADS) 2016–17 and CASEMIS June 2017

TOM TORLAKSONState Superintendent of Public Instruction
Outcomes for Students with Autism
No Higher Education and No
Employment20%
Enrolled in Higher Education
53%
Competitively Employed
10%
Post Secondary Education or
Training16%
Other Employment1%
Total Students with Autism as Primary or Secondary DisabilitySource: CASEMIS June 2017, Table DStudents that exit from prior years
TOM TORLAKSONState Superintendent of Public Instruction
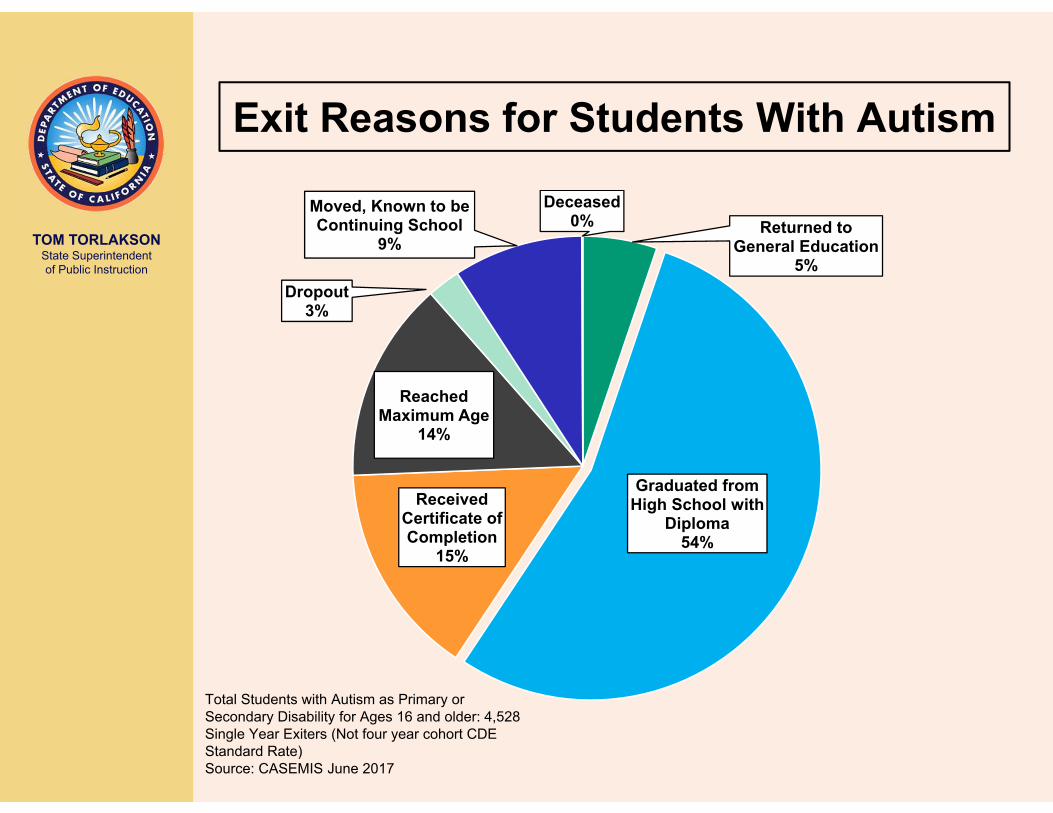
Exit Reasons for Students With Autism
Returned to General Education
5%
Graduated from High School with
Diploma54%
Received Certificate of Completion
15%
Reached Maximum Age
14%
Dropout3%
Moved, Known to be Continuing School
9%
Deceased0%
Total Students with Autism as Primary or Secondary Disability for Ages 16 and older: 4,528Single Year Exiters (Not four year cohort CDE Standard Rate)Source: CASEMIS June 2017

TOM TORLAKSONState Superintendent of Public Instruction
California’s Ultimate Goal

TOM TORLAKSONState Superintendent of Public Instruction
What about Mapping to…..

TOM TORLAKSONState Superintendent of Public Instruction
Why Map to Work?
• Mapping to an employment goal establishes and supports the belief that each California student has potential and value
• Provides tangible skills and outcomes
• Encourages partnership and vision with multiple state and local agencies which collectively support individuals with disabilities throughout their lifespan

TOM TORLAKSONState Superintendent of Public Instruction
Changing the Culture
• A public education system culture which promotes the belief everyone belongs begins with:• Ensuring children and families begin their
education experience in the most inclusive environment starting with preschool
• Ensuring children can confidently communicate what they know, need, and want
TOM TORLAKSONState Superintendent of Public Instruction
Changing the Culture
• Supporting teachers, related service providers, and administrators in schools and local educational agencies (LEAs) in utilizing the principles of Universal Design for Learning through a Multi-Tiered System of Support Framework so all children may access their learning and achieve
• Developing person-centered plans that travel across system/age transitions

TOM TORLAKSONState Superintendent of Public Instruction
How Stakeholders Can Stay Informed About Special Education in California
• Tune in to meetings of the California Advisory Commission on Special Education http://www.cde.ca.gov/sp/se/as/acse.asp
• Subscribe to The EDge Newsletter http://www.calstat.org/specialEdge.html
• Tune in to bi-monthly State Board of Education meetings http://www.cde.ca.gov/be/

TOM TORLAKSONState Superintendent of Public Instruction

TOM TORLAKSONState Superintendent of Public Instruction
Contact Information:
Kristin Wright, DirectorSpecial Education Division
California Department of Education
[email protected](916) 445-4602