educational disparity in east and west pakistan, 1947-71 ...asadullah: educational disparity in east...
TRANSCRIPT

The Bangladesh Development Studies Vol. XXXIII, September 2010, No.3
Educational Disparity in East and West
Pakistan, 1947-71: Was East Pakistan
Discriminated Against?
MOHAMMAD NIAZ ASADULLAH*
This paper documents the regional divide in educational facilities between East Pakistan (now Bangladesh) and West Pakistan between 1947 and 1971. During this period, the total number of primary schools in East Pakistan declined, leading to overcrowding of existing schools and classrooms. On the other hand, despite being endowed with fewer schools, West Pakistan surpassed East Pakistan in the total number of primary schools, and in teacher-student ratios. This evident educational disparity, we argue, cannot be attributed to regional differences in school age population, school types, the quality and unit cost of schooling. Rather, this problem is examined in terms of the hypothesis of “discrimination” as an alternate explanation.
I. INTRODUCTION
Pakistan emerged as an independent nation in 1947 breaking apart from India on the basis of a two-nation theory.1 The Muslim majority province of East Bengal (subsequently East Pakistan) joined Punjab, North-West Frontier Province, Sind and Baluchistan to form the undivided Pakistan.2 However, after a quarter-century of union with West Pakistan, the Eastern part of Pakistan broke away in 1971
*Department of Economics, University of Reading, UK; ESRC Centre on SKOPE, Department of Education, Oxford University; Institute for the Study of Labour (IZA), Bonn, Germany.
1I would like to thank Bob Allen, Geeta Kingdon, Avner Offer, Bettina Robotka, and an anonymous referee for their comments and suggestions. An earlier version of the paper was presented at Nuffield College (Oxford), the 17th Conference of the International Association of Historians of Asia (IAHA), Economic History Association Meeting (Nashville), and the Economic History Society (EHS) Conference 2004 (Royal Holloway, University of London). 2These latter four provinces altogether comprised West Pakistan, being separated from the East by 1100 miles of Indian territory.

The Bangladesh Development Studies
2
2
following a year long civil war. Economic maltreatment of East Bengal, it is argued, was one of the factors that led to the disintegration of Pakistan in 1971 leading to the creation of Bangladesh (Auspitz et al. 1971, Islam 1972, Rao 1972, Laporte 1975, Bhatia 1979). Discriminatory allocation of government budget across provinces arguably led to big disparities in the development of infrastructure facilities which, in turn, resulted in marked disparities in economic welfare. If true, similar inequalities would have affected the social sectors. For instance, the supply of schools might have been constrained as a consequence of tightened public budget, directly affecting educational opportunities.3 A regional divide in educational quality could also ensue. Given allegations of negative bias in economic policy towards East Bengal, a comparative study of the distribution of educational resources and outcomes during the 24 years of united Pakistan is a natural line of inquiry.
While the past literature has focused on the question of economic disparity, relatively little is known about inequalities that existed between the two regions in other spheres such as education. Earlier studies, e.g. Curle (1966), while suggestive of disparities in the distribution of educational inputs in the two wings, do not provide a detailed account of the educational facilities and their evolution during 1947-71. In addition, none of the early researchers systematically examined the causes behind such inter-regional disparity. Recent research (e.g. Khatun 1991, Ahmad 1999) on the issue provides only a snap-shot of the situation, conveniently attributing the observed disparity to discrimination” by the state. However, sources of disparity may simply lie in unaccounted differences in, say, demographic and socio-economic characteristics of the population, structure of the education sector in the comparing regions and so on. Little is known about any differences in these factors that may mirror inter-regional differences in educational facilities. To the best of our knowledge, none of the past research on regional disparity (e.g. Curle 1966, Huq 1968) or contemporary studies on education in Pakistan (e.g. Iqbal 1993, Kazi 1994, Hoodbhoy 1998) has looked into these issues in detail.
The objective of this study is to examine whether there existed systematic bias in the distribution of educational resources and facilities during 1947-1971 between East and West Pakistan. We accomplish this by quantifying the extent of inter-regional educational disparity and its evolution over time. Our analysis reveals a decline in educational facilities, both in terms of the relative and absolute availability of primary schools, in East Pakistan. Collating dis-aggregated regional
3Total school enrolment (or coverage) tends to increase with GDP level. Hence, if the rate of economic growth is smaller than that of the school age population, educational expansion is constrained by resource availability.

Asadullah: Educational Disparity in East and West Pakistan
3
3
data on school types, quality, unit cost of school, and public expenditure on education, we further describe the causes behind inter-regional differences in the education sector in Pakistan. It is argued that the decline in primary school availability in East Pakistan was largely an unintended consequence of a resource constraint that arose in the backdrop of ‘biased’ inter-provincial transfer of resources. By comparing East Pakistan with selected Indian states, we provide a crude test for the above claim in a quasi-natural experiment framework. Comparison of Bangladesh and Pakistan before and after 1971 yields a further test of the hypothesis of resource crunch, yet again mimicking a natural experiment.
The next section describes the broader political context in which resources were allocated across regions in Pakistan during 1947-71. Section III provides an overview of educational planning in the country, in addition to describing the educational profiles of East and West Pakistan. The inter-regional differences in educational facilities during the said period are discussed in section IV. Section V considers various potential explanations for inter-regional differences in education between East and West Pakistan and advances the hypothesis of resource constraint as a residual explanation. Two simple tests of this hypothesis are elaborated in section VI. Section VII is conclusion.
II. BACKGROUND: ECONOMIC POLICY MAKING IN PAKISTAN
Following its separation from India, Pakistan inherited a federal structure of governance under which subjects such as foreign affairs, defence and commerce were administered by the central government whilst matters like education and health were concerns of the respective provincial governments. In reality, however, the division of planned development activities in the public sector between the central and provincial governments did not follow the line of division of subjects between the two. Federalism did not fully operate in development affairs. Development planning relating to education, which was included in the provincial subjects, was often undertaken by both the central and provincial government. The division of development projects between the Centre and the province did not follow any definite principle. The extent and nature of central government interventions varied over time with changes in the political landscape of the country (Sadeque 1957).
Pakistan’s history during 1947-71 is characterised by two distinct political transitions. The central government of the state of Pakistan was set up in the Western wing of the state primarily because most of the Muhajirs, upper class Muslim refugees from the central Indian provinces, migrated to the western wing. The Centre was dominated by the ruling elite––Punjabi and Muhajirs––who

The Bangladesh Development Studies
4
4
controlled the bureaucratic apparatus and the armed forces. Other indigenous/ethnic groups/elites in West Pakistan––Baluchis, Pathans and Sind–had limited political presentation (Kazi 1994). The Bengalis, largely concentrated in East Pakistan, also remained vastly under-represented at the Centre.
The second political phase relates to the period 1955-1971, which is known as the “One Unit” era. Primarily to resolve the problem of political representation with East Pakistan, the Centre coerced four Pakistani ethnic nationalities/provinces to form one administrative unit: the single province of West Pakistan emerged in September 1955.4 This integration not only secured the dominance of the Punjabis and the Muhajirs over other ethnic groups within West Pakistan, it also boosted the bargaining power of the Centre vis-à-vis provincial government in the East wing. During the first three years of this period, the country remained under a civilian rule. The chief of army took over power in 1958 and ruled Pakistan until 1968. A new chief martial law administrator assumed power in 1969 whose rule came to an end with the disintegration of Pakistan in 1971. In sum, in the absence of a national election during 1947-71, political decision making process remained non-representative, largely reflecting the interest of the ruling elites. This had implications for the process of regional economic development in the country.
The period of 1947-54 witnessed several unilateral political decisions made by the Centre which frequently intervened in provincial matters. In the absence of any national plan document, economic planning during the said period remained almost entirely under the control of the central government. Although the country was ruled by civilian authorities, the incumbent government of the Muslim League remained overwhelmingly pro-Centre. The key instrument via which the Centre wielded its economic hegemony over East Pakistan throughout was the control over provincial incomes. Early in 1948, the government of Pakistan, by a special ordinance, took away from the provinces the sales tax, income tax and a bigger share of import and export duties. Consequently, the government of East Pakistan was forced to rely on land revenue and agricultural income tax, to finance education and health related projects and various administrative expenses, particularly during the pre “One Unit” era. The fiscal relationship between the Centre and the provinces caused much dissent in the Eastern wing which subsequently saw the landslide victory of the opposition political party, the United Front (UF), against the ruling Muslim League in the first general election held in March 1954 in East Bengal. The UF government pressed for the return of the sales tax and bigger shares of other federal taxes. However, the Centre dismissed the UF government in May 1954.
4Such consolidation was not required in East Pakistan which comprised of single linguistic/ethnic group.

Asadullah: Educational Disparity in East and West Pakistan
5
5
Governor's rule was imposed in the province, which lasted until June 1955 after which the country was placed under a military rule.
In contrast to the period 1947-54, economic development during the “One Unit” era was guided by three comprehensive Five-Year plans in the undivided Pakistan. The planning commission was established at the Centre and made responsible for preparing the plan documents dealing with all aspects of national development including education. The plan documents gave highest priorities to industrial development which suited the ruling class at the Centre, particularly the Muhajirs, who also comprised the industrial elites of the country.
This process of development fuelled inequality in regional income. The Western wing, which had a larger urban population (33%), was the primary beneficiary of such industrialisation. The East Pakistani economy was largely agrarian where 95% of the population resided in the rural areas. Consequently, it was left out of the development process and experienced little gains in per capita income. Although there were some initial disparities between the East and the West in 1947 (Seth 1972),5 these were allegedly no more than marginal (Sengupta 1971).6 Starting from the early 1950s, disparity of per capita incomes between East and West Pakistan had been widening, however. While per capita income in East Pakistan rose by 0.7 per cent a year, the rate of increase in West Pakistan was 2 per cent, nearly three times higher than that in East Pakistan (Rao 1972). This is evident from Table I, which summarises per capita income in Pakistan during 1947-70.
TABLE I
PER CAPITA INCOME IN EAST AND WEST PAKISTAN (1959-60 PRICES, IN
RUPEES)
1949-50 1959-60 1969-70
Pakistan 311 318 424
West Pakistan 338 366 537
East Pakistan 287 278 331
East-West gap 51 88 206
Source: Third Five Year Plan of Pakistan, p. 11, and Report of the Panel of Economists on
the Fourth Year Plan (1970-75), p. 132.
5For example, per capita income in West Pakistan was 17% higher than that of East Pakistan in 1949-50. 6This is also acknowledged in the First Five-year Plan, 1955-59.

The Bangladesh Development Studies
6
6
The two wings diverged significantly in economic outcomes over the years, arguably owing to deliberate pro-West and anti-East wing policy adopted by the central government of Pakistan (Huq 1963, GoP 1970, Falcon and Stern 1971, Mason et al, 1971).7 For instance, despite having 60% of the population, East Pakistan’s share of central government development expenditure was as low as 20% during 1950-51 to 1954-55, only to peak at 36% during the third Five Year Plan period i.e. 1965-66 to 1969-70. In addition to unequal allocation of central government funds, inequality arose in provincial budgets following the bizarre fiscal rule of the Centre. To aid the process of industrialisation in the Western wing, the central government systematically transferred visible as well as invisible resources away from the East to the West. Three particular mechanisms were adopted to facilitate such transfers. First, transfer occurred through inter-regional trade: the West wing exported to the East under a protective trade regime, at a higher than international price. Second, the East wing was allocated a smaller fraction of the total foreign aid received. Third, to support the process of industrialisation in West Pakistan, agricultural surplus (e.g. foreign exchange earned through agricultural exports by the East) was transferred to industry thereby masking the transfer of economic resources from the East to the West. In addition, a complex system of taxes the central government exacted from East Pakistan more than it injected income into it by way of expenditures (Feldman 1971). According to one estimate, the resulting transfer was worth $2.6 billion (Rahman 1968). These allegations are also supported by plan allocations for various years.
Widespread inequality caused much strife between the regions and led to popular movements in the early 1960s. Regional income inequality aside, new disparities emerged in other outcomes such as distribution of jobs in central government offices and so on (Rahman 1968). Therefore, when the Constitution of Pakistan was finally enacted in March 1962, it made binding on the government to remove inter- and intra-provincial disparities in per capita income. The first finance commission was set up, consisting of members from both wings. After this abortive commission, only sales tax was returned to the provinces. The Centre retained the largest share of income and company taxes as well as export and import duties. The allocation of foreign exchange earnings, foreign aid and above all, the total resources of the nation remained under its purview throughout. Subsequently, regional inequality in the distribution of incomes and various market opportunities
7Hasan (1998) argues that some of the observed differences are due to comparative advantage of West Pakistan over the East. But he also admits that part of the disparity in average income across the regions was a result of favourable economic policies and distribution of resources toward West Pakistan, particularly in the 1950s.

Asadullah: Educational Disparity in East and West Pakistan
7
7
persisted throughout the 1960s. It is in the context of such economic divide that we are interested to study regional distribution of educational inputs and outputs in undivided Pakistan. Before elaborating on the supply side of the education sector, however, the next section describes the educational profiles of East and West Pakistan, and the educational policies that shaped schooling outcomes during 1947-71.
III. OVERVIEW OF EDUCATION POLICIES AND SCHOOLING
OUTCOMES IN EAST AND WEST PAKISTAN
The evolution of education policy and planning in Pakistan can be traced in various national education commissions and five-yearly plan documents. Following the Pakistan Education Conference held in 1947, the policy of Universal Primary Education (UPE) was adopted in principle, and subsequently implemented by all the provinces (Huq 1954). Provincial and central governments in Pakistan sketched out a detailed plan to construct schools and recruit teachers to attract more children to schools in post-1947 years. In the first seven and half years of the “One Unit” era, resource allocation in the education sector was largely based on policies adopted by the central government. In the absence of any plan document, the educational planning was guided by the “Six-Year National Plan for Educational Development (1952).”
Educational planning in post-1955 years took a new dimension when development started on a planned basis, following various five-yearly plan documents.8 Each plan dealt with development expenditure only i.e. all expenses on construction, initiating specialised programmes, building library and other physical facilities and other resources need to launch new development. The recurrent expenses such as teacher salary and maintenance were non-developmental and borne by the respective provincial government with its own revenue resources (Curle 1966).
The overall objectives of all the plans were more or less similar. They all emphasised the importance of a wider coverage and a higher quality of education. The First Five-Year plan proposed to spend Rupees 58.1 crores as public expenditure on education. Three objectives of the plan document were: (i) improvement of educational quality at all levels, (ii) expansion of educational
8This period also benefited from the detailed reviews of the education sector and suggestions for development made by two National Education Commissions, the 1959 Sharif Commission and the 1964 Hamdur Rahman Commission. An additional commission, headed by Nur Khan, submitted its report in 1969. However, this affected educational policies only in post-1971 years and hence is irrelevant for the period under study here.

The Bangladesh Development Studies
8
8
facilities; and (iii) opening of new schools in backward areas. Recognising that only 43 per cent of the school-age children were in primary schools, the plan aimed at raising this to 60 per cent by 1960. In reality, however, no improvement in quality occurred during the plan period (Akthar 1971). Before the end of the first plan period, the National Education Committee of 1958 submitted its report. Among others, the committee proposed to achieve compulsory education for children aged 6-11 years.
The second plan similarly recognised universal literacy as the most important policy target. Compared to the earlier plan, however, it allocated five times more fund. But the gross primary enrolment rate stood at 45% by the end of the plan period. The Third Five Year Plan aimed to raise this further to 70 per cent by 1970 (GoP 1965). To achieve this target, the government planned construction of 4,000 new schools in East Pakistan against a total of 42,500 in West Pakistan.9 Nonetheless, the third plan’s achievements regarding physical as well as financial targets showed a substantial shortfall. In primary education, only 33 per cent of the target total number of primary schools was constructed. Similarly, total increase in school enrolment constituted only 55 per cent of the plan target.
Nonetheless, considerable growth in gross school enrolment rates ensued nationwide following the aforesaid expansionary education policies. Historically, East Pakistan enjoyed a higher rate of gross enrolment in primary and secondary education compared to West Pakistan. Such regional difference in the demand for schooling primarily reflected the difference in demographic composition of East and West Pakistan.10 In 1947, 60 per cent of the Pakistanis resided in the Eastern wing and, so, accounted for the majority of the school age population at the time of independence. Total population in East Pakistan grew at a higher rate in subsequent years as seen from Table II.11 The overall growth in population was mirrored by the growth in the underlying school age population. Table III compiles data on the provincial distribution of school age population i.e. children aged 5-14 years and 6-11 years. This clearly demonstrates that East Pakistan had the highest share of primary and secondary school age population.
Given this demographic difference between East and West Pakistan, it is unsurprising that primary and secondary school enrolment was higher in East than in West Pakistan. Analysis of data on West Pakistan reveals a higher growth in
9 See GoP (1965), p. 216. 10School age population is a primary demand side determinant of growth in school infrastructure. Once it reaches a stabilisation stage, growth rates in schools also converge towards zero. Any new expenditure then takes the form of recurrent expenditure. 11However, relative growth rate was higher in West Pakistan from 1960-65 onwards.

Asadullah: Educational Disparity in East and West Pakistan
9
9
gross enrolment over time. In 1948, a total of 2,021,702 children were enrolled in primary school in contrast to a mere 544,360 in the West. By 1969, total primary enrolment in East Pakistan increased to 6,564,535 thereby yielding an average of 10.7 per cent annual growth rate in primary enrolment. In contrast, total primary enrolment increased at an average annual rate of 22.9 per cent, leading to a total of 3,166,799 kids in primary school in West Pakistan by 1969. Clearly, for each year, the East had a higher total of children enrolled in school compared to the West. Consequently, the East-West gap in enrolment persisted through 1947-1971 although it narrowed somewhat due to greater relative growth in primary enrolment in West Pakistan in later years.
TABLE II
POPULATION GROWTH RATES IN EAST AND WEST PAKISTAN, 1950-75
Period EP WP
1950-1955 1.97 1.96 1955-1960 2.25 2.18 1960-1965 2.51 2.32 1965-1970 2.56 2.44 1970-1975 2.57 2.55
Source: Population Division of the Department of Economic and Social Affairs of the United Nations Secretariat, World Population Prospects: The 2002 Revision and World Urbanisation Prospects: The 2001 Revision, http://esa.un.org/unpp.
Note: Percentage figures are reported.
TABLE III
TRENDS IN TOTAL AND SCHOOL AGE POPULATION IN EAST AND WEST
PAKISTAN, 1950-75
Year Total population, in 000 School age population
Population aged 5-14, in 000 Population aged 6-11, in 000
EP WP EP WP EP WP
1950 41,783 39,659 9,603 (23) 9,078 (22.9) 5,873 (14.1) 5,513 (13.9)
1955 46,295 43,737 10,467 (22.6) 9,924 (22.7) 6,325 (13.7) 6,042 (13.8)
1960 51,785 48,767 12,696 (24.5) 11,549 (23.7) 8,000 (15.4) 7,158 (14.7)
1965 58,493 54,762 15,587 (26.6) 13,603 (24.8) 9,674 (16.5) 8,405 (15.3)
1970 66,292 61,840 18,046 (27.2) 15,605 (25.2) 11,151 (16.8) 9,601 (15.5)
1975 75,171 70,275 20,595 (27.4) 17,758 (25.3) 12,674 (16.9) 10,906 (15.5)
Note: Figures in parentheses indicate school-age population as percentage of total population. Reported figures correspond to median variant12.
12Fertility in medium-fertility countries is assumed to decline following a path derived from models of fertility decline established by the United Nations Population Division on the basis of the past experience of all countries with declining fertility during 1950-2000.

The Bangladesh Development Studies
10
10
Source: Same as in Table II.
Mere analysis of quantitative expansion of the education sector is not so informative if there remain systematic differences in educational attainment across the regions. Any comparison of gross enrolment data must be supplemented by information on dropout rate to ascertain the actual extent of school participation. As a matter of fact, accounting for the rate of retention, East Pakistan had no initial advantage in primary education. Despite greater fraction of the school age population, actual school completion was much lower in East Pakistan than the West. Table IV presents data on survival rates in primary school during 1947-50 for selected Pakistani provinces. The incidence of drop out was highest (i.e. 68.25 per cent) in East Pakistan at the time of independence and remained so in the consecutive years. On the other hand, not only was retention rate higher in West Pakistan in 1947, it was also improving further over time.
TABLE IV
ESTIMATES OF SURVIVAL RATES IN PRIMARY SCHOOL IN SELECTED
PAKISTANI PROVINCES, 1947-50
Cohort year Cohort size % retained a year later % retained two years later
East Pakistan
1947-48 1581820 32.75 20.84
1948-49 1608725 30.49 20.1
1949-50 1434077 35.14 23.25
Punjab
1947-48 103067 65.72 57.75
1948-49 115087 73.05 68.8
1949-50 126018 80.75 –
Sind
1947-48 387 38.75 26.35
1948-49 337 55.19 47.74
1949-50 278 64.74 –
NWFP
1947-48 268 39.55 35.44
1948-49 267 37.45 28.46
1949-50 205 65.36 –
Source: The above figures were estimated using data on grade and year specific total student enrolment, reported in Huq (1954), p. 148.
Regional inequality in survival rates in primary school further worsened in later
years. Only 40 per cent of the students who enrolled in grade 1 survived to grade
two in East Pakistan during the 1960s (Curle 1966) while 20 per cent survived up to

Asadullah: Educational Disparity in East and West Pakistan
11
11
grade V (GoP 1965). On the other hand, as much as 38%-50% were retained in
grade five in West Pakistan (GoP 1966b).13 This meant that despite a smaller
enrolment rate in primary education, the West had a larger population of students in
grade five. In sum, primary schools in the East had much higher dropout rate so that
comparison of gross primary enrolment data vastly overstates the true extent of
school participation and attainment relative to West Pakistan. Since primary
education is an input to post-primary education, it is unsurprising to find similar
inequalities in secondary and higher education. Participation at higher levels of
education in East Pakistan was dismal. Table V provides data on total number of
graduates in the two wings. During this period, East Pakistan experienced a decline
in the number of graduates and post-graduates. The Western unit, on the other hand,
not only had a head-start in terms of total number of graduates and post-graduates, it
registered 21.3% and 68.6% growth in these numbers respectively.
TABLE V
NUMBER OF GRADUATES AND POST-GRADUATES IN PAKISTAN, 1951-1961
Graduates Post-graduates
1951 1961 Change 1951 1961 Change
Pakistan 86,000 82,000 -4.6 23,000 31,000 39.6
East Pakistan 41,000 28,000 -32.3 8,000 7,000 -12.0
West Pakistan 45,000 54,000 21.3 14,000 24,000 68.6
Source: Adapted from Akther (1963).
The regional difference in school enrolment rates in the united Pakistan was
matched by a similar difference in gains in literacy rate. The poor state of primary
and post-primary education in East Pakistan is consistent with the overall pattern of
literacy. Whilst it had a larger number of literate population, this did not grow much
over the years. This is evident from Table V. Data shows greater improvement in
literacy levels in West Pakistan. Whilst East Pakistan retained its edge at the end of
the second census, the gain in the total number of literate population was only 1.1
percentage points during the intercensal period, compared to 6.8 percentage points
in West Pakistan.
13This is consistent with higher incidence of child labour in East Pakistan. According to the
Census 1961, 38.2 per cent of children aged 10-14 years were reported in civilian labour
force in East Pakistan compared to 23.3 per cent in West Pakistan (Haroon and Jan 1964).

The Bangladesh Development Studies
12
12
TABLE VI
LITERACY RATES IN PAKISTAN (FOR POPULATION AGED 5 YEARS
AND OLDER), 1951-1961
1951 1961
Pakistan 14.0 17.5
East Pakistan 18.8 19.9
West Pakistan 7.6 14.4
Note: The literacy data for Census 1951 was adjusted for intercensal differences in the definition of literacy. For details, see Akther (1963).
Official data as reported in Table VI overstates actual literacy rates for two
reasons. Firstly, overall years of schooling attained among the five years old and
older population was much lower when compared to West Pakistan. Literacy was
defined in terms of the ability to read and write. According to the 1961 Census
report, however, 14 per cent of these individuals had no formal education and
hence, unlikely to have attained functional literacy. The East-West disparity in
overall educational attainment is illustrated in Table VII. Secondly, owing to a
wider age bracket, the official figures contained large number of children who
eventually dropped out of primary school. For these children, the gains in literacy
due to school attendance were likely to be short lived. This was particularly the case
for East Pakistan where the vast majority of the children dropped out after grade I.
Therefore, an objective comparison of literacy rates requires exclusion of data on
these two groups of individuals. A comparative analysis of functional literacy rate
among individuals aged 10 years and older confirms this apprehension.14 The
revised figures yield a literacy rate of 10.1 per cent for West Pakistan compared to
only 7.8 per cent for its Eastern counterpart (Akther 1963). The literacy advantage
of East Pakistan as seen from published Census data was therefore primarily driven
by the fact that the province hosted a larger number of (i) individuals with very low
educational attainment and (ii) primary school–going population.
To summarise, at all levels other than primary education, the Western province
had a numerical advantage over East Pakistan at the time of independence which
widened in later years. Moreover, once disparity in primary school dropouts was
taken in account, the Eastern wing was disadvantaged at all levels of education. East
Pakistan’s educational backwardness was also conspicuous when assessed on the
14Functional literates are defined as those who report themselves as literates and have completed at least five years of schooling.
Asadullah: Educational Disparity in East and West Pakistan
13
13
basis of growth in official literacy and the level of functional literacy rates. Jilani
(1964) speculated that such disparities in educational outcomes could have been
driven by differences in the growth of educational facilities. This possibility is
explored in the next section. We discuss the inter-regional distribution of total
number of schools and teachers in Pakistan, for the most part focusing on primary
and secondary education.
TABLE VII
PERCENTAGE DISTRIBUTION OF (SELF-REPORTED) LITERATES BY
EDUCATIONAL LEVEL, 1961
East Pakistan West Pakistan
No Education 15.8 11.6
Primary Education 63.5 47.1
Secondary Education 16.9 29.9
Matriculation 2.8 9.0
Intermediate 0.6 1.9
Graduate 0.4 0.5
Source: Population Census of Pakistan, 1961, Census Bulletin No. 4, Literacy and Education (1962).
IV. SCHOOL AVAILABILITY IN EAST AND WEST PAKISTAN
Given the objective of UPE, Pakistan saw a sizable growth in the total number
of primary schools in the post-1947 years. However, the distribution of the new
schools seems to have compromised the principle of regional equality. Simple
descriptive analysis of time series data suggests that the total availability of schools
shrunk in East Pakistan in post-1947 years, both on an absolute and relative scale.
Figure 1 plots the number of primary schools per 1000 children in East and West
Pakistan. The initial educational endowments of East and West Pakistan were
somewhat consistent with regional difference in demographics: East Pakistan had
more (in absolute terms) primary and secondary schools than West Pakistan in
1947. Clearly, by 1971, East Pakistan had a lesser total of primary schools than it
inherited in 1948. Ironically, while school infrastructure was on a decline in the
East, the situation improved remarkably in West Pakistan during post 1947 years.
This could be the result of an egalitarian social planning aimed at closing the
absolute deficit in (population-adjusted) school availability facing the West wing:
there was less than one school in West Pakistan in 1947 compared to three primary
schools in East Pakistan, per one thousand school age children. In the first decade

The Bangladesh Development Studies
14
14
since independence, primary schools in West Pakistan increased from 8,357 in 1948
to 16,474 in 1958. The school availability in West Pakistan doubled in the primary
education sector.15
Figure 1: Primary School Availability in East and West Pakistan, 1950-1971
0
0.5
1
1.5
2
2.5
3
1950
1951
1952
1953
1954
1955
1956
1957
1958
1959
1960
1961
1962
1963
1964
1965
1966
1967
1968
1969
1970
1971
Total Primary School in EP (per 1000 children)
Total Primary School in WP (per 1000 children)
Note: Annual school age population (aged 5-14 years) figures have been projected using published data on annual growth rate for the respective provinces. Data on total number of schools was obtained from Fifty years of Pakistan in statistics, Government of Pakistan (1998).
This trend continued even in the second decade despite the constitutional
declaration in 1962 to eliminate inter-regional disparities as part of the national
economic policy.16 By the end of the 1960s, West Pakistan not only equalled the
East in primary education infrastructure, it also surpassed the Eastern province by a
big margin. Putting together the experiences of the two provinces we find that while
in West Pakistan the total number of primary schools trebled by the 1960s, it
15Interestingly, it is also the decade when disparity in per capita income between East and West Pakistan did not grow much. 16This contrast between policy declaration and implementation is also acknowledged by West Pakistani economists (GoP 1970, p 162).

Asadullah: Educational Disparity in East and West Pakistan
15
15
diminished in the East. Given the fact that East Pakistan had the majority of school
age children that grew at a relatively higher rate, an objective social planner would
have ensured at least a moderate growth in educational facilities to keep up with the
growing demand. The observed decline in primary schools per thousand school age
children following the stagnation in the absolute number of primary schools
therefore poses a puzzle. At the secondary level, the regional distribution of schools
seems to follow a similar pattern although the divide is not as striking as that
observed in primary education.
The evolution of the resulting disparity in educational infrastructure in primary
and secondary sector can be better illustrated by a simple ‘index of disparity’ in
total number of schools for the period 1947-71. The index is defined as:
[Index of Regional Disparity]j = [Disparity Ratio – 1]*100,
where, ‘Disparity ratio’= (Total number of schools in East Pakistan)/ (Total number
of schools in West Pakistan); j=primary, secondary. Thus, it calculates the annual
percentage change in the disparity ratio relative to that in 1947-48 i.e. the period
1947-48 is treated as the base year.
Figure 2 plots values of the ‘index of disparity’ for primary and secondary
education using population-adjusted data. The zero axis is the axis of parity/equality
where values above/below it indicates the relative regional abundance/deprivation.
From the Figure, it is clear that, both in primary and secondary education, the
extent of disparity widened over time. Disparity in the total number of primary
schools deepened through 1971. Till 1960, it was driven by differences in the
growth rates of the total number of primary schools between East and the West.
Similarly, due to a favourable growth rate of secondary schools, the corresponding
disparity index converged towards zero by 1956 i.e. regional gaps in the number of
secondary schools across the regions disappeared. By 1960, East and West Pakistan
converged in the total number of primary as well. In post 1960 years (i.e. second
five-year plan period), West Pakistan had both an absolute and relative advantage in
the total availability of primary schools. The relative advantage of the West in the
total number of secondary schools was rather short-lived (only from 1956-1963),
although the absolute advantage over East Pakistan prevailed throughout 1960s.

The Bangladesh Development Studies
16
16
Figure 2: Regional disparity in primary and secondary school availability,
1950-1971
-200
-150
-100
-50
0
50
100
150
200
1950
1951
1952
1953
1954
1955
1956
1957
1958
1959
1960
1961
1962
1963
1964
1965
1966
1967
1968
1969
1970
1971
Index of regional disparity, primary education
Index of regional disparity, secondary education
Note: The indices are constructed using population adjusted total number of schools.
Looking at the supply of teachers, a similar story emerges. At the time of
separation from India, East Pakistan was endowed with a relatively larger stock of
teachers to support the existing primary schools. However, the supply of teachers
failed to keep up with the increasing demand. The negative growth in the total
number of primary schools and slow growth in the total number of teachers in
primary and secondary schools in East Pakistan meant that these schools, and
classes within them, became increasingly overcrowded. Furthermore, inter-regional
difference in the growth in the total number of teachers led to inter-regional
disparity in the student-teacher ratio (STR).
Table VIII illustrates the evolution of school size and STR in secondary schools
in East and West Pakistan since 1947-48 by levels of education. By 1970, primary
class size had increased by 61 per cent in East Pakistan against 36 per cent in West
Pakistan (compared to the 1947-48 benchmark figures). Similarly, as is seen from
the Table, inter-regional differences in growth in the number of schools created
disparity in school size. Schools in East and West Pakistan were almost of the same
size in 1948. But they soon diverged, particularly after the 1950s. As a result,
schools became excessively overcrowded in East Pakistan compared to the West.

Asadullah: Educational Disparity in East and West Pakistan
17
17
TABLE VIII
SCHOOL AVAILABILITY, STR AND SCHOOL SIZE DURING 1948-70
Number of schools School size STR
East Pakistan West Pakistan East Pakistan West Pakistan East Pakistan West Pakistan
Schools
Index of growth
Schools
Index of growth
School Size
Index of growth
School Size
Index of growth
STR
Index of growth
STR
Index of growth
Primary Education
1948 29,633 100.0 8,413 100.0 68.22 100.0 64.7 100.0 26.73 100 30.55 100
1955 26,000 87.74 14,162 168.33 100.17 146.83 89.97 139.05 36.44 136.31 35.91 117.59
1960 26,583 89.71 17,901 212.78 119.64 175.37 86.47 133.65 40.53 151.64 34.51 113.01
1965 27,474 92.71 32,589 387.36 147.2 215.77 77.7 120.1 42.78 160.05 33.34 109.16
1970* 28,908 97.55 38,900 462.38 227.08 332.87 81.41 125.82 59.31 221.89 35.99 117.83
Secondary Education
1948 3,481 100.0 2,598 100.0 151.11 100.0 195.55 100.0 21.59 100 26.95 100
1955 3,079 88.5 2,264 87.14 148.52 98.29 319.27 163.3 20.52 95.03 30.96 114.9
1960 3,053 87.7 3,043 117.1 173.76 115.0 299.83 153.3 22.51 104.2 29.1 108
1965 3,834 110.0 4,323 166.4 221.31 146.5 316.77 162.0 25.2 116.7 27.48 102
1970 5,694 164.0 5,600 215.6 256.41 169.7 220.71 112.9 28.42 131.6 18.45 68.45
Note: Raw data is from “Fifty Years of Pakistan in Statistics.” *Figures refer to the year 1969. This is because data on total student enrolment in East Pakistan was unavailable for the year 1970. Figure for the year 1971 was available but not used here for the unusually low enrolment in school in that year, which largely reflected the adverse effect of civil war and political turmoil in the country.

The Bangladesh Development Studies
18
18
Similarly, East Pakistan also lagged behind its Western counterpart in the supply of secondary school teachers. At the end of the plan year 1964-65, West Pakistan gained a total of 2,410 secondary teachers in the same year as opposed to 1,125 by East Pakistan. Similar gaps remained between the two provinces in the targeted number of primary and secondary teachers as set in the Third Five Year Plan, 1965-70.
17 Supply of secondary
teachers did not keep pace with increases in enrolment. Therefore, although East Pakistan initially had a favourable STR, it was matched by West Pakistan via a relatively higher growth of total number of teachers in West Pakistan.
18 By 1970, the
Eastern province had a class size which was 14 per cent higher than that of the pre-1947 level, whereas in West Pakistan, it was 34 per cent lower.
To sum up, despite starting with favourable educational endowments, East Pakistan ended up with a lesser number of primary schools and larger STR in the primary sector. Similarly, in spite of a superior initial endowment of secondary schools, it received a smaller total number of teachers leading to a higher STR by 1970. On the other hand, despite being endowed with poorer educational infrastructure in primary and secondary education (e.g. smaller total number of schools, relatively higher STR), West Pakistan surpassed or matched the East in number of schools, and reduced the STR.
19
The above findings can be discredited on the premise that provincial disparity under a federal regime is unsurprising if one looks at similar regimes elsewhere in the region i.e. South Asia. To this end, we use regional education data from India as our benchmark as it provides a powerful illustration of the extent of disparity experienced by East Pakistan. Figure 3 graphs trends in primary school availability in East Pakistan, West Bengal and Uttar Pradesh (UP) during 1948-1966.
20 In 1947, West Bengal had a
school structure and socio-economic background of students similar to those in East
Pakistan.21 UP was one of the most educationally backward states in India. As can be
seen from the Figure, East Pakistan was much ahead of the Indian states in the early years i.e. 1948-1952. However, throughout 1948-66, the Pakistani province experienced a decline in school supply while the Indian counterparts enjoyed a steady growth.
17For details, see GoP (1968), pp. 189-197. 18Early researchers such as Curle (1966) also confirm the initially smaller STR in secondary schools in East Pakistan (35) than that for West Pakistan. However, they ignored the gradual changes in STR across regions over time. 19In the absence of any single measure of school quality used in the earlier debates (and literature) on school quality, we have restricted our measure of quality to that of student-teacher ratio (STR) and quantity to school size. In the existing literature on school quality, STR is the most frequently used measure of school quality on which we have data both for East Pakistan and Pakistan. The alternative measures could have been per capita expenditure on student by school and teacher salary but there is no complete data series as of yet. 20Comparison is restricted for this period because of incomplete series for the Indian states. 21It is similar in terms of the proportion of schools in public ownership and/or finance.

Asadullah: Educational Disparity in East and West Pakistan
19
19
Consequently, by 1959, East Pakistan fell behind West Bengal while UP surpassed it by 1961. Rate of growth in the teaching force followed the same pattern in the comparing regions so that this showed up in relatively over-crowded schools and class size in East Pakistan. Hence, even by a broader regional standard, the extent of decline of school infrastructure in East Pakistan is striking. This comparison, as will be seen later, also offers important insights into the process that gave rise to stagnation in schooling conditions in East Pakistan.
Figure 3: Primary School Availability in East Pakistan, West Bengal and Uttar
Pradesh, 1948-1966
0
0.5
1
1.5
2
2.5
3
3.5
4
1948
1949
1951
1952
1953
1956
1957
1958
1959
1960
1961
1962
1965
1966
Total Primary School in EP (per 1000 children)
Total Primary School in UP (per 1000 children)
Total Primary School in WB (per 1000 children)
Notes: Data on the total number of primary schools in the Indian provinces are from
‘Education in India’, 1994, Central Publication Branch, Government of India (GoI). School age population data for the Indian states have been projected using state-wise annual population data from ‘Report on the Population Projections Worked Out Under the Guidance of the Expert Committee Set Up by the Planning Commission Under the Chairmanship of the Registrar General, India’, Office of the Registrar General, Ministry of Home Affairs, Government of India, 1968.
Lastly, one may argue that if educational inequalities in undivided Pakistan were systematic, they should have prevailed at all levels of education. To assess this claim, Table IX summarises data on total number of various institutions at the post-secondary level in East and West Pakistan for the period 1954-61. Barring only two categories, Arts/Science colleges and teacher training institutes, West Pakistan had an absolute advantage in the availability of higher education facilities. Given the initial backwardness of the Eastern wing, one would have expected some equalisation in regional supplies in the later years, for instance, through greater allocation of new units to East Pakistan. Nonetheless, data for the year 1961 reveals a further divergence in higher education infrastructure instead. Altogether, the status quo in primary and post-primary education, therefore, confirms the conjecture of systematic educational inequalities between East and West Pakistan at almost all levels of education.

The Bangladesh Development Studies
20
20
TABLE IX
NUMBER OF INSTITUTIONS AND STUDENTS IN EAST AND WEST PAKISTAN IN 1954 AND 1961
East Pakistan West Pakistan East-West Gap
1953-54 1960-61 1953-54 1960-61 1953-54 1960-61
No. of Institutions
No. of Students
No. of Institutions
No. of Students
No. of Institutions
No. of Students
No. of Institutions
No. of Students
No. of Institutions
No. of Students
No. of Institutions
No. of Students
Arts and Science College
70 22,936 81 47,843 58 32,320 131 70,580 12 -9,384 -50 -22,737
Medical 1 751 3 1,130 6 2,355 9 3,792 -5 -1,604 -6 -2,662
Engineering 2 689 2 921 2 1,582 4 2,070 0 -893 -2 -1,149
Commerce 1 341 2 605 3 880 4 1,183 -2 -539 -2 -578
Agriculture 2 156 2 486 3 699 4 1,916 -1 -543 -2 -1,430
Teacher Training Institute
73 3,898 47* 3,571 39 3,919 49* 5,762 34 -21 -2 -2,191
University 2 3,093 2 5,575 4 2,083 4 4,792 -2 1,010 -2 783
Note: The table is adapted from Jilani (1964), p. 88. * indicates that data is for 1959.

Asadullah: Educational Disparity in East and West Pakistan
21
21
V. INTER-REGIONAL DISPARITY IN EDUCATION: “DISCRIMINATION’’
OR A FALLACY OF DATA?
From the preceding discussion, the decline in primary schooling infrastructure in East Pakistan is evident even after normalising for the underlying population: regional difference in the growth of educational infrastructure was not driven by regional differences in the growth rate and level of school age population. While exact structural reasons for this singular decline in primary schools during the post-1947 years are unknown, some researchers (e.g. Chowdhuri 1972) have attributed it to “a deliberate policy of neglect.” However, the inter-regional differences in educational facilities could as well be driven by other factors on the supply side. What appears to be a result of “discrimination” is likely to be confounded by unaccounted differences in various characteristics of the comparing regions such as heterogeneity of the education sector, provincial educational policy and so on. We consider these contesting explanations below.
Difference in School Types
Regional differences in the growth of total number of schools could be attributed to (i) relative share of the private education sector, (ii) presence of unrecognised private schools, and (iii) operation of schools in multiple shifts. The declining growth of private schools and/or publicly funded private (henceforth, aided) schools over their public counterpart in East Pakistan could explain the decline in primary school availability. If one region experiences greater growth of private schools, the total number of schools may differ despite an equal number of public and aided schools. If true, the root cause of educational disparity lies in the differential responses by the private education sector in the study regions.
However, in Pakistan, the majority of the schools were either publicly owned and managed, or publicly financed. For example, in 1949-50, of all the primary schools in East Pakistan, (26 per cent) were aided and another 3 per cent were private schools. In 1955-56, the share of aided schools was 14% and that of private schools was per cent. Hence, it appears that government indeed had the greatest control over supply of secondary schools and expenditure patterns within the school. Analysis of school data by management types indicates that such stagnation is not caused by a steep decline in private schools offsetting/masking any significant growth in public or publicly aided schools in East Pakistan.
Table X provides data on public share in the total number of schools in West Pakistan and various provinces within West Pakistan for the year 1963-64. Apart from Khairpur, in all the provinces primary schools were mostly in public management. Hence, differential growth in primary schools in West Pakistan cannot be due to a greater share of private schools: growth of schools was mostly financed

The Bangladesh Development Studies
22
22
by public funds. In addition, the observed growth of private aided schools in West Pakistan could not be assumed to be exogenous to government policies.22 There is anecdotal evidence suggesting that schools under private management were accorded recognition liberally by the government in West Pakistan. This led to indiscriminate expansion of schools in West Pakistan during the 1950s (GoP 1959). Through a combination of liberal recognition and government provision of financial aid, private and/or aided schools were sustained and their growth encouraged in West Pakistan. Even if private and aided schools are considered together in a single group, their numbers do not account for differential growth in the overall school numbers in the comparing regions.
TABLE X
DISTRIBUTION OF PRIMARY SCHOOLS BY TYPES IN WEST
PAKISTAN, 1963-64
% of public schools
% of municipality
schools
% of aided schools
% of private schools
Total number of schools
Peshwar 99 – – 1 3,170
Rawalpindi 95 4 1 1 7,456
Lahore 89 7 4 1 10,381
Hydrabad 97 – 2 – 8,004
Quetta 100 – – – 1,005
Khairpur 43 – 16 40 934
West Pakistan 93 3 3 2 30,950
Source: Education Statistics for West Pakistan 1963-64, GoP (1966a).
Besides registered private schools, one could explain the decline of primary schools in terms of the share of unrecognised private schools.23 To the extent that East Pakistan experienced relatively greater growth of such unrecognised schools, the inter-regional disparity can be arguably spurious. Published aggregate data on
22Greater government allocations led to larger social-overhead capital in the West and further facilitated (and justified) a private investment explosion (Ahmed 1972). This means that much of the growth in private schooling in West Pakistan could be attributed to relatively greater growth in public investment in the region. 23For example, Kingdon (1996) points out that published educational statistics in India ignore “unrecognised” private schools and include only the “recognised” private schools. She also notes that enrolments in government-funded schools are greatly over-reported in published data.
Asadullah: Educational Disparity in East and West Pakistan
23
23
the number of unrecognised institutions, however, indicate that these were very small in numbers and had been decreasing since 1947. For example, East Pakistan had a total number of 907 unrecognised educational institutions in 1947-48 (GoEP 1956). However, by 1960, the number was down to 211 schools (GoEP 1965).24 Therefore, if anything, trends in the total number of unrecognised schools mirror that of recognised schools. In the subsequent years, however, owing to dubious quality, these schools were officially banned by the East Pakistan Registration of Private School Ordinance, 1962 (GoEP 1966, p. 32).
Lastly, a notable feature of the East Pakistani education system was the presence of double shift schools. While the exact proportion of these schools remains unknown, anecdotal evidence suggests that the majority of the primary schools remained in single shifts in East Pakistan. It is possible that to cope with rising enrolment of students and demand for schooling, a fraction of primary schools in East Pakistan might have switched to double-shifts. Once again, the share of these schools (that switched to double shift in post-1947 years) in the total number of double-shift schools remains unknown. Besides, these double-shift schools mostly operated with a single set of teachers and offered different grades in different shifts.25 Consequently, this arrangement did not wholly address the problems of oversized classes since it did not fully compensate for missing teachers as this would have required separate sets of teachers to teach separate shifts. On the other hand, all the double-shift schools elsewhere in Pakistan were aided with two sets of teachers. This feature of the education system partly explains relatively lower schooling hours, about 2.5-3.5 hours, in East Pakistan compared to the average of 5 hours of schooling observed in West Pakistan. This institutional arrangement, if anything, further lowered school quality in East Pakistan, particularly in the rural areas (Huq 1954).26
Difference in Unit Cost
One could argue that in East Pakistan the primary education sector shrunk because further educational expansion on the supply side was no longer desirable; the decline in the number of primary schools and teachers was an outcome of an optimal policy given the prevailing costs of school operation. If so, observed
24In addition, these figures included all unrecognised primary, secondary and post-primary schools although an under-estimation of the actual number of these unrecognised institutions cannot be ruled out. 25Besides, we do not know how many of the schools in East and West Pakistan were operating in double shift initially in 1947. 26Colclough and Lewin (1993) discussed various pitfalls of operating schools in double-shifts.

The Bangladesh Development Studies
24
24
disparity is attributable to relatively higher unit-costs of school operation in East Pakistan. Unit costs could be high either because of (a) under-utilisation of the existing capacity, and/or (b) higher input price such as teacher pay.27 In the presence of high costs and overall budgetary constraints facing a region like East Pakistan, a rational response is raising the STR to ensure more intense use of schools instead of building new schools or recruiting new teachers. To be precise, higher unit costs may have contained the growth of primary schools in East Pakistan, whereas schools grew in number in the West because of cheaper inputs such as low salary teacher and less costly construction material.
However, published data on school costs for early years suggest completely the opposite. Schools in East Pakistan were poorly resourced, taught by the lowest paid teachers, and already as crowded as those in West Pakistan in 1948. Indeed, among all provinces of the united Pakistan, East Pakistan had the lowest paid teachers (Owen 1960). On the other hand, schools in West Pakistan were staffed by better paid teachers. Not only were teachers salaries many times lower in East Pakistan, but they also consumed most (95 per cent) of the educational expenses in primary schools leaving a small amount for other school inputs. In contrast, schools in West Pakistan had a higher proportion of non-teacher expenditure despite teacher pay being six times higher that that in East Pakistan. Table XI summarises the situation.
TABLE XI
ITEMISED BREAKDOWN OF EDUCATIONAL COST PER PUPIL IN
PAKISTAN (IN RUPEES), 1952-53
Teacher salary
Furniture &
equipment
Buildings & repairs
Contingencies Total cost per pupil (in Rupees)
East Pakistan 6.70 (95.4) 0.12 (1.8) 0.08 (1.1) 0.10 (1.6) 7 (100.0) West Pakistan Sind 36.10 (88.0) 1.61 (4.0) --- 3.30 (8.0) 41 (100.0) Khairpur 41.30 (84.3) 1.90 (3.9) 4.80 (9.8) 1.00 (2.0) 49 (100.0)
Note: Percentages are in parentheses. The table is adapted from Huq (1954), p. 67.
Thus lower unit cost of primary schools in East Pakistan was maintained by (a) paying teachers significantly low salaries (relative to their counterparts in the West) and (b) keeping the ratio of teacher-student to a minimum.28 In addition, if
27Unit cost in East Pakistan is a multiplicative product of STR and average teacher salary. This is because total salary bill is approximately equivalent to total recurrent expenditure in East Pakistan. 28Such poor incentives may have had significant negative impact on educational output.

Asadullah: Educational Disparity in East and West Pakistan
25
25
differences in regional prices were taken into account, the unit cost for East Pakistan would be even lower than that reported in Table XI.29 The situation was not very different for the later years. In the 1960s, starting salaries for teachers in West Pakistan were three times higher than those in East Pakistan and average salaries were about twice as much (Curle 1966). Table XII presents data on primary schools, school size, STR and unit cost in various provinces of West Pakistan in 1963-64. These figures further corroborate our contention. Hence, inter-regional disparity in growth of educational infrastructure cannot be attributed to inter-regional differences in unit cost.
TABLE XII
NUMBER OF PRIMARY SCHOOLS, SCHOOL SIZE, STR AND UNIT COST (IN
RUPEES) IN VARIOUS PROVINCES OF WEST PAKISTAN, 1963-64
Provinces
Total number of primary schools
School size STR Unit cost
Peshwar 2,162 77.59 41.04 25.47
Rawalpindi 5,993 84.55 36.66 35.71
Lahore 8,383 70.03 31.83 49.33
Hydrabad 6,832 60.89 30.96 44.37
Quetta 703 48.56 24.94 60.69
Khairpur 857 228.06 53.15 28.20 West Pakistan 24,930 76.50 34.78 40.57
Source: Education Statistics for West Pakistan 1963-64, GoP (1966a).
Difference in School Quality
The quantitative indicators of educational disparity aside, little is known about regional differences in quality of education in Pakistan. An account of regional disparity in school quality, assessed in terms of grade completion and functional literacy, was provided in section III. However, it is not evident whether such disparity prevailed, in spite of compensatory education policies to boost quality, or whether they simply reflected a lack of good quality schools. To be precise, the two provinces could have been endowed with dissimilar quality of educational inputs, compensating for overall differences in the stock of inputs. For example, East Pakistan might have opted against a larger primary education sector, by investing in better maintenance of schools and quality improvement. However, comparison of school quality on the basis of the pay and profile of teachers does not support this
29Real wages of school teachers were lower than that of pre-1947 days (Huq 1954).

The Bangladesh Development Studies
26
26
hypothesis. Schools in East Pakistan were staffed by disproportionately untrained and poorly paid teachers (Owen 1960). In 1956 the average salary of a primary teacher was $ 4.60 (Rupees 22) which later increased to $12 in 1963. However, the salary for untrained teachers remained as low as $6.80 (Rupees 32.5). In contrast, the starting salary of an untrained teacher was three times as high in West Pakistan, and average salaries were about double of those in East Pakistan (Curle 1966).
Whilst untrained teachers accounted for two-fifth of the teaching staff in
primary schools in East Pakistan, almost the opposite was true for the Western
province. This is apparent from Table XIII. Regional gaps in the total number (and
fraction) of trained teachers widened further in later years.30 This conjecture is
corroborated by data on annual gains in trained teachers and enrolment data in
teacher training institutes in the comparing regions. For example, at the end of the
plan year 1964-65, a total of 4,200 primary teachers were trained in East Pakistan,
compared to 10,400 in West Pakistan (GoP 1968). Analysis of enrolment in teacher
training institutes reveals that it declined in East Pakistan during 1953-61 by 8.3%,
while West Pakistan experienced a 47% increase.
TABLE XIII
UNTRAINED TEACHERS AS A % OF TOTAL PRIMARY TEACHERS, 1952
% of Teachers without training
East Pakistan 42 West Pakistan 36
Punjab 23
N.W.F.P. 13 Baluchistan 18
Note: Data for this Table is from Huq (1954), p. 156.
To the extent, the level of pay affects recruitment and retention of superior
ability teachers, school quality, measured in terms of learning outcomes is likely to
be poor. East Pakistan’s educational backwardness, measured in terms of outcomes
such as functional literacy and years of school completed, is, therefore, consistent
with its inferior endowment of inputs at the school level, namely low teacher pay
and lack of trained teachers.
30According to one estimate, 82.8 per cent of all the primary school teachers were trained in West Pakistan by the early 1960s (GoP 1966).

Asadullah: Educational Disparity in East and West Pakistan
27
27
Biased Central Policy or Failed Provincial Policy?
Total expenditure on education in the united Pakistan increased from less than 1
per cent of GDP in 1947 to 1.2 per cent in 1958 to 2.6 per cent by 1964. While this
trend was well-matched by a higher growth of schools in West Pakistan, it was
clearly in contrast to the stagnant schooling conditions in East Pakistan. Given that
observed disparity in education cannot be attributed to differences in school age
population, the unit-cost, management and quality of schools, we then examine an
explanation in terms of state policies and actions that may have adversely affected
distribution of economic resources towards East Pakistan. In a federal system of
governance, one could view disparity as a joint product of (a) the extent of central
government control and (b) limited scope of the respective provincial government
for independent action in educational provisions (Faaland and Parkinson 1976).
These are considered below.
(a) Bias in central government policy? Despite being a federal system, provincial
educational developments in Pakistan significantly depended on allocations of
central government budgets. The centrally administered areas were located in West
Pakistan. In these areas, the federal government also operated as a state government
and in that capacity, provided educational facilities at all levels of education. In
other areas, the Centre played a passive role by setting different plan allocations to
education and development activities. In addition, it influenced provincial
developments through differential allocation of central government funds. In this
section, therefore, we are interested to examine whether there was any bias in (i) the
allocation of central budget and (ii) plan targets for provincial educational
development.
Analysis of budgetary data reveals that East Pakistan singularly received a smaller allocation than the West. These allocations varied between pre- and post-plan periods. In the absence of any five-year plans during 1948-55, the allocation of central government education funds had often been discretionary and overwhelmingly in favour of West Pakistan and, therefore, allegedly “discriminatory.” For example, East Pakistan’s share of central government development expenditure remained as low as 20 per cent despite having 60 per cent of the population during the said period and generating higher internal revenues. The latter highlights the fact that low development expenditure in East Pakistan was de facto exogenous to the size of its internal budget. This aspect of East Pakistan’s development finance is further elaborated in Table XIV which provides a breakdown of total government expenditure and revenue during this period. However, the opposite was true for West Pakistan. With the exception of the year 1953, it received public expenditure in excess of annual revenue generated.

The Bangladesh Development Studies
28
28
TABLE XIV
REVENUE AND EXPENDITURE OF THE GOVERNMENT OF PAKISTAN FROM
AND IN EAST AND WEST PAKISTAN (IN 000 RUPEES), 1947-54
Year
West Pakistan East Pakistan
Revenue Expenditure Balance Revenue Expenditure Balance
1947-48 145,772 240,263 – 94,491 57,165 47,589 + 9,576
1948-49 498,717 846,457 – 347,740 162,311 31,949 + 130,362
1949-50 633,026 1,416,583 – 783,557 220,793 17,634 + 203,159
1950-51 999,874 1,278,851 – 278,977 258,503 45,195 + 13,308
1951-52 1,035,432 1,649,675 – 614,243 350,972 1,509 + 349,463
1952-53 912,967 1,319,720 – 406,753 254,293 249,091 + 5,202
1953-54 1,040,720 979,502 + 61,218 211,551 4,835 + 206,716
Source: Adapted from Sadeque (1957), Table 3, p. 39.
During the seven years of pre-plan period, the Centre secured excess revenue of Rupees 125.6 crores from East Pakistan over central expenditure in the same. During the same period, the Centre spent an excess of Rupees 234 crores in total in West Pakistan over central revenue received from West Pakistan. Altogether, resources of East Pakistan to the extent of Rupees 125.5 crores were diverted to West Pakistan. In summary, during the pre-plan years, additional expenditure in the Western province was paid by East Pakistan’s contribution to the central revenue in excess of what it received from the Centre. Such fiscal favouritism was also mimicked in educational policies of the Centre. A “Six-year National Plan of Educational Development” was undertaken during 1951-57, under which a total of 1,150 million Rupees were allocated for construction of 24,027 primary and 721 secondary schools (GoP 1955). However, most of it was allocated to the Western province: during this entire period, the number of primary schools remained stagnant in East Pakistan whereas it went up by at least 5,000 schools in West Pakistan.
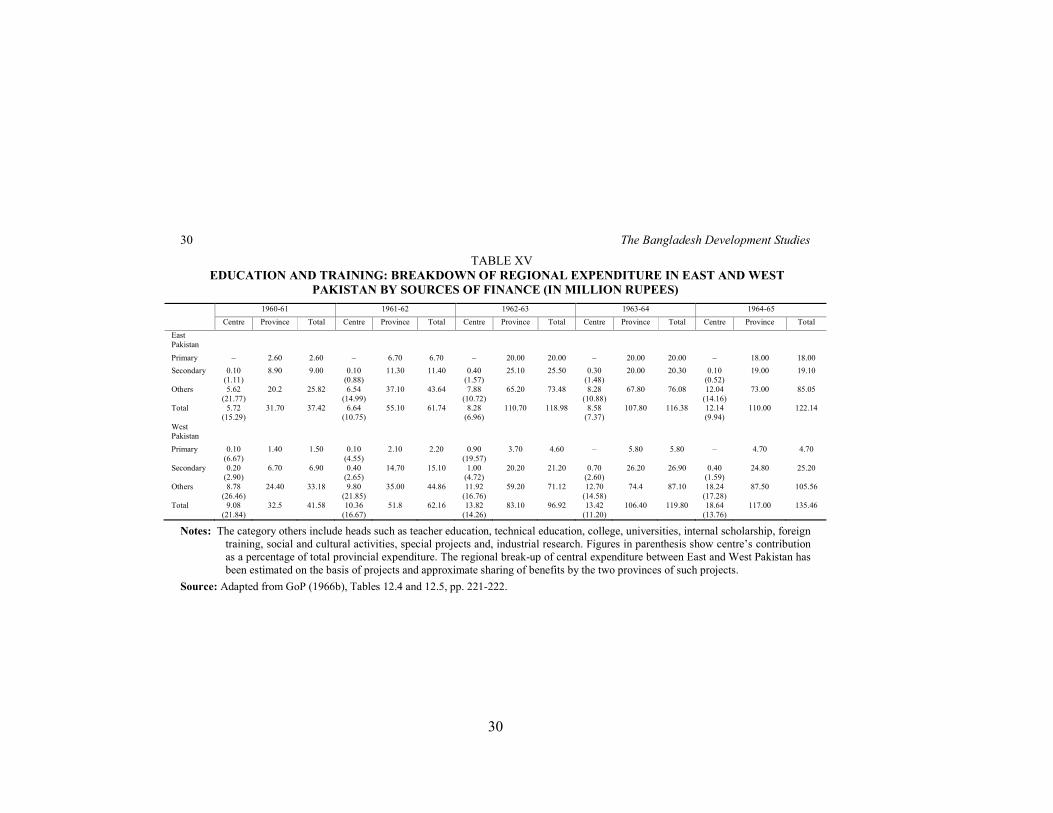
In post-1955 years, public expenditure allocations were reformulated on the basis of plan documents. Under the first five-year plan, a total of Rupee 27 crores (central and provincial scheme combined) were allocated to education under the public sector programme in East Pakistan, whilst West Pakistan was allocated Rupee 33 crores for the same period. According to one estimate, Central government contribution accounted for Rupee 9 crores, of which 94% were allocated to West Pakistan (Sadeque 1957). In general, the plan envisaged an investment expenditure of Rupee 254 crores in the public sector for East Pakistan while her contribution was set at Rupee 411.22 crores. Table XV reviews

Asadullah: Educational Disparity in East and West Pakistan
29
29
allocations of central government expenditures between East and West Pakistan. Unequivocally, West Pakistan’s share in the central government education budget was at least 30% higher than that of the Eastern province.31 Unsurprisingly, East Pakistan’s share of central government development expenditure only peaked at 36% during the third Five-Year Plan period i.e. 1965-66 to 1969-70 (GoP 1970). Besides, a comparison of annual data on total and educational expenditure suggests that although by the 1960s existing regional gaps in expenditure had been somewhat reduced, no such pattern is discernible in the case of educational expenditures. This is despite the constitutional declaration in 1962 to eliminate intra-regional disparities as part of the national economic policy.32
Overall, East Pakistan’s share of allocation for education in the first and second plan periods was 45 per cent and 47 per cent respectively. But its share of actual expenditure for these plans was only 35 per cent of the total allocated budget, reflecting a shortage of revenue (Curle 1966). Apart from setting different plan targets for different regions, there were marked differences in actual achievements of these targets, which according to Curle (1969) reflects the interest and concepts of the government that implements the plan. He notes:
...what is done, as opposed to what is said, or formally planned about education, depends upon the interests of those in high positions in the political and administrative systems.
(Curle 1969; p. 120)
A review of various earlier government plan documents shed further light on this issue. The first plan favoured post-primary sectors in terms of higher allocation of funds over the primary sector. Although the constitution of Pakistan recognised regional disparities by 1960, such recognition mostly remained limited to economic spheres. For example, Akthar (1971), in a review of allocations and objectives of various five-year plans since 1955, notes that while the plan acknowledged some regional inequalities in economic outcomes and noted the need to address them, no such observation was made on educational outcomes. That is, none of the plans recognised regional disparities in education outcomes. Only in the fourth plan was the educational investment mentioned as a development strategy to better distribute educational opportunities between regions. Thus, favourable allocations of the central government education budget, along with an overall “discrimination” of public funds, are likely to have aided the staggering growth in schools in the West versus a lagging East.
31Most of centre’s budget was allocated to post-primary education during the said period. 32This contrast between policy declaration and implementation is also acknowledged by West Pakistani economists (GoP 1970, pp 162).
The Bangladesh Development Studies
30
30
TABLE XV
EDUCATION AND TRAINING: BREAKDOWN OF REGIONAL EXPENDITURE IN EAST AND WEST
PAKISTAN BY SOURCES OF FINANCE (IN MILLION RUPEES)
1960-61 1961-62 1962-63 1963-64 1964-65
Centre Province Total Centre Province Total Centre Province Total Centre Province Total Centre Province Total
East Pakistan
Primary – 2.60 2.60 – 6.70 6.70 – 20.00 20.00 – 20.00 20.00 – 18.00 18.00
Secondary 0.10 (1.11)
8.90
9.00 0.10 (0.88)
11.30 11.40 0.40 (1.57)
25.10 25.50 0.30 (1.48)
20.00 20.30 0.10 (0.52)
19.00 19.10
Others 5.62 (21.77)
20.2 25.82 6.54 (14.99)
37.10 43.64 7.88 (10.72)
65.20 73.48 8.28 (10.88)
67.80 76.08 12.04 (14.16)
73.00 85.05
Total 5.72 (15.29)
31.70 37.42 6.64 (10.75)
55.10 61.74 8.28 (6.96)
110.70 118.98 8.58 (7.37)
107.80 116.38 12.14 (9.94)
110.00 122.14
West Pakistan
Primary 0.10 (6.67)
1.40 1.50 0.10 (4.55)
2.10 2.20 0.90 (19.57)
3.70 4.60 – 5.80 5.80 – 4.70 4.70
Secondary 0.20 (2.90)
6.70 6.90 0.40 (2.65)
14.70 15.10 1.00 (4.72)
20.20 21.20 0.70 (2.60)
26.20 26.90 0.40 (1.59)
24.80 25.20
Others 8.78 (26.46)
24.40 33.18 9.80 (21.85)
35.00 44.86 11.92 (16.76)
59.20 71.12 12.70 (14.58)
74.4 87.10 18.24 (17.28)
87.50 105.56
Total 9.08 (21.84)
32.5 41.58 10.36 (16.67)
51.8 62.16 13.82 (14.26)
83.10 96.92 13.42 (11.20)
106.40 119.80 18.64 (13.76)
117.00 135.46
Notes: The category others include heads such as teacher education, technical education, college, universities, internal scholarship, foreign training, social and cultural activities, special projects and, industrial research. Figures in parenthesis show centre’s contribution as a percentage of total provincial expenditure. The regional break-up of central expenditure between East and West Pakistan has been estimated on the basis of projects and approximate sharing of benefits by the two provinces of such projects.
Source: Adapted from GoP (1966b), Tables 12.4 and 12.5, pp. 221-222.

Asadullah: Educational Disparity in East and West Pakistan
31
31
(b) Failure of provincial policy? Provincial governments had an inescapable
responsibility for the delivery of education in post-1947 years. And it could be that
provinces did not allocate enough resources for educational developments.33 But we
argue that the extent of provincialisation of educational management and the ability
of the provincial government to deliver education in East Pakistan was not
exogenous of central government policies. To appreciate these points, an
understanding of the prevailing structure of educational management in Pakistan
during 1947-71 is crucial.
During the British period, various local bodies–district boards, district school
boards, and municipalities–were responsible for the general administration of
primary education, a step which soon proved to be disastrous. As a response,
primary education was made the responsibility of the provincial government in all
provinces (with local administration in the hands of the village and town boards) of
Pakistan in post-1947 years. However, East Pakistan and Punjab were kept out from
this reform (GoP 1958, 1959). In addition, the central government directly
controlled schools in federal areas of Karachi, N.W.F.P., and Baluchistan. In these
provinces, the increase in educational expenditure was more than proportionate to
the increase in provincial budget (Huq 1954). Even in the West Pakistani province
of Punjab, where schools were locally managed, central government grants in a
large number of cases almost entirely accounted of the operating costs of new
schools (GoP 1959, p. 180). Grants were given to these local bodies and new
primary schools were being opened on 100% financial grants from the Centre (GoP
1958). In addition, the Punjab government introduced the “free compulsory primary
education scheme” in 1953 which also included the existing non-government
schools. Compensatory grants were nevertheless made available to the non-
government schools to make up for their loss of income, previously earned from
student fees (GoP 1955). However, we are not aware of any such compensatory
financial grants (from the central government) for non-government schools in East
Pakistan.
33In addition, East Pakistan provincial government could be accused of not tapping all the possible sources for financing education. However, as already argued, fiscal capacity (i.e. various means of financing local development needs including education) of East Pakistan government was severely constrained by the Central government at least in the early 1960s. Similarly, one could point out a somewhat lower level of implementation of the First Plan (1955-56) in Bangladesh due to low absorptive capacity. However, low absorptive capacity is as likely to be a result of low public investment.

The Bangladesh Development Studies
32
32
Turning to commitment and contribution of the provincial government for education development, two crucial factors are size and structure of the provincial education budget. On the question of budgetary allocation to education, a comparison of percentage share of education in provincial budget of East and West Pakistan revealed no significant difference in percentage share of budgeted expenditure on education during 1952-68. From Table XVI, there does not appear to be any significant regional difference in the share of primary education in the educational expenditure during 1952-68 which could explain the disparity in primary education sector development in East and West Pakistan. In addition, the share of educational expenditure in total provincial budget also follows closely in the two regions particularly in the 1960s.34 During the pre-plan era (i.e. up to the mid–1950s), there were large differences in provincial primary education expenditure allocation which apparently poses a puzzle. Perhaps in the early years following independence, educational planners in East Pakistan were more concerned about educational backwardness at the post-primary level so that greater allocation was made to close regional gap in the availability of higher education places. However, this hypothesis is not supported well by data either: as pointed out earlier, this period saw a near-stagnant situation in higher education supplies in East Pakistan. The puzzle is partly answered by the fact that there were large regional disparities in actual realisation of planned allocations. Whilst this shortfall in actual allocation is attributable to overall resource availability, it also points towards the failure of the incumbent Muslim League government to uphold the interests of its electorate in East Pakistan. The League was overtly pro-Centre and consequently was ousted from power in 1954 in the Eastern province. Therefore, it is not unsurprising that from 1955-64 the share of primary education in total education budget in East Pakistan had been higher than that in West Pakistan. From 1962 onwards, when primary education was fully provincialised, the share stabilised in East Pakistan.35 Hence, developments in this sector cannot be attributed to differences in regional policies in allocating expenditures to education. If anything, the gap in schooling infrastructure mirrors the inter-regional difference in total education budget. Consequently, any educational disparity between the two regions has to be explained in terms of size of provincial education budget.
34Although funds given by the Centre to provincial government in West Pakistan could be shown as expenditure incurred by the provincial government without disclosing the actual money received from the centre and revenue raised by the province. Padmanabhan (1986) documents a similar problem in India. 35The law relating to primary education in Pakistan was consolidated under the Provincial
Primary Education Ordinance, 1962.

Asadullah: Educational Disparity in East and West Pakistan
33
33
TABLE XVI
PER CENT OF BUDGET EXPENDITURE ON EDUCATION AND PER CENT OF
EDUCATIONAL EXPENDITURE ON PRIMARY EDUCATION IN EAST
AND WEST PAKISTAN, 1952-68
% of provincial budget allocated to education
% of provincial education budget allocated to primary education
EP WP EP WP
1952-54 [Pre-plan years] 11.11 9.66 13.66 49.00
1955-59 [1st plan year] 11.20 11.60 48.40 39.00
1960-64 [2nd plan year] 13.00 14.00 35.80 34.60
1965-68 [3rd plan year] 12.25 16.25 27.23 33.75
Note: All figures correspond to average of annual percentages in the respective period. Data is from “Fifty years of Pakistan in Statistics” (GoP, 1998). Comparable data on expenditure in East Pakistan for the periods 1947-51 and 1969-71 was not available.
Figure 4 graphs per capita public expenditure over time in East and West Pakistan. The East wing had singularly received smaller public expenditure than its western counterparts. Given such disparity in the overall expenditure, it is no surprise that educational expenditure also followed suit. This is also elaborated in Figure 5. A comparison of Figure 4 with Figure 5 suggests that although in the very latter years, existing regional gaps in expenditure had been somewhat reduced, no such pattern was discernible in the case of educational expenditures.
The relatively smaller size of provincial education budget in East Pakistan could arise due to limited capacity of the East Pakistan government to generate revenue for development expenditure. However, the provincial government of East Pakistan was not fully entitled to its own income for two reasons. Firstly, in 1948, the federal government limited sources of provincial revenues by relocating income tax and sales tax revenue from provincial to central government. This seriously curtailed the overall size of provincial budget. Secondly, reallocation of East Pakistan’s export earnings to the West by the federal government severely shrank provincial budget of the East. The indirect but strong federal control over provincial revenue meant that during 1947-1971 schools in East Pakistan were obliquely subject to resources allocated by the federal government located in West Pakistan. Following the two-part scheme of transfer of resources to the Centre, provincial government of East Pakistan and the local bodies experienced a tighter budget constraint for the supply of schools and recruiting teachers necessary to support the growing school-age population.

The Bangladesh Development Studies
34
34
Figure 4: Per capita Public Expenditure by Provincial Governments,
1952-1968 (in Rupees)
0
10
20
30
40
50
60
70
1952
1953
1954
1955
1956
1957
1958
1959
1960
1961
1962
1963
1964
1965
1966
1967
1968
Per Capita Public Expenditure, East Pakistan
Per Capita Public Expenditure, West Pakistan
Notes: Expenditure data is from “Fifty Years of Pakistan in Statistics”, GoP (1998), Tables
13.30 and 13.31, Vol. 2, while annual figures on the underlying population are from “UN Demographic Yearbook Historical Supplement 1948-1997,” the United Nations (2000). Comparable data on expenditure in East Pakistan for the period 1969-71 was not available.
Figure 5: Per capita Educational Expenditure and Expenditure on Primary
Education by Provincial Governments, 1952-1969 (in Rupees)
0
5
10
15
20
25
30
35
40
1952
1953
1954
1955
1956
1957
1958
1959
1960
1961
1962
1963
1964
1965
1966
1967
1968
Per Capita Education Expenditure, East Pakistan
Per Capita Education Expenditure, West Pakistan
Per Capita Primary Expenditure, East Pakistan
Per Capita Primary Expenditure, West Pakistan
Notes: Expenditure data is from “Fifty Years of Pakistan in Statistics,” GoP (1998), Tables 13.30 and 13.31, Vol. 2, while annual figures on the underlying primary school-age (5-14 years old) population are projected using data from “World Population Prospects: The 2002 Revision” and “World Urbanisation Prospects: The 2001 Revision,” the United Nations.

Asadullah: Educational Disparity in East and West Pakistan
35
35
In the 1960s, following the 1962 Constitution, the above constraint was partially relaxed: rights to revenue, earned internally from provincial sales tax, were returned to the respective province. However, the regional gap in budget size largely remained unaltered, suggesting that revenue loss experienced throughout 1947-71 was primarily owing to transfer of export earnings from the Eastern province to the Centre in West Pakistan.
VI. TESTING FOR THE HYPOTHESIS OF RESOURCE CONSTRAINT
We do not have detailed budgetary data for sufficient time period to causally test the hypothesis of resource crunch. Our earlier analysis of East Pakistani data with that for West Bengal and UP presented in Section IV, we argue, nevertheless serves as a crude test for the above claim in a natural experiment-type set up. Such an experimental framework is defined by the presence of two comparable groups which differed in terms of their exposure to exogenous policy shocks, ceteris paribus. The Indian federal system contains two states–West Bengal and UP–that were comparable to East Pakistan. Yet, the Indian federal system of governance, despite various similarities to the Pakistani federal system, differed in terms of federal laws that potentially curtailed the extent of provincial autonomy in the provision of public goods. Presence of such laws in the Pakistani system provides the equivalent of exogenous policy shocks.
Two key federal systems that distinguished India and Pakistan were as follows. First, the Government of India Act 1935 extended provincial autonomy to eleven provinces of pre-1947 India. This autonomy continued in post-1947 years in West Bengal and UP whereas it was scrapped in 1948 in Pakistan, both the East and the West. Second, provinces within post-partition India were not subjected to any inter-provincial resource transfer as was experienced by East Pakistan. This setting could be viewed in terms of a crude natural experiment-type framework where the treatments were “abolition of provincial autonomy’ and ‘inter-provincial resource transfer.”36 Hence, East Pakistan was the treated group, while the two Indian states comprised the control group.
The federal policy differences aside, these two Indian states experienced growth rates in population similar to East Pakistan, shared a common socio-economic background and had similar educational structures. First, in 1948-49, total population in West Bengal and UP stood at 23.45 and 59.64 million respectively, whilst it was 41.78 (in 1950) in East Pakistan. Therefore, West Bengal had the
36One minor administrative difference remains, however: the system of planned development was introduced in India in 1950, while it was adopted in Pakistan in 1955.

The Bangladesh Development Studies
36
36
smallest school age population. However, initial school participation rates were low in all provinces. Exact data on enrolment rate is unavailable although this can be approximated by comparing data on percentage of primary pupils to total population aged 5-14 years. In 1949, these were 18.60 per cent and 13.07 per cent in West Bengal and UP, whilst the corresponding figure for East Pakistan was 23.8% (in 1950).37 Second, public sector was the major driver of growth in primary schools. In 1947-48, 52 per cent and 88 per cent schools were managed by government and various local bodies in West Bengal and UP.38 Of the remaining (i.e. private) schools, 90 per cent were aided by the government. In subsequent years, share of public schools increased so much so that by 1965-66, 92.4 per cent and 94.8 per cent primary schools were in government ownership in West Bengal and UP respectively. Third, unit cost of primary education stood in the Indian states was much higher than that in East Pakistan.39 Fourth, similar to East Pakistan, provision of primary schooling in these two Indian states was solely a responsibility of the respective provincial government. Federal government in India had little to do with primary education in West Bengal and UP. Fifth, share of education in the total provincial budget was 9 per cent and 12 per cent in West Bengal and UP respectively (Saiyidain et al. 1952, p. 50), whilst this figure was 11 per cent in East Pakistan in 1952.
Comparison of East Pakistan with these two Indian states reveals that, despite
having similar socio-economic background and smaller total of primary schools in
1947, West Bengal and UP surpassed East Pakistan by 1961 in primary school
availability even after adjusting for the underlying population size (Figure 3).
Similarly, total number of students and teachers were much larger in East Pakistan
at the time of the independence. Yet, STR was much lower compared to the Indian
states. Nonetheless, a shortage in teacher supplies plagued the primary schools in
later years, altogether leading to inflation in STR. Table XVII shows the growth of
school size and STR for the period 1948-1962 in the three provinces. The increase
37Figures for the Indian states have been estimated using data from Saiyidain et al. (1952), pp. 152-153. Alternate estimates are available for a narrower age bracket for a later year. For
instance, GoI (1994) reports that 53.6 per cent and 36.3 per cent of the primary school age children were enrolled in school in West Bengal and UP respectively in 1951-52. 38These figures have been calculated using published data reported in GoI (1994). They are consistent with similar estimates reported elsewhere. For instance, Saiyidain et al. (1952)
report 49.4 per cent and 81.7 per cent schools in government and local body management in West Bengal and UP in 1947-48. 39According to one estimates, these were Rupees 7, 11.8 and 10.4 in East Pakistan, West Bengal and UP respectively (Saiyidain et al. 1952, p. 50). Government schools in West Bengal were even costlier.

Asadullah: Educational Disparity in East and West Pakistan
37
37
in STR in East Pakistan has been in the order of 55% compared to only 7% in the
comparing provinces. Similarly, school size increased by 89% in East Pakistan,
whilst primary school size in the Indian provinces recorded a growth of
approximately 24-27%. Such poor growth of primary education facilities in East
Pakistan was in line with the relatively poor literacy rates. According to the Census
of 1951, literacy rates in UP and West Bengal were 10.8 per cent and 24 per cent
respectively compared to 18.8 per cent in East Pakistan. Nonetheless, East Pakistan
gained only 5 percentage points during the decennial period (i.e. 1951-1961), whilst
UP and West Bengal experienced 100% and 41% increase in literacy rate during the
same period.40 This difference in the growth of primary school availability and gains
in literacy rates therefore corroborate the claim that the changes in school
availability in East Pakistan were driven by the twin switches in federal policies that
only affected the Pakistani province via limiting the sources for educational finance. An additional test, premised in yet another natural experiment, can be set up by
comparing educational facilities before and after the disintegration of East and West
Pakistan. If the educational decline in East Pakistan was driven by exogenous
budget constraint imposed by the Centre, political separation must have removed
this in post-1971 period, when East Pakistan emerged as an independent state,
namely Bangladesh. If true, the test predicts a convergence in school supplies
between Bangladesh and Pakistan in post-partition years. Figure 6 documents the
evolution of regional disparity in primary and secondary school availability by
plotting data on the indices of disparities for the period of 1960-80. The index traces
changes in total number of schools per thousand children in East Pakistan relative to
that in the Western wing. To recapitulate, it is defined as:
[Index of Regional Disparity]j = [Disparity Ratio – 1]*100,
where, ‘Disparity ratio’= (Total Schools in East Pakistan)/ (Total Schools in West
Pakistan); j=primary, secondary. Thus the index calculates the annual percentage
change in the disparity ratio relative to that in 1959-60. The zero axis is the “line of
parity/equality” where values below it indicates the relative regional deprivation.
40The literacy rates in UP and West Bengal in 1961 were 20.7 per cent and 34.5 per cent respectively. These figures exclude population in the age group 0-4 years. For details, see Tables 225 and 226, ‘Statistical Abstract of India”, Central statistical Organisation, Department of Statistics, Ministry of Planning, Government of India (1979).

The Bangladesh Development Studies
38
38
TABLE XVII
GROWTH IN PRIMARY SCHOOL SIZE AND STUDENT TEACHER RATIO (STR) IN EAST PAKISTAN AND
SELECTED INDIAN STATES, 1948-1962
West Bengal Uttar Pradesh East Pakistan West Bengal Uttar Pradesh East Pakistan
STR
Index of growth
STR
Index of growth
STR
Index of Growth
School Size
Index of growth
School Size
Index of growth
School Size
Index of growth
1948 29.47 100.00 39.08 100.00 26.73 100.00 74.85 100.00 79.73 100.00 68.22 100.00
1949 30.21 102.52 36.89 94.39 35.95 134.51 81.68 109.12 75.37 94.53 87.36 128.05
1951 32.80 111.29 38.80 99.28 35.37 132.34 95.82 128.02 85.29 106.97 87.01 127.54
1952 33.92 115.12 35.22 90.14 39.95 149.45 98.28 131.30 88.68 111.23 94.63 138.72
1953 34.88 118.35 34.74 88.90 39.57 148.04 102.44 136.86 86.24 108.16 101.10 148.19
1956 31.43 106.64 35.29 90.31 36.77 137.55 91.53 122.28 85.83 107.65 100.93 147.94
1957 31.33 106.31 36.26 92.79 37.91 141.81 91.97 122.87 87.49 109.73 103.18 151.25
1958 31.72 107.62 38.16 97.65 37.40 139.93 92.93 124.16 93.14 116.82 105.16 154.14
1959 32.25 109.44 41.01 104.95 38.71 144.81 94.59 126.37 99.88 125.27 111.86 163.97
1960 31.56 107.10 41.88 107.15 40.53 151.64 94.49 126.23 102.07 128.02 119.64 175.37
1961 31.47 106.78 39.97 102.27 41.35 154.70 94.20 125.85 98.77 123.88 124.90 183.09
1962 31.67 107.48 41.91 107.24 41.51 155.28 93.12 124.40 101.73 127.59 129.31 189.54
Notes: Data on the total number children and teachers in primary schools and the total number of schools in the Indian provinces are from ‘Education in India, 1994’, Central Publication Branch, Government of India (GoI).

Asadullah: Educational Disparity in East and West Pakistan
39
39
Figure 6: Regional Disparity in Primary and Secondary School Availability, 1960-1980
-300
-200
-100
0
100
200
300
1960
1961
1962
1963
1964
1965
1966
1967
1968
1969
1970
1971
1972
1973
1974
1975
1976
1977
1978
1979
1980
Index of regional disparity, primary education
Index of regional disparity, secondary education
Note: Data is from “Fifty years of Pakistan in Statistics” and “Bangladesh Education in
Statistics.’’
The restoration of parity in the availability of primary school (per 1000 children) in the post-1971 years is conspicuous, and unambiguously driven by a shift in the supply of primary schools in Bangladesh. A similar boost in the supply of secondary schools is observed. This finding is remarkable for the following reason. In post-independence years, colleges and universities in Bangladesh took the major share of funds allocated in the First Five-Year Plan, 1973-78 (Sattar 1982, p. 25). The share of pre-higher education in national budget remained unchanged during the Two-Year Plan period, 1978-80, as well. The apparent rebound in the indices of regional disparity in primary and secondary school availability, therefore, arguably provides an effective rebuttal to the null that no external resource constraint applied to the province of East Pakistan during pre-1971 years.
In sum, the two aforesaid tests, akin to natural experiments, provide compelling evidence in support of the hypothesis that educational provision in East Pakistan during the period 1947-71 might have adversely affected owing to a budget squeeze that ensued following the economic hegemony of the central government, located in the Western wing.
Notwithstanding the statistical evidence of educational disparity, we cannot decisively conclude that the observed difference in school infrastructure is a result
The Bangladesh Development Studies
40
40
of “discrimination” by West Pakistan. There are several reasons for this. First, the data on total number of schools might have been noisy. Although we use published government data for our analysis, such data might be problematic: total number of schools might have been under-counted. If under-counting is present and more so in East Pakistan than in the West, the observed difference in total number of schools may simply reflect that bias in regional education statistics. We do not know the extent of inter-regional variation in quality of published education data.
Second, there still remain other potential explanations for difference in educational facilities between East and West Pakistan. For example, there has been significant out-migration of Hindus from East Pakistan to India around the time of the 1947-partition of the Indian subcontinent. By the late 1940s, a large number of upper and middle class Hindus migrated from East to West Bengal.41 This may have affected the education sector adversely if migrants included significant number of Hindus who were previously employed as school teachers in East Bengal. The occupational details of the migrants are not known. There is limited evidence suggesting greater migratory movements amongst non-agriculturists and better-educated individuals (Bharadwaj et al. 2005). Nonetheless, whether differences in migration levels and educational backgrounds of the migrants changed the overall educational profile of East Pakistan is not evident. Bharadwaj et al. (2005) find that West Pakistani districts that saw higher migratory flows gained significantly in terms of literacy between 1931 and 1951. However, for East Pakistan (Bangladesh), migratory flows did not have significant impact on changes in literacy rates.
Besides the above possibilities, differences in population density across provinces could also partly explain inter-regional differences in school growth. Provinces with sparse distribution of population such as N.W.F.P. and Sind could have been allocated disproportionately larger number of new schools.42 This could also have resulted in smaller average school sizes and STR for West Pakistan. Hence, comparison of school conditions in urban East and West Pakistan with similar population density could shed more light on the causes behind the observed disparity. Another possible explanation for disparity could be differences in the relative success in implementing compulsion in school participation. Perhaps more area was brought under compulsory programme in West Pakistan and hence the need for more schools. However, our earlier discussion of enrolment data at the
41 The remaining post-1947 Hindu migration was either from lower urban strata or from East Bengal country side. Around 2.5 million such Hindus are said to have migrated from 1950 through 1956 (Tan and Kudaisya 2000). 42 In 1950, population density (per sq. mile) in Baluchistan, Khairpur, N.W.F.P. and Sind was 11.8, 52.9, 90.3 and 91.6 respectively (Huq 1954).

Asadullah: Educational Disparity in East and West Pakistan
41
41
regional level does not support such a possibility. Lastly, it could also be argued that East Pakistan received favourable treatment in other sub-sectors of education such as post-secondary education, vocational training, higher education, madrasah education and so on, which compensated for lower allocation to and poor development of the primary sector. However, the existing statistics are not supportive of this hypothesis.
VII. CONCLUSION
This paper has revisited the state of educational infrastructure in East and West Pakistan during their quarter century of union. During 1947-71, we observe that school infrastructure declined steeply in East Pakistan. While West Pakistan gained 35,287 additional primary schools, those in East Pakistan embraced a negative growth. By 1971, the total number of primary schools in East Pakistan declined by a total of 902 (compared with the number in 1947). Similarly, the growth of secondary schools suffered. A faster growing primary school age population and a larger total of actual school-going population in East Pakistan left primary (and secondary) schools (as well as class-rooms) over-crowded. In contrast, despite a smaller total of school age population which grew at a relatively smaller rate, West Pakistan enjoyed a higher growth in enrolment, matched by a large increase in the total number of schools and teachers. Additional supply-side inequalities were documented in post-primary education, particularly in higher education. The educational backwardness of East Pakistan was also manifested in relatively low levels of educational attainment and functional literacy.
Identifying the exact causes of observed decline in primary schools in East Pakistan is difficult in the absence of detailed retrospective micro-data. We have, nevertheless, attempted to eliminate many of the key “non-discrimination” type structural explanations for the disparity in educational supplies. We argue that these regional disparities cannot be attributed to regional differences in school types, quality, school age population, and unit costs of schools. Rather, this problem is examined in terms of an outcome of the policies of the central government of Pakistan and in particular, the hypothesis of ‘discrimination.”
The growth in schooling infrastructure in West Pakistan could reflect the “convergence phenomenon” in a federal system where the province with scarce human capital stock experiences greater accumulation following support from the Centre and respective provincial government. However, this does not explain the “divergence phenomenon” or absolute decline of primary schooling facilities in a province such as East Pakistan. We did not find significant regional difference in the share of (primary) education in the respective provincial budget. Large regional

The Bangladesh Development Studies
42
42
gaps prevailed in the size of total provincial education budget. Consequently, the roots of such educational disparity, we argue, could be traced to economic and political arrangements which led to regional differences in the size of total provincial budgets. Due to the alleged unilateral transfer of resources and relocation of provincial tax earnings to the Centre, the government of East Pakistan and local bodies might have experienced a tighter budget constraint for the supply of additional schools or recruiting additional teachers to staff existing schools that served the growing school age population. Comparison of East Pakistani data to that of West Bengal and UP, two Indian (federal) states that did not experience similar inter-provincial transfer of resources, lends indirect support to our claim. Over-and-above, cogent evidence is gathered by comparing availability of primary schools in Pakistan and Bangladesh for the period of 1960-80. It appears that, to some extent, political liberation of East Pakistan has indeed ameliorated the past educational disparities experienced during 1947-71. These two pieces of evidence compel us to accept the hypothesis of an exogenous budget constraint in educational provision in East Pakistan.
It is to be noted that the poor conditions of the education sector in East Pakistan could not be attributed to the general neglect of education among the policy makers in that era. Pakistan’s educational backwardness is duly acknowledged in the reports of the two earliest national commissions on education: the 1959 Sharif Commission and the 1968 Nur Khan Commission. However, both shied away from documenting the growing educational deprivation in primary and secondary levels in East Pakistan. While defining the objectives of the education system, the 1959 report of the Commission on National Education states:
Our education system must play a fundamental part in the preservation of the ideals which led to the creation of Pakistan and strengthen the concept of it as a unified nation….. We lay stress on the necessity to develop an educational programme….. which will cultivate this sense of unity. (GoP, 1959; p. 10)
However, growing educational disparity fed into existing and growing regional economic inequalities. And it is the very disparity in educational opportunities that, inter alia, might have weakened the bond between East and West Pakistan.
It should be pointed out that our research does not imply that the Central government of Pakistan expressly blocked educational development in East Pakistan. Rather, schooling conditions in the Eastern province declined as an unintended consequence of the Centre’s pro-West focus which caused a resource crunch in East Pakistan. The direct evidence of discrimination is largely limited to the pre-plan period of 1948-54, when the Centre perhaps chose to equalise

Asadullah: Educational Disparity in East and West Pakistan
43
43
educational provision between the Eastern and the Western provinces by a deliberately larger allocation of its education budget to the latter. This policy had unanticipated repercussions for educational advancement in the former province.
Notwithstanding the statistical evidence of educational disparity, we are unable to conclude conclusively that the observed difference in school infrastructure is a direct result of ‘discrimination’ by West Pakistan. Other potential explanations for differences in educational facilities between East and West Pakistan still abound although we argue that most of them are unlikely to stand up to careful scrutiny on the basis of available data. We nevertheless exercise caution in interpreting our results.
The evidence of inter-regional disparity in educational inputs such as total number of schools, teacher salary, teacher training and class-size is consistent with the regional divide in school completion, dropouts and functional literacy rate. Future research should attempt to examine in detail the long-term consequences of such human capital inequalities due to disparity experienced by East Pakistan (Bangladesh) during 1947-71.
REFERENCES
Ahmad, Z. 1999. “State versus Education.” In S. Islam, ed., History of Bangladesh .Dhaka: Asiatic Society of Bangladesh.
Ahmed, K. U.1972. Breakup of Pakistan: Background and Prospect for Bangladesh .London: The Social Science Publishers.
Ahmed, V. and R. Amjad. 1984. The Management of Pakistan’s Economy: 1947-82. Pakistan: Oxford University Press.
Akhtar, J. 1963. “Literacy and Education: Fifth release from the 1961 Census of Pakistan.” Pakistan Development Review, 3: 424-442.
Akthar, S. M. 1971. Economic Development of Pakistan. Lahore: Publishers United Ltd.
Auspitz, J., Stephen Marglin, and Gustav Papenek.1971. History of Economic and Political
Dominance of East Pakistan.Ripon Society: Washington, D.C.
Bharadwaj, Prashant, Asim Khwaja and Atif Mian. 2005. “The Big March: The Nature of Migratory Flows during the 1947 Partition of British India.” unpublished manuscript, Harvard University.
Bhatia, B. M. 1979. Pakistan’s Economic Development 1948-78: The Failure of a Strategy. New Delhi: Vikas Publishing House.
Chowdhuri, S. 1972. The genesis of Bangladesh: A Study of International Legal Norms and
Permissive Conscience. New York. Asia Publishing House. Colclough, C. and K. Lewin. 1993. Educating All the Children. Oxford: Oxford University
Press.

The Bangladesh Development Studies
44
44
Curle, Adam. 1969. Educational Problems of Developing Societies, with Case Studies of
Ghana and Pakistan. New York: Praeger.
________1966. Planning for Education in Pakistan: A Personal Case Study. London: Tavistock Publications.
Faaland, J. and J. Parkinson. 1976. Bangladesh: The Test Case of Development. London: C. Hurst and Company.
Falcon, W. and S. Joshep. 1971. “Pakistan’s Development: An Introductory Perspective.” In W. Falcon and G. Papanek, eds., Development Policy II - The Pakistani
Experience. Cambridge, Massachusetts: Harvard University Press.
Feldman, D.1971. Unhappy East Pakistan: A Survey of Inter-regional Inequality in
Pakistan. St. Peter: Jersey: Isle de la Manche.
GoB.1985. Bangladesh Education in Statistics. Dhaka: Bangladesh Bureau of Statistics, Government of Bangladesh.
_____ 1992. Bangladesh Education in Statistics. Dhaka: Bangladesh Bureau of Statistics (BBS), Government of Bangladesh.
GoI. 1968. Report on the Population Projections Worked Out Under the Guidance of the
Expert Committee Set Up by the Planning Commission Under the Chairmanship of
the Registrar General, India. Office of the Registrar General, Ministry of Home Affairs, Government of India. New Delhi.
____ 1979. Statistical Abstract of India. New Delhi. Central Statistical Organisation, Department of Statistics, Ministry of Planning, Government of India (GoI).
____ 1994. Education in India. New Delhi: Government of India, Central Publication Branch.
GoEP. 1995. Statistical Abstract of East Pakistan 1947-48 to 1952-53, Vol. 2. Dacca: Government of East Pakistan (GoEP).
_____ 1956. Statistical Abstract for East Pakistan 1950-51 to 1953-54, Volume 3. Dacca: East Pakistan Bureau of Statistics, Government of East Pakistan (GoEP).
_____1965. Handbook of Economic Indicators of East Pakistan. Dacca: East Pakistan Bureau of Statistics, Government of East Pakistan (GoEP).
_____ 1966. Chronology of the growth of education 1600-1966. Dacca: Bureau of Educational Information and Statistics, Education Directorate, Government of East Pakistan (GoEP).
GoP. 1955. Pakistan, 1953-54. Karachi: Government of Pakistan (GoP).
____ 1958. West Pakistan Yearbook 1958. The Public Relations Department, West Pakistan Government, Government of Pakistan.
____1954. Report of the Commission on National Education. Ministry of Education, Government of Pakistan.
____1963. Educational Statistics for West Pakistan, 1961-62. West Pakistan Bureau of Statistics, Government of Pakistan.

Asadullah: Educational Disparity in East and West Pakistan
45
45
____1965. The Third Five Year Plan 1965-70. Planning Commission, Government of Pakistan.
____1966a. Educational Statistics for West Pakistan, 1963-64, Part 1 (primary education). West Pakistan Bureau of Statistics, Government of Pakistan.
____1966b. Final Evaluation of the Second Five-Year Plan (1960-65). Planning Commission, Government of Pakistan.
____1967. Statistics Handbook of West Pakistan, 1967. Government of Pakistan.
____1968. Mid-Plan Review of The Third Five Year Plan (1965-70). Planning Commission, Government of Pakistan.
____1970. Report of the Panel of Economists on the 4th Five Year Plan, 1970-75. Government of Pakistan.
____1998. Fifty Years of Pakistan in Statistics, Vol. 2 (1947-72), Vol. 3 (1972-82) and Vol. 4 (1982-97). Federal Bureau of Statistics, Government of Pakistan.
Hoodbhoy, P. 1998. Education and the State: Fifty Years of Pakistan. Karachi: Oxford University Press.
Harron, K., and Y. Jan. 1964. “Main Economic Characteristics of the People of Pakistan: Sixth release from the 1961 Census.” Pakistan Development Review, 4: 314-331.
Hasan, P.1998. Pakistan’s Economy at the Crossroads: Past Policies and Present
Imperatives. Karachi: Oxford University Press.
Huq, Mahbub-ul. 1963. The Strategy of Economic Planning: A Case Study of Pakistan. Pakistan: Oxford University Press.
_____1968. “Planning Investment in Education.” In E. Robinson and M. Kidron, eds., Economic Development in South Asia: Proceedings of a Conference held by the
International Economic Association at Kandy, Ceylon. Mcmillan: St Martin’s Press.
Huq, Muhammad S. 1954. Compulsory Education in Pakistan. Studies on Compulsory Education- XII. Paris: UNESCO.
Iqbal, M. 1995. Education in Pakistan. Lahore: Aziz Publishers.
Islam, N. 1972. “Foreign Assistance and Economic Development: the Case of Pakistan.” Economic Journal, 82: 502-530.
Jilani, M. 1964. “Changes in Levels of Educational Attainment in Pakistan: 1951-1961.” Pakistan Development Review, 4: 69-92.
Jones, E. and R. Jones. 1980. “Educational Policy Development in Pakistan: Quest for a National Program.” In M. Ahmed, ed., Contemporary Pakistan. Durham, North Carolina: Carolina Academic Press.
Kazi, A. 1994. Ethnicity and Education in Nation-building in Pakistan. Lahore: Vanguard Books Pvt. Ltd.
Khatun, S. 1991. Development of Primary Education Policy in Bangladesh. Dhaka: Dhaka University Press.

The Bangladesh Development Studies
46
46
Kingdon, G. 1996. ‘‘Private Schooling in India: Size, Nature and Equity-effects.’’ Economic
and Political Weekly 31(51):3306-3314.
LaPorte, Jr., R. 1975. Power and Privilege: Influence and Decision-making in Pakistan. Berkeley: University of California Press.
Mason, E., R. Dorfman and S. Marglin. 1971. Conflict in East Pakistan: Background and
Prospects. London: Bangladesh Students’ Action Committee.
Owen, J. 1960. “Problems of Education in Pakistan.” Educational Record, 41: 253-257.
Peach, W., M. Uzair and G. Rucker. 1959. Basic Data of the Economy of Pakistan .Karachi: Oxford University Press.
Padmanabhan, C. 1986. “Regional Aspects of Financing Indian Education.” In J. Tilak, ed., Education and Regional Development. New Delhi: Yatan Publishers.
Rahman, A.1968. “East and West Pakistan: A Problem in the Political Economy of Regional
Planning.” Occasional Papers in International Affairs No. 20. Centre for International Affairs, Harvard University.
Rao, V. K. R. V. 1972. Bangla Desh Economy: Problems and Prospects. Delhi: Vikas Publication.
Sadeque, A. 1957. Pakistan’s First Five Year Plan in Theory and Operation. Dacca: East Pakistan Government Press.
Saiyidain, K., J. Naik and S. Husain. 1952. Compulsory Education in India. Paris: UNESCO.
Sarmad, K., F. Husain, and G. Zahid. 1989. The Education Sector in Pakistan. Karachi: Pakistan Institute of Development Economics.
Sattar, E. 1982. Universal Primary Education in Bangladesh. Dacca: University Press Ltd.
Sengupta, A. 1971. “Regional Disparity and Economic Development of Pakistan.” Economic and Political Weekly, 45 and 46.
______1971a. “Planning for Disparity.” In Prem Chopra, ed., The Challenge of
Bangladesh: A Special Debate. Bombay: Popular Prokashona.
Seth, K. 1972. Economic Prospects of Bangladesh. New Delhi: Trimurti Publications.
Stern, J. 1971. “Growth, Development and Regional Equity in Pakistan.” In W. Falcon and G. Papanek, eds., Development Policy II - The Pakistani Experience. Cambridge, Massachusetts: Harvard University Press.
Tan, T. and G. Kudaisya. 2000. The Aftermath of Partition in South Asia. New York: Routledge.
UNDP. 1995. Human Development Report. New York: United Nations Development Program.
United Nations. 2000. UN Demographic Yearbook Historical Supplement. Statistics Division, Department of Economic and Social Affairs, the United Nations.
Williams, L. 1972. The East Pakistan Tragedy. London: Tom Stacey.