educator supply and demand in illinois 2001 educator supply and demand in illinois executive summary...
TRANSCRIPT

Educator
Supply and Demand in
Illinois
2001 Annual Report
Illinois State Board of Education
Ronald J. Gidwitz, Chairman Ernest R. Wish State Board of Education State Superintendent of Education and Chief Executive Officer

FOREWORD The Illinois State Board of Education respectfully submits this report to the Governor, the General Assembly, and institutions of higher education in fulfillment of the requirements of Section 2-3.11C of the School Code [105 ILCS 5/2-3.11c]. This report addresses the relative supply and demand for education staff of Illinois public schools. Specifically, this report provides information on:
1. the relative supply and demand for teachers, administrators, and other certificated personnel by field, content area, and levels;
2. state and regional analyses of fields, content areas, and levels with an
over/under supply of educators; and
3. projections of likely high/low demand for educators in a manner sufficient to advise the public, individuals, and institutions regarding career opportunities in education.
Additional information is provided on workforce composition, retirement projections for educators, and attrition rates. We would like to recognize the contributions of Dr. Richard Yong and Dr. Shuwan Chiu, of the Research Division, to this report. Questions concerning this report may be referred to Jim Sweeney ([email protected]), Principal Accountability Consultant, Research Division, Illinois State Board of Education, (217) 782-3950.

1
2001 Educator Supply and Demand in Illinois
Executive Summary Illinois school districts will need to hire about 55,000 new teachers, including about 33,000 new first-time teachers, and 3,500 new administrators over the next four years, but unless the supply of educators vastly outpaces demand, there will not be enough high-quality candidates to give districts many choices. The 2001 Educator Supply and Demand report draws a troubling picture for Illinois schools and mirrors a national trend. Demand outpaces the available supply partly because of early-career teacher flight, retirement, increasing competition for teacher candidates from other states and the private sector, and decreasing interest in education careers among young people. Shrinking Pool. The problem goes far beyond ensuring there are enough teachers to fill the vacancies, however. The size of the teacher pool from which districts can select is shrinking. The quality of teachers in the classrooms suffers when districts have fewer choices and less opportunity to find the best-qualified candidates for their positions. Sometimes they have to “settle” for a teacher who is only partly qualified or who otherwise might not be the best match for the position. More than 42,000 Illinois public school students faced the very real possibility that there would be no qualified teachers in their classrooms when the 2000-2001 school year began. Of the 2,637 unfilled vacancies in the fall of 2000, 2,225 were teaching positions. Half those vacancies were in the Chicago public schools, 28 percent were in the suburban districts of Cook, Lake, Kane, Dupage, McHenry and Will counties, and 22 percent were spread throughout the rest of the state. The remaining unfilled positions were principals and other administrators, counselors, nurses, social workers and other student support staff. Data on unfilled positions for the 2001-2002 school year are still being collected. The competition for would-be teachers is growing significantly. Undergraduate enrollment in teacher preparation programs dropped by 10 percent between 1999 and 2000. Even once they become teachers, many individuals are lured away immediately and others leave in their early years at alarming rates. About half the new teachers produced in Illinois each year never make it into the state’s public school classrooms. Other states are offering financial incentives, including signing bonuses and housing allowances, to attract teachers. Private schools are a favorable option for some individuals. Business and industry recruit teachers as well, especially those in the areas of mathematics, science and computer science. Attrition: Teacher Flight and Retirements. The overall rate at which teachers leave the profession has increased by 60 percent since 1996. While retirement accounts for about 23 percent of teacher attrition, more than 75 percent of teachers who leave do so for reasons other than retirement. Early-career flight, for example, is having a significant impact on the teaching force. Teachers with less than five years of experience leave the profession at relatively high rates – between 8% and 11% per year.

2
Related studies indicate that Illinois loses about 30% of its teachers in the first 3 years on the job. Although their specific reasons are not known, national data indicate that teachers leave because of low salaries, negative school environment and lack of induction and mentoring support. Approximately 12 percent of teachers (15,000) were eligible to retire last school year (i.e., 55 or older with 20+ years of experience). Even though the total number of teachers is increasing, the proportion eligible to retire is expected to continue growing to about 16 percent (21,300) by 2004. The teacher ranks are also the primary source for filling principal and other administrator vacancies. About 60 percent of annual administrator attrition is the result of retirement. Last school year, 25 percent of administrators were eligible to retire. Growing Enrollment. The pressure on teacher and administrator demand will certainly increase with student enrollment projected to grow through 2008. Since 1996, student enrollment has advanced at about 1 percent annually, while the teaching force grew by about 2.4 percent and administrators increased by 2.6 percent. Even at those rates, the workforce is not growing fast enough to meet demand. School district reform efforts, such as class-size reductions, may further exacerbate the problem. Geographic and Subject-Area Shortages. Even if an abundant supply of teachers were available, some parts of the state and some subject-matter areas would still experience shortages. Wide-ranging disparities in salaries and working conditions among school districts statewide contribute to those regional differences. At the same time, there were not enough special education, mathematics and physical education teachers to fill the need in 2000-2001. Demographic Imbalances. The scales tip dramatically when the gender and racial distribution of educators is considered. Racial/ethnic minorities are underrepresented among teachers and administrators, while females dominate the teaching ranks and males are primarily administrators. Minority educators comprise just 15 percent of the teaching force (student enrollment is 40 percent minority statewide), 19 percent of principals and just 4 percent of superintendents. There are three female teachers for every male teacher, and 52 percent of principals and 86 percent of superintendents were male. Bottom Line. The report concludes that
• Educator supply must exceed demand in order to ensure that adequate quantity and high quality exists within Illinois’ teacher and administrator pools.
• Illinois must aggressively recruit qualified individuals into the teaching profession and retain them by providing induction and mentoring support during their early years, and improving compensation and working conditions, especially in poor urban and hard-to-staff schools.
• The educator workforce must become more diverse – more minority teachers and administrators, plus more male teachers and female administrators.

3
Educator Supply and Demand, 2001 I. Educators currently in Illinois public schools In 2001, the Illinois public school system was served by 8,551 administrators, 127,323 teachers, 7,743 school service personnel (e.g., counselors, nurses, etc.), and 5,377 other certified staff (e.g., consultants, librarians, etc.) Minorities are under-represented. Racial/ethnic minorities (including black, Hispanic, Asian/Pacific Islander, and Native American) were clearly under-represented among educators. Minority teachers formed 15% of the teaching force compared to a minority student population of 40%. Minorities formed 19% of the principals in Illinois public schools and 4% of the superintendents (see Figure 1). Females dominate teaching; males dominate superintendent positions. Females dominated the overall teaching force while males dominated district leadership positions. There were three female teachers (76%) for every male teacher (24%); the imbalance is especially acute among elementary and special education teachers. Fifty-two percent of the principals and 86% of the superintendents were male (see Figure 2). More minority educators, male teachers, and female district administrators are needed. Given what we know about the current quantity of minority educators in the workforce, more minority teachers and administrators need to be prepared and recruited into the public schools. More male elementary and special education teachers and female district administrators are also needed. II. Supply—flat in recent years Educator supply is comprised of personnel retained from the previous year, newly certificated personnel, re-entering personnel (i.e., newly hired educators who have prior experience) and students in the pipeline (i.e., those currently enrolled in professional preparation programs). Undergraduate enrollments in professional education programs drop 10%. Generally, the number of newly certified teachers and administrators has remained fairly constant for the last four years. However, undergraduate enrollments in professional education programs dropped 10% between 1999 and 2000, which may signal trouble for the future supply of teachers (see Table 1). Public schools face competition for educators. Illinois public schools must compete with various entities for the educators prepared by the colleges. Many teachers, especially in mathematics, science, and computer science, are lured into business and industry. Other states are drawing teachers away with financial incentives, such as generous signing bonuses and monetary offers for housing Private schools also depend on the same teacher pool to staff their classrooms. Blair (Education Week, February 21, 2001) reported that at least 29 governors had set teacher pay hikes as a priority for the year, while 28 state legislatures had introduced
4
bills aimed at increasing salaries. “The proposals tended to fall into three categories: across-the-board raises, performance-pay plans, and cash bonuses.” Supply needs to exceed demand to ensure quality. With some 57 colleges producing educators, Illinois has always been considered an exporter of educators. But the recent increases in educator demand raise concerns. Previously, Illinois schools had a relatively large pool of candidates to fill vacancies. In recent years, school districts have complained (Klempen and Richetti, 2001) that they now have a much smaller pool of candidates. Fewer choices mean that school districts may have much more difficulty finding qualified teachers for their classrooms. Need for strategies to recruit quality educators. There is an urgent need for strategies to recruit qualified educators into Illinois public schools. Teacher salary structures and working conditions merit special consideration. Illinois needs better information on the competition for teachers, so a study is needed to track a cohort from undergraduate enrollment through graduation, certification, and employment. III. Demand—increasing dramatically While supply has remained relatively stable, demand for teachers and administrators has increased dramatically. Two major factors determine the demand for new teachers: attrition (which includes retirement)and student enrollment. Attrition is on the increase. Over the last four years, the rate at which teachers and administrators have been leaving Illinois public schools has increased dramatically (see Figures 3 and 4). Since 1996, the teacher attrition rate has increased by 60% (from 4.6% to 7.3%) and the administrator attrition rate has increased by 80% (from 3.4% to 6.2). If these trends continue, the demand for additional educators will increase accordingly. Between 2000 and 2001, 9,100 teachers and 518 administrators left education. Early exits contribute to attrition increase for teachers. Teachers with less than five years of experience leave the profession at relatively high rates – between 8% and 11% per year. Related studies indicate that Illinois loses about 30% of its teachers in the first 3 years on the job. Although their specific reasons for leaving are unknown, national data indicate that teachers exit early in their careers due to low salaries, negative school environment and lack of induction and mentoring support. Retirements are going to increase attrition further. Over 2,100 teachers and about 300 administrators who left Illinois public education had 31 or more years of experience. Thus, 23% of teacher attrition and nearly 60% of administrator attrition can be attributed to retirement. In 2001, over 15,000 teachers, or 12% of the workforce, were eligible to retire (i.e., 55 or older with 20 or more years of experience). Over 2,000 administrators, or 25% of the workforce, were eligible to retire. The eligible pool is expected to grow through 2004 for both teachers and administrators (see Table 2). Thus, teacher and administrator attrition due to retirement will increase, however, it will have a much greater impact on the administrator workforce due to its advanced age and experience levels (the teaching force is also aging but does not have the requisite years of experience).

5
Increasing student enrollments through 2008 are likely to further exacerbate teacher and administrator demand. Illinois public school enrollments have been increasing since 1990 and that overall trend is expected to continue through 2008. At the elementary level, enrollments are expected to peak in 2003 and then begin to decline through 2008 (see Figure 5). Secondary enrollments, on the other hand, are expected to continue increasing for the next seven years (see Figure 6). In the last four years, student enrollment has increased by about 1 percent per year, while the full-time teacher workforce increased by an average of 2.4% a year and the administrative workforce increased by an average of 2.6%. It is possible that part of the teacher workforce growth could be attributed to school reform efforts, such as class-size reductions. Educator demand is rising sharply. As Figure 7 shows, demand for new teachers has increased 60% in the last four years (from 7,834 in 1997 to 12,603 in 2001). In that same time period, the demand for first-time teachers has increased 57% while the supply of first-time teachers has remained relatively constant. Thus, districts are hiring more of the available supply to meet the growing demand. The greater the proportion of the new supply that is hired, the more likely it is that districts are hiring less qualified candidates. Due to attrition and workforce growth, overall demand for teachers increased 13% and demand for administrators increased 11% in 2001. While most of the administrator demand was met by the previous year’s teaching force, over 12,600 new teachers (i.e., 7,302 first-time teachers and 5,301 re-entries) had to be hired in 2001. About 55,000 new teachers and 9,000 new administrators/other educators will be needed. Through 2005, Illinois will need about 55,000 (between 46,000 and 64,000) teachers, and about 9,000 (between 7,000 and 12, 000) administrators and other educators. These figures represent the total number of new educators to be hired for the next four years due to increasing demand and attrition. About 60% of the projected demand for teachers will need to be met by first-timers. See Table 3 for details and the page following for the projection methodology. Relative to educator categories, the findings are presented in terms of: (1) the greatest number of educators needed by educator category, and (2) the “need index” expressed as the percent of the 2001 workforce that will need to be replaced. The “need index” indicates the relative importance/need for each educator category. In terms of number, the greatest needs through 2005 in the
1. administrator/other categories include: social worker; guidance counselor; elementary principal; coordinator; librarian/media specialist; psychologist; high school principal; consultant; director; and junior high principal.
2. teacher categories include: self-contained elementary; special education; English/language arts; science; mathematics; social science; physical education; bilingual education; foreign language; and music.

6
Note: For a more meaningful comparison of the categories in terms of number needed, the instructional Staff/Teacher categories were further collapsed where appropriate, e.g., biology, chemistry, etc., were collapsed into one category, science. No similar collapsing was done in the section on need index below. In terms of the need index, the greatest needs through 2005 in the
1. administrator/other educator categories include: consultant; other superintendent (deputy, associate, assistant); social worker; occupational therapist; administrative assistant; physical therapist; director; business manager; coordinator; and junior high principal.
2. teacher categories include: cross categorical; bilingual education; computer tech/programming; English as a second language; Spanish; special education (other); health occupations; language arts; reading; and general science.
IV. Special Concerns Unfilled positions 42,000 students may not have suitably qualified teachers. In September 2000, Illinois public schools reported a total of 2,637 unfilled positions. These positions were budgeted by districts for the school year but were not filled, often because qualified applicants could not be found. Of the 2,637 unfilled positions, 2,225 were teaching positions. The remaining vacancies were administrators and other certificated positions. In 2000, the average pupil-teacher ratio (PTR) was 18.7 to 1, which means that about 42,000 students may have been in classrooms without any suitably qualified teachers. (Note: the 2000 state elementary PTR was 19.3 to 1, and the secondary PTR was 18.1 to 1). More special education, mathematics, and physical education teachers are needed. Illinois currently produces more teachers each year than public schools hire, except in the areas of special education, mathematics, and physical education. However, even when enough teachers are produced, increased demand in the fastest-growing states, lucrative financial incentives such as signing bonuses, and increased competition from industry erode Illinois’ educator supply. Geographic and other factors affect staffing. Regional shortages exist despite the number of educators produced at the state level. For example, 115 administrative and 112 guidance counselor positions went unfilled in 2000 despite the large number of newly certified educators produced the previous year. The geographic location of these positions may well have an impact—there is a wide range among districts in salaries paid and the working conditions for educators. Of the 2,637 unfilled positions, 1,387 (50%) were in the Chicago School District 299 (including 368 elementary classroom teaching positions), 761 (28%) were in the suburban districts of Cook, Dupage, Kane, Lake McHenry and Will counties, and 568 (22%) were in the rest of the state. Conditions in these “hard-to-staff” districts must be identified and examined. The subject areas with the greatest number of unfilled positions were: special education (662), elementary teacher (453), mathematics (112), guidance counselor (112), and physical education (103). See Table 4 for the complete list of unfilled positions by subject.

7
Educator quality called into question. The media recently reported that a small number of Illinois teachers consistently failed key examinations required for certification. Yet, some Illinois classrooms are being staffed by such teachers. Also, Chicago School District 299, Illinois’ largest, uses individuals who hold only substitute certification, not full teacher certification, to staff its classrooms indefinitely. Based on the U.S. Department of Education Schools and Staffing Survey, Ingersoll (1999) reported that out-of-field teaching is rampant nationally, including in Illinois. Out-of-field teaching is often defined as the lack of certification or a lack of academic qualifications. If Illinois wants to have a clear picture of the extent of out-of-field teaching in this state, an independent study is needed to examine educator quality in Illinois schools. H.R 1 requirement. Recently, the President signed into law H.R 1, an education bill “to close the achievement gap with accountability, flexibility, and choice, so that no child is left behind.” Among the requirements of this bill is the need to have a qualified teacher in every classroom. Although the impact of this requirement is unclear at this time, the end result will be the need to train more highly qualified educators. V. Conclusion Overall, the supply and demand picture remains troubling. While the supply side has remained relatively flat, educator demand has increased dramatically for the last 4-5 years. Increasing student enrollments are expected to drive increased educator demand. At the same time, attrition is escalating. Early-career teacher flight will continue to significantly impact demand, as will retirement, especially for administrators. Districts are left with fewer candidates to choose from and less opportunity to find the best qualified candidates for positions. Thus, supply and demand affect not only educator quantity, but also educator quality.

8
References Illinois State Board of Education. (2001). Illinois Public School Enrollment Projections:
2001-02 – 2009-10. Springfield, IL. Blair, J. (2001, February 21). Lawmakers plunge into teacher pay. Education Week, p.
1. Illinois State Board of Education. (2000). Educator Supply and Demand. Springfield,
IL. Ingersoll, R. (1999). The problem of underqualified teachers in American secondary
schools. Educational Researcher, 28(2), 26-37. Klempen, R. A. and Richetti, C. T. (2001, December). Greening the next generation of
principals. Education Week on the Web. Retrieved December 12, 2001 from the World Wide Web: http://www.edweek.org/ew/newstory.cfm?slug=15klempen.h21.

9
Appendices

10
TABLE 1: Professional Education Enrollments Professional Preparation Enrollments Change 1999 2000 n % Undergraduate Full-Time 21,806 19,612 -2,194 -10% Undergraduate Part-Time 3,087 2,744 -343 -11%
Total 24,893 22,356 -2,537 -10% Graduate Full-Time 3,415 3,857 442 13% Graduate Part-Time 11,709 12,114 405 3%
Total 15,124 15,971 847 6% SOURCE: Division of Professional Preparation
Figure 2: Teachers by Gender (Percents)
76 83
50
88
24 17
50
12
0
20
40
60
80
100
All Elementary Secondary Sp.EducationFemale Male
Figure 1: Racial-Ethnic Distribution (Percents)
60
21 15
3 0
85
10 4 1 0
81
16 3 0 0
96
3 0 0 00
10 20 30 40 50 60 70 80 90
100
White Black Hispanic Asian/PI Native Am.Students Teachers Principals Superintendents

11
Figure 3: Historical Teacher Attrition
0%1%2%3%4%5%6%7%8%9%
10%
1994 1995 1996 1997 1998 1999 2000
Figure 4: Historical Administrator Attrition
0%
2%
4%
6%
8%
10%
12%
14%
1994 1995 1996 1997 1998 1999 2000

12
Table 2: 2001 Projected Eligible to Retire Projected Eligible Pool* Teachers 2001 2002 2003 2004
Eligible to Retire 15,607 17,903 19,675 21,373 % of Workforce 12% 14% 15% 16% Workforce 127,323 130,379 133,508 136,712
Administrators Eligible to Retire 2,123 2,498 2,771 2,952 % of Workforce 25% 28% 31% 32% Workforce 8,551 8,773 9,001 9,235
*Teacher projections assume 2.4% annual workforce growth and 10% annual attrition in
the eligible pool. Administrator projections assume 2.5% annual workforce growth and 10% annual attrition in the eligible pool.
Figure 5: Elementary Enrollments (K-8)
1,280,000
1,300,000
1,320,000
1,340,000
1,360,000
1,380,000
1,400,000
1,420,000
1,440,000
1996 1998 2000 2002 2004 2006 2008
Projections

13
Figure 7: Number of New Teachers Hired
0
1,000
2,000
3,000
4,000
5,000
6,000
7,000
8,000
9,000
10,000
11,000
12,000
13,000
14,000
1991 1992 1993 1994 1995 1996 1997 1998 1999 2000 2001
Re-EntryFirst-Time
Figure 6: Secondary Enrollments (9-12)
500,000
520,000
540,000
560,000
580,000
600,000
620,000
640,000
1996 1998 2000 2002 2004 2006 2008
Projections

Table 3: Projected Need for Educators [2002-05]
Projected Need Through 2005 Low Middle High Need Administrative
Total Employed
2001 Estimate Estimate Estimate Index Regional Supt./Asst. 92 16 38 60 41.3%District Supt. 852 221 262 303 30.7%Other Supt. (Deputy, Assoc., Asst.) 407 172 295 418 72.5%Admin Assistant 149 47 78 109 52.3%Business Manager 165 49 78 106 47.2%Director/Asst. 1,102 454 540 625 49.0%Elem. Principal/Asst. 2,713 740 984 1,227 36.3%Jr. High Principal/Asst. 1,017 345 468 591 46.0%High School Principal/Asst. 1,443 463 575 687 39.9%Jr./Sr. High Dean 611 198 227 255 37.1%
Other Certified Staff
Consultant 744 362 549 736 73.8%Coordinator 1,887 757 874 991 46.3%Library/Media Specialist 1,960 514 740 966 37.8%Supervisor 520 107 132 156 25.3%Occupational Therapist 60 34 33 31 54.3%Physical Therapist 23 12 11 11 49.1%
School Service Personnel
Guidance Counselor 2,900 785 1,070 1,355 36.9%Nurse 921 290 383 475 41.5%Psychologist 1,426 564 620 676 43.5%Social Worker 2,479 1,253 1,552 1,852 62.6%
Other Position 200 44 47 50 23.4%
Total: Non-Instructional Staff 21,671 7,429 9,554 11,679 44.1% Instructional Staff
Art 2,636 1,112 1,373 1,635 52.1%At-Risk / Pre-K 1,315 566 593 621 45.1%Bilingual Education 2,233 1,654 1,735 1,815 77.7%Computer Tech/Programming 1,150 663 859 1,055 74.7%Driver Education 595 117 161 205 27.1%English as a Second Language 618 399 423 446 68.4%English/Lang. Arts - English 5,246 1,787 2,370 2,953 45.2%English/Lang. Arts - Language Arts 3,111 1,464 1,747 2,031 56.2%English/Lang. Arts - Other 716 273 325 377 45.4%English/Lang. Arts - Reading/Remedial Reading 1,737 735 925 1,114 53.2%Foreign Language - Other 818 274 274 273 33.5%Foreign Language - Spanish 1,903 1,099 1,241 1,383 65.2%Gifted Education 660 251 313 375 47.4%Health Education 583 188 220 252 37.8%Learning/Resource Center Library 387 113 168 224 43.5%

Mathematics 6,882 2,446 2,997 3,548 43.6%Music - Instrumental/Vocal 3,878 1,420 1,462 1,503 37.7%Other Instructional 2,314 1,330 1,562 1,793 67.5%Physical Education 6,789 1,633 2,035 2,437 30.0%Science - Biology 1,462 493 618 742 42.2%Science - Chemistry 826 310 415 521 50.3%Science - Earth Science 289 96 122 148 42.2%Science - General Science 2,784 1,216 1,477 1,737 53.0%Science - Other 291 30 77 123 26.4%Science - Physical Science 334 148 144 140 43.1%Science - Physics 391 137 157 176 40.1%Self-Contained Elementary 42,158 13,443 16,713 19,983 39.6%Social Science 5,733 2,013 2,408 2,803 42.0%Special Ed. - Behavior Disordered 2,216 688 674 660 30.4%Special Ed. - Cross Categorical 3,610 2,754 2,898 3,041 80.3%Special Ed. - Deaf/Hard of Hearing 593 158 192 227 32.5%Special Ed. - EMH/TMH 1,926 297 426 556 22.1%Special Ed. - Learning Disabled 7,193 2,306 2,406 2,505 33.4%Special Ed. - Other 2,931 1,585 1,794 2,002 61.2%Special Ed. - Physically Handicapped 273 59 62 65 22.8%Special Ed. - Speech & Lang Impaired 2,527 1,234 1,322 1,411 52.3%Special Ed. - Visually Impaired 212 50 64 78 30.2%Title 1- Remedial Math/Reading 3,229 724 959 1,194 29.7%Voc/Tech - Agriculture 319 101 125 148 39.1%Voc/Tech - Business/Marketing/Mgt. 1,358 262 373 485 27.5%Voc/Tech - Family/Consumer Sc 1,180 305 372 439 31.5%Voc/Tech - Health Occupations 72 35 41 46 56.3%Voc/Tech - Industrial Occupations 1,533 238 335 433 21.9%Voc/Tech - Vocational Ed 312 115 134 153 43.0%
Total: Instructional Staff 127,323 46,323 55,091 63,859 43.3% TOTAL 148,994 53,752 64,645 75,538 43.4%
Note: Column totals and/or subtotals may vary due to rounding.

Projection Methodology— Future Needs The projections of the needs for educators were based mainly on two Teacher Service Record (TSR) variables: (1) the workforce (the number of full-time educators employed) in each category, and (2) the attrition rate (the ratio of the number of educators who left the education system to the number in the workforce) for each category. The educator categories are listed in Appendix G. The Workforce Component: First, the workforce trend since 1993 was examined. Then, the annual percentage changes were computed and an average was derived. Generally, the yearly workforce for each category was projected based on the historical trend and the application of the average percentage change for each category. The Attrition Rate Component: The trend for attrition rates since 1996 was examined. (Attrition rates for years prior to 1996 were not considered because of the effects of the Early Retirement Incentive program of 1993 and 1994.) The annual percentage changes were computed and an average was derived. Generally, the yearly attrition rate for each category was projected based on the historical trend and the application of the average percentage change for each category. Modifying Factors: In addition to the workforce and attrition trends, other factors considered were the laws/conventions governing the Illinois education system. For example, there will be only one district superintendent for each district and as districts consolidate, the number of district superintendents will likely decline. On the other hand, the need for other superintendents (deputy, associate, assistant) will likely increase. While the data do not show a strong correlation between student enrollment and workforce growth, consideration was given to student enrollment in the projection of selected categories, including the greater need for secondary teachers over elementary teachers. Projection of Future Need—Low Estimate: Based on the actual 1998-2000 attrition rates, an average attrition rate was computed for each educator category. (Attrition rates prior to 1998 were considered too low for computing this average). This rate was applied to the projected workforce to derive the need for each future year due to attrition. The sum of the future need due to attrition and the yearly change in the projected workforce (difference in the workforce) provided the projected total future need for each year. Projection of Future Need—High Estimate: The trend in the attrition was considered. Based on the changes in attrition rates between 1996 and 2000, an average rate was computed for each educator category. This rate was applied to the projected workforce to derive the need for each future year due to attrition. The sum of the future need due to attrition and the yearly change in the projected workforce (difference in the workforce) provided the projected total future need for each year. Since most of the categories showed increasing trends, this part of the projection process produced the higher level estimate of the future need for educators. Projection of Future Need—Middle Estimate: The average of the low and high estimates was computed to derive the middle estimate. Need Index: The index for each category is its projected need (middle estimate) expressed as a percent of its 2001 workforce.

Table 4 : Number of Unfilled Positions in September 2000 [FTE]
Elementary
(K-8) Secondary
(9-12) Total FTE Administrative Elem. Principal 16.50Elem. Asst. Principal 26.50Secondary Principal 14.00Secondary Asst. Principal 15.50Other Admin. 42.50
Other Certified Staff Adult Education 8.00Librarian/Media Specialist 102.38Therapist (Phys./Occupational) 8.25Guidance Counselor 111.75Psychologist 37.15Social Worker 29.63
Instructional Staff Pre-Kindergarten 31.00Kindergarten 52.65Standard Elementary Instructor 453.00
Vocational/Technical Education Agriculture 4.00Business, Marketing, and Mgt. 36.16Family and Consumer Sciences 15.83Industrial 46.80Cooperative Vocational Educ. 5.50
Instructional Areas Art 51.05 12.10 63.15Bilingual Education 66.00 17.30 83.30Computer Literacy/Technology 30.00 20.90 50.90English as a Second Language 11.50 2.40 13.90English/Language Arts 14.60 72.40 87.00Foreign Language 17.97 58.00 75.97Gifted 7.40 0.30 7.70Health Education 3.60 10.70 14.30Mathematics 34.80 77.20 112.00Music (instrumental/vocal) 79.63 17.30 96.93Physical Education 59.30 44.10 103.40Reading 42.15 10.10 52.25Science – Chemistry 2.10 11.10 13.20Science – Physics 1.60 6.00 7.60Science – Other 22.00 56.70 78.70Social Studies/History 4.00 53.00 57.00
Special Education Speech and Language Impaired 83.58 11.85 95.43Behavior Disordered 38.83 22.35 61.18Learning Disabled 108.70 45.00 153.70Cross Categorical 160.10 78.90 239.00Other Special Education 69.90 43.10 113.00
Total All Unfilled Positions 2636.71

2001 Technical Report
Educator Supply and Demand
in Illinois
Illinois State Board of Education
Ronald J. Gidwitz, Chairman Ernest R. Wish State Board of Education State Superintendent of Education and Chief Executive Officer

i
FOREWORD This technical report formed the basis for the annual report that was submitted to the Governor, the General Assembly, and institutions of higher education in fulfillment of the requirements of Section 2-3.11c of the School Code [105 ILCS 5/2-3.11c]. We would like to recognize the contributions of Dr. Richard Yong and Dr. Shuwan Chiu, of the Research Division, to this report. Questions concerning this report may be referred to Jim Sweeney ([email protected]), Principal Accountability Consultant, Research Division, Illinois State Board of Education, (217) 782-3950.

ii
TABLE OF CONTENTS Page Summary of Findings......................................................................................................... vi
Recommendations................................................................................................................x
I. Workforce Composition ...................................................................................................1 Classroom Teachers ............................................................................................................1 School and District Administrators........................................................................................2 II. Supply Indicators .......................................................................................................................4
Personnel Retained from the Previous Year ........................................................................4 Newly Certified Educators ....................................................................................................5 Re-entering Personnel..........................................................................................................6 Students in the Pipeline........................................................................................................6
III. Demand Factors ........................................................................................................................8 Changes in Student Enrollments ..........................................................................................8 Workforce Growth
Total Educator Workforce .......................................................................................10 Administrator Workforce Growth.............................................................................10 Teacher Workforce Growth.....................................................................................11
Teacher Demand Number of New Teachers Hired .............................................................................12 Change in Demand for Teachers............................................................................13
Administrator Demand Number of New Administrators Hired .....................................................................13 Change in Demand for Administrators....................................................................14
Retirement Projections Age Distributions of Teachers and Administrators..................................................16 Experience Distributions for Teachers and Administrators.....................................17 Eligible to Retire......................................................................................................17 Likely Retirements by Position................................................................................18 Likely Retirements by Assignment..........................................................................19 Projections of Educators Likely to Retire through 2004-05.....................................19
Attrition Rates Teachers.................................................................................................................21 Administrators.........................................................................................................21 Attrition by Years of Experience .............................................................................22
IV. Over/Under Supply of Educators ..........................................................................................24
Over/Under Production of New Educators .........................................................................24 Regional Shortages: Unfilled Positions ..............................................................................25

iii
Page
V. Projections of Likely High Demand........................................................................................27 The Future Need for Educators ..........................................................................................27
References........................................................................................................................30 Definition of Terms ...........................................................................................................31 Appendices ...................................................................................................................................32

iv
TABLE OF TABLES AND FIGURES TABLE Page 1 Retention by Position................................................................................................4 2 New Certificates Issued ............................................................................................5 3 Number of Re-entries Hired in 2000-01 [FT]............................................................6 4 Professional Education Enrollments .......................................................................7 5 Number of Program Completers ..............................................................................7 6 Enrollment Projections through School Year 2008 ................................................8 7 Educator Workforce Growth Rates [FT] ................................................................10 8 Administrator Growth Rates [FT] ...........................................................................10 9 Teacher Workforce Growth Rates [FT] ..................................................................11 10 New Teachers Hired in School Year 2001 [FT]......................................................12 11 Largest Percent Increase in Demand.....................................................................13 12 New Administrators Hired in School Year 2001 [FT]............................................14 13 2001 Change in Administrator Demand.................................................................14 14 Projected Eligible to Retire 2001-2004...................................................................18 15 Educators Likely to Retire in 2001-02 ....................................................................18 16 Projected Educator Retirements through 2004-05 ...............................................20 17 2001 Administrator Attrition Rates [FT].................................................................22 18 Over/Under Production of New Educators............................................................24 19 Number of Unfilled Positions in September 2000 [FTE] ......................................26 Figure 1 Teachers by Gender (Percents)................................................................................1 2 Racial-Ethnic Distribution (Percents) ......................................................................2 3 Secondary Enrollments (9-12) ..................................................................................9

v
TABLE OF TABLES AND FIGURES (con’t.)
Figure Page 4 Elementary Enrollments (K-8) ..................................................................................9 5 Number of New Teachers Hired .............................................................................12 6 2001 Age Distribution – Teachers .........................................................................16 7 2001 Age Distribution – Administrators ................................................................16 8 Years of Experience – Teachers 2001....................................................................17 9 Years of Experience – Administrators 2001..........................................................17 10 Historical Teacher Attrition.....................................................................................21 11 Historical Administrator Attrition...........................................................................21 12 Teacher Attrition Rates– 3 Year Average ..............................................................22 13 Administrator Attrition Rates– 3 Year Average ....................................................23 14 Instructional Unfilled Positions..............................................................................25 15 Administrative Unfilled Positions ..........................................................................25

vi
Summary of Findings Overall, the supply and demand picture remains troubling. Teachers and administrators are leaving education at an increasing rate. Since 1996, the teacher attrition rate has increased 60% (from 4.6% to 7.3%) and administrator attrition has increased by 80% (from 3.4% to 6.2%). In that same time period, the number of unfilled positions across the state has nearly doubled. While only a small percentage of the workforce is likely to retire in the next four years, about 24,000 teachers and administrators will be eligible. Student enrollments are expected to increase through 2008 which is likely to exacerbate demand, especially at the secondary level. On the supply side, the number of newly certified teachers and administrators has remained fairly constant for the last four years. Illinois currently produces more teachers each year than public schools hire, except in the areas of special education, mathematics, and physical education. However, increased demand in the fastest growing states, lucrative financial incentives such as signing bonuses, and increased competition from industry contributes to the erosion of Illinois’ supply of educators. Furthermore, undergraduate enrollments in professional education programs dropped 10% between 2000 and 2001. Following is a summary of the findings from the third annual report on educator supply and demand prepared pursuant to Section 2-3.11c of the Illinois School Code. I. What is the composition of the current teaching and administrative
staff?
• Females dominated the teaching force while males dominated district leadership positions. There were three female teachers (76%) for every male teacher (24%). Fifty-two percent of the principals and 86% of the superintendents were male.
• Minorities (including black, Hispanic, Asian/Pacific Islander, and Native American) were
clearly under-represented among educators. Minority teachers formed 15% of the teaching force compared to a minority student population of 40%. Minorities formed 19% of the principals in Illinois public schools and only 4% of the superintendents.
• Illinois educators have high levels of education. Fifty-four percent of the teachers held
bachelor’s degrees, and 46% had degrees at the master’s level or higher. All administrators possessed at least a master’s degree; 11% of the principals and 65% of the superintendents held doctorates or other advanced degrees.
II. What is the relative supply of educators? Supply includes all educational personnel available to the schools, regardless of whether they are currently employed by schools or not. Indicators of supply include: (1) personnel retained from the previous year; (2) newly certificated personnel; (3) re-entering personnel, i.e., newly hired educators who had prior experience; and (4) students in the pipeline, i.e., those currently enrolled in professional preparation programs.

vii
• The largest supply of educators is the previous year’s workforce. In 2001, 129,557 educators or 89% of the previous year’s total workforce were retained to work in Illinois public schools. The retention rate for all administrators was 85% while the retention rate for teachers was 90%.
• The second largest source of supply is newly certified or “first-time” teachers. In 2001,
17,693 new certificates were issued (1,552 administrative, 15,068 instructional, 293 provisional, and 780 school service personnel).
• The third major source of supply includes educators returning to the profession. In 2001,
5,993 or 4% of the educators were re-entries to the Illinois public school system.
• In fall 2000, there were 19,612 undergraduate and 3,857 graduate students enrolled full-time in Illinois professional preparation programs. When compared to 1999, there was a 10% decrease in undergraduate enrollments and a 6% increase in graduate enrollments.
III. What is the relative demand for educators? Demand refers to the need for educational personnel to fill positions. Demand factors include: (1) changes in student enrollments; (2) workforce growth; (3) retirements; and (4) attrition (i.e., the rate at which educators leave the profession). Student Enrollment and Workforce Growth
• lllinois public school enrollments have been increasing since 1990 and that overall trend is expected to continue through 2008. At the elementary level, enrollments are expected to peak in 2003, and then begin to decline. On the other hand, secondary enrollments are expected to continue increasing for the next seven years before declining.
• The educator workforce is growing at a faster rate than student enrollment. In 2001, the
total full-time educator workforce was 148,994, representing an increase of 3,690 or 2.5% over the previous year’s total. In the same period, student enrollments only increased 1%.
• The total number of full-time administrators employed in Illinois public schools for 2001 was
8,551, an increase of 236 (2.8%) from last year’s total. Since 1996-97, the total number of administrators has increased by an average of about 200 per year.
• The total number of full-time teachers employed in Illinois public schools for 2001 was
127,323, an increase of 3,044 (2.5%) from school year 2000. In the last five years, the teaching force has increased by about 3,000 per year.
Retirements
• Compared to teachers, administrators as a group are older and have more work experience. While 38% of the teachers are aged 50 or older, 60% of the administrators are at least 50 years old. While 9% of the teachers have 31 or more years work experience, 23% of the administrators have at least 31 years work experience.
• In 2001, 12% of the teaching force and 25% of the administrative force were eligible to
retire (i.e., aged 55 or older with 20 or more years of experience). By 2004, it is projected

viii
that 16% of the teaching workforce (n=21,373) and 32% of the administrator workforce (n=2,952) will be eligible to retire.
• It is estimated that between 5,246 and 7,786 educators are likely to retire in the next four
years. “Likely-to-retire” is defined as an educator who is at least 60 years old and has 31 or more years of experience.
• Between 650 and 950 administrators or between 8-11% of the workforce, are likely to retire
in the next four years. Positions with the highest percent likely to retire are: regional superintendents/assistants (36%), district superintendents/assistants (18%), other superintendents and elementary/high school principals (13%).
• The teacher workforce will have the lowest expected retirement rate – between 3-5% of the
current workforce or 3,000-6,000 teachers over the next four years. Attrition
• Since 1996, the attrition rates for educators have risen dramatically. The attrition rate for administrators increased by over 80%, from 3.4% in 1996 to 6.2% in 2000. The attrition rate for teachers increased by nearly 60%, from 4.6% in 1996 to 7.3% in 2000. (The attrition rate is the rate at which educators leave the education profession.)
• Teachers with less than five years of experience leave the profession at relatively high
rates—between 9-11%. After five years experience, the rate declines and stabilizes until after 31 years when the rate increases steeply (25-33%) because of retirements.
• Administrators with less than one year of experience have high attrition rates (23%).
Between three and 31 years of experience, administrators leave the profession at very low rates of between 2-5%. Administrator attrition rates rise dramatically after 31 years of experience (in the 20-25 % range) due to retirement.
IV. What areas have an over- or under-supply of educators? Educator shortages were analyzed in two stages. First, the supply of new educators was compared to the number of first-time teachers hired to determine areas in which institutions are producing too many or too few educators. Second, unfilled positions were examined to see where regional shortages exist (i.e., where supply has not met local demand despite the relatively large number of teachers entering the workforce each year).
• Areas of over-production include: Social Science, Guidance Counselor, Nurse, and Administrator.
• Areas of under-production include: Special Education, Mathematics, and Physical
Education.
• There were 2,637 unfilled positions reported in September 2000, half of which (n=1,308) were in the Chicago School District #299. Another 28% were in Cook and the surrounding collar counties.

ix
• The areas with the greatest number of unfilled positions were: Elementary Teacher (453), Cross Categorical (239), Learning Disabled (154), Other Special Education (113), Mathematics (112), and Guidance Counselor (112).
V. What are the projected areas of high demand in Illinois? Projections of likely high demand areas were made in order to advise the institutions of higher education of future career opportunities in education. The findings are presented in terms of: (1) the greatest number of educators needed by educator category, and (2) the need index defined as the ratio of the number of educators needed through 2005 to the number of the 2001 workforce. Through 2005, it is estimated that Illinois will need about 55,000 teachers of which 33,000 will be first-time teachers. In that same time period, Illinois is expected to need about 3,500 administrators and nearly 6,000 other educators. In terms of number, the greatest needs through 2005 in the
(a) administrator/other educator categories include: social worker; guidance counselor; elementary principal; coordinator; librarian/media specialist; psychologist, high school principal; consultant; director; and junior high principal.
(b) teacher categories include: self-contained elementary; special education; English/language arts; science; mathematics; social science; physical education; bilingual education; foreign language; and music.
In terms of the need index, the greatest needs through 2005 in the
(a) administrator/other educator categories include: consultant; other superintendent; social worker; occupational therapist; administrative assistant; physical therapist; director; business manager; coordinator; and junior high principal.
(b) teacher categories include: cross categorical; bilingual education; computer
tech/programming; English as a second language; Spanish; special education (other); health occupations; language arts; reading; and general science.
Future Directions
• Electronic Collection of Unfilled Positions. A web application to collect and report the unfilled positions at the district level was developed by the Illinois State Board of Education (ISBE) and was implemented in December 2001. As of January 3, 2002, 107 districts had applied to use the system and 102 of them had submitted data. Data are analyzed as they are submitted, so the final unfilled positions report will be available as soon as the last district has submitted its data.
• District Survey of Over/Under Supply. After last year’s report, the biggest concern from
policy-makers was that the shortages reported at the state-level did not always match the anecdotal reports they receive from individual districts. In order to address those concerns, a survey was developed to collect districts’ perception of the over- and under-supply of

x
educators and it is being implemented in conjunction with the unfilled positions web application. Districts are asked to rate the supply of qualified applicants for various educational positions on a five-point scale (from -2 severe Under-supply to +2 Severe Over-supply).
• Data Warehouse. For the last two years, the ISBE and the Illinois Board of Higher
Education (IBHE) have worked with representatives from higher education to develop a data warehouse that will electronically collect and analyze data from the 57 teacher preparation institutions in Illinois and combine it with select teacher certification and employment data. The data warehouse has been designed, constructed, and beta-tested by the University of Illinois- Urbana/Champaign. A series of regional information workshops was held last year and the U of I is currently collecting enrollment data from all 57 Illinois teacher preparation institutions. At the time of this writing, about 30% of the institutions had successfully submitted their 2001 data.
Recommendations Based on the findings of this report, the following are recommended:
• Reduce attrition in the first five years of teaching through mentoring and induction programs. ISBE should seek funding (federal and state) that will provide for establishing mentoring programs in districts where there are high teacher attrition rates.
• Professional education institutions should strive to produce more teachers in the areas of
special education, mathematics, and physical education.
• The ISBE should collaborate with school districts to find ways to attract newly certified administrators and guidance counselors into their respective professions. Despite an over-supply of these educators, there were 115 unfilled administrative positions and 112 unfilled guidance counselor positions in September 2000.
• The ISBE, the IBHE, and the Illinois Community College Board (ICCB) should collaborate
with various professional organizations in an effort to attract minorities and males to the teaching profession.
• Although this report does not specifically address educator quality, it is a component that
needs to be included in the study of educator supply and demand. Therefore, it is recommended that an independent study of educator quality be commissioned by the Joint Education Committee.

1
I. Workforce Composition This chapter provides contextual information in terms of profiles of full-time teachers, principals, and superintendents employed in Illinois public schools in school year 2001. Included are all full-time elementary, secondary, and special education teachers. Only school principals and district superintendents listed as full-time employees in the Teacher Service Record are included in this narrative. Excluded are part-time teachers and administrators who are designated as assistants, associates, or deputies. Classroom Teachers Number of Teachers In school year 2001, Illinois public school students were taught by 127,323 full-time teachers, an increase of over 3,000 from last year. Included in this number were 74,982 elementary teachers (including junior high), 30,839 secondary teachers, and 21,502 special education teachers. Gender of Teachers As was found in previous years, females make up the vast majority of the teaching force. Overall, there were three female teachers (76%) for every one male teacher (24%). However, the degree to which females dominated the teaching profession varied by level or teaching assignment, as shown in Figure 1. There were nearly five females for every male among elementary teachers and about seven females for every one male special education teacher. The gender ratio was balanced among secondary teachers, one female for every male.
Figure 1: Teachers by Gender (Percents)
7683
50
88
2417
50
12
0
20
40
60
80
100
All Elementary Secondary Sp.EducationFemale Male
Age of Teachers On average, teachers in Illinois public schools were 43 years old. As illustrated below, nearly two out of every five teachers (38%) were at least 50 years old. This may have implications in terms of the need for teachers to replace those who will be retiring in the near future. In school year 2001, the age distribution for teachers was:
Less than 30 years old 16% 30-39 years old 22% 40-49 years old 25% 50 years or older 38%

2
Race/Ethnicity of Teachers The racial/ethnic distribution of teachers is virtually identical to last year’s. Collectively, minority teachers (including black, Hispanic, Asian/Pacific Islander, and Native American) form 15% of the teaching force compared to a minority student population of 40%. The racial/ethnic distribution is shown in Figure 2. Some educators consider it important for the teacher racial-ethnic distribution to reflect the student racial-ethnic distribution in order to provide role models for the students. Availability of minority teacher candidates is an important factor affecting the racial-ethnic ratios between teachers and students. Another factor may be the organization of the education system in terms of districts and schools; it is not always possible to hire staff to reflect the exact proportions of minority students.
Figure 2: Racial-Ethnic Distribution (Percents)
60
2115
3 0
85
104 1 0
81
16
3 0 0
96
3 0 0 00
102030405060708090
100
White Black Hispanic Asian/PI Native Am.
Students Teachers Principals Superintendents
Education of Teachers Almost every teacher in the Illinois public school system possessed at least a bachelor’s degree. While 54% of the teachers held bachelor’s degrees, 46% had degrees at the master’s level or higher. A very small proportion of the teaching force (0.2%) did not have college degrees; examples of teachers without degrees include vocational education instructors holding provisional certificates. School and District Administrators Number of Administrators In school year 2001, leadership in attendance centers was provided by 3,603 school principals, while leadership in the districts was provided by 852 superintendents. As mentioned previously, these principals and superintendents were listed as full-time employees in the Teacher Service Record file. Gender of Administrators The ratio between the two genders appears to be more balanced for principals compared to the ratio for teachers. In school year 2001, 48% of the principals were females and 52% were males. However, males clearly dominated among superintendents; 86% of the superintendents were males.

3
Age of Administrators On average, principals in Illinois public schools were 50 years old and superintendents were 53 years old. The age distribution of principals and superintendents was: Principals Superintendents Younger than 30 years old 1% 0% 30-39 years old 10% 2% 40-49 years old 27% 14% 50 years or older 62% 84% Sixty-two percent of the principals and 84% of the superintendents were at least 50 years old. This may have serious implications in terms of the need for staff with administrative certificates to replace those who will be retiring in the very near future. Race/Ethnicity of Administrators Collectively, minorities (including black, Hispanic, Asian/Pacific Islander, and Native American) form 19% of the principals in Illinois public schools and only 4% of the superintendents. Availability of minority principal and superintendent candidates is an important factor affecting the racial-ethnic make-up of the administrators. Another factor may be the organization of the education system in terms of districts and schools; it is not always possible to hire principals and district superintendents to reflect the exact proportions of minority students. Education of Administrators Section 21-7.1 of the School Code [105 ILCS 5/21-7.1] requires that all school and district administrators possess at least a master’s degree. Eleven percent of Illinois school principals and 65% of the superintendents held doctorates or other advanced degrees beyond the master’s degree level.

4
II. Supply Indicators Supply, in its broadest sense, includes all educational personnel available to the schools, regardless of whether or not they are currently employed within the school system. This section provides information on various indicators of supply, including: (1) personnel retained from the previous year; (2) newly certified individuals; (3) re-entering personnel (i.e., newly hired educators who had prior experience); and (4) students in the pipeline (i.e., those currently enrolled in professional preparation programs).
Personnel Retained from the Previous Year The largest supply of educators is the previous year’s workforce. The total educator workforce includes teachers, administrators, school service personnel, and other certified staff. In Illinois, over 89% of the previous year’s educational workforce was employed in the same position in school year 2001. Another 3.6% were retained in Illinois public schools, but in a different position. Thus, 92.8% of all educators in Illinois were still in public education in 2001.
TABLE 1: Retention by Position
Administrative
Total Employed
2000
Total Retained in
2001 District Supt. 856 783 91% Other Supt. 472 406 86% Elem. Principal/Asst. 2,677 2,294 86% Director 935 805 86% Jr. High Principal/Asst. 965 774 80% HS Principal/Asst. 1,418 1,179 83% Other Administrator 992 793 80%
Total Admin. 8,315 7,034 85%
Instructional
Total Employed
2000
Total Retained in
2001 Elementary Teacher 56,312 50,543 90% High School Teacher 17,218 15,193 88% Jr./Middle Teacher 30,110 27,063 90% Spec. Ed. Teacher (all) 20,639 18,568 90%
Total Teachers 124,279 111,367 90% Other Certified Staff 5,244 4,334 83% School Service Personnel 7,466 6,822 91% ALL EDUCATORS 145,304 129,557 89%
As shown in Table 1, the retention rate for all administrators in 2001 was 85%, down two percentage points from last year’s figure. The overall decrease was primarily due to large decreases in the retention of principals and assistants at all three levels. The largest decrease was at the Jr. High level

5
which dropped six percentage points from last year (from 86% to 80%). Retention rates for principals and assistants dropped three percentage points at both the High School and Elementary levels. In contrast, the overall retention rate for teachers was significantly higher than that of administrators (90% vs. 85%) and the rate among levels was more consistent (i.e., between 88-90%). The only decrease from last year was for High School teachers, which fell from 91% to 88%. When looking at rates by assignment, however, retention ranged from a low of 76% (Title I Reading and Mathematics) to a high of 91% (Physical Education and Music). Other areas with relatively low retention rates were: Learning Resources/Media (78%), Bilingual (79%), and Reading Improvement (80%).
Newly Certified Educators The second largest source of supply is newly certified educators. In Illinois, the number of new certificates issued is counted annually according to the fiscal year (i.e., July 1 to June 30). In order to be considered as supply for the 2000-01 school year, teachers had to be certified in the previous fiscal year (i.e., July 1999 to June 2000). There were over 14,000 certificates issued in fiscal year 2000 and over 17,500 in fiscal year 2001. As Table 2 shows, the vast majority were issued to teachers— nearly 12,000 in fiscal year 2000 and about 15,000 in 2001. Part of the large increase in the number of elementary and secondary certificates (and the corresponding decrease in special teaching certificates) is due to teachers choosing to “split” their K-12 special teaching certificates and instead receive an elementary and a secondary certificate this year. As a result, the 28% increase is most likely exaggerated.
Table 2: New Certificates Issued
Type FY00 FY01 Change from 00 75 Administrative 1,403 1,536 133 9% 76 Provisional Administrative 12 16 4 33% Total Administrative 1,415 1,552 137 10%
3 Elementary Teaching 4,998 7,130 2,132 43% 4 Early Childhood Teaching 641 765 124 19% 9 High School Teaching 3,327 5,314 1,987 60%
10 Special Teaching 2,761 1,859 (902) -33% Total Instructional 11,727 15,068 3,341 28%
5 Provisional Early Childhood 11 10 (1) -9% 30 Provisional Elementary 46 104 58 126% 31 Provisional High School 38 80 42 111% 33 Provisional Special 69 99 30 43% Total Provisional 164 293 129 79%
73 School Service Personnel 709 744 35 5% 74 Provisional SSP 36 36 - Total SSP 745 780 35 5%
Total Certificates 14,051 17,693 3,642 26%

6
Of particular concern is the 79% increase in provisional certificates issued to teachers. While the number issued is relatively small (293 in 2001), a dramatic increase in the number of provisional or emergency certificates is usually an indicator of under-supply at the local level.
Re-entering Personnel Educators returning to the profession are the third largest source of supply. In 2000-01, nearly 6,000 educators re-entered the Illinois public school system, an increase of 630, or nearly 12% over last year (see Table 3). The percentage for administrators is relatively small because two-thirds of new administrators come from the teaching force.
TABLE 3: Number of Re-entries Hired in 2000-01 [FT] Re-entries FT 01 N %-FT Administrative 8,551 170 2% Instructional 127,323 5,301 4% Other Certified Staff 5,377 191 4% School Service Personnel 7,743 331 4% 148,994 5,993 4%
In addition to being an important source of new hires, the number of re-entries is an important indicator of another facet of supply—namely, the reserve pool. In reviewing historical data, the number of educators returning to the profession had a dramatic peak in school year 1995 due to the early retirement incentive the previous year. In school year 1994, only 3,300 re-entering teachers were hired. In school year 1995, the number ballooned to more than 5,400, an increase of 62%, or nearly 2,100 more than the previous year. Illinois is again facing a retirement crunch, especially for administrators (see "Eligible to Retire," page 17). Using 1995 as a reference point, it is likely that more educators in the reserve pool would re-enter the profession if the right positions became available. If educators can be lured back into the system, this reserve pool may ameliorate the effects of the upcoming retirement bubble.
Students in the Pipeline Students currently enrolled in professional preparation programs are the best indicators of future supply. By tracking enrollment trends in both teacher preparation and alternative routes to certification, one should be able to derive some notion of whether the educator supply is likely to increase or decrease in the next three to four years. In order to project future supply, however, one would also need to track how many program completers (i.e., students who completed all requirements of an approved teacher education program) actually receive certification in Illinois. The joint effort between the Illinois State Board of Education (ISBE) and the Illinois Board of Higher Education (IBHE) to develop a data warehouse that will house higher education, certification, and educator employment data is crucial to this undertaking. Unfortunately, the data will not be available prior to the first quarter of 2002, and it will take a couple of years before trends can be analyzed.

7
Until then, we will be using aggregate enrollment and program completer data that the State Board’s Division of Professional Preparation has been collecting from the 57 teacher preparation institutions since the 1998-99 school year. As Table 4 shows, there were 19,612 undergraduate and 3,857 graduate students enrolled full-time in professional preparation programs in 2000. When compared to 1999 figures, there was a 10% decrease in undergraduate enrollments. Conversely, there was a 6% increase in graduate enrollments.
TABLE 4: Professional Education Enrollments
Professional Preparation Enrollments Change 1999 2000 n % Undergraduate Full-Time 21,806 19,612 -2,194 -10% Undergraduate Part-Time 3,087 2,744 -343 -11%
Total 24,893 22,356 -2,537 -10% Graduate Full-Time 3,415 3,857 442 13% Graduate Part-Time 11,709 12,114 405 3%
Total 15,124 15,971 847 6% SOURCE: Division of Professional Preparation
As mentioned above, the Division of Professional Preparation also collected data on the number of program completers, defined as those students completing an Illinois-approved program of teacher education, for the last two years. As Table 5 shows, there was a 5.5% increase in the total number of program completers between the 1999 and 2000 school years with most of the growth occurring in the areas of Special Education and Elementary Education. In contrast, three program areas showed slight to moderate decreases during that same time period: K-12 Programs (-3%), School Service Personnel (-6%), and Administrative Programs (-10%).
Table 5: Number of Program Completers 1998-99 1999-00 Change Early Childhood 627 658 5% Elementary 3,716 4,173 12% Secondary Programs 2,493 2,638 6% Special Education Programs 1,098 1,253 14% K-12 Programs 961 928 -3% School Service Personnel 738 694 -6% Administrative Programs 1,464 1,318 -10% Alternative Routes to Teacher Cert. n/a 41 --
Total: 11,097 11,703 5.5% SOURCE: Division of Professional Preparation

8
III. Demand Factors Demand refers to the need for educational personnel to fill positions. This section presents information on the various factors of demand, including: (1) changes in student enrollments; (2) workforce growth; (3) retirement projections; and (4) attrition rates (i.e., the rate at which educators leave the profession). Data in this section were obtained from two sources: the 2001 Public School Enrollment Projection Report and the 2000-01 Teacher Service Record (TSR). The TSR contains employment data on all Illinois public school personnel and is collected annually in the fall by the Illinois State Board of Education. It now takes nearly nine months to obtain accurate data and to edit the annual TSR file; the most current file that could be used for this study contains data from the 2001 school year. Where abbreviated, data from the 1999-00 school year is referred to as “2000” and data from the 2000-01 school year as “2001.” For comparative purposes, 2001 is considered the “current year” and 2000, the previous year.
Changes in Student Enrollments At the aggregate level, there is a direct relationship between student enrollment and demand for educators. Illinois public school enrollments have been increasing since school year 1990, and that trend is expected to continue through school year 2008 (Illinois State Board of Education, 2001). Most of the growth, however, will be at the secondary level and will exacerbate the demand for high school teachers. Total Illinois public school enrollment for school year 2001 was 1,972,856, an increase of 19,479 students, or about 1% over the previous year (see Table 6). For the last five years, total enrollments have increased an average of nearly 1% or over 17,000 students per year. However, the expected growth rate for the next five years is expected to decrease substantially and average only about 0.3% per year, or around 6,600 students per year. As indicated below, elementary enrollments are expected to peak in the next two years and then begin to decline through 2008. On the other hand, secondary enrollments are expected to increase for the next seven years.
TABLE 6: Enrollment Projections through School Year 2008 PROJECTED 2003-04 2007-08 ACTUAL Change (01) Change (01) 2000-01 Enrollment n % Enrollment n %
Elementary 1,410,133 1,415,433 5,300 0.4% 1,389,839
(20,294) -1.4%
Secondary 562,723 578,414
15,691 3% 619,329 56,606 10.1%
TOTAL
1,972,856 1,993,847
20,991 1% 2,009,168 36,312 1.8%

9
Secondary enrollments for 2000-01 were 562,723, an increase of more than 10,000 students (1.8%) over last year. Over the last two years, secondary enrollments have increased by over 16,000 students (or an average of 1.5% a year). Prior to 1999-00, however, the five-year average growth rate was only 0.4% and enrollments had actually decreased in two of those years (1997-98 and 1998-99). For the next five years, secondary enrollments are expected to continue to grow at an average of 1.5% and peak in school year 2008 at 619,329. This represents an increase of 10% or 56,606 students over 2001 enrollments (see Figure 3). Elementary enrollments (1,410,133), on the other hand, grew at a more modest pace this year (0.7%, or 9,327 students). They are expected to grow slowly until they peak in 2002-03 at 1,417,418, and then decline, on average, about 2,800 students a year for the next five years. Overall, the five-year average growth rate for elementary enrollments is -.02%. The decrease in elementary enrollments is largely due to the decrease in the number of live births, which peaked in 1990 at 195,499, and declined each of the next seven years to a low in 1997 of 180,649 (an 8% decrease). (See Figure 4)
Figure 3: Secondary Enrollments (9-12)
500,000
520,000
540,000
560,000
580,000
600,000
620,000
640,000
1996 1998 2000 2002 2004 2006 2008
Projections
Figure 4: Elementary Enrollments (K-8)
1,280,000
1,300,000
1,320,000
1,340,000
1,360,000
1,380,000
1,400,000
1,420,000
1,440,000
1996 1998 2000 2002 2004 2006 2008
Projections

10
Workforce Growth Total Educator Workforce The educational workforce has increased, partially in response to the growth in student enrollments. For school year 2001, the total full-time educator workforce was 148,994, which represents an increase of 3,690 or 2.5% over the previous year’s total (see Table 7). Like last year, student enrollments only increased 1%, while the rate of growth for administrators and teachers was over 2.5%. Thus, the educator workforce is still growing at a much faster rate than student enrollments.
TABLE 7: Educator Workforce Growth Rates [FT]
Change From 2000
Total Employed
2001 N % Administrators 8,551 236 2.8% Teachers 127,323 3,044 2.4% School Service Personnel 7,743 277 3.7% Other Certified Staff 5,377 133 2.5% Total Workforce 148,994 3,690 2.5%
Administrator Workforce Growth The total number of full-time administrators employed in Illinois public schools for school year 2001 was 8,551, an increase of 236 (2.8%) from last year’s total. Since 1996-97, the total number of administrators has increased by an average of about 200 per year (see Table 8). As in the two previous years, Chicago had a larger percentage increase in demand for administrators than Downstate in the 2001 school year (4.2% vs. 2.6%). And while both regions have needed an increasing number of administrators each year, Chicago’s growth rate has been somewhat erratic while Downstate has seen a steady 2.6% increase for the last three years.
TABLE 8: Administrator Growth Rates [FT]
State Downstate Chicago #-FT Change #-FT Change #-FT Change
1996-97 7,705 1997-98 7,872 2.2% 6,936 936 1998-99 8,100 2.9% 7,113 2.6% 987 5.4% 1999-00 8,315 2.7% 7,299 2.6% 1,016 2.9% 2000-01 8,551 2.8% 7,492 2.6% 1,059 4.2%

11
Teacher Workforce Growth The total number of full-time teachers employed in Illinois public schools in school year 2001 was 127,323, an increase of 3,044 (or 2.5%) from school year 2000. Thus, the teacher workforce continues to grow at a much greater rate than student enrollments, perhaps due to school reform efforts such as class-size reductions. As can be seen in Table 9, the total number of full-time teachers in Illinois has increased an average of 1.9% a year for the last ten years. In that time, the full-time teaching force has grown from a low of 105,993 in 1990-91 to a current high of 127,323. The teacher workforce has increased every year except school year 1994, when the total employed dropped about 550 due to a decrease in Chicago of more than 1,500 teachers. Over the last five years, however, the increases have been more profound— with the teacher workforce increasing by an average rate of 2.4%, or about 3,000 teachers a year.
Table 9: Teacher Workforce Growth Rates [FT] State Downstate Chicago #-FT Change #-FT Change #-FT Change
1988-89 102,542 80,696 21,846 1989-90 103,577 1.0% 81,240 0.7% 22,337 2.2% 1990-91 105,993 2.3% 83,234 2.5% 22,759 1.9% 1991-92 107,482 1.4% 84,837 1.9% 22,645 -0.5% 1992-93 108,670 1.1% 85,208 0.4% 23,462 3.6% 1993-94 108,118 -0.5% 86,220 1.2% 21,898 -6.7% 1994-95 110,104 1.8% 87,592 1.6% 22,512 2.8% 1995-96 112,853 2.5% 89,820 2.5% 23,033 2.3% 1996-97 115,644 2.5% 92,121 2.6% 23,523 2.1% 1997-98 118,091 2.1% 94,622 2.7% 23,469 -0.2% 1998-99 121,179 2.6% 97,540 3.1% 23,639 0.7% 1999-00 124,279 2.6% 100,711 3.3% 23,568 -0.3% 2000-01 127,323 2.5% 103,247 2.5% 24,076 2.2%
However, when comparing workforce growth rates between Chicago and Downstate, a different picture emerges. Chicago’s teaching force increased by approximately 500 teachers a year from school year 1995 to school year 1997 but has remained fairly constant over the last three years. On the other hand, the Downstate force has been growing at a steady pace over the same timeframe. For the last five years, the average growth-rate Downstate was 2.8% while in Chicago it was only 0.9%. It was hypothesized that the erratic growth rates of the Chicago teaching force might be related to changes in enrollments. However, when enrollments and the teacher workforce were compared it was found that Chicago enrollments have increased every year since 1995-96, yet in that same time period there have been two years when the teaching workforce has had small decreases. The net effect has been a steady ratio of about 17.3 students for every teacher in Chicago (see Appendix A). In contrast, the percent increases in the teaching force Downstate for the last five years have been consistently larger than the percent increases in enrollments. This has had the net effect of reducing the ratio of enrollments to teachers Downstate from 16.6 in 1995-96 to 15.1 in 2000-01.

12
Teacher Demand Number of New Teachers Hired Figure 5 shows the number of new teachers hired for each of the last ten years. The sharp peak in school year 1995 is due to the early retirement incentive. Since that anomaly, and the subsequent decrease in the number of new teachers hired, there has been a dramatic increase in the trend. In school year 1997, a total of 7,834 new teachers were hired, and in school year 2001 that number rose to 12,603. This represents a 60% increase in the demand for new teachers since 1997. Of the 12,603 new teachers hired for school year 2001, the majority (7,302 or 58%) were first-time teachers. Since 1997, the number of first-time teachers hired has increased nearly 57%, from 4,662 to 7,302. As Figure 5 shows, teachers re-entering the workforce filled a significant number of district vacancies over the last ten years. Teachers with greater than one year of experience who were not employed in an Illinois public school the previous year (i.e., “re-entries”), filled 5,301 vacancies and accounted for 42% of the new teachers hired in 2001. It is interesting to note that the 60/40 proportion of first-timers to re-entries has remained nearly constant for the last six years. The number of re-entries hired each year has increased at an even greater rate than first-timers. In school year 1997, 3,172 re-entries were hired and in school year 2001, that number increased to 5,301 (a 67% increase). As Table 10 shows, the biggest category of newly hired teachers was elementary (5,533), followed by high school (2,893), and special education teachers (2,431). Special education, at 11.3%, had the highest percentage of newly hired teachers and was the only category where there were an equal number of first-timers and re-entries hired.
TABLE 10: New Teachers Hired in School Year 2001 [FT]
Total New First Time Re-entry
Instructional Staff
Total Employed
2001 N %-01 N %-01 N %-01 Special Ed. 21,502 2,431 11% 1,203 6% 1,228 6% Elem. Teacher 57,136 5,533 9% 3,213 6% 2,320 4% Jr./Middle Teacher 17,846 1,746 9% 1,164 7% 582 3% HS Teacher 30,839 2,893 9% 1,722 6% 1,171 4%
ALL 127,323 12,603 10% 7,302 6% 5,301 4%
Figure 5: Number of New Teachers Hired
0
1,000
2,000
3,000
4,000
5,000
6,000
7,000
8,000
9,000
10,000
11,000
12,000
13,000
14,000
1991 1992 1993 1994 1995 1996 1997 1998 1999 2000 2001
Re-EntryFirst-Time

13
Change in Demand for Teachers As stated in the section on workforce growth, the teaching force grew by 3,044 from 2000 to 2001. In that same period, 10,414 teachers either left Illinois public education or changed to a non-teaching position. When workforce growth and attrition are added to the 2,225 unfilled positions reported in September 2000, total demand for teachers increased by 15,682 or nearly 13% from school year 2000. In terms of number of new teachers needed, the five biggest areas of demand were Self-Contained Classroom (4,421), Special Education (3,115), English Language Arts (1,431), Mathematics (921), and Science (828). (See Appendix B for the complete list.) Another way to look at demand is to see which areas needed the most new teachers relative to the teaching force last year. Percent increases in demand ranged from a low of 2% for Educationally Handicapped to a high of 43% for Other/General Special Education. There were nine assignments with increases of 20% or greater and four of those were in special education. As Table 11 shows, the main assignments with the highest percent increases were: Other/General Special Ed (43%), Other Science and Cross Categorical (25%), Multiply Handicapped (24%), and English as a Second Language, and Bilingual (23%).
Table 11: Largest Percent Increase in Demand
Assignment
Change in Demand 2001 [Gwth+UFP+Attrn]
N %-2000 Other/General Special Ed 439 43% Other Science 81 25% Cross Categorical 813 25% Multiply Handicapped 46 24% English as a Second Language 129 23% Bilingual Education 466 23% Foreign Language-- Spanish 353 20% Computer/Technology 219 20% Speech & Language Impaired 468 20%
Administrator Demand
Number of New Administrators Hired In school year 2001, there were 560 new administrators hired, two-thirds of whom had been Illinois teachers the previous year. Another 163 (30%) were re-entering professionals and about 5% were in the Illinois public school system for the first time. The number of new administrators hired was about 6% more than last year (i.e., 528 were hired in the 2000 school year). See Table 12. When viewed by individual position, Elementary Principals and Assistants had the largest number of new hires (n=177) while the position of Jr./Sr. Dean had the highest proportion of new hires (14%).
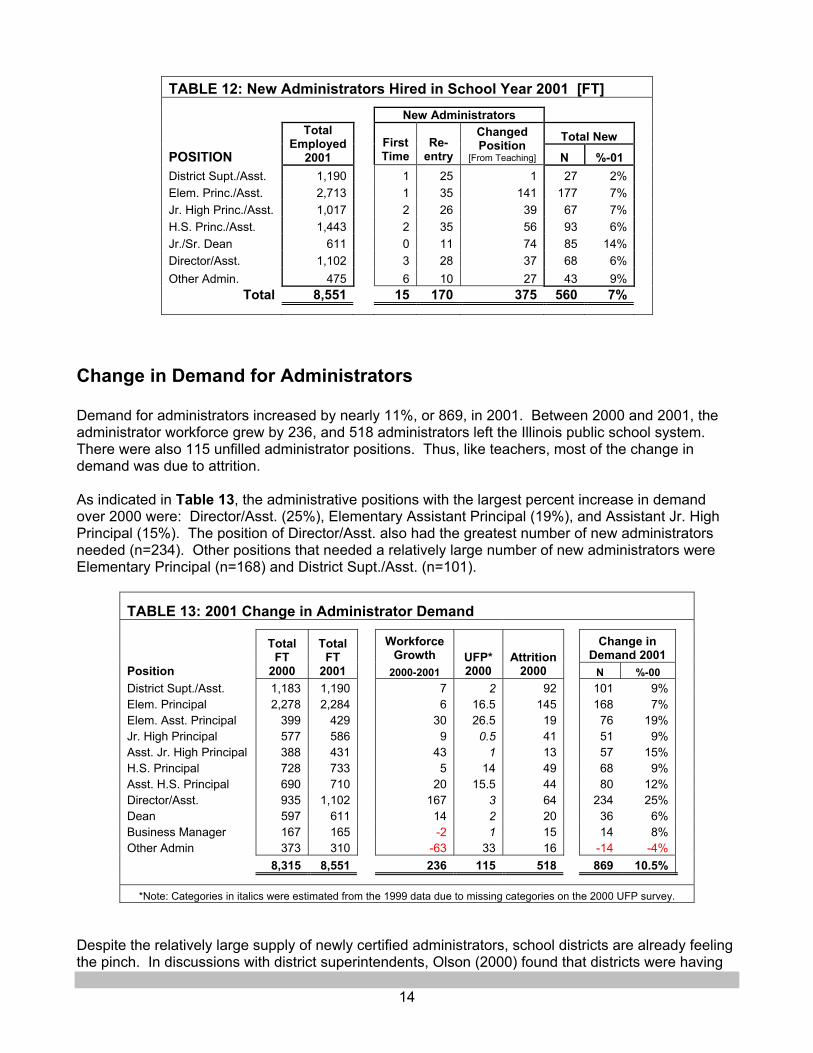
14
TABLE 12: New Administrators Hired in School Year 2001 [FT]
New Administrators
Total New POSITION
Total Employed
2001 First Time
Re-entry
Changed Position
[From Teaching] N %-01 District Supt./Asst. 1,190 1 25 1 27 2% Elem. Princ./Asst. 2,713 1 35 141 177 7% Jr. High Princ./Asst. 1,017 2 26 39 67 7% H.S. Princ./Asst. 1,443 2 35 56 93 6% Jr./Sr. Dean 611 0 11 74 85 14% Director/Asst. 1,102 3 28 37 68 6% Other Admin. 475 6 10 27 43 9%
Total 8,551 15 170 375 560 7%
Change in Demand for Administrators Demand for administrators increased by nearly 11%, or 869, in 2001. Between 2000 and 2001, the administrator workforce grew by 236, and 518 administrators left the Illinois public school system. There were also 115 unfilled administrator positions. Thus, like teachers, most of the change in demand was due to attrition. As indicated in Table 13, the administrative positions with the largest percent increase in demand over 2000 were: Director/Asst. (25%), Elementary Assistant Principal (19%), and Assistant Jr. High Principal (15%). The position of Director/Asst. also had the greatest number of new administrators needed (n=234). Other positions that needed a relatively large number of new administrators were Elementary Principal (n=168) and District Supt./Asst. (n=101).
TABLE 13: 2001 Change in Administrator Demand
Workforce
Growth Change in
Demand 2001 Position
Total FT
2000
Total FT
2001 2000-2001 UFP* 2000
Attrition 2000 N %-00
District Supt./Asst. 1,183 1,190 7 2 92 101 9% Elem. Principal 2,278 2,284 6 16.5 145 168 7% Elem. Asst. Principal 399 429 30 26.5 19 76 19% Jr. High Principal 577 586 9 0.5 41 51 9% Asst. Jr. High Principal 388 431 43 1 13 57 15% H.S. Principal 728 733 5 14 49 68 9% Asst. H.S. Principal 690 710 20 15.5 44 80 12% Director/Asst. 935 1,102 167 3 64 234 25% Dean 597 611 14 2 20 36 6% Business Manager 167 165 -2 1 15 14 8% Other Admin 373 310 -63 33 16 -14 -4%
8,315 8,551 236 115 518 869 10.5%
*Note: Categories in italics were estimated from the 1999 data due to missing categories on the 2000 UFP survey. Despite the relatively large supply of newly certified administrators, school districts are already feeling the pinch. In discussions with district superintendents, Olson (2000) found that districts were having

15
difficulty finding principals. Principal positions have become increasingly less attractive because “the job continues to grow and take on many more dimensions than in the past.” Salaries are not commensurate with the heavy responsibilities. Teachers are not interested in becoming school administrators. In a random sample of 403 rural, suburban, and urban districts nationwide, the Educational Research Service (Education World, 2000) found that approximately half of the districts reported a shortage in the supply for K-12 principals. According to those responsible for the hiring, “long hours, too much stress, and too little pay for the weighty responsibilities," were the reasons given by more than 60% of the respondents. Anecdotal evidence indicates a greater number of teachers are getting an administrative certificate to advance the pay scale and have no interest in going into administration. It is likely that the demand for administrators in Illinois will increase dramatically in the next three to four years. Nationally, the Bureau of Labor Statistics (Education World, 2000) projects a 10 to 20% increase in the need for school administrators through 2005. Klempen and Richetti (2001) warned that the “nation’s reservoir of experienced principals is about to become seriously depleted.” They report that 40% of the elementary, middle, and high school principals are about to retire. At the local level, the Illinois Principals Association (2000) found that by school year 2005, 45% of the current principals would be leaving education. Of those, only 33% indicated that they were leaving due to retirement.

16
Retirement Projections In the 2000 Educator Supply and Demand Report, age and years of experience were used to project the number of educators who will be eligible to retire through 2003. It was predicted that nearly 34,000 educators would become eligible to retire by 2002-03, including nearly 27,000 teachers and about 3,000 administrators. What was not known at that time is how many of those eligible would actually retire. For instance, there were over 1,100 teachers and 79 administrators over the age of 65 still employed in the 2000-01 school year. This year, the average age of retirement (60) and the attrition rates by-years-of-experience were used to predict how many educators would be most likely to retire in the next four years. Data from the last three years indicates that attrition rates are under 5% until around 31 years of experience, at which point they increase dramatically due to retirement. For the purposes of this study, Likely to Retire is defined as an educator who is at least 60 years old and has 31 years of experience or more.
Age Distributions of Teachers and Administrators Teachers The age distribution of full-time teachers has not changed significantly since last year. The teaching force in Illinois continues to grow older. The average age of all teachers is 43.4 and the median age is 45 (see Figure 6). There are now 47,960 teachers aged 50 or older and they represent nearly 38% of the total teaching force. This is an increase of about 2,300 teachers over last year (2000=45,649; 37%) and an increase of 5,100 over 1998-99 when teachers over 50 comprised only 34% of the total teaching force. On the positive side, there has also been significant growth at the lower end of the age distribution. In 1998-99, there were 33,484 teachers aged 35 or less and they represented 26% of the teaching force. This year, that number has increased by over 5,500 (i.e., 38,918) and the group now accounts for nearly 31% of the teaching force. Administrators Like that of teachers, the age distribution of administrators also peaks at age 54 (see Figure 7). However, unlike the teacher distribution, there is not a secondary peak at the lower end of the
Figure 6: 2001 Age Distribution- Teachers
0
500
1,000
1,500
2,000
2,500
3,000
3,500
4,000
4,500
5,000
5,500
6,000
22 24 26 28 30 32 34 36 38 40 42 44 46 48 50 52 54 56 58 60 62 64 66+
Figure 7: 2001 Age Distribution- Administrators
050
100150200
250300350
400450
500550600
650700
26 28 30 32 34 36 38 40 42 44 46 48 50 52 54 56 58 60 62 64 66+Years

17
distribution. Less than 15% of the administrator workforce is under 40 years old while 60% of them (n=5,128) are age 50 or older. Therefore, the impact of age on demand is going to be much greater for administrators than for teachers.
Experience Distributions for Teachers and Administrators As shown in Figures 8 and 9, the years of experience distributions for full-time teachers and administrators are nearly mirror images. Most teachers have less than 20 years of experience while most administrators have over 20 years experience. More specifically, nearly 70% of administrators have 20 or more years of experience compared to 34% of the teaching force. The difference is even greater for those nearing retirement. Nearly 2,000 administrators, or 23%, have 31 or more years of experience. In contrast, only 9% of the teaching force has 31+ years experience. As Figure 9 shows, there are over 1,800 administrators in the 27-30 years experience range which is nearly as many as there are in the 31+ group (n=1,985). Over the next four years, this group will become part of the “likely to retire” pool. Thus, the pool of administrators that are “likely to retire” will remain relatively large for the next four to five years and their eventual retirement will greatly increase administrator demand. On the positive side, a small number of educators are still employed even though they have reached the maximum retirement annuity. In 2001, nearly 9% of administrators (735) and over 3% of teachers (4,076) had over 34 years of experience. Among these assiduous educators are 15 teachers and 7 administrators with over 50 years of experience!
Figure 8: Years of Experience- Teachers 2001
0
1,000
2,000
3,000
4,000
5,000
6,000
7,000
8,000
1 3 5 7 9 11 13 15 17 19 21 23 25 27 29 31 33 35 37 39Years of Experience
Figure 9: Years of Experience- Admin. 2001
0
50
100
150
200
250
300
350
400
450
500
1 3 5 7 9 11 13 15 17 19 21 23 25 27 29 31 33 35 37 39Years of Experience
Eligible to Retire For the purposes of this study, Eligible to Retire was defined as an educator who is at least 55 years old and has 20 or more years of experience. As Table 14 shows, over 15,000 teachers were eligible to retire in 2001. Even though the teacher workforce is expected to continue growing, the proportion eligible to retire is expected to increase from 12% to 16% by 2004. Of the 9,100 teachers that left education between 2000 and 2001, only 2,119 had 31 or more years of experience. Thus, 23% of teacher attrition is likely due to retirement which means that over three-fourths left for other reasons.

18
In contrast, nearly 60% of administrator attrition was most likely due to retirement. Between 2000 and 2001, 518 administrators left education and 304 of them had 31 or more years of experience. In 2001, 25% of the administrator workforce, was eligible to retire. The eligible pool is expected to grow and comprise 32% of the administrator workforce by 2004. In sum, teacher and administrator attrition due to retirement will increase, however, it will have a much greater impact on the administrator workforce due to its advanced age and experience levels (the teaching force is also aging but does not have the requisite years of experience).
Table 14: Projected Eligible to Retire 2001-2004 Projected Eligible Pool* Teachers 2001 2002 2003 2004
Eligible to Retire 15,607 17,903 19,675 21,373 % of Workforce 12% 14% 15% 16% Workforce 127,323 130,379 133,508 136,712
Administrators Eligible to Retire 2,123 2,498 2,771 2,952 % of Workforce 25% 28% 31% 32% Workforce 8,551 8,773 9,001 9,235
*Teacher projections assume 2.4% annual workforce growth and 10% annual attrition in
the eligible pool. Administrator projections assume 2.5% annual workforce growth and 10% annual attrition in the eligible pool.
Likely Retirements by Position Currently, there are 3,046 educators, or 2% of the entire full-time workforce, likely to retire in the next year (see Table 15). Teachers account for nearly three-fourths of the expected retirements (n=2,238), but those likely to retire only represent 2% of the teaching workforce. Administrators, on the other hand, have a relatively high percent of their workforce likely to retire (5%; n=389). For the complete list of educators likely to retire by position, see Appendix C.
Table 15: Educators Likely to Retire in 2001-02
Likely To Retire 2001-02
[age01≥ 60 & exper≥ 31]
Total Employed 2001 FT N %-01
Administrative 8,551 389 5% Instructional 127,323 2,238 2% Other Educators 13,120 419 3% Total 148,994 3,046 2%
Teachers Retirement is not likely to have a significant impact on teacher demand in the near future. There are only 2,238 teachers, or 2% of the workforce, likely to retire in 2001-02. Of that number, elementary teachers had the highest number likely to retire (1,124) while special education teachers have the lowest number (180) and the lowest percent likely to retire (1%).

19
Administrators There are 389 administrators, or 5% of the workforce, likely to retire in 2001-02. Thus retirements are likely to significantly impact administrator attrition for the foreseeable future. Attrition rates varied greatly from 1% (Junior High and Elementary Assistant Principals) to 24% (Regional Superintendents and Assistants). For the majority of administrative positions, the retirement rate is expected to be less than 4% this year. The positions with the greatest number likely to retire are Elementary Principal (136), District Superintendent (57), and Director/Asst. (43). Other Educators Approximately 4% of current Other Certified Staff (n=214), and less than 3% of current School Service Personnel (n=203) are likely to retire in 2001-02. All positions in these two categories have expected retirement rates that are less than 5%. The greatest numbers likely to retire are in the positions of Guidance Counselor (125), Coordinator (90), and Library/Media Specialist (84). Likely Retirements by Assignment As stated previously, it is predicted that no more than 2,238 teachers are likely to retire in 2001-2002. Despite the aging of the workforce, teachers just do not have enough years of experience to make retirement a viable option in the near future. The only subject area with an expected retirement rate over 3% and a significant number likely to retire is Drivers Education (4%; n=22). For the complete list of teachers likely to retire by assignment see Appendix D. Projections of Educators Likely to Retire through 2004-05 To predict retirements in the near future, the 2001 TSR file was used to project the age and experience levels of the current educator workforce over the next four years. A year was subtracted from the likely to retire criteria (i.e., age 60+ and 31+ years of experience) for each subsequent year projected. More specifically, those educators currently 59 with 30+ years of experience were deemed likely to retire in 2003, those 58 with 29+ years experience— likely to retire in 2004, and those 57 with 28+ years experience— likely in 2005. Two scenarios were then calculated: worst case and most probable. The worst case scenario would be if all of those educators meeting the “likely to retire” definition in the next four years, actually retire. However, that is not likely to happen. A more likely scenario, based on the last three years of attrition data, is that those “likely to retire” will do so at an average rate of about 25% a year. As Table 16 shows, the total number of educators likely to retire in the next four years is expected to be between 5,246 and 7,786. As indicated earlier, administrator demand is expected to be more heavily impacted by retirements than is demand for teachers or other educators. Even if all of those “likely” teachers retire in the next four years, it will be less than 6,000 teachers, or less than 5% of the current teaching force. If all 956 administrators retire, however, Illinois will loose over 11% of its current administrator force. Of course, that is over a four year period—so the annual loss comes to about 2.8% a year for administrators and about 1% for teachers. See Appendix C for a complete list of projections by position.
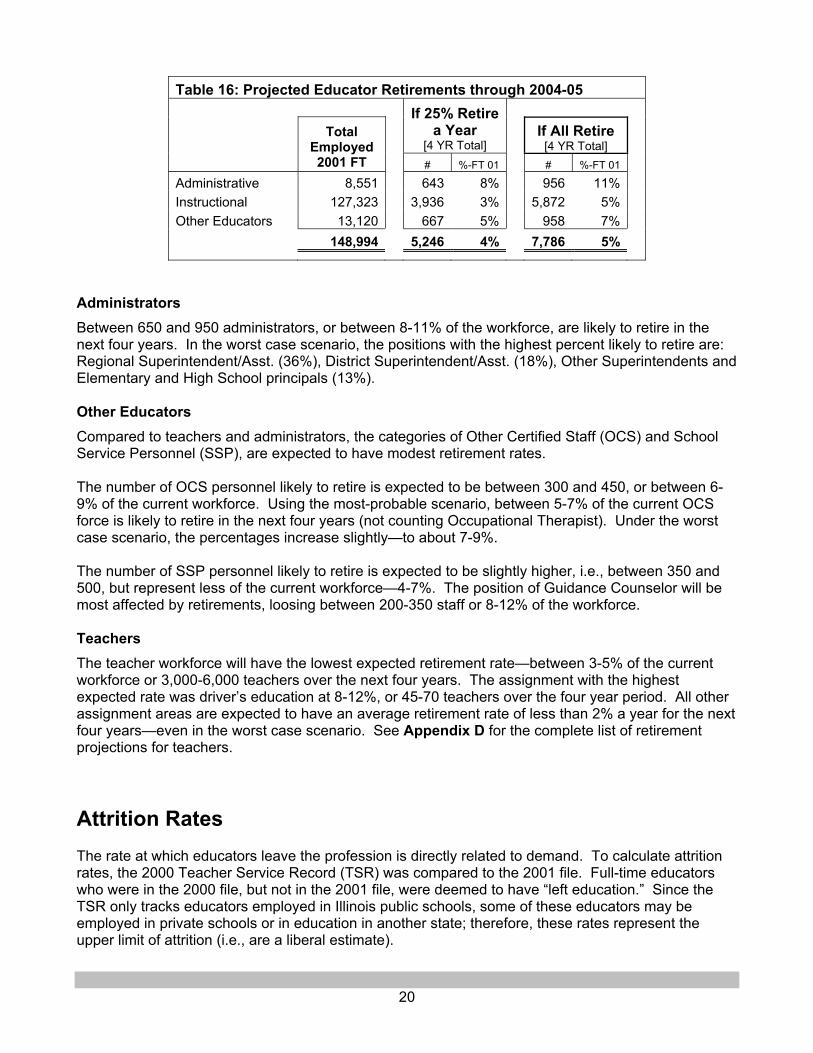
20
Table 16: Projected Educator Retirements through 2004-05
If 25% Retire a Year
[4 YR Total] If All Retire
[4 YR Total]
Total Employed 2001 FT # %-FT 01 # %-FT 01
Administrative 8,551 643 8% 956 11% Instructional 127,323 3,936 3% 5,872 5% Other Educators 13,120 667 5% 958 7% 148,994 5,246 4% 7,786 5%
Administrators Between 650 and 950 administrators, or between 8-11% of the workforce, are likely to retire in the next four years. In the worst case scenario, the positions with the highest percent likely to retire are: Regional Superintendent/Asst. (36%), District Superintendent/Asst. (18%), Other Superintendents and Elementary and High School principals (13%). Other Educators Compared to teachers and administrators, the categories of Other Certified Staff (OCS) and School Service Personnel (SSP), are expected to have modest retirement rates. The number of OCS personnel likely to retire is expected to be between 300 and 450, or between 6-9% of the current workforce. Using the most-probable scenario, between 5-7% of the current OCS force is likely to retire in the next four years (not counting Occupational Therapist). Under the worst case scenario, the percentages increase slightly—to about 7-9%. The number of SSP personnel likely to retire is expected to be slightly higher, i.e., between 350 and 500, but represent less of the current workforce—4-7%. The position of Guidance Counselor will be most affected by retirements, loosing between 200-350 staff or 8-12% of the workforce. Teachers The teacher workforce will have the lowest expected retirement rate—between 3-5% of the current workforce or 3,000-6,000 teachers over the next four years. The assignment with the highest expected rate was driver’s education at 8-12%, or 45-70 teachers over the four year period. All other assignment areas are expected to have an average retirement rate of less than 2% a year for the next four years—even in the worst case scenario. See Appendix D for the complete list of retirement projections for teachers. Attrition Rates The rate at which educators leave the profession is directly related to demand. To calculate attrition rates, the 2000 Teacher Service Record (TSR) was compared to the 2001 file. Full-time educators who were in the 2000 file, but not in the 2001 file, were deemed to have “left education.” Since the TSR only tracks educators employed in Illinois public schools, some of these educators may be employed in private schools or in education in another state; therefore, these rates represent the upper limit of attrition (i.e., are a liberal estimate).

21
Teachers Over 7% of the 2000 full-time teaching force left education between 2000 and 2001 (n= 9,100). In 1994, attrition rates were abnormally high (9.4%) because of the early retirement incentive1. Since that anomaly, attrition rates have ranged from a low of 4.6% in 1996 to a current high of 7.3% in 2000. The trend since 1996 represents nearly a 60% increase in the attrition rate. If this trend continues, the attrition rate for teachers will be about 9% in school year 2001 and could be over 10% the following year. See Figure 10. In addition to the 9,100 teachers that left the Illinois public school system, there were about 1,300 teachers that switched to non-teaching positions. Together, the total loss of teachers was about 8% of the 2000 teaching force. When looking at the loss of teachers by main assignment, rates ranged from a low of 5% (Physical Science) to a high of 13% (Learning Resource and Health Occupations). Most loss rates were in the 6-9% range, even with the addition of loss due to position changes. Assignments with the highest rate of teacher loss (not counting the category of “Other”) were:
Learning Resource 13.4% Health Occupations 13.3% Vocational-Technical Misc. 13.0% Computer Education 10.6%
For a complete list of teacher loss by assignment see Appendix E. Administrators More than 6% of full-time administrators (n=518) left education between 2000 and 2001. Administrator attrition rates were also abnormally high in 1994 due to the early retirement incentive2, albeit at a much higher rate than teachers-- 13%. Since then, the rates have ranged from a low of 3.4% in school year 1996 to a current high of 6.2% in school year 2000. Since 1996, administrator attrition rates have increased more than 80% which is significantly higher than the rate of change for teachers. If this trend continues, attrition will be over 8% in school year 2001 and nearly 11% the following year. (See Figure 11.)
1 Since the attrition rate indicates the percent of 1994 staff that left education, the x-axis in Figures 10 and 11 were changed to more appropriately reflect the year from which the attrition occurred. Last year the peak was reported as occurring in “1995.” 2 See footnote #1.
Figure 10: Historical Teacher Attrition
0%1%2%3%4%5%6%7%8%9%
10%
1994 1995 1996 1997 1998 1999 2000
Figure 11: Historical Administrator Attrition
0%
2%
4%
6%
8%
10%
12%
14%
1994 1995 1996 1997 1998 1999 2000

22
Attrition rates for administrative positions ranged from a low of 5% for Other Administrators to a high of 8% for District Superintendents/Assistants. As Table 17 shows, the position with the highest number of administrators who left education were Elementary Principals and Assistants (n=164).
Table 17: 2001 Administrator Attrition Rates [FT]
Total Employed
2000 Left Education
00--01 District Supt./Asst. 1,183 92 8% Elem. Princ./Asst. 2,677 164 6% Jr. High Princ./Asst. 965 54 6% H.S. Princ./Asst. 1,418 93 7% Director/Asst. 1,015 64 6% Other Admin. 1,057 51 5%
Total 8,315 518 6.2%
Historically, retirement has been a relatively small contributor to attrition. However, based on the projections in the previous section, it is very likely that the attrition rates for administrators will increase by 2-3% a year due solely to retirements. The positions that will have the biggest losses are: District Superintendents, Elementary Principals, and High School Principals. Attrition by Years of Experience Last year, it was discovered that attrition rates varied greatly by years of experience. This year, we used three years of data (1998-99 through 2000-01) to obtain a more stable indicator of attrition by years of experience. As Figures 12 and 13 indicate, the average attrition rates are virtually identical to last year’s findings and the patterns are still very similar for both teachers and administrators. Both distributions show dramatic increases in attrition rates around 32 years of experience because of retirement, and both show that between 10 and 31 years of experience, attrition rates are extremely low—usually under 5%. The big difference between the two is that attrition rates for teachers remain relatively high for the first nine years, while those of administrators drop precipitously after two years of experience. Teachers Except for teachers with 33 years of experience or more, first-time teachers (i.e., those with one year of experience or less) leave teaching at the highest rate (11%). See Figure 12. Teachers with less than five years of experience leave the profession at relatively high rates—between 9-11%. From five to nine years of experience, the rates slowly decline from approximately 7.5- 5%. Then from 10 to 30 years of experience, the rate is very stable and often less than 5% (e.g., between 2.7% and 3% between 14-25 years experience). At 31 years of experience, the rate at which teachers exit begins to rise
Figure 12: Teacher Attrition Rates- 3 Year Avg.
0%
5%
10%
15%
20%
25%
30%
35%
1 3 5 7 9 11 13 15 17 19 21 23 25 27 29 31 33 35 37 39Years of Experience

23
dramatically and after 33 years, the attrition rates are extremely high—in the 25-33% range. Administrators As can be seen in Figure 13, attrition is very high for administrators with one year of experience or less (23%). Between three and 31 years of experience, however, administrators leave the profession at very low rates—between 2-5%. Administrator exit rates begin to rise dramatically at 32 years of experience and are extremely high after 33 years (in the 20-25% range).
Figure 13: Administrator Attrition Rates- 3 Yr. Avg
0%
5%
10%
15%
20%
25%
30%
35%
1 3 5 7 9 11 13 15 17 19 21 23 25 27 29 31 33 35 37 39Years o f Experience

24
IV. Over/Under Supply of Educators This chapter presents information on the relative over- and under-supply of teachers and administrators in Illinois. The first section provides data on areas in which institutions may be producing too many or too few educators. In the second section, the unfilled position data is used to identify regional shortages, i.e., where supply has not met local demand. Over/Under Production of New Educators In order to be able to say whether there is an over- or under- supply of educators, it is necessary to first determine whether or not enough educators are being produced each year. While an under-supply would definitely indicate an area of educator shortage, the converse is not necessarily true. For example, while there is an abundance of Administrative and Guidance Counselors credentials issued each year, many districts still find it difficult to fill those vacancies (because people are looking to go up the pay-scale rather than enter these positions). Table 18 compares the number of individuals receiving their first certificate (Column A)3 with the number of first-time educators hired in 2001 (Column B). As can be seen in the last column, most positions and subject areas had an over-supply of newly-certified individuals. When looked at as a ratio of number certified over the number hired (i.e., A/B), the areas with the greatest over-production were: Social Science, Guidance Counselor, Nurse, and Administrative. Areas with the greatest under-supply were: Special Education, Mathematics, and Physical Education.
Table 18: Over/Under Production of New Educators
A B
# First Cert [3 Yr Avg.]
# First Timers Hired 2001*
Over/Under Production
[A - B] Administrative 1,346 390 956
Instructional Art/Music 564 345 219 Bilingual 611 208 403 Elementary 6,064 2,194 3,870 English 2,001 687 1,314 Foreign Language 392 181 211 Health 104 30 74 Mathematics 543 456 87 Physical Education 383 278 105 Science 720 421 299 Social Science 2,228 369 1,859 Special Education 1,067 1,203 -136
School Service Personnel Guidance Counselor 276 47 229 Nurse 115 27 88 Psychologist 184 61 123 Social Worker 545 206 339
*Note: Both First-Time and Teachers that Changed Positions are included in the administrator count.
3 A three-year average for the number of newly certified individuals was used because a large number of certificates due to be issued in July 2001 were not issued until August. Thus the FY2000 number was very small and the FY2001 number was proportionally inflated.

25
Regional Shortages: Unfilled Positions Each year the Illinois State Board of Education collects information from school districts on positions not filled as of December 1. Unfilled positions refer to positions that were budgeted by districts for the school year but were not filled because of reasons such as the lack of qualified applicants. They are the bottom line in the supply-demand equation because they show where supply has not met demand at the local level—regardless of the number of new teachers produced at the state level. The last such survey of unfilled positions was completed as of December 1, 1999. The annual survey was changed rather dramatically in 2000. To meet the information needs of the Governor and the General Assembly, it was combined with a survey on mentoring programs and was faxed to districts in September. Due to space constraints, many of the positions had to be combined or dropped from the form and school districts were asked to report unfilled positions as of September 1, 2000 (rather than December). Table 18 shows the results of the 2000 unfilled position survey. As of September 1, 2000, Illinois public schools reported that there were 2,637 unfilled positions. The areas with the greatest number of unfilled positions were: Elementary Teacher (453), Cross Categorical (239), Learning Disabled (154), Other Special Ed. (113), Mathematics (112), and Guidance Counselor (112). Among the 115 administrative unfilled positions were 43 for Elementary Principal/Asst. and 29 for Secondary Principal/Asst. Because they show where supply has not met demand, unfilled positions are perhaps the best indicators of regional shortages. In terms of regional distribution, however, half (1,308 or 50%) of the unfilled positions were in the City of Chicago School District #299. There were 761 unfilled positions, or 28% of the total, in the suburban districts (Cook and the collar counties) and 568 unfilled positions in the remaining districts. Of particular concern is the rate at which the number of unfilled positions is growing. Over the last four years, the total number of unfilled positions has increased 90%, from a low of 1,387 in 1996 to a high of 2,637 in September 2000. If this trend continues, the total number of unfilled positions could well exceed 5,000 in 2004. As Figure 14 shows, the number of unfilled teaching positions has doubled since 1996. Five years ago, there were only 1,120 unfilled teacher positions. By September 2000, the number had risen to 2,225. The trend for administrators is even more alarming (see Figure 15). The number of unfilled administrator positions has increased over 500% since 1996, from a paltry 17 to a substantial 115. If the current trend continues, there could be over 150 unfilled administrator positions in 2001, and over 250 in 2002.
Figure 15: Administrative Unfilled Positions
0
20
40
60
80
100
120
1996 1997 1998 1999 2000
Figure 14: Instructional Unfilled Positions
0250500750
1,0001,2501,5001,7502,0002,2502,500
1996 1997 1998 1999 2000

26
Table 19: Number of Unfilled Positions in September 2000 [FTE]
Elementary
(K-8) Secondary
(9-12) Total FTE Administrative Elem. Principal 16.50 Elem. Asst. Principal 26.50 Secondary Principal 14.00 Secondary Asst. Principal 15.50 Other Admin. 42.50
Other Certified Staff Adult Education 8.00 Librarian/Media Specialist 102.38 Therapist (Phys./Occupational) 8.25 Guidance Counselor 111.75 Psychologist 37.15 Social Worker 29.63
Instructional Staff Pre-Kindergarten 31.00 Kindergarten 52.65 Standard Elementary Instructor 453.00
Vocational/Technical Education Agriculture 4.00 Business, Marketing, and Mgt. 36.16 Family and Consumer Sciences 15.83 Industrial 46.80 Cooperative Vocational Educ. 5.50
Instructional Areas Art 51.05 12.10 63.15 Bilingual Education 66.00 17.30 83.30 Computer Literacy/Technology 30.00 20.90 50.90 English as a Second Language 11.50 2.40 13.90 English/Language Arts 14.60 72.40 87.00 Foreign Language 17.97 58.00 75.97 Gifted 7.40 0.30 7.70 Health Education 3.60 10.70 14.30 Mathematics 34.80 77.20 112.00 Music (instrumental/vocal) 79.63 17.30 96.93 Physical Education 59.30 44.10 103.40 Reading 42.15 10.10 52.25 Science – Chemistry 2.10 11.10 13.20 Science – Physics 1.60 6.00 7.60 Science – Other 22.00 56.70 78.70 Social Studies/History 4.00 53.00 57.00
Special Education Speech and Language Impaired 83.58 11.85 95.43 Behavior Disordered 38.83 22.35 61.18 Learning Disabled 108.70 45.00 153.70 Cross Categorical 160.10 78.90 239.00 Other Special Education 69.90 43.10 113.00
Total All Unfilled Positions 2636.71

27
V. Projections of Likely High Demand This section presents data on the future need for various categories of educators in Illinois elementary and secondary schools. Data from the Teacher Service Record (TSR) collected annually by the ISBE Research Division are analyzed in this section. Since the TSR files include a very large number of educator categories, many categories were collapsed (e.g., algebra, business mathematics, geometry, etc., were collapsed into a single category, mathematics) to facilitate analysis and presentation. To project the future need for educators, two variables were examined first—(1) the workforce, or the number of educators employed between 1993 and 2001, and (2) the attrition rate since 1996 (the rate at which educators left the education system). Attrition rates for years prior to 1996 were not considered because of the effects of the Early Retirement Incentive program which caused abnormally high rates in 1993 and 1994. Other factors, such as enrollment projections and state laws governing the public school system, were then used to modify the projections where appropriate. Details of the projection method are provided in Appendix F. This year’s projection methodology differs considerably from last year’s. This year, the projection was based on the attrition rate (instead of the retention rate), the data for each educator category were given individual consideration (instead of applying the formula uniformly for all educator categories), and the need for educators is projected four years ahead through 2005 (instead of three years ahead). The Future Need for Educators The findings are presented in terms of: (1) the greatest number of educators needed by educator category, and (2) the “need index” defined as the ratio of the number of educators needed through 2005 to the number in the 2001 workforce for each educator category. The “need index” indicates the relative need for each educator category. Appendix G shows the projected number needed and the need index for the various categories of educators. The projected figures represent the total number of new educators to be hired for the next four years due to increasing demand and attrition. As indicated in earlier sections, between 30% (for administrators) and 42% (for teachers) of the newly hired educators are “re-entries” or individuals who have had previous experience. Thus, not all of the projected demand will need to be filled by new teachers. Greatest number needed: Through 2005, it is estimated that Illinois will need about 9,554 (or between 7,429 and 11,679) administrators and non-instructional personnel. Through 2005, there will be a need for about 55,091 (or between 46,323 and 63,859) teachers. Certain educator categories have inherently large numbers. A good example is “self-contained elementary” teachers – there were 42,158 self-contained elementary teachers in the 2001 workforce. Naturally, these categories will rank high in the list below. In terms of number, the greatest need through 2005 by category are:
Number Rank Administrative and Non-Instructional Staff Needed
1 Social Worker 1,552 2 Guidance Counselor 1,070 3 Elem. Principal/Asst. 984 4 Coordinator 874 5 Library/Media Specialist 740

28
6 Psychologist 620 7 High School Principal/Asst. 575 8 Consultant 549 9 Director/Asst. 540
10 Jr. High Principal/Asst. 468 Number
Rank Instructional Staff/Teachers Needed 1 Self-Contained Elementary 16,713 2 Special Education 9,838 3 English/Language Arts 5,367 4 Science 3,009 5 Mathematics 2,997 6 Social Science 2,408 7 Physical Education 2,035 8 Bilingual Education 1,735 9 Foreign Language 1,514
10 Music - Instrumental/Vocal 1,462 Note: For a more meaningful comparison of the categories in terms of number needed, the instructional Staff/Teacher categories were further collapsed where appropriate, e.g., biology, chemistry, etc., were collapsed into one category, science. No similar collapsing was done in the section on need index below. Highest Need Index: As mentioned earlier, the need index shows the importance of each category relative to the other categories. In terms of the “need index,” the greatest need through 2001 by category are:
Need Rank Administrative and Non-Instructional Staff Index
1 Consultant 73.8% 2 Other Supt. (deputy, associate, assistant) 72.5% 3 Social Worker 62.6% 4 Occupational Therapist 54.3% 5 Admin. Assistant 52.3% 6 Physical Therapist 47.8% 7 Director/Asst. 49.0% 8 Business Manager 47.2% 9 Coordinator 46.3%
10 Jr. High Principal/Asst. 46.0% Need
Rank Instructional Staff/Teachers Index 1 Special Education - Cross Categorical 80.3% 2 Bilingual Education 77.7% 3 Computer Tech/Programming 74.7% 4 English as a Second Language 68.4% 5 Foreign Language – Spanish 65.2% 6 Special Education – Other 61.2% 7 Voc/Tech - Health Occupations 56.3% 8 English/Language Arts - Language Arts 56.2% 9 English/Language Arts - Reading/Remedial Reading 53.2%
10 Science - General Science 53.0%

29
Age, Retirement, and Future Needs: Among the factors affecting the future need for educators, the aging of the educator workforce merits special mention as the baby-boomer generation (AARP, 2001) is anticipated to phase out through retirement over the next several years. A closely related factor, work experience in years, must also be reckoned with. As shown in the section on “retirement projections,” the need for school administrators as a group will be greater since this group is generally older (60% are over age 50) and have more work experience (23% have 31 years experience). On the other hand, teachers as a group are younger (38% are over age 50) and have less experience (9% have 31 years experience).

30
References
AARP. (2001). Baby boomers envision their retirement: An AARP segmentation analysis. Retrieved December 19, 2001 from the World Wide Web: http://research.aarp.org/econ/boomer_seg_1.html.
Education World. (2000). Help wanted: Qualified Principals. Retrieved October 25, 2000 from the World
Wide Web: http://education-world.com/a_admin/067.shtml. Illinois Principals Association. (2000). Memorandum from Dave Turner of IPA to Mike Long of ISBE. Illinois State Board of Education. (2001). Illinois Public School Enrollment Projections: 2001-02 – 2009-10.
Springfield, IL. Illinois State Board of Education. (2000). Educator Supply and Demand. Springfield, IL. Klempen, R. A. and Richetti, C. T. (2001, December). Greening the next generation of principals. Education
Week on the Web. Retrieved December 12, 2001 from the World Wide Web: http://www.edweek.org/ew/newstory.cfm?slug=15klempen.h21.
Olson, L. (2000, January). Principals wanted: Apply just about anywhere. Education Week on the Web.
Retrieved January 2, 2002 from the World Wide Web: http://edweek.org/ew/ewstory.cfm?slug=17leadside.h19.

31
Definition of Terms SUPPLY Endorsements: A credential on a certificate indicating the educator has met the minimum
requirements for that assignment. These counts may be duplicates as one person can hold an unlimited number of certificates or endorsements.
New Supply: The number of newly certified individuals in a fiscal year (July 1 to June 30). Pipeline: A source of future educator supply consisting of students enrolled in
professional preparation programs in Illinois and current program completers who have not yet received certification.
Program Completer: In Illinois, a person who has met all the requirements of a state-approved teacher preparation program. Program requirements vary widely between certificates and between endorsement areas.
DEMAND Attrition: An educator who was employed in an Illinois public school in the previous year
but not in the current year. Demand: The total number of funded positions (i.e., total employed + unfilled positions).
Change in Demand = {Workforce Growth + Attrition + Unfilled Positions}
Educator: For the purposes of this study, educators are personnel employed in Illinois public schools in one of the following four categories: administrators, teachers, school service personnel, or other certified staff.
Eligible to Retire: An educator who is at least 55 years old and has 20 years of experience or more.
Full-Time: An indicator of educator status defined by two TSR fields: Months Employed and Percent-Time Employed. The definition for full-time status is: {Months Employed > 8 and Percent Time Employed > 99%}.
First Time: A newly hired educator with one year of experience or less. This status is calculated from the TSR data field "total years of experience." The definition is: {experience is less than or equal to one year}.
Likely to Retire: An educator who is at least 60 years old and has 31 years of experience or more.
Re-entry: A newly hired educator who has more than one year of teaching experience but was not employed in an Illinois public school the prior year.
Retention: An educator who was employed in both the previous and current year. In order to reduce confusion, both part-time and full-time personnel are included in the calculation (e.g., a part-timer could be retained the next year as a full-timer).
Unfilled Positions: Number of budgeted positions (in full-time equivalent) reported unfilled as of December 1 by each Illinois public school district on the Unfilled Positions Survey.

32
Appendices

33
Appendix A: Enrollment Growth versus Teacher Workforce Growth
Downstate (K-12) Enrollment Growth # Teachers Growth RATIO 1995-96 1,488,021 89,820 16.6 1996-97 1,507,003 1.3% 92,121 2.6% 16.4 1997-98 1,519,062 0.8% 94,622 2.7% 16.1 1998-99 1,526,440 0.5% 97,540 3.1% 15.6 1999-00 1,541,518 1.0% 100,711 3.3% 15.3 2000-01 1,559,388 1.2% 103,248 2.5% 15.1
Chicago (K-12) Enrollment Growth # Teachers Growth RATIO 1995-96 398,062 23,033 17.3 1996-97 403,504 1.4% 23,523 2.1% 17.2 1997-98 407,340 1.0% 23,469 -0.2% 17.4 1998-99 409,079 0.4% 23,639 0.7% 17.3 1999-00 411,859 0.7% 23,568 -0.3% 17.5 2000-01 413,468 0.4% 24,076 2.2% 17.2

34
Appendix B: Teacher Workforce Growth from 2000 to 2001
Assignment
Workforce Growth 00-
>01 Demand 2001 [Gwth+UFP+Attrn]
Total FT
2000
Total FT
2001 n %
Unfilled Positions
00*
Attrition 00--01
[Left Ed + Not
Teaching] n % Alternative Ed. -- 195 -- -- n/a Art 2,524 2,636 112 4% 63 200 375 15% At-Risk / Pre-K 1,278 1,315 37 3% 31 92 160 13% Bilingual Education 2,065 2,234 169 8% 83 214 466 23% Computer/Technology 1,099 1,150 51 5% 51 117 219 20% Driver Education 610 595 (15) -2% n/a 59 44 7% Elementary (Self-Contained) 41,626 42,158 532 1% 506 3,450 4,488 11% English as a Second Language 550 618 68 12% 14 47 129 23% English Language Arts 10,472 10,810 338 3% 139 887 1,364 13% Foreign Language-- Other 790 818 28 4% 32 75 135 17% Foreign Language-- Spanish 1,753 1,903 150 9% 44 159 353 20% Gifted Education 647 660 13 2% 8 56 77 12% Health Education 574 583 9 2% 14 41 64 11% Learning Resource/Library 410 387 (23) -6% n/a 55 32 8% Music 3,810 3,878 68 2% 97 291 456 12% Physical Education 6,753 6,789 36 1% 103 468 607 9% Social Science 5,545 5,733 188 3% 57 472 717 13% Title I 3,370 3,229 (141) -4% n/a 291 150 4% z-Other Subject or Program 2,192 2,118 (74) -3% n/a 292 363 17% Mathematics 6,648 6,882 234 4% 112 575 921 14%
Algebra 1,984 1,950 (34) -2% n/a 176 142 7% Basic and/or General Math 3,030 3,197 167 6% n/a 243 410 14% Business Math 81 81 0 0% n/a 9 9 11% Geometry 542 584 42 8% n/a 49 91 17% Non Title 1 Remedial Math 22 22 0 0% n/a 2 2 9% Other Math 910 966 56 6% n/a 87 143 16% Trigonometry 79 82 3 4% n/a 9 12 15%
Science 6,175 6,377 202 3% 100 526 828 13% Biology 1,455 1,462 7 0% 128 135 9% Chemistry 801 826 25 3% 13 76 114 14% Earth Science 279 289 10 4% 19 29 10% General Science 2,624 2,784 160 6% 233 393 15% Other Science 320 291 (29) -9% 79 31 81 25% Physical Science 321 334 13 4% 15 28 9% Physics 375 391 16 4% 8 24 48 13%
Special Education 20,631 21,481 850 4% 662 1,603 3,115 15% Adapted P.E. 119 121 2 2% n/a 9 11 9% Behavior Disordered 2,179 2,216 37 2% 61 167 265 12% Cross Categorical 3,305 3,610 305 9% 239 269 813 25% Deaf 330 313 (17) -5% n/a 34 17 5% Early Childhood 1,030 1,046 16 2% n/a 82 98 10% Educationally Handicapped 89 86 (3) -3% n/a 5 2 2% EMH 1,169 1,135 (34) -3% n/a 93 59 5% Hard of Hearing 275 280 5 2% n/a 16 21 8% Homebound/Hospital 14 13 (1) -7% n/a 2 1 7% Learning Disabled 7,053 7,193 140 2% 154 482 776 11%

35
Multiply Handicapped 193 219 26 13% n/a 20 46 24% Other/General Special Ed. 1,028 1,242 214 21% 113 112 439 43% Physically Handicapped 271 273 2 1% n/a 21 23 8% Severe/Profound Mentally Hand. 208 204 (4) -2% n/a 15 11 5% Speech & Language Impaired 2,362 2,527 165 7% 95 208 468 20% TMH 785 791 6 1% n/a 50 56 7% Visually Impaired 221 212 (9) -4% n/a 18 9 4%
Vocational Technical 4,757 4,774 17 0% 108 442 567 12% Agriculture 313 319 6 2% 4 24 34 11% Business, Marketing, Management 1,341 1,358 17 1% 36 133 186 14% Family & Consumer Sciences 1,160 1,180 20 2% 16 89 125 11% Health Occupations 69 72 3 4% 9 12 17% Industrial Occupations 1,559 1,533 (26) -2% 47 145 166 11% Vocational Technical Misc. 315 312 (3) -1% 6 42 45 14%
124,279 127,323 3,044 2% 2,225 10,412 15,681 12.6%
*Note: due to the needs of the Governor and Legislature the 2000 UFP survey was done early and in a truncated form. Some of the categories had to be dropped and others combined. Numbers in italics are estimates deduced from the combined categories.
Note: Column totals and/or subtotals may vary due to rounding.

36
Appendix C: Projections of Educators Likely to Retire by Position [2002-05] PROJECTIONS
2001 FT
Employed
If 25% Retire a Year
[4 YR Total] If All Retire [4 YR Total]
Likely 02 age01≥60 & exper≥31
Likely 03 age01=59 & exper≥30
Likely 04 age01=58 & exper≥29
Likely 05 age01=57 & exper≥28
# # %- 01 # %- 01 # %- 01 # %- 01 # %- 01 # %- 01 Administrative 8,551 643 8% 956 11% 389 5% 129 2% 190 2% 248 3%
Regional Supt./Asst. 92 27 30% 33 36% 22 24% 4 4% 2 2% 5 5% District Supt. 852 101 12% 152 18% 57 7% 24 3% 32 4% 39 5% Other Supt. 407 38 9% 58 14% 25 6% 0 18 4% 15 4% Admin. Asst. 149 3 2% 6 4% 1 1% 3 2% 2 1% Business Manager 165 9 5% 13 8% 6 4% 2 1% 5 3% Director/Asst. 1,102 75 7% 115 10% 43 4% 17 2% 22 2% 33 3% Elem. Princ. 2,284 204 9% 291 13% 136 6% 31 1% 54 2% 70 3% Elem. Asst. Princ. 429 16 4% 27 6% 6 1% 4 1% 11 3% 6 1% Jr. Princ. 586 25 4% 41 7% 13 2% 6 1% 9 2% 13 2% Jr. Asst. Princ. 431 12 3% 19 4% 4 1% 6 1% 4 1% 5 1% HS Princ. 733 66 9% 97 13% 41 6% 15 2% 15 2% 26 4% HS Asst. Princ. 710 44 6% 68 10% 22 3% 15 2% 11 2% 20 3% Jr. Dean 140 5 3% 6 4% 4 3% 1 1% 1 1% Sr. Dean 471 19 4% 30 6% 9 2% 5 1% 8 2% 8 2%
Instructional 127,323 3,936 3% 5,872 5% 2,238 2% 951 1% 1,257 1% 1,426 1% Elementary Teacher 57,136 1,880 3% 2,726 5% 1,124 2% 436 1% 550 1% 616 1% Jr./Middle Teacher 17,846 502 3% 796 4% 267 1% 119 1% 173 1% 237 1% High School Teacher 30,839 1,234 4% 1,877 6% 667 2% 317 1% 423 1% 470 2% Spec. Ed. (all levels) 21,502 321 1% 473 2% 180 1% 79 0.4% 111 1% 103 0.5%
Other Certified Staff 5,194 323 6% 447 9% 214 4% 61 1% 80 2% 92 2% Consultant 744 40 5% 53 7% 26 3% 8 1% 12 2% 7 1% Coordinator 1,887 128 7% 172 9% 90 5% 19 1% 31 2% 32 2% Librarian/Media 1,960 128 7% 180 9% 84 4% 27 1% 24 1% 45 2% Supervisor 520 26 5% 40 8% 12 2% 7 1% 13 3% 8 2% Occupational Therapist 60 0 0% 0 0% Physical Therapist 23 2 9% 2 9% 2 9%
School Service 7,726 341 4% 505 7% 203 3% 76 1% 96 1% 130 2% Guidance Counselor 2,900 222 8% 338 12% 125 4% 56 2% 63 2% 94 3% Nurse 921 23 3% 29 3% 18 2% 2 0.2% 6 1% 3 0.3% Psychologist 1,426 54 4% 75 5% 36 3% 11 1% 12 1% 16 1% Social Worker 2,479 41 2% 63 3% 24 1% 7 0.3% 15 1% 17 1%
Other Position 200 4 2% 6 3% 2 1% 2 1% 0 3 1.5% 148,994 5,246 4% 7,786 5% 3,046 2% 1,219 1% 1,623 1% 1,899 1%
Note: Column totals and/or subtotals may vary due to rounding.
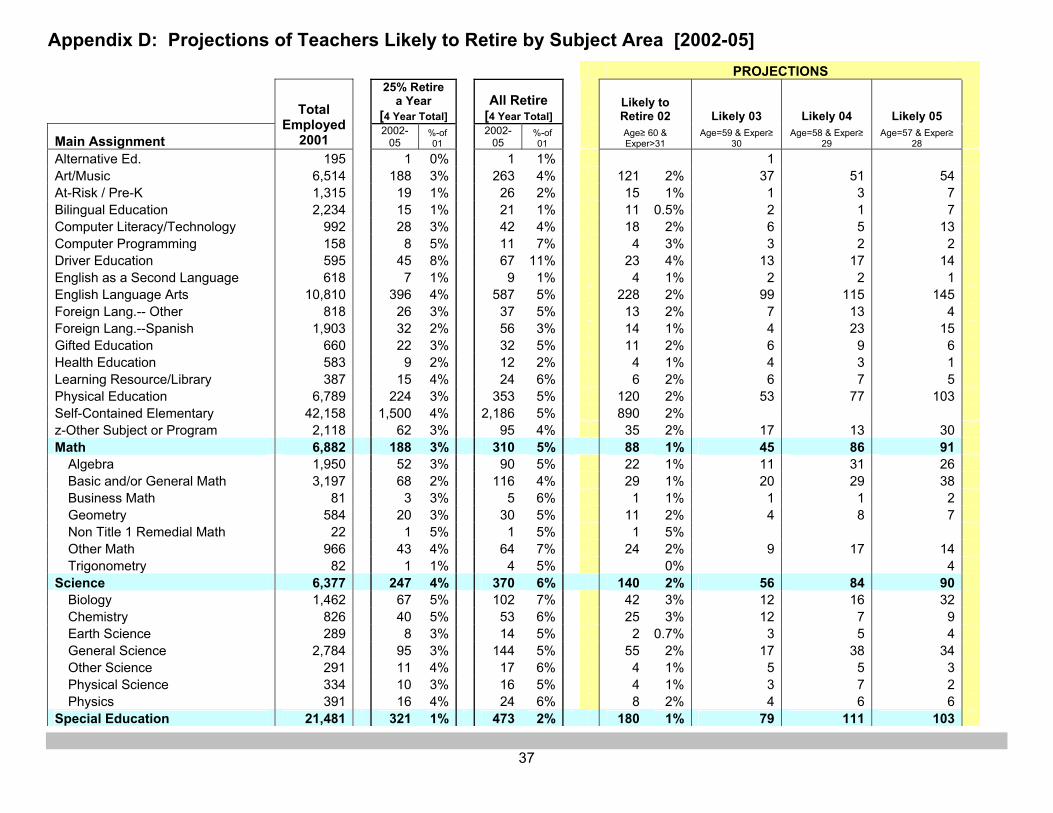
37
Appendix D: Projections of Teachers Likely to Retire by Subject Area [2002-05]
PROJECTIONS
25% Retire a Year
[4 Year Total] All Retire
[4 Year Total] Likely to Retire 02 Likely 03 Likely 04 Likely 05
Main Assignment
Total Employed
2001 2002-
05 %-of 01
2002-05
%-of 01
Age≥ 60 & Exper>31
Age=59 & Exper≥ 30
Age=58 & Exper≥ 29
Age=57 & Exper≥ 28
Alternative Ed. 195 1 0% 1 1% 1 Art/Music 6,514 188 3% 263 4% 121 2% 37 51 54 At-Risk / Pre-K 1,315 19 1% 26 2% 15 1% 1 3 7 Bilingual Education 2,234 15 1% 21 1% 11 0.5% 2 1 7 Computer Literacy/Technology 992 28 3% 42 4% 18 2% 6 5 13 Computer Programming 158 8 5% 11 7% 4 3% 3 2 2 Driver Education 595 45 8% 67 11% 23 4% 13 17 14 English as a Second Language 618 7 1% 9 1% 4 1% 2 2 1 English Language Arts 10,810 396 4% 587 5% 228 2% 99 115 145 Foreign Lang.-- Other 818 26 3% 37 5% 13 2% 7 13 4 Foreign Lang.--Spanish 1,903 32 2% 56 3% 14 1% 4 23 15 Gifted Education 660 22 3% 32 5% 11 2% 6 9 6 Health Education 583 9 2% 12 2% 4 1% 4 3 1 Learning Resource/Library 387 15 4% 24 6% 6 2% 6 7 5 Physical Education 6,789 224 3% 353 5% 120 2% 53 77 103 Self-Contained Elementary 42,158 1,500 4% 2,186 5% 890 2% z-Other Subject or Program 2,118 62 3% 95 4% 35 2% 17 13 30 Math 6,882 188 3% 310 5% 88 1% 45 86 91
Algebra 1,950 52 3% 90 5% 22 1% 11 31 26 Basic and/or General Math 3,197 68 2% 116 4% 29 1% 20 29 38 Business Math 81 3 3% 5 6% 1 1% 1 1 2 Geometry 584 20 3% 30 5% 11 2% 4 8 7 Non Title 1 Remedial Math 22 1 5% 1 5% 1 5% Other Math 966 43 4% 64 7% 24 2% 9 17 14 Trigonometry 82 1 1% 4 5% 0% 4
Science 6,377 247 4% 370 6% 140 2% 56 84 90 Biology 1,462 67 5% 102 7% 42 3% 12 16 32 Chemistry 826 40 5% 53 6% 25 3% 12 7 9 Earth Science 289 8 3% 14 5% 2 0.7% 3 5 4 General Science 2,784 95 3% 144 5% 55 2% 17 38 34 Other Science 291 11 4% 17 6% 4 1% 5 5 3 Physical Science 334 10 3% 16 5% 4 1% 3 7 2 Physics 391 16 4% 24 6% 8 2% 4 6 6
Special Education 21,481 321 1% 473 2% 180 1% 79 111 103

38
Adapted P.E. 121 0 0% 0 0% 0% Behavior Disordered 2,216 22 1% 34 2% 11 0.5% 7 8 8 Cross Categorical 3,610 46 1% 62 2% 29 1% 12 10 11 Deaf 313 10 3% 14 4% 6 2% 2 3 3 Early Childhood, Spec Ed 1,046 5 1% 7 1% 3 0.3% 1 3 Educationally Handicapped 86 5 6% 8 9% 3 3% 1 2 2 EMH 1,135 30 3% 41 4% 18 2% 7 11 5 Hard of Hearing 280 5 2% 9 3% 1 0.4% 3 2 3 Homebound/Hospital 13 0 2% 1 8% 0% 1 Learning Disabled 7,193 88 1% 130 2% 52 1% 19 26 33 Multiply Handicapped 219 2 1% 4 2% 1 0.5% 2 1 Other/General Special Ed 1,242 31 2% 43 3% 18 1% 8 9 8 Physically Handicapped 273 8 3% 13 5% 6 2% 2 5 Severe/Profound Mentally Hand. 204 4 2% 5 2% 1 0% 2 2 Speech & Language Impaired 2,527 48 2% 76 3% 24 1% 11 22 19 TMH 791 14 2% 22 3% 5 1% 5 9 3 Visually Impaired 212 3 1% 4 2% 2 1% 1 1
Social Science 5,733 270 5% 409 7% 145 3% 73 88 103 Civics 190 7 4% 11 6% 3 2% 4 1 3 Economics 74 4 6% 6 8% 2 3% 2 1 1 General/Other Social Studies 2,744 112 4% 169 6% 63 2% 27 37 42 Geography 325 16 5% 26 8% 6 2% 7 6 7 History 2,297 125 5% 191 8% 68 3% 31 42 50 Psychology 103 5 5% 6 6% 3 3% 2 1
Title 1 3,229 124 4% 183 6% 68 2% 33 43 39 Title 1 Remedial Math 210 10 5% 14 7% 5 2% 3 4 2 Title 1 Remedial Reading 3,019 114 4% 169 6% 63 2% 30 39 37
Vocational-Technical 4,774 193 4% 305 6% 100 2% 52 63 90 Agriculture 319 6 2% 12 4% 2 1% 1 4 5 Business 1,358 72 5% 109 8% 36 3% 24 21 28 Family & Consumer 1,180 38 3% 58 5% 20 2% 10 12 16 Health 72 0 0% 0 0% 0% Industrial 1,533 70 5% 109 7% 40 3% 15 19 35 Voc-Tech Misc. 312 9 3% 17 5% 2 1% 2 7 6
127,323 3,936 3%
5,872 5%
2,238 1.8% 599 816 923

39
Appendix E: 2001 Teacher Attrition by Subject Area
Total Employed
2000
Left Education 2000--01
Chg Pstn Not Teaching
Left Ed + Not Teaching
Art 2,524 191 8% 9 0% 200 7.9%At-Risk / Pre-K 1,278 81 6% 11 1% 92 7.2%Bilingual Education 2,065 187 9% 27 1% 214 10.4%Computer/Technology 1,099 95 9% 22 2% 117 10.6%Driver Education 610 55 9% 4 1% 59 9.7%English as a Second Language 550 43 8% 4 1% 47 8.5%English Language Arts 9,654 792 8% 95 1% 887 9.2%Foreign Language-- Other 790 65 8% 10 1% 75 9.5%Foreign Language-- Spanish 1,753 147 8% 12 1% 159 9.1%Gifted Education 647 46 7% 10 2% 56 8.7%Health Education 574 27 5% 14 2% 41 7.1%Learning/Resource Center Library 410 31 8% 24 6% 55 13.4%Mathematics 6,648 501 8% 74 1% 575 8.6%Music 3,810 272 7% 19 0% 291 7.6%Physical Education 6,753 379 6% 89 1% 468 6.9%Reading Improvement 818 54 7% 13 2% 67 8.2%Self-Contained Elementary 41,626 3,052 7% 331 1% 3,383 8.1%Social Science 5,545 414 7% 58 1% 472 8.5%Title I 3,370 251 7% 40 1% 291 8.6%z-Other Subject or Program 2,192 231 11% 61 3% 292 13.3%SCIENCE 6,175 470 8% 56 1% 526 8.5%
Biology 1,455 114 8% 14 1% 128 8.8%Chemistry 801 70 9% 6 1% 76 9.5%Earth Science 279 18 6% 1 0% 19 6.8%General Science 2,624 205 8% 28 1% 233 8.9%Other Science 320 26 8% 5 2% 31 9.7%Physical Science 321 15 5% 0% 15 4.7%Physics 375 22 6% 2 1% 24 6.4%
SPECIAL EDUCATION 20,631 1,320 6% 283 1% 1,603 7.8%Behavior Disordered 2,179 126 6% 41 2% 167 7.7%Cross Categorical 3,305 225 7% 44 1% 269 8.1%Deaf 330 29 9% 5 2% 34 10.3%Early Childhood Spec Ed 1,030 76 7% 6 1% 82 8.0%EMH 1,169 81 7% 12 1% 93 8.0%Hard of Hearing 275 16 6% 0 0% 16 5.8%Learning Disabled 7,053 388 6% 94 1% 482 6.8%Multiply Handicapped 193 18 9% 2 1% 20 10.4%Other/General Special Education 1,250 84 7% 44 4% 128 10.2%Physically Handicapped 271 16 6% 5 2% 21 7.7%Severe/Profound Mentally Hand. 208 12 6% 3 1% 15 7.2%Speech and Language Impaired 2,362 192 8% 16 1% 208 8.8%TMH 785 41 5% 9 1% 50 6.4%Visually Impaired 221 16 7% 2 1% 18 8.1%
VOCATIONAL TECHNICAL 4,757 396 8% 46 1% 442 9.3%Agriculture 313 22 7% 2 1% 24 7.7%Business 1,341 118 9% 15 1% 133 9.9%Family & Consumer 1,160 81 7% 8 1% 89 7.7%Health 69 8 12% 1 1% 9 13.0%Industrial 1,559 134 9% 11 1% 145 9.3%Voc-Tech Misc. 315 33 10% 9 3% 42 13.3%
124,279 9,100 7% 1,312 1% 10,412 8.4%

40
Appendix F: Projection Methodology The projections of the needs for educators were based mainly on two Teacher Service Record (TSR) variables: (1) the workforce (the number of full-time educators employed) in each category, and (2) the attrition rate (the ratio of the number of educators who left the education system to the number in the workforce) for each category. The educator categories are listed in Appendix G. The Workforce Component: First, the workforce trend since 1993 was examined. Then, the annual percentage changes were computed and an average was derived. Generally, the yearly workforce for each category was projected based on the historical trend and the application of the average percentage change for each category. The Attrition Rate Component: The trend for attrition rate since 1996 was examined. (Attrition rates for years prior to 1996 were not considered because of the effects of the Early Retirement Incentive program of 1993 and 1994.) The annual percentage changes were computed and an average was derived. Generally, the yearly attrition rate for each category was projected based on the historical trend and the application of the average percentage change for each category. Modifying Factors: In addition to the workforce and attrition trends, other factors considered were the laws/conventions governing the Illinois education system. For example, there will be only one district superintendent for each district and as districts consolidate, the number of district superintendents will likely decline. On the other hand, the need for other superintendents (deputy, associate, assistant) will likely increase. While the data do not show a strong correlation between student enrollment and workforce growth, consideration was given to student enrollment in the projection of selected categories, including the greater need for secondary teachers over elementary teachers. Projection of Future Need—Low Estimate: Based on the actual 1998-2000 attrition rates, an average attrition rate was computed for each educator category. (Attrition rates prior to 1998 were considered too low for computing this average). This rate was applied to the projected workforce to derive the need for each future year due to attrition. The sum of the future need due to attrition and the yearly change in the projected workforce (difference in the workforce) provided the projected total future need for each year. Projection of Future Need—High Estimate: The trend in the attrition was considered. Based on the changes in attrition rates between 1996 and 2000, an average rate was computed for each educator category. This rate was applied to the projected workforce to derive the need for each future year due to attrition. The sum of the future need due to attrition and the yearly change in the projected workforce (difference in the workforce) provided the projected total future need for each year. Since most of the categories showed increasing trends, this part of the projection process produced the higher level estimate of the future need for educators. Projection of Future Need—Middle Estimate: The average of the low and high estimates was computed to derive the middle estimate. Need Index: The index for each category is its projected need (middle estimate) expressed as a percent of its 2001 workforce.

41
Appendix G: Projected Need for Educators [2002-05] Projected Need Through 2005 Low Middle High Need Administrative
Total Employed
2001 Estimate Estimate Estimate Index Regional Supt./Asst. 92 16 38 60 41.3%District Supt. 852 221 262 303 30.7%Other Supt. (Deputy, Assoc., Asst.) 407 172 295 418 72.5%Admin Assistant 149 47 78 109 52.3%Business Manager 165 49 78 106 47.2%Director/Asst. 1,102 454 540 625 49.0%Elem. Principal/Asst. 2,713 740 984 1,227 36.3%Jr. High Principal/Asst. 1,017 345 468 591 46.0%High School Principal/Asst. 1,443 463 575 687 39.9%Jr./Sr. High Dean 611 198 227 255 37.1%
Other Certified Staff
Consultant 744 362 549 736 73.8%Coordinator 1,887 757 874 991 46.3%Library/Media Specialist 1,960 514 740 966 37.8%Supervisor 520 107 132 156 25.3%Occupational Therapist 60 34 33 31 54.3%Physical Therapist 23 12 11 11 49.1%
School Service Personnel
Guidance Counselor 2,900 785 1,070 1,355 36.9%Nurse 921 290 383 475 41.5%Psychologist 1,426 564 620 676 43.5%Social Worker 2,479 1,253 1,552 1,852 62.6%
Other Position 200 44 47 50 23.4%
Total: Non-Instructional Staff 21,671 7,429 9,554 11,679 44.1% Instructional Staff
Art 2,636 1,112 1,373 1,635 52.1%At-Risk / Pre-K 1,315 566 593 621 45.1%Bilingual Education 2,233 1,654 1,735 1,815 77.7%Computer Tech/Programming 1,150 663 859 1,055 74.7%Driver Education 595 117 161 205 27.1%English as a Second Language 618 399 423 446 68.4%English/Lang. Arts - English 5,246 1,787 2,370 2,953 45.2%English/Lang. Arts - Language Arts 3,111 1,464 1,747 2,031 56.2%English/Lang. Arts - Other 716 273 325 377 45.4%English/Lang. Arts - Reading/Remedial Reading 1,737 735 925 1,114 53.2%Foreign Language - Other 818 274 274 273 33.5%Foreign Language - Spanish 1,903 1,099 1,241 1,383 65.2%Gifted Education 660 251 313 375 47.4%Health Education 583 188 220 252 37.8%Learning/Resource Center Library 387 113 168 224 43.5%Mathematics 6,882 2,446 2,997 3,548 43.6%Music - Instrumental/Vocal 3,878 1,420 1,462 1,503 37.7%Other Instructional 2,314 1,330 1,562 1,793 67.5%

42
Physical Education 6,789 1,633 2,035 2,437 30.0%Science - Biology 1,462 493 618 742 42.2%Science - Chemistry 826 310 415 521 50.3%Science - Earth Science 289 96 122 148 42.2%Science - General Science 2,784 1,216 1,477 1,737 53.0%Science - Other 291 30 77 123 26.4%Science - Physical Science 334 148 144 140 43.1%Science - Physics 391 137 157 176 40.1%Self-Contained Elementary 42,158 13,443 16,713 19,983 39.6%Social Science 5,733 2,013 2,408 2,803 42.0%Special Ed. - Behavior Disordered 2,216 688 674 660 30.4%Special Ed. - Cross Categorical 3,610 2,754 2,898 3,041 80.3%Special Ed. - Deaf/Hard of Hearing 593 158 192 227 32.5%Special Ed. - EMH/TMH 1,926 297 426 556 22.1%Special Ed. - Learning Disabled 7,193 2,306 2,406 2,505 33.4%Special Ed. - Other 2,931 1,585 1,794 2,002 61.2%Special Ed. - Physically Handicapped 273 59 62 65 22.8%Special Ed. - Speech & Lang Impaired 2,527 1,234 1,322 1,411 52.3%Special Ed. - Visually Impaired 212 50 64 78 30.2%Title 1- Remedial Math/Reading 3,229 724 959 1,194 29.7%Voc/Tech - Agriculture 319 101 125 148 39.1%Voc/Tech - Business/Marketing/Mgt. 1,358 262 373 485 27.5%Voc/Tech - Family/Consumer Sc 1,180 305 372 439 31.5%Voc/Tech - Health Occupations 72 35 41 46 56.3%Voc/Tech - Industrial Occupations 1,533 238 335 433 21.9%Voc/Tech - Vocational Ed 312 115 134 153 43.0%
Total: Instructional Staff 127,323 46,323 55,091 63,859 43.3% TOTAL 148,994 53,752 64,645 75,538 43.4%
Note: Column totals and/or subtotals may vary due to rounding.