edvt12015, assessment two, idiens, samantha
DESCRIPTION
2.3TRANSCRIPT

Samantha Idiens (S0236287)
EDVT12015 - Adolescent & Adult Literacy & Numeracy
Assessment Two: Planning for Literacy and Numeracy
Due: 30th January 2014 11:45pm
Samantha Idiens|| EDVT12015 Assessment Two

Part A: Overview of Unit
Unit Overview
‘Geographies of Human Wellbeing’ is a 25-hour Australian Curriculum unit designed to inform year
ten students of human wellbeing through the investigation of global, national and local differences in
human wellbeing (Queensland Studies Authority (QSA), 2013). Throughout the unit, year ten students
are facilitated to extend their knowledge beyond their own communities through observing more
abstract concepts, complex ideas, and debating alternative answers and interpretations (QSA, 2013).
The unit allows students to examine the different concepts and measures associated with human
wellbeing, and the various reasons for differences in measures between countries (QSA, 2013).
Students will learn different ways of measuring and mapping human wellbeing development, ways to
analyse and interpret data, whilst using this knowledge to understand spatial variances between
different places and the impact that has on human wellbeing (QSA, 2013).
Unit Assessment
The year ten unit gives students multiple opportunities to demonstrate their knowledge, skills, and
understanding through the implementation of a range of assessment pieces. Throughout the unit,
student assessment will be collected in student folios, which allows continuous feedback to students
on their progress. Formative assessment within the unit will occur through students presenting their
findings to peers, the class or the teacher, as well as the teacher monitoring and giving feedback on
student progress with definitions, data collection, analysis and use. Teachers are given the option of
two assessment items, the first being a stimulus response essay and the other requiring data
manipulation and an extended written response. The purpose of the assessment pieces is to make
judgments on students’ ability to evaluate geographical sources, infer relationships, synthesise
information and understand differences in human wellbeing between places. The assessment aligns
with the Australian Curriculum requirements and students will learn a variety of numeracy knowledge
and skills (QSA, 2013).
Part B: Australian Curriculum Numeracy Demands
The Australian Curriculum content descriptors within the ‘Geographies of Human Wellbeing’ target
numeracy knowledge and skills for year ten Geography students. The knowledge and understanding,
and skills targeted in the unit will enhance students’ numeracy skills, since numeracy capability
improves as students investigate concepts fundamental to Geography. Students’ numeric ability
improves in Geography through examining location and distances, spatial distribution, organization
and management of places. The Australian Curriculum states that students develop numeric skills as
they count and measure, construct, calculate and interpret geographic data, to test relationships
between data.
Samantha Idiens|| EDVT12015 Assessment Two 2

Numeracy Capabilities (Adapted Appendix One) (ACARA, n.d.) Learning Demands in Unit (ACARA, n.d.)
Geographical Knowledge and Understanding1. The different ways of measuring and mapping human wellbeing and development, and how
these can be applied to measure differences between places (ACHGK076)2. The reasons for spatial variations between countries in selected indicators of human wellbeing
(ACHGK077)3. The issues affecting the development of places and their impact on human wellbeing, drawing
on a study from a developing country or region in Africa, South America or the Pacific Islands (ACHGK078)
4. The reasons for and consequences of spatial variations in human wellbeing on a regional scale within India or another country of the Asia region (ACHGK079)
5. The reasons for and consequences of spatial variations in human wellbeing in Australia at the local scale (ACHGK080)
Students are expected to: Understand human wellbeing through interpreting maps and
diagrams that indicate differences between places. Examine indicators of human wellbeing such as the Human
Development Index (HDI) to understand spatial variations Measure and map the differences of development indicators,
such as the HDI, on a bar graph to understand spatial differences Map development indicator data into geographic representations,
for example, maps, graphs and/or tables. Analyse transformed data and comment of spatial patterns and
relationships between places. Examine case study such as gender inequality in Africa through
exploring development indicators, compare and contrast data through measuring and mapping data.
Examine political, economic and environmental factors on a regional scale, map and measure factors in order to compare and contrast spatial variations.
Examine local case study of spatial variations of human wellbeing in Australia; interpret data associated with factors such as employment and living conditions
Collecting, recording, evaluating and representing1. Evaluate sources for their reliability, bias and usefulness and represent multi-variable data in a
range of appropriate forms, for example, scatter plots, tables, field sketches and annotated diagrams with and without the use of digital and spatial technologies (ACHGS074)
2. Represent the spatial distribution of geographical phenomena by constructing special purpose maps that conform to cartographic conventions, using spatial technologies as appropriate (ACHGS075)
Use metric units to measure and estimate the spatial variations of developed and developing countries.
Compare human wellbeing indicators from a variety of sources, commenting of variations, e.g. tables, maps.
Construct a choropleth map to represent spatial distribution of human wellbeing, for example, gender inequality, HDI, employment.
Interpreting, analysing and concluding1. Evaluate multi-variable data and other geographical information using qualitative and
quantitative methods and digital and spatial technologies as appropriate to make generalisations and inferences, propose explanations for patterns, trends, relationships and anomalies, and predict outcomes (ACHGS076)
2. Apply geographical concepts to synthesise information from various sources and draw conclusions based on the analysis of data and information, taking into account alternative points of view (ACHGS077)
Compare human wellbeing data, such the Gender Inequality Index, of developed and developing nations, students use data to recognize and use patterns in varying levels of human wellbeing.
Map and measure human wellbeing data from various sources, for example, living conditions and observe and comment of various points of view.
Samantha Idiens|| EDVT12015 Assessment Two 3

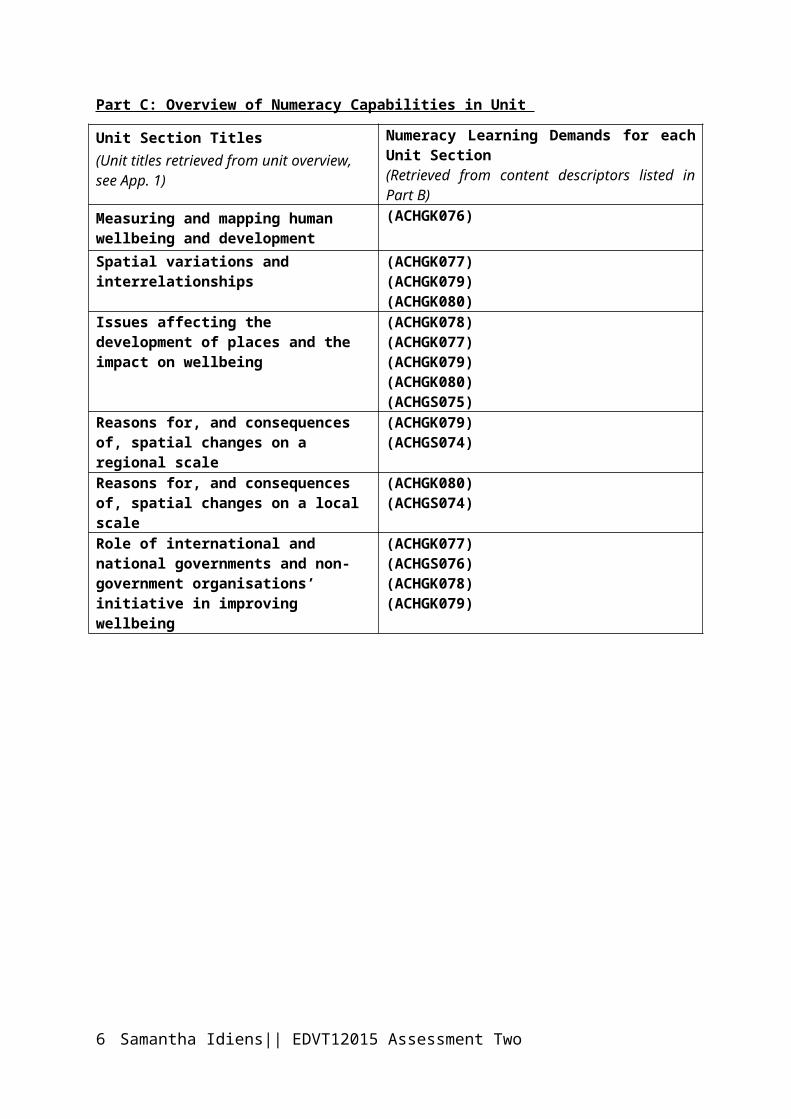
Part C: Overview of Numeracy Capabilities in Unit
Unit Section Titles(Unit titles retrieved from unit overview, see App. 1)
Numeracy Learning Demands for each Unit Section(Retrieved from content descriptors listed in Part B)
Measuring and mapping human wellbeing and development
(ACHGK076)
Spatial variations and interrelationships (ACHGK077)(ACHGK079)(ACHGK080)
Issues affecting the development of places and the impact on wellbeing
(ACHGK078)(ACHGK077)(ACHGK079)(ACHGK080)(ACHGS075)
Reasons for, and consequences of, spatial changes on a regional scale
(ACHGK079)(ACHGS074)
Reasons for, and consequences of, spatial changes on a local scale
(ACHGK080)(ACHGS074)
Role of international and national governments and non-government organisations’ initiative in improving wellbeing
(ACHGK077)(ACHGS076)(ACHGK078)(ACHGK079)
Samantha Idiens|| EDVT12015 Assessment Two 4

Part D: Learning Sequences Addressing Numeracy Capabilities Numeracy outcomes can be translated on page three.Learning Sequence One: Lesson One
Description: The learning sequence is a 70-minute introductory lesson to be conducted at the very beginning of the unit. The lesson focus consists of familiarising the students with human wellbeing and development, whilst beginning to measure and map indicators of human wellbeing and development. The intended learning and numeracy outcomes is for students to understand some ways to measure and map human wellbeing and development. The learning experience asks students to familiarize themselves with data and begin to map and compare that data through the use of tables and graphs. Students engage in glossary activities to process terms and concepts associated with unit topic. A class brainstorm session will be initiated in order to create a mind map of what new knowledge the students have acquired.
Numeracy Outcomes: (ACHGK076)
Resources Needed: PowerPoint, Projector, HDI Data, YouTube, Laptops, Whiteboard, Stationary, www.hdr.undp.org, Internet, Student Folios
Steps: 1. INTRO TO UNIT: Show students image collage slideshow on PowerPoint (PPT) of various
instances of human wellbeing and development. Differences between developed and developing nations; teacher commenting on development factors such as living conditions.
2. Glossary Activity: Students copy terms and concepts from whiteboard that are associated with human wellbeing and development, and development indicators, i.e. Human Development Index (HDI), developed nations, gender inequality, etc.
3. Display HDI’s through projector- Teacher will model research task by showing students how to negotiate website, teacher will find HDI data for the United States and India. Students will write data in notebooks/laptops.
4. Research Task: Students research and document HDI data for Australia and Sudan (website: www.hdr.undp.org), then write a few sentences on the variances of the four sets of data.
5. Group discussion: Students move to discuss with the students around them, restrain impulsivity (DoL5)- Why would the HDI in Sudan contrast to that of Australia and the United States?
6. Move into class discussion of findings.7. Display and discuss examples of various graphs through the use of the projector and
whiteboard.8. Students must use bar graphs to map and measure to spatial variations of the United States,
Australia, India and Sudan. The example will be projected for a point of reference. 9. Once activity is finished, students compile their data and graphs into their personal folios, by
physical folder or laptop. 10. Finish lesson through class brainstorm session: skeleton of concept map written on board.
Students asked to brainstorm new knowledge they have acquired surrounding human wellbeing and development.
11. Collect folios for observation of student progress and dismiss.
Samantha Idiens|| EDVT12015 Assessment Two 5
Learning Sequence Two: Lesson Three
Description: This lesson highlights the variance in human wellbeing and development through the use of indicator data. Spatial variations and interrelationships between places are highlighted and commented on. The learning and numeracy outcomes of this lesson are for students to use human indicator data to map and measure the spatial variations between interrelationships. Students are asked to create bar graphs from data they have collected and comment on this data alongside a choropleth map of HIV prevalence. The KWL strategy is incorporated to allow students to be in charge of their own learning, what they want to learn. The website listed below helps students locate data and evaluate the human development indicators within it.
Numeracy Outcomes: (ACHGS077) (ACHGS076) (ACHGK077)
Resources: Projector, YouTube, Laptops, Whiteboard, Stationary, Internet, International Human Development Indicators (incorporating the Human Development Index) www.hdr.undp.org/en/data/map/ , Adult HIV prevalence (15-49yrs) choropleth map, Students Folios. Steps:
1. Model KWL Strategy- ‘What do I already know?’ ‘What is the difference between the human wellbeing and development of a developing nation and a developed nation?’. Students will draw a concept map in their notebooks/laptops.
2. Class discussion- students contribute notes from their individual concept maps.3. KWL- ‘What do I want to learn?’ What information do you want to know in order to
understand the difference between the two types of nations? Brainstorm ideas on whiteboard- create link to human development indicators.
4. Group activity- Move class into groups of three to four and model a research task.5. Demonstrate over the projector that the students are to open their Internet browsers to the
International Human Development Indicators (incorporating the Human Development Index) www.hdr.undp.org/en/data/map/.
6. The students must compare Australia to three different countries using three different International Human Development Indicators. Students must document data into tables in their notebooks/laptops. Highlight that their brainstorm session earlier of ‘what I want to learn’ should lead their research.
7. Ask students to examine data and transfer the information into a bar graph.8. Tell students once they complete this they must write a small paragraph commenting on the
spatial variations between the nations. 9. On the whiteboard- What interrelationships are evident between the countries? Allow time for
students to write answer in notebooks/laptops.10. Ask student response, document student thoughts on whiteboard in list form. Allow time for
positive reinforcement and feedback when individuals answer. 11. On the projector- display choropleth map of HIV Prevalence in Adults aged 15-49years. Ask
students to mentally take note. 12. KWL Strategy- ‘What have I learnt’? Ask students to write paragraphs on what they now
know about the spatial variations and interrelations between nations’ human wellbeing and development?
13. Hand out student portfolios- completed KWL ‘What have I learnt’ answers go into folder. 14. Collect folders for observation.
Samantha Idiens|| EDVT12015 Assessment Two 6

Learning Sequence Three: Lesson FiveDescription: This sequence is designed to be implemented in the fourth lesson of the unit, since it requires students to have a basic to developing understanding of human wellbeing and development. The lesson focuses on issues affecting the development of places, therefore a case study has been selected in order to explore development indicators (social, economic, political, environmental) in order to assess impact on wellbeing. Learning and numeracy outcomes focus on Gender Inequality in Africa, identifying spatial variations within the continent through data collection and graphs and/or maps. The work of this lesson is peer-oriented, and allows for students to learn from multiple approaches to the same question/activity. Students are given the responsibility a home-time research task in order to stimulate further thinking on the case study.Numeracy Outcomes: (ACHGS077) (ACHGK078) (ACHGK077) (ACHGK076) (ACHGS074)Resources: Projector, YouTube: Mind the Gap: Gender Equality and Trade in Africa (Trailer), Laptops, Gender Inequality Index (GII): www.hdr.undp.org, Whiteboard, Stationary, Internet, Teacher supplied Stationary, A3 Paper.
Steps:1. Inform students of lesson case study on the whiteboard: Gender Inequality in Africa 2. Play Mind the Gap: Gender Equality and Trade in Africa (Trailer) through Youtube. Beforehand
ask students to note indicators that suggest African women experience a different kind of ‘human wellbeing’ than Australia women.
3. Glossary Activity: define social, economic, political and environmental indicators, gender inequality.
4. Inform students that the lesson will follow a Think, Pair, Share design. 5. THINK: Individual Concept Map: Students brainstorm the issues associated with gender equality
in Africa in the ‘Mind the Gap’ clip. 6. PAIR: Ask students to form pairs and use laptops to research the Gender Inequality Index (GII)
of five African nations.7. Once completed, tell students to stay in pairs and for one of them to collect five colours and an A3
sheet from the front of the classroom. 8. Students must graph/map their collected data through a convention that they see fits, e.g. bar
graph, pie graph, choropleth map, scatter plot. The pair will be asked later to explain their choice in data presentation.
9. Display examples of bar graphs, pie graphs on A3 paper etc., in order for students to be correct to the best of their ability.
10. Create incentive- Highlight to students that the top two map/graph/table will be laminated to go on the wall.
11. SHARE: Once finished, tell students to list the reasons of the graph of choice to the class. Teacher will wait to comment.
12. Indicate the benefits of choropleth map to students in regards to national and international scales. Write key point on the whiteboard, asking students to copy the information down.
13. Ask students to move back into their pairs to construct choropleth maps of five DIFFERENT African nations and their GII data.
14. Observe progress of choropleth maps whilst walking around the classroom- observe student progress.
15. Provide feedback to pairs where necessary.16. Highlight to students that the Case Study will continue to the following lesson.17. Ask students to find the employment/economic statistics for the same five African nations as they
researched for the choropleth maps. Warn that this is homework and information needed for the next lesson.
Samantha Idiens|| EDVT12015 Assessment Two 7

Learning Sequence Four: Lesson Eight
Description: This lesson enables students to analyze and explore spatial change on a local scale through the use of a case study. Students will research the spatial variances associated with the Aboriginal and Torres Strait Islander population of Australia. This will be done through undertaking a local case study concerning Indigenous health. This lesson will be in the library/computer room to ensure all students have a computer to work on. The learning and numeracy learning outcomes of the lesson involve students researching, interpreting and converting data concerning a local case study. Students will map and measure line graphs, bar graphs and profile the population concerned. The lesson engages students through moving them into a different environment and stimulating thought through peer-oriented work. Numeracy Outcomes: (ACHGK080) (ACHGS074) (ACHGS076 )(ACHGK077) (ACHGK076)Resources: Library, School computers, Spare paper, Whiteboard, Student Portfolios, Stationary, Internet, Teacher supplied. Website: http://www.aihw.gov.au/australias-health/2014/indigenous-health/
Steps: 1. Meet students at the classroom and highlight Habit of Mind (Restrain Impulsivity)- students
walked quietly to library/computer room and find a computer to share with a partner. 2. Inform students of lesson case study: Indigenous Australian population 3. Inform students to log in and search the address
http://www.aihw.gov.au/australias-health/2014/indigenous-health/
4. On whiteboard- students must open a word document and firstly profile Indigenous Australians according to the information on the website. Population, age profile, where Indigenous Australian generally live.
5. Move students onwards to next activity- students must interpret the data on the graph in figure 7.2 in order to understand the difference in life expectancy between Indigenous and non-Indigenous Australians.
6. Hand out paper- Students individually a small paragraph to explain what they think could create the spatial variations between each set of life expectancies.
7. Teacher will then collect student paragraphs and file in portfolios. 8. Students must now work together in their pairs to convert the line graph in figure 7.2 to a bar
graph. 9. Whilst students do this teacher will read the paragraphs collected in order to provide any
individual feedback if needed. 10. Class discussion- ask students to move to figure 7.6- Why would the percentage of smokers
impact the interrelationships and difference in human wellbeing and development between Indigenous and non-Indigenous?
11. Pair discussion- Is the differences in lifestyle and health i.e. smoking and drinking (fig. 7.7.) between Indigenous and non-Indigenous Australian contributing to a greater spatial variance?
12. Students must write their pair discussion comments in their notebooks/laptops.13. To finish the lesson, students will move outdoors and form a small circle, big circle in order to
share information. The circle will rotate in order for students to share three things they have learnt from the lesson.
14. The teacher will join the activity in order to observe student progress and provide comment and feedback.
15. Homework- Student must convert the bar graph in figure 7.7 to four pie graphs.
Samantha Idiens|| EDVT12015 Assessment Two 8

Part E: Rationale
The lesson sequences were implemented in conjunction with the year ten Australian Curriculum unit,
‘Geographies of Human Wellbeing’, with an explicit focus on numeracy capabilities. The value of
numeracy is not limited to compulsory education or earning a living, the ability to be numerate is the
ability to lead an informed life (Steen, 2001). People that are competent in numeracy are better
equipped to understand the many facets of life including procedures such as voting, taxes, chance and
data, and percentages and risks (Steen, 2001). Numeracy allows students to develop logical thinking
and reasoning skills, which are imperative in everyday life. (ACARA, 2013). Being numerate extends
beyond the mathematic skills practiced in a mathematics classroom; numeracy arises across the
Australian Curriculum, for example students learn numeracy skills as they study skills fundamental to
Geography, such as mapping and measuring (ACARA, n.d.). Therefore, all teachers are teachers of
numeracy; teachers should understand the numeracy demands of their learning areas, subsequently
providing the appropriate opportunities and language conventions for numeracy in that subject
(ACARA, 2013). The lesson sequences implemented allow students to become numerate through
incorporating strategies, activities and resources that elicit numeric knowledge and skills in
Geography.
The first lesson sequence asks the students to engage with Human Development Index (HDI) data,
through using the United Nation’s Human Development website as a numeric resource. Students
apply numeracy skills through engaging in geographical analysis, specifically, calculating and
interpreting the HDI data related to Australia, Sudan the United States and India (ACARA, n.d.). The
students extend the data collection activity through mapping and measuring the spatial variations in
HDI data for the four nations; by calculating and interpreting the relationships between the data
students are engaging in numeracy skills fundamental to Geography (ACARA, n.d.). Incorporating
processes that involve data, graphs and logical analysis allow students to witness numeracy in a
context that relates to everyday decisions, highlighting mathematics as a tool for everyday life (Steen,
2001).
The lesson sequences involve a variety of learning strategies and activities that help students develop
numeric skills and knowledge. Learning sequence three and four ask students to undertake two case
studies, a local scenario concerning Australia’s Indigenous population and a regional scenario
concerning gender inequality in Africa. Case studies help students develop problem solving and
decision making skills through involving classroom content and skills with real life scenarios
(Standford University, 1994). Case studies allow students to practically apply geographical skills
learned in the classroom to real word cases, including numerical skills fundamental to geography such
as analyzing the human wellbeing data associated with the case study population by creating tables
Samantha Idiens|| EDVT12015 Assessment Two 9

and graphs (Standford University, 1994). Learning sequence four asks students to participate in an
inner-outer circle class activity where students are required to brainstorm geographical knowledge and
skills learnt in the lesson (Frangenheim, 2012). The activity allows students to moderate their data
analysis associated with the Indigenous Australia case study, stimulating students to gain a deeper
understanding of human wellbeing indicators, such as GII data, and the cause and consequences of
various types of development (Frangenheim, 2012). Similarly to this strategy, the lesson sequences
involve class discussions that allows students to further understand numeric concepts; for example, in
lesson one the students discuss the spatial variations and interrelationships of HDI data for Sudan and
Australia.
Learning sequence three engages students through allowing them to work with peers and develop an
understanding of numeric and geographic skills through collaboration. The lesson is designed follow
the design of a ‘Think:Pair:Share (TPS)’ activity; a TPS activity allows students to slow down the
speed of response and further develop their understanding of the topic (Frangenheim, 2012). The TPS
format is slightly modified for this lesson; students ‘think’ individually to form a deeper
understanding of gender inequality in Africa, then as a pair students collaborate to research, measure
and map/graph Gender Inequality Index (GII) data and lastly, students share the reason for their
choice of graph for the data concerned to the class. Students are able to build skills in mapping and
measuring through a social context; social learning, or the constructivism theory, suggests that
students learn more effectively as a community since they can work together re-create and discover
knowledge (O’Donnell, Dobozy, Bartlett, Bryer, Reeve & Smith, 2012).
The Australian Curriculum content descriptors, and numeracy skills and knowledge throughout the
‘Geographies of Human Wellbeing’ unit were implemented through the use of specific strategies,
activities and resources. Students were engaged in numeracy skills and knowledge through the use of
resources such as Human Development indicator data. This helped students develop geographical
knowledge and skills in data analysis, measuring and mapping. Case studies were implemented to
apply real life context to numeracy and Geography, allowing students to understand how numeracy
skills can be applied in real life scenarios. Activities such as TPS allowed students to collaborate and
extend their numeric and geographic skills and knowledge by sharing and further developing their
understanding with their peers. Overall, numeracy is used throughout the Australian Curriculum and
helping students develop and use numeric knowledge and skills in a variety of contexts provides a
better understand of numeracy after compulsory education.
Samantha Idiens|| EDVT12015 Assessment Two 10

References
Australian curriculum, assessment and reporting authority (ACARA). (n.d.). The Australian
Curriculum. Retrieved from http://www.australiancurriculum.edu.au/
Australian curriculum, assessment and reporting authority (ACARA). (2013). General capabilities in
the Australian curriculum. Retrieved from:
http://www.australiancurriculum.edu.au/GeneralCapabilities/Pdf/Overview
Frangenheim, E. (2012). Reflections on classroom thinking strategies. (10th ed.) Loganholme, QLD:
Rodin Educational Publishing.
Queensland Studies Authority (QSA). (2013). Year ten unit overview: Australian Curriculum:
Geography. Retrieved from: https://www.qcaa.qld.edu.au/yr10-geography-overview.html
O'Donnell, A. M., Dobozy, E., Bartlett, B. J., & Bryer, F. (2012). Educational psychology. Milton,
QLD: John Wiley & Sons.
Steen, Lynn, A. (2001). Mathematics and numeracy: Two literacies, one language. Singapore
Association of Mathematics Educators. 6(1), 1-6.
Standford University. (1994). Speaking of teaching. Stanford University Newsletter on Teaching, 2(5)
1-4.
Samantha Idiens|| EDVT12015 Assessment Two 11

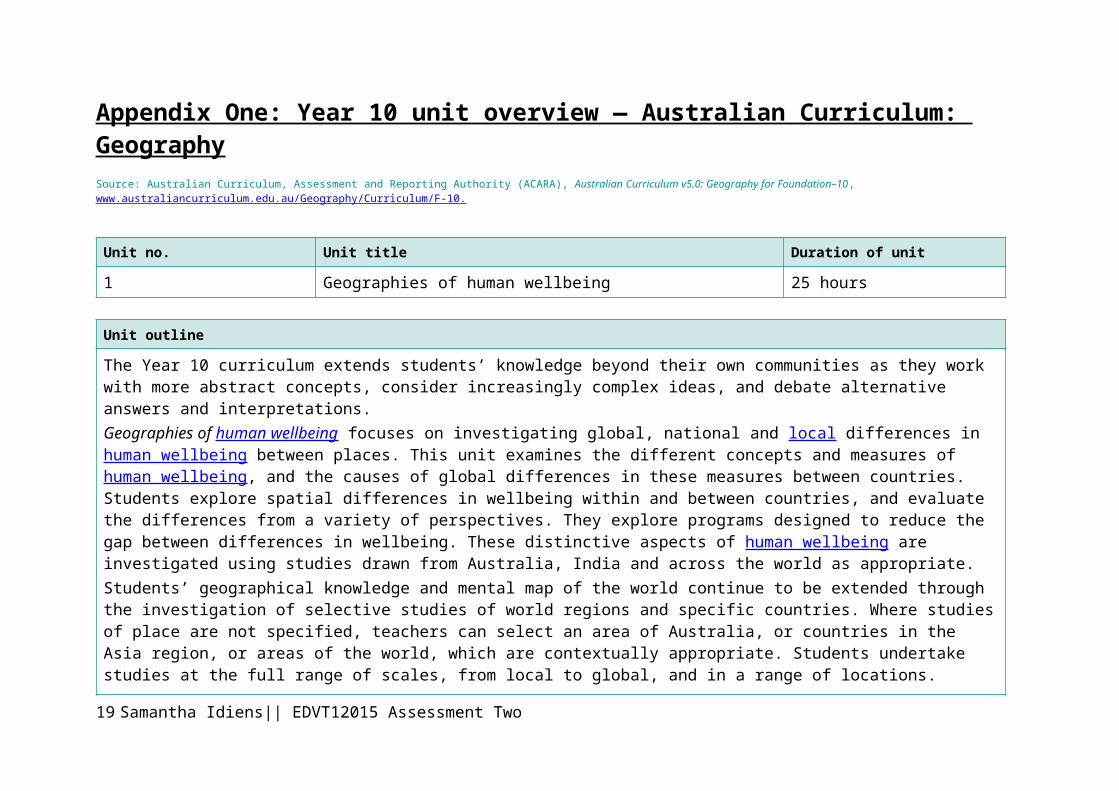
Appendix One: Year 10 unit overview — Australian Curriculum: GeographySource: Australian Curriculum, Assessment and Reporting Authority (ACARA), Australian Curriculum v5.0: Geography for Foundation–10, www.australiancurriculum.edu.au/Geography/Curriculum/F-10 .
Unit no. Unit title Duration of unit
1 Geographies of human wellbeing 25 hours
Unit outline
The Year 10 curriculum extends students’ knowledge beyond their own communities as they work with more abstract concepts, consider increasingly complex ideas, and debate alternative answers and interpretations.Geographies of human wellbeing focuses on investigating global, national and local differences in human wellbeing between places. This unit examines the different concepts and measures of human wellbeing, and the causes of global differences in these measures between countries. Students explore spatial differences in wellbeing within and between countries, and evaluate the differences from a variety of perspectives. They explore programs designed to reduce the gap between differences in wellbeing. These distinctive aspects of human wellbeing are investigated using studies drawn from Australia, India and across the world as appropriate.Students’ geographical knowledge and mental map of the world continue to be extended through the investigation of selective studies of world regions and specific countries. Where studies of place are not specified, teachers can select an area of Australia, or countries in the Asia region, or areas of the world, which are contextually appropriate. Students undertake studies at the full range of scales, from local to global, and in a range of locations.There is a focus in this unit on the use of geographical inquiry and skills. The students will: collect, select, record and organise relevant data and geographic information, using ethical protocols, from a range of
primary and secondary sources evaluate sources for their reliability, bias and usefulness represent multivariable data in a range of appropriate forms such as scatter plots , compound bar graphs, tables and
annotated diagrams, with and without the use of digital and spatial technology represent the spatial distribution of geographical phenomena by constructing special purpose maps that conform to
cartographic conventions, using spatial technology where appropriate
Samantha Idiens|| EDVT12015 Assessment Two 12

Unit outline
evaluate multivariable data and other geographical information using qualitative and quantitative methods to make generalisations and inferences
propose explanations for patterns, trends, relationships and anomalies, and predict outcomes.The inquiry questions for the unit are: How can the spatial variation between places be explained? What management options exist for sustaining human systems into the future? How do worldviews influence decisions on how to manage social change
Identify curriculum
Content descriptions to be taught General capabilities and cross-curriculum prioritiesGeographical Knowledge and Understanding Geographical Inquiry and Skills
Samantha Idiens|| EDVT12015 Assessment Two 13

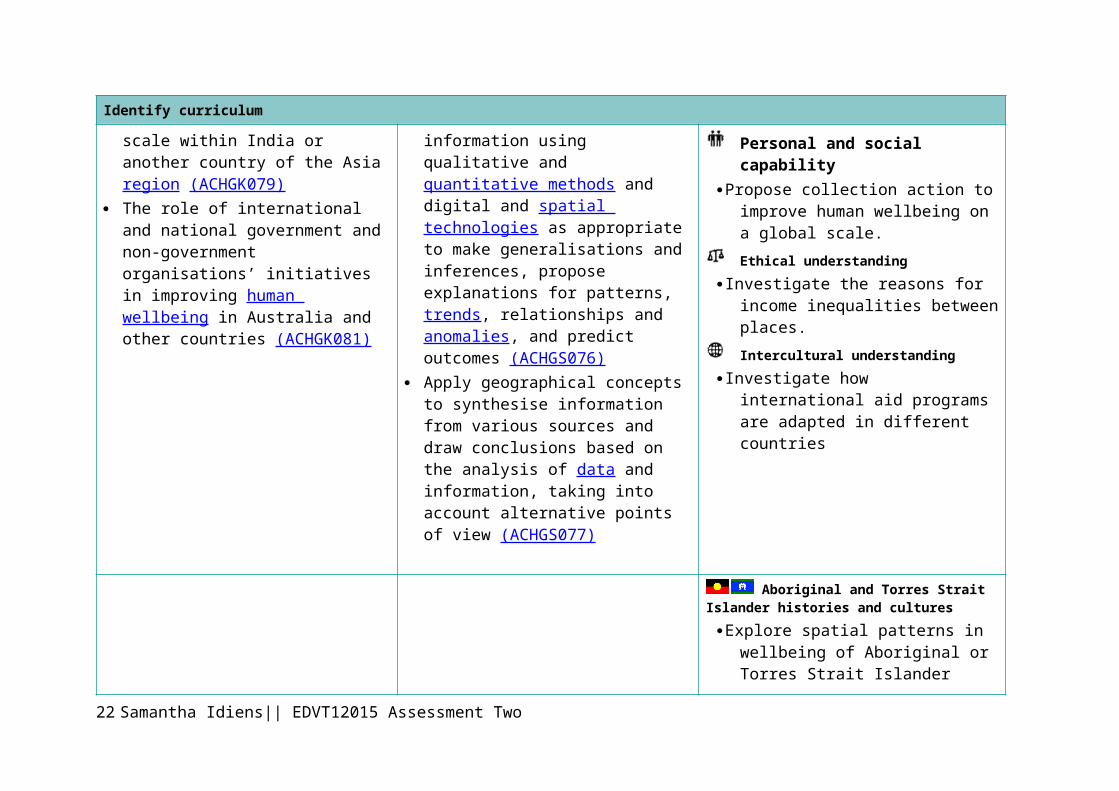
Identify curriculum
The different ways of measuring and mapping human wellbeing and development, and how these can be applied to measure differences between places (ACHGK076)
The reasons for spatial variations between countries in selected indicators of human wellbeing (ACHGK077)
The issues affecting the development of places and their impact on human wellbeing, drawing on a study from a developing country or region in Africa, South America or the Pacific Islands (ACHGK078)
The reasons for and consequences of spatial variations in human wellbeing on a regional scale within India or another country of the Asia region (ACHGK079)
The role of international and national government and non-government organisations’ initiatives in improving human wellbeing in Australia and other countries (ACHGK081)
Collecting, recording, evaluating and representing
Evaluate sources for their reliability, bias and usefulness and represent multi-variable data in a range of appropriate forms, for example, scatter plots, tables, field sketches and annotated diagrams with and without the use of digital and spatial technologies (ACHGS074)
Represent the spatial distribution of geographical phenomena by constructing special purpose maps that conform to cartographic conventions, using spatial technologies as appropriate (ACHGS075)
Interpreting, analysing and concluding
Evaluate multi-variable data and other geographical information using qualitative and quantitative methods and digital and spatial technologies as appropriate to make generalisations and inferences, propose explanations for patterns, trends, relationships and anomalies, and predict outcomes (ACHGS076)
Apply geographical concepts to synthesise information from various sources and draw conclusions based
The application of the general capabilities and cross-curriculum priorities in this include may include:
Literacy
Analyse geographical information to explain spatial variations in human wellbeing.
Numeracy
Represent data on a choropleth to show patterns in selected indicators of human wellbeing
ICT capabilityUse a digital application to construct
scatter plots to compare relationships between data.
Critical and creative thinking
Evaluate the reliability of sources to assess what additional information is required to respond to questions.
Personal and social capabilityPropose collection action to improve
human wellbeing on a global scale.
Ethical understanding
Investigate the reasons for income inequalities between places.
Intercultural understanding
Investigate how international aid
Samantha Idiens|| EDVT12015 Assessment Two 14

Identify curriculum
on the analysis of data and information, taking into account alternative points of view (ACHGS077)
programs are adapted in different countries
Aboriginal and Torres Strait Islander histories and cultures
Explore spatial patterns in wellbeing of Aboriginal or Torres Strait Islander communities across Australia over time
Asia and Australia’s engagement with Asia
Investigate the reasons for spatial variations in wellbeing between Australia and another country in the Asian region.
Sustainability
Examine the sustainability of a government initiative to improve future wellbeing.
Geographical understandings
The unit provides opportunities for students to develop geographical understandings that are particularly focused on the following concepts.
☒ Place ☒ Space ☒ Environment ☒ Scale ☒ Interconnection
☒ Sustainability ☒ Change
Explanations of the geographical concepts with examples are provided in the QSA year level plans at:
Samantha Idiens|| EDVT12015 Assessment Two 15

Identify curriculum
www.qsa.qld.edu.au/yr10-geography-resources.html > Curriculum > Planning templates and exemplars > Year level plans and in the Appendix.
Achievement standard
By the end of Year 10, students explain how the interaction between geographical processes at different scales change the characteristics of places. They predict changes in the characteristics of places and environments over time, across space and at different scales and explain the predicted consequences of change. Students identify, analyse and explain significant interconnections between people, places and environments and explain changes that result from these interconnections and their consequences. They propose explanations for distributions, patterns and spatial variations over time, across space and at different scales, and identify and describe significant associations between distribution patterns. They evaluate alternative views on a geographical challenge and alternative strategies to address this challenge using environmental, social and economic criteria and propose and justify a response.Students use initial research to develop and modify geographically significant questions to frame an inquiry. They collect and critically evaluate a range of primary and secondary sources and select relevant geographical data and information to answer inquiry questions. Students accurately represent multi-variable data in a range of appropriate graphic forms, including special purpose maps that use a suitable scale and comply with cartographic conventions. They evaluate data to make generalisations and inferences, propose explanations for significant patterns, trends, relationships and anomalies, and predict outcomes. They synthesise data and information to draw reasoned conclusions, taking into account alternative points of view. Students present findings, arguments and explanations using relevant geographical terminology and graphic representations in a range of appropriate communication forms. They evaluate their findings and propose action in response to a contemporary geographical challenge taking account of environmental, economic and social considerations. They explain the predicted outcomes and consequences of their proposal.
Samantha Idiens|| EDVT12015 Assessment Two 16

Relevant prior curriculum Curriculum working towards
The Queensland SOSE Essential Learnings by the end of Year 9 Knowledge and understandingPlace and space
Maps, including topographic, political and thematic maps, are developed with particular features, including scale, contour lines and human-created boundaries, and use the specific skills of observing, visualising, estimating, sketching and measuring.
Ways of working
Students are able to: plan investigations, using discipline-specific inquiry models
and processes research and analyse data, information and evidence from
primary and secondary sources evaluate sources of data, information and evidence for
relevance, reliability, authenticity, purpose, bias and perspective
draw conclusions and make decisions supported by interpretations of data, information and evidence
communicate descriptions, decisions and conclusions, using text types specific to the context and purpose and the conventions of research-based texts
reflect on learning, apply new understandings and justify future applications.
Geography Senior Syllabus 2007General ObjectivesKnowledge
processes geographers use to investigate environmental and spatial aspects of human decision making
the impact of the environment on quality of life equity issues as they apply to GeographyAnalytical processes
break information into parts by identifying and explaining patterns or the steps in a process
understand the meaning of information by transforming, interpreting and extrapolating text or illustrative material
identify relationships suggest causes for some of these relationshipsResearch and communication
gathering and recording information and primary data from sources and settings
designing research plans relevant to the purpose selecting and organising information establishing the currency, validity and reliability of
information communicating and presenting information in a variety of
ways devising an appropriate format when presenting research
findings using maps, diagrams and statistics appropriately.Course organisation: Themes
In Geography, the themes are as follows:
Samantha Idiens|| EDVT12015 Assessment Two 17

1. Managing the natural environment2. Social environments3. Resources and the environment4. People and development
Bridging content
The SOSE Essential Learnings by the end of Year 9 do not focus on the different ways of measuring and mapping human wellbeing and development, reasons and consequences for spatial variation in selected indicators of well-being and between countries. Bridging learning experiences may be needed to develop the geographical skills of recording, representing and evaluating multivariable data using qualitative and quantitative methods and constructing special purpose maps such as thematic maps, weather maps, choropleth maps and topographic maps.
Links to other learning areas
Australian Curriculum: Geography is a subject of the Humanities and Social Sciences and has connections to History, Civics and Citizenship, and Economics and Business. There is the possibility of linking concepts and content in the unit that may be taught in other curriculum areas when implementing the Australian Curriculum: Geography.
Samantha Idiens|| EDVT12015 Assessment Two 18
Assessment Make judgments
Describe the assessment Teachers gather evidence to make judgments about the following characteristics of student work:Understanding
Propose explanations for distributions, patterns and spatial variations over time, across space and at different scales
Evaluate alternative views on a geographical challenge and alternative strategies to address this challenge and propose and justify a response
Skills
Evaluate data to make generalisations and inferences
Propose explanations for significant patterns, trends, relationships and anomalies, and predict outcomes
Synthesis data and information to draw reasoned conclusions, taking into account alternate different points of view
Present findings, arguments and explanations using relevant geographical terminology and graphical representations
The valued features of the standard elaborations targeted in this assessment:
Geographical knowledge and understanding Interpreting and analysing CommunicatingFor further advice and guidelines on constructing
Students are given opportunities to demonstrate their knowledge, skills and understanding across a range of assessments. This assessment is collected in student folios and allows for ongoing feedback to students on their learning.The teaching and learning experiences throughout the term provide opportunities for students to develop the understanding and skills required to complete these assessments. As students engage with these learning experiences, the teacher can provide feedback on specific skills.Supervised assessment (written)
This technique is used to assess student responses that are produced independently, under supervision and in a set time frame. A supervised assessment ensures there is no question about student authorship.The purpose of this assessment is to make judgments about students’ abilities to evaluate geographical sources, infer relationships, synthesise information and draw conclusions about global, national and local differences in human wellbeing between places.Stimulus response essay
Students respond to a stimulus which asks students to:– analyse the causes and impacts of a local developmental challenge
(Australia or another country)– evaluate two possible strategies to address the challenge.
Suggested conditions:
Stimulus: 1 page (to be provided) Length: 400–500 words Time: 45–90 minutes
OR
Samantha Idiens|| EDVT12015 Assessment Two 19

Assessment Make judgments
Data manipulation and extended written response
Students undertake practical exercises to: transform multi-variable developmental indicator data into geographical
representations, including maps, graphs or tables analyse the transformed data to identify spatial patterns and infer
relationships between countries and selected indicators use extended written response to draw conclusions about possible
improvements that could be made to improve human wellbeing.Suggested conditions:
Stimulus: multi-variable developmental indicator data Length: up to 400 words Time: 45–90 minutes
Refer to Australian Curriculum: Geography — Assessment categories, techniques and conditions: www.qsa.qld.edu.au/downloads/p_10/ac_geography_assess_advice.pdf
task-specific standards, refer to the standards elaborations: www.qsa.qld.edu.au/26025.html > select the Year level > choose the Resources tab > Standards elaborations.
Samantha Idiens|| EDVT12015 Assessment Two 20

Teaching and learning
Teaching strategies and learning experiences Supportive learning environment1
Resources
Measuring and mapping human wellbeing and development
Students: define concepts of wellbeing using the developmental indicators
of health, education (social); income, gross domestic product (economic); natural environment (environmental); governance, peace and conflict (political)
watch the Gapminder video — 200 countries, 200 years in 4 minutes to introduce the notion of measuring wellbeing
collect images of developed and developing countries to assess perceptions of developing countries and check for their existing understandings of life within a developing country
use the Human Development Index measures to collect statistics for each indicator (social, environmental, economic) and use statistics to develop appropriate data representations (line graph, sector graph, bar graph, map)
evaluate sources of data for their reliability, bias and usefulness and represent multivariable data in a range of forms such as scatter plots using digital technologies where appropriate
represent data on choropleth maps using a spatial application to show patterns of human wellbeing at different scales
Spatial variations and interrelationships
Students: analyse and evaluate indicator data between countries looking
for spatial patterns and interrelationship between measures.
Adjustments for needs of learners
Websites
Geogspace, exemplars www.geogspace.edu.au/core-units/years-9-10/exemplars/year-10/y10-exemplars-overview.html
Introduction to the topic of human wellbeing www.guardian.co.uk/global-development/interactive/2012/dec/20/geography-game-how-well-know-world
Gapminder www.gapminder.org/for-teachers/
International Human Development Indicators (incorporating the Human Development Index) www.hdr.undp.org/en/data/map/
Worldmapper
1 Part 6 of the Disability Standards for Education (The Standards for Curriculum Development, Accreditation and Delivery) states that education providers, including class teachers, must take reasonable steps to ensure a course/program is designed to allow any child to participate and experience success in learning. The Disability Standards for Education 2005 (Cwlth) is available from: www.ag.gov.au > select Human rights and anti-discrimination > Disability standards for education.
Samantha Idiens|| EDVT12015 Assessment Two 21
Teaching and learning
Teaching strategies and learning experiences Supportive learning environment
Resources
www.worldmapper.org/ Power of Data
Visualization www.pdviz.com/e-atlas-of-global-development
Samantha Idiens|| EDVT12015 Assessment Two 22

Teaching and learning
Teaching strategies and learning experiences Supportive learning environment
Resources
Issues affecting the development of places and the impact on wellbeing
Students: use case studies that explore each of the development
indicators (social, economic, political and environmental) with a focus on developing countries. Possible case study topics might include:– The luckiest nut in the world — impact on the nut trade in
Senegal– Cocoa trade from West Africa– Favelas (slums) of Rio De Janeiro and Brazil
(health/sanitation)– Political unrest within Fiji– Gender inequality across Africa
Reasons for, and consequences of, spatial changes on a regional scale
Students: use case studies that examine the regional variations of
developmental indicators (economic and social) focusing on the widening gap between poor and the growing middle classes and consequences to affected peoples. A possible case study might examine economic and social change within India.
Reasons for, and consequences of, spatial changes on a local scale
Students : use case studies that examine the local variations of
developmental indicators (economic and social) within Australia. A possible case study could focus on the gap between peoples across rural and urban environments
Case studies
Global issues www.globalissues.org www.globalissues.org/video/778/luckiest-nut-in-the-world ,
Visual representation of Human Development Index http://visualising.org/visualizations/human-development-index-hdi-tree
World Visionwww.worldvision.com.auwww.worldvision.com.au/resources/SchoolResources/IndonesianResource.aspx?id=1aa6b99f-493d-4f29-a4c5-9ee9c6111969
International Cocoa Initiative www.cocoainitiative.org
Food Empowerment Project
Samantha Idiens|| EDVT12015 Assessment Two 23

Teaching and learning
Teaching strategies and learning experiences Supportive learning environment
Resources
use case studies to research the spatial differences in the wellbeing of Aboriginal and Torres Strait Islander population across Australia, and the extent to which these differences impact the people’s wellbeing.
www.foodispower.org
Role of international and national governments and non-government organisations’ initiative in improving wellbeing
Students: explore the roles of international, national government, and non-
government aid agencies in improving human wellbeing in Australia and other countries (e.g. international: UNICEF; government: AusAID; non-government: Oxfam)
identify different types and purposes of aid in Australia and other countries
investigate one Millennium Development Goal (MDG) project and one location to analyse its effectiveness.
UNICEF www.unicef.org/
AusAID www.ausaid.gov.au/Pages/home.aspx
Oxfam https://www.oxfam.org.au/act/resources-for-teachers/close-the-gap-student-kit/
Use feedback
Ways to monitor learning and assessment
Teachers meet to collaboratively plan the teaching, learning and assessment to meet the needs of all learners in each unit.Teachers create opportunities for discussion about levels of achievement to develop shared understandings; co-mark or cross mark at key points to ensure consistency of judgments; and participate in moderating samples of student work at school or cluster level to reach consensus and consistency.
Feedback to students Teachers strategically plan opportunities and ways to provide ongoing feedback (both written and informal) and encouragement to students on their strengths and areas for improvement.
Samantha Idiens|| EDVT12015 Assessment Two 24

Use feedback
Students reflect on and discuss with their teachers or peers what they can do well and what they need to improve.Teachers reflect on and review learning opportunities to incorporate specific learning experiences and provide multiple opportunities for students to experience, practise and improve.
Reflection on the unit plan
Identify what worked well during and at the end of the unit, including: activities that worked well and why activities that could be improved and how assessment that worked well and why assessment that could be improved and how common student misconceptions that need, or needed, to be clarified.
Samantha Idiens|| EDVT12015 Assessment Two 25

Appendix
Concepts for developing geographical understandings in Years 7–10Concept Description
Place Places are parts of the Earth’s surface and can be described by location, shape, boundaries, features and environmental and human characteristics. Places are unique in their characteristics and play a fundamental role in human life. They may be perceived, experienced, understood and valued differently. They range in size from a part of a room to a major world region. For Aboriginal peoples and Torres Strait Islander peoples, Country/Place is important for its significance to culture, identity and spirituality.In Years 7–10, students extend their focus beyond their own communities to a wider exploration of the world. Students explain how geographical processes influence the characteristics of places and how places are perceived and valued differently.
Space Spaces are defined by the location of environmental and human features, geographical phenomena and activities across the Earth’s surface to form distributions and patterns. Spaces are perceived, structured, organised and managed and can be designed and redesigned to achieve particular purposes. Space can be explored at different levels or scales.In Years 7–10, students investigate the spatial distributions, patterns, trends and relationships among geographical phenomena over time. For example, students can investigate population patterns over time to determine how urban planning organises the spaces within cities or regions.
Environment The environment is the product of geological, atmospheric, hydrological, geomorphic, edaphic (soil), biotic and human processes. The concept of environment is about the significance of the environment in human life, and the important interrelationships between humans and the environment. The environment supports and enriches human and other life by providing raw materials and food, absorbing and recycling wastes, maintaining a safe habitat and being a source of enjoyment and inspiration.In Years 7–10, students focus on the significance of the environment and how different views of places and environments influence decisions about their management.
Interconnection
Interconnection is the way that people and/or geographical phenomena are connected to each other through environmental processes and human activity. Interconnections can be simple, complex, reciprocal or interdependent and have strong influence on the characteristics of places. An understanding of the concept of
Samantha Idiens|| EDVT12015 Assessment Two 26

Concept Description
interconnection leads to holistic thinking. This helps students to understand Aboriginal peoples’ and Torres Strait Islander peoples’ holistic connection to Country/Place and the knowledge and practices that developed as a result of this connection.In Years 7–10, students investigate how people, through their choices and actions, are connected to places throughout the world, and how these connections help to make and change places and their environments.
Change Change involves any alteration to the natural or cultural environment and can involve both time and space. The concept of change is about explaining geographical phenomena by investigating how they developed over time. Environmental change can occur over both short and long time frames, and have interrelationships with human activities. An understanding of the current processes of change can be used to predict change in the future and to identify what would be needed to achieve more sustainable futures.In Years 7–10, students apply human–environment systems thinking to understand the causes and consequences of environmental change and the geographical concepts and methods used to evaluate and select strategies to manage the change.
Sustainability
Sustainability addresses the ongoing capacity of the Earth to maintain all life. It is both a goal and a way of thinking about how to progress towards that goal. Sustainable patterns of living meet the needs of the present without compromising the ability of future generations to meet their needs (economic, social and environmental). Sustainability depends on the maintenance or restoration of the functions that sustain all life and human wellbeing.In Years 7–10, students begin to focus on sustainability, which is a continuing theme and is progressively developed to become the major focus in Year 10.
Scale Scale refers to the different spatial levels used to investigate phenomena or represent phenomena visually (maps, images, graphs), from the personal to local, regional, national, world regional and global levels. Scale is also involved when geographers look for explanations or outcomes at different levels. Scale may be perceived differently by groups and can be used to elevate or diminish the significance of an issue, for example, a local issue or global issue.In Years 7–10, students explore the interaction between geographical processes at the full range of scales, from local to global, and in a range of locations.
Samantha Idiens|| EDVT12015 Assessment Two 27