eei financial conference
TRANSCRIPT

EEI Financial Conference
November 9-10, 2020
2EEI Financial Conference – November 9-10, 2020
Cautionary Statements and Factors That May Affect Future Results
Statements made in this presentation about future operating results or other
future events, including the process to sell PPL’s U.K. business, are forward-
looking statements under the Safe Harbor provisions of the Private Securities
Litigation Reform Act of 1995. Actual results may differ materially from the
forward-looking statements. A discussion of some of the factors that could
cause actual results or events to vary is contained in the Appendix to this
presentation and in the Company’s SEC filings. Unless otherwise expressly
specified, the figures in this presentation do not reflect the effects of any sale
of the U.K. business.
Management utilizes non-GAAP financial measures such as, “earnings from
ongoing operations” or “ongoing earnings” in this presentation. For additional
information on non-GAAP financial measures and reconciliations to the
appropriate GAAP measure, refer to the Appendix of this presentation and
PPL’s earnings release.
3EEI Financial Conference – November 9-10, 2020
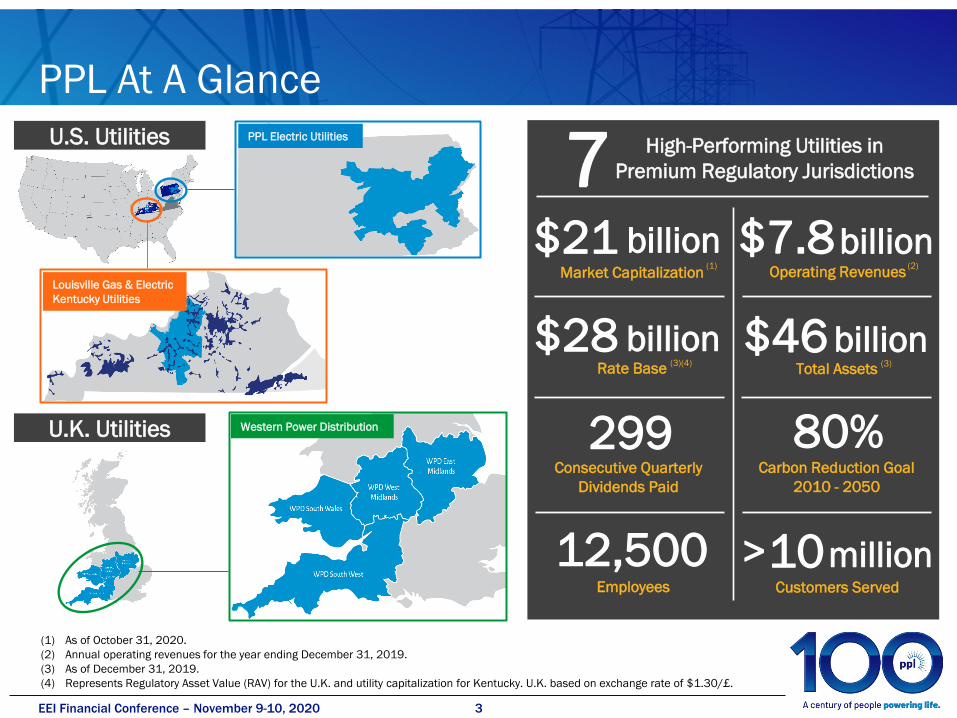
PPL At A Glance
7 High-Performing Utilities in
Premium Regulatory Jurisdictions
12,500Employees
299Consecutive Quarterly
Dividends Paid
$21Market Capitalization
(1)
$46Total Assets
$28Rate Base
(3)(4)
billion
billion
billion
10millionCustomers Served
(3)
PPL Electric UtilitiesU.S. Utilities
U.K. Utilities Western Power Distribution
Louisville Gas & Electric
Kentucky Utilities
$7.8billionOperating Revenues
(2)
80%Carbon Reduction Goal
2010 - 2050
>
(1) As of October 31, 2020.
(2) Annual operating revenues for the year ending December 31, 2019.
(3) As of December 31, 2019.
(4) Represents Regulatory Asset Value (RAV) for the U.K. and utility capitalization for Kentucky. U.K. based on exchange rate of $1.30/£.
4EEI Financial Conference – November 9-10, 2020
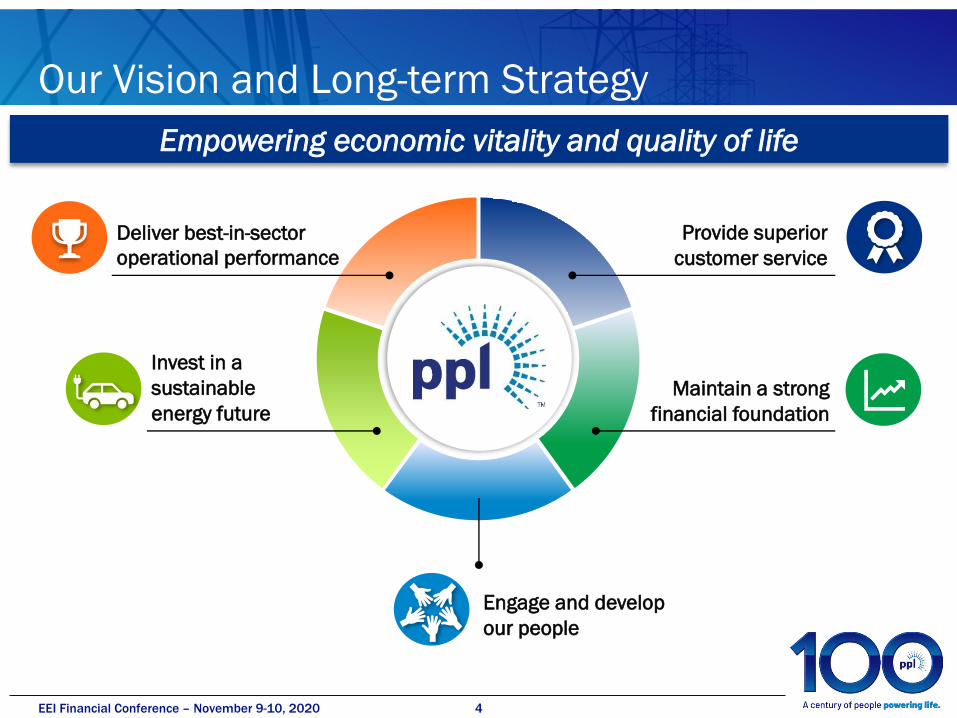
Our Vision and Long-term Strategy
Empowering economic vitality and quality of life
Deliver best-in-sector
operational performance
Invest in a
sustainable
energy future
Provide superior
customer service
Maintain a strong
financial foundation
Engage and develop
our people
5EEI Financial Conference – November 9-10, 2020
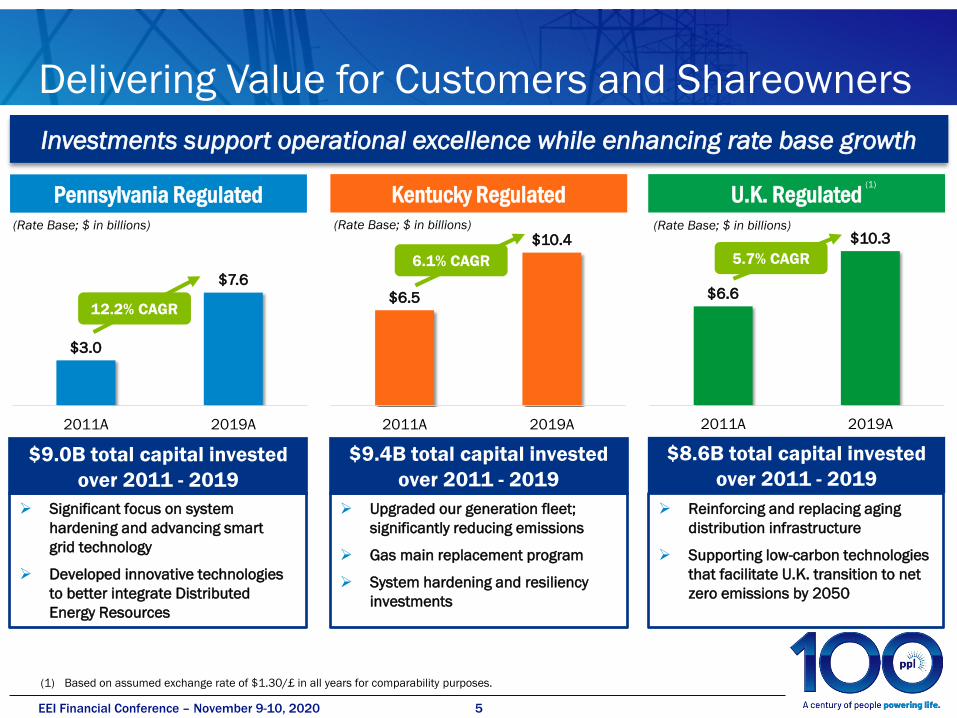
$6.6
$10.3
2011A 2019A
$6.5
$10.4
2011A 2019A
$3.0
$7.6
2011A 2019A
Delivering Value for Customers and Shareowners
Pennsylvania Regulated Kentucky Regulated U.K. Regulated
Investments support operational excellence while enhancing rate base growth
12.2% CAGR
$9.0B total capital invested
over 2011 - 2019
(Rate Base; $ in billions)
$9.4B total capital invested
over 2011 - 2019
$8.6B total capital invested
over 2011 - 2019
➢ Significant focus on system
hardening and advancing smart
grid technology
➢ Developed innovative technologies
to better integrate Distributed
Energy Resources
➢ Upgraded our generation fleet;
significantly reducing emissions
➢ Gas main replacement program
➢ System hardening and resiliency
investments
➢ Reinforcing and replacing aging
distribution infrastructure
➢ Supporting low-carbon technologies
that facilitate U.K. transition to net
zero emissions by 2050
(1) Based on assumed exchange rate of $1.30/£ in all years for comparability purposes.
(1)
6.1% CAGR 5.7% CAGR
(Rate Base; $ in billions) (Rate Base; $ in billions)
6EEI Financial Conference – November 9-10, 2020
0
10
20
30
40
50
60
70
80
10/11 11/12 12/13 13/14 14/15 15/16 16/17 17/18 18/19
0.0
0.2
0.4
0.6
0.8
1.0
2011 2012 2013 2014 2015 2016 2017 2018 2019
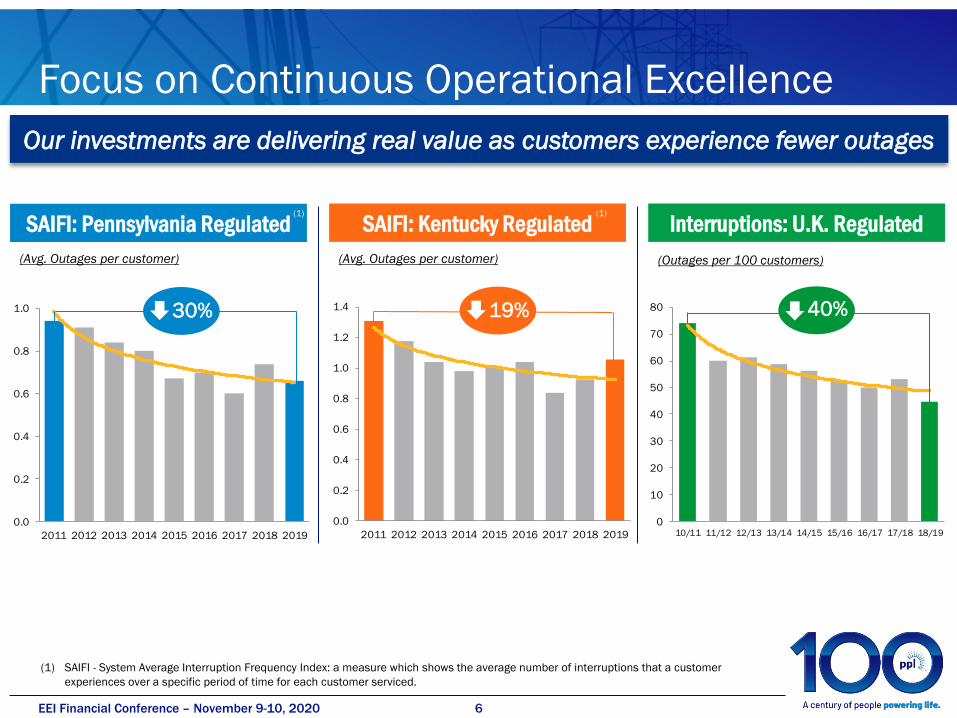
Focus on Continuous Operational Excellence
SAIFI: Pennsylvania Regulated
(Avg. Outages per customer)
SAIFI: Kentucky Regulated
(Avg. Outages per customer)
Interruptions: U.K. Regulated
(1) SAIFI - System Average Interruption Frequency Index: a measure which shows the average number of interruptions that a customer
experiences over a specific period of time for each customer serviced.
19% 40%
(Outages per 100 customers)
(1) (1)
30%
0.0
0.2
0.4
0.6
0.8
1.0
1.2
1.4
2011 2012 2013 2014 2015 2016 2017 2018 2019
Our investments are delivering real value as customers experience fewer outages
7EEI Financial Conference – November 9-10, 2020
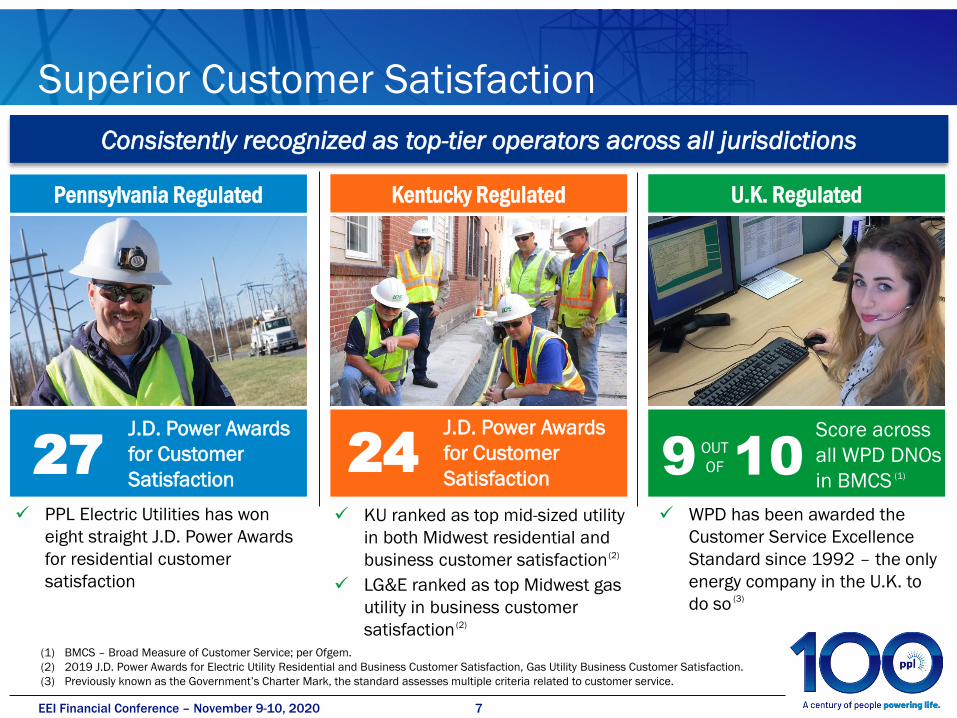
✓ KU ranked as top mid-sized utility
in both Midwest residential and
business customer satisfaction
✓ LG&E ranked as top Midwest gas
utility in business customer
satisfaction
Superior Customer Satisfaction
Pennsylvania Regulated Kentucky Regulated U.K. Regulated
(1) BMCS – Broad Measure of Customer Service; per Ofgem.
(2) 2019 J.D. Power Awards for Electric Utility Residential and Business Customer Satisfaction, Gas Utility Business Customer Satisfaction.
(3) Previously known as the Government’s Charter Mark, the standard assesses multiple criteria related to customer service.
27 J.D. Power Awards
for Customer
Satisfaction24
J.D. Power Awards
for Customer
Satisfaction
(2)
(3)
9Score across
all WPD DNOs
in BMCS (1)10OUT
OF
Consistently recognized as top-tier operators across all jurisdictions
✓ PPL Electric Utilities has won
eight straight J.D. Power Awards
for residential customer
satisfaction
✓ WPD has been awarded the
Customer Service Excellence
Standard since 1992 – the only
energy company in the U.K. to
do so(2)
8EEI Financial Conference – November 9-10, 2020
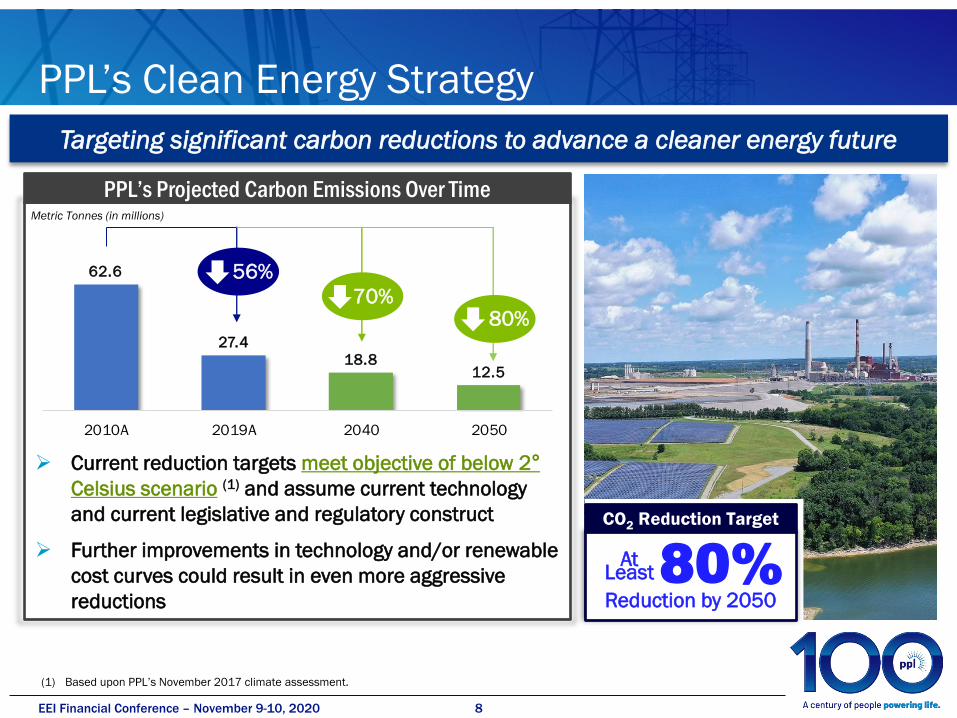
Targeting significant carbon reductions to advance a cleaner energy future
PPL’s Clean Energy Strategy
➢ Current reduction targets meet objective of below 2°
Celsius scenario (1) and assume current technology
and current legislative and regulatory construct
➢ Further improvements in technology and/or renewable
cost curves could result in even more aggressive
reductions
Metric Tonnes (in millions)
PPL’s Projected Carbon Emissions Over Time
80% Reduction by 2050
At Least
CO2 Reduction Target
56%
70%80%
62.6
27.4
18.812.5
2010A 2019A 2040 2050
(1) Based upon PPL’s November 2017 climate assessment.
9EEI Financial Conference – November 9-10, 2020
Announced Process to Sell U.K. Business
➢ Positioning PPL as a purely U.S. utility holding company
▪ Simplifying its business mix and enhancing corporate clarity
➢ Use of proceeds would be focused on strengthening PPL’s balance sheet and
enhancing PPL’s earnings growth, which could include supporting strategic growth
opportunities in the U.S. and returning capital to shareowners
▪ Improving corporate credit metrics; targeting mid-teens FFO/debt
▪ Providing greater financial flexibility to support strategic growth that advances a cleaner
energy future in the U.S. and leverages company’s superior operational excellence
➢ WPD is expected to command a premium valuation
▪ Highly attractive collection of premier, rate-regulated U.K. electricity distribution businesses
▪ Sale would maximize WPD’s value to shareowners and enables buyer to influence RIIO-ED2
business plans
➢ Exploring both cash offers in WPD and potential exchange of U.S. utility assets
➢ Expect to announce a transaction in the first half of 2021
Strategic repositioning expected to be value accretive to shareowners and to
better position the company for continued long-term value creation
10EEI Financial Conference – November 9-10, 2020
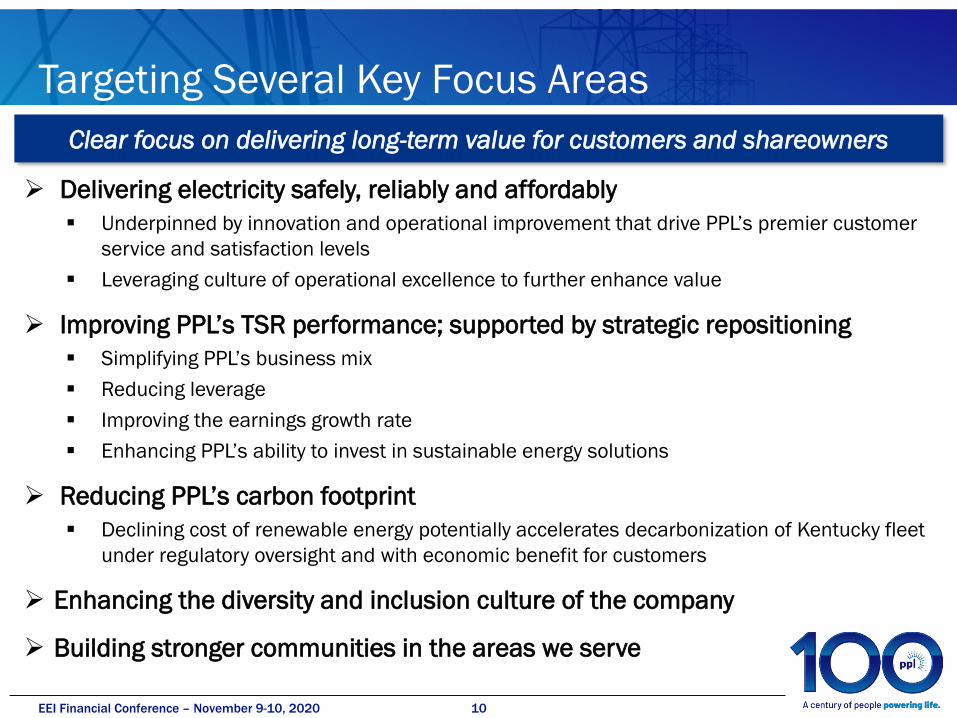
Targeting Several Key Focus Areas
Clear focus on delivering long-term value for customers and shareowners
➢ Delivering electricity safely, reliably and affordably
▪ Underpinned by innovation and operational improvement that drive PPL’s premier customer
service and satisfaction levels
▪ Leveraging culture of operational excellence to further enhance value
➢ Improving PPL’s TSR performance; supported by strategic repositioning
▪ Simplifying PPL’s business mix
▪ Reducing leverage
▪ Improving the earnings growth rate
▪ Enhancing PPL’s ability to invest in sustainable energy solutions
➢ Reducing PPL’s carbon footprint
▪ Declining cost of renewable energy potentially accelerates decarbonization of Kentucky fleet
under regulatory oversight and with economic benefit for customers
➢ Enhancing the diversity and inclusion culture of the company
➢ Building stronger communities in the areas we serve

Appendix
12EEI Financial Conference – November 9-10, 2020
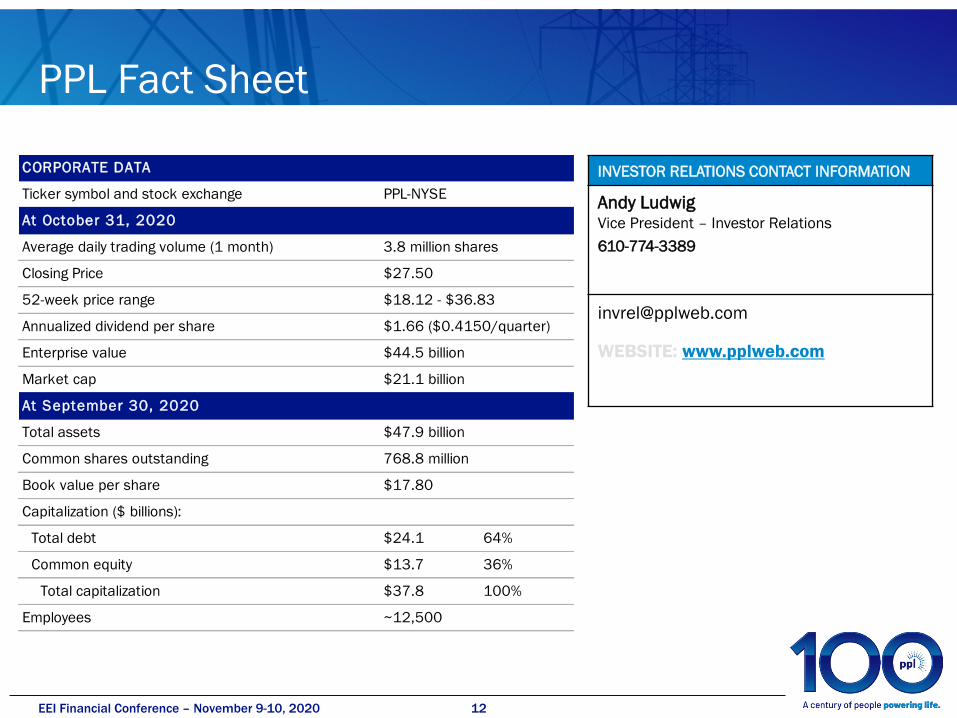
CORPORATE DATA
Ticker symbol and stock exchange PPL-NYSE
At October 31, 2020
Average daily trading volume (1 month) 3.8 million shares
Closing Price $27.50
52-week price range $18.12 - $36.83
Annualized dividend per share $1.66 ($0.4150/quarter)
Enterprise value $44.5 billion
Market cap $21.1 billion
At September 30, 2020
Total assets $47.9 billion
Common shares outstanding 768.8 million
Book value per share $17.80
Capitalization ($ billions):
Total debt $24.1 64%
Common equity $13.7 36%
Total capitalization $37.8 100%
Employees ~12,500
PPL Fact Sheet
INVESTOR RELATIONS CONTACT INFORMATION
Andy Ludwig Vice President – Investor Relations
610-774-3389
WEBSITE: www.pplweb.com
13EEI Financial Conference – November 9-10, 2020
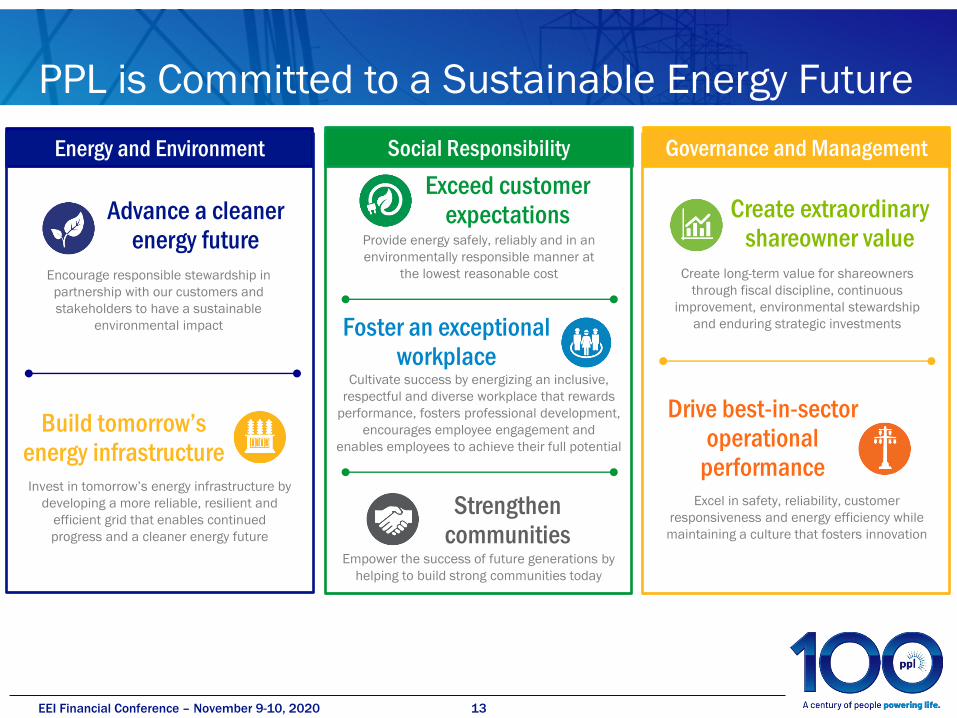
PPL is Committed to a Sustainable Energy Future
Energy and Environment Social Responsibility Governance and Management
Advance a cleanerenergy future
Encourage responsible stewardship in
partnership with our customers and
stakeholders to have a sustainable
environmental impact
Build tomorrow’senergy infrastructure
Invest in tomorrow’s energy infrastructure by
developing a more reliable, resilient and
efficient grid that enables continued
progress and a cleaner energy future
Exceed customer expectations
Provide energy safely, reliably and in an
environmentally responsible manner at
the lowest reasonable cost
Foster an exceptional workplace
Cultivate success by energizing an inclusive,
respectful and diverse workplace that rewards
performance, fosters professional development,
encourages employee engagement and
enables employees to achieve their full potential
Strengthen communities
Empower the success of future generations by
helping to build strong communities today
Create extraordinary shareowner value
Drive best-in-sector operational
performance
Create long-term value for shareowners
through fiscal discipline, continuous
improvement, environmental stewardship
and enduring strategic investments
Excel in safety, reliability, customer
responsiveness and energy efficiency while
maintaining a culture that fosters innovation
14EEI Financial Conference – November 9-10, 2020
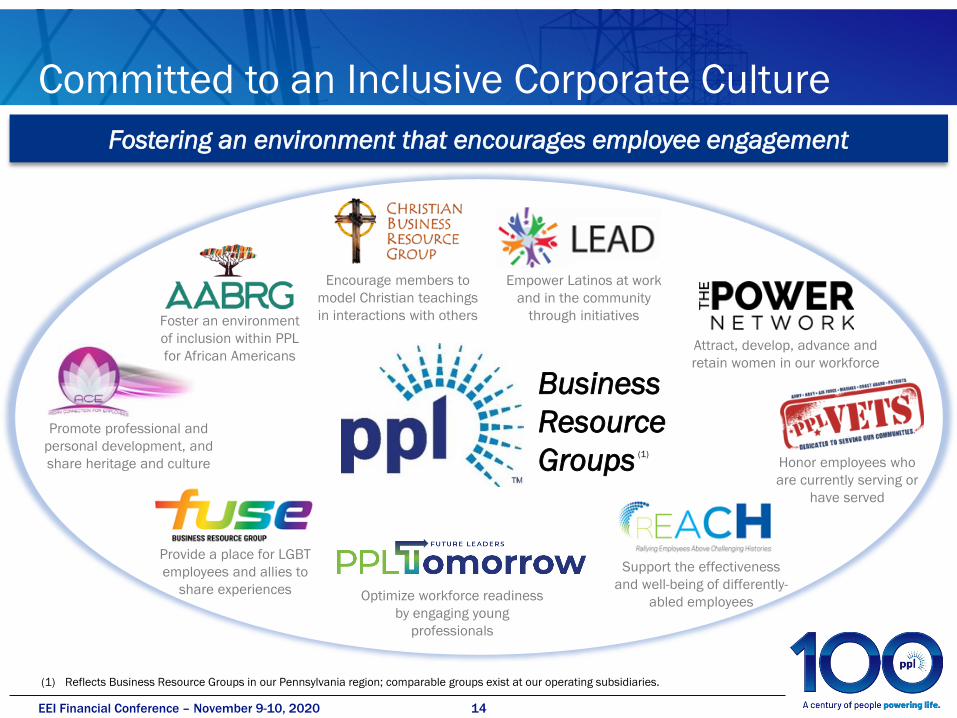
Fostering an environment that encourages employee engagement
Committed to an Inclusive Corporate Culture
Foster an environment
of inclusion within PPL
for African Americans
Promote professional and
personal development, and
share heritage and culture
Encourage members to
model Christian teachings
in interactions with others
Provide a place for LGBT
employees and allies to
share experiences
Empower Latinos at work
and in the community
through initiatives
Attract, develop, advance and
retain women in our workforce
Optimize workforce readiness
by engaging young
professionals
Honor employees who
are currently serving or
have served
Support the effectiveness
and well-being of differently-
abled employees
Business
Resource
Groups
(1) Reflects Business Resource Groups in our Pennsylvania region; comparable groups exist at our operating subsidiaries.
(1)

15EEI Financial Conference – November 9-10, 2020
Dedicated Community Partners
➢ Volunteering Efforts▪ 64,000 employee volunteer hours in 2019
➢ Philanthropy▪ PPL contributions to charitable organization totaled more
than $10.6 million in 2019
➢ Supporting Customers▪ PPL provided $2.6 million in financial assistance to more
than 85,000 customers in 2019
▪ More than $2 million donated for COVID-19 relief
➢ Powering Local Economies▪ LG&E and KU Economic Development Rider
▪ WPD smart energy innovation partnership
▪ Employees serve on more than 150 community boards
throughout central and eastern Pennsylvania
Activities Supporting our Community Empowerment
Committed to strengthening the communities in which we live, work, and serve
(1) LG&E and KU Economic Development Rider is an incentive rate for existing industry expansions, new project locations and redevelopment
initiatives within the service area.
(2) WPD supports local energy plans and works collaboratively with local authorities and businesses as part of Energy Capital, a smart energy
innovation partnership. Energy Capital facilitates public/private investment projects across the region.
(1)
(2)
16EEI Financial Conference – November 9-10, 2020
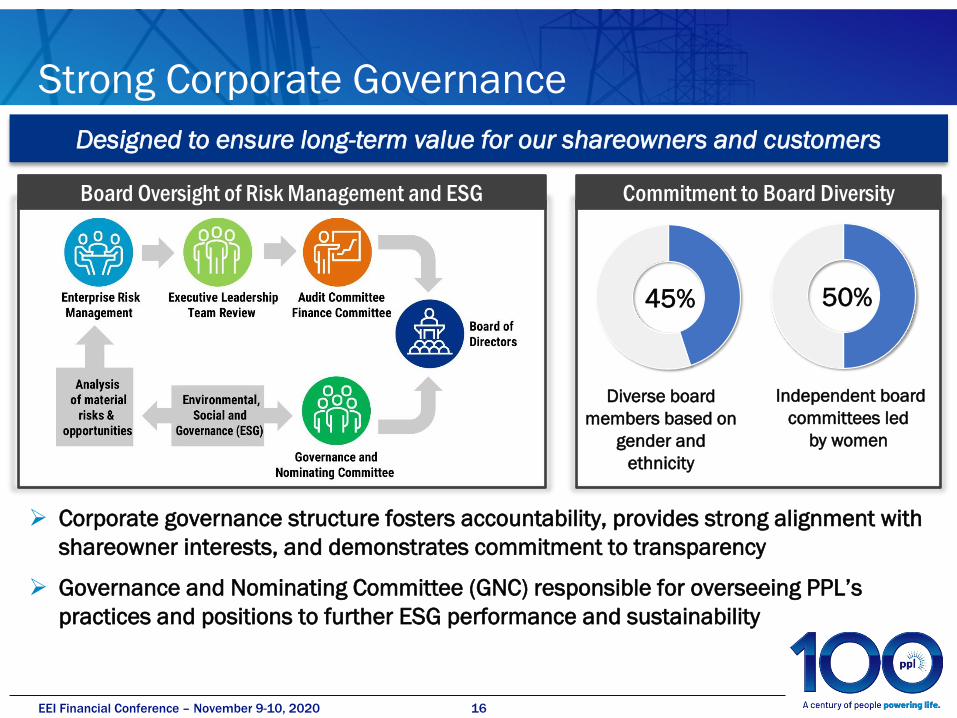
Strong Corporate Governance
Designed to ensure long-term value for our shareowners and customers
➢ Corporate governance structure fosters accountability, provides strong alignment with
shareowner interests, and demonstrates commitment to transparency
➢ Governance and Nominating Committee (GNC) responsible for overseeing PPL’s
practices and positions to further ESG performance and sustainability
Commitment to Board Diversity
45%
Diverse board
members based on
gender and
ethnicity
Board Oversight of Risk Management and ESG
50%
Independent board
committees led
by women
17EEI Financial Conference – November 9-10, 2020
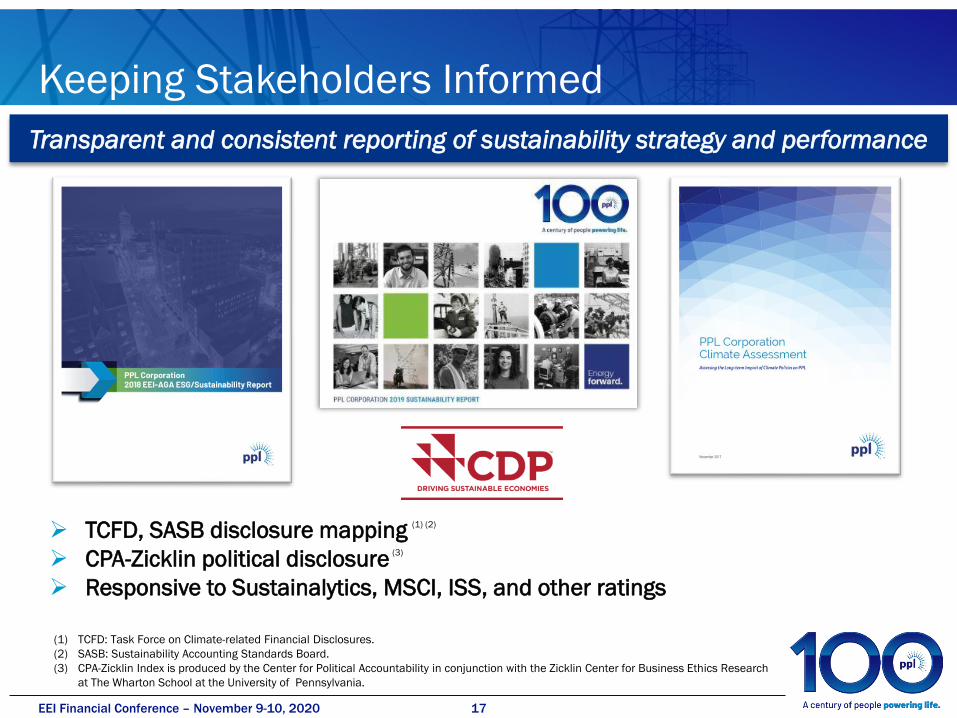
Keeping Stakeholders Informed
➢ TCFD, SASB disclosure mapping
➢ CPA-Zicklin political disclosure
➢ Responsive to Sustainalytics, MSCI, ISS, and other ratings
(1) TCFD: Task Force on Climate-related Financial Disclosures.
(2) SASB: Sustainability Accounting Standards Board.
(3) CPA-Zicklin Index is produced by the Center for Political Accountability in conjunction with the Zicklin Center for Business Ethics Research
at The Wharton School at the University of Pennsylvania.
(1) (2)
(3)
Transparent and consistent reporting of sustainability strategy and performance
18EEI Financial Conference – November 9-10, 2020
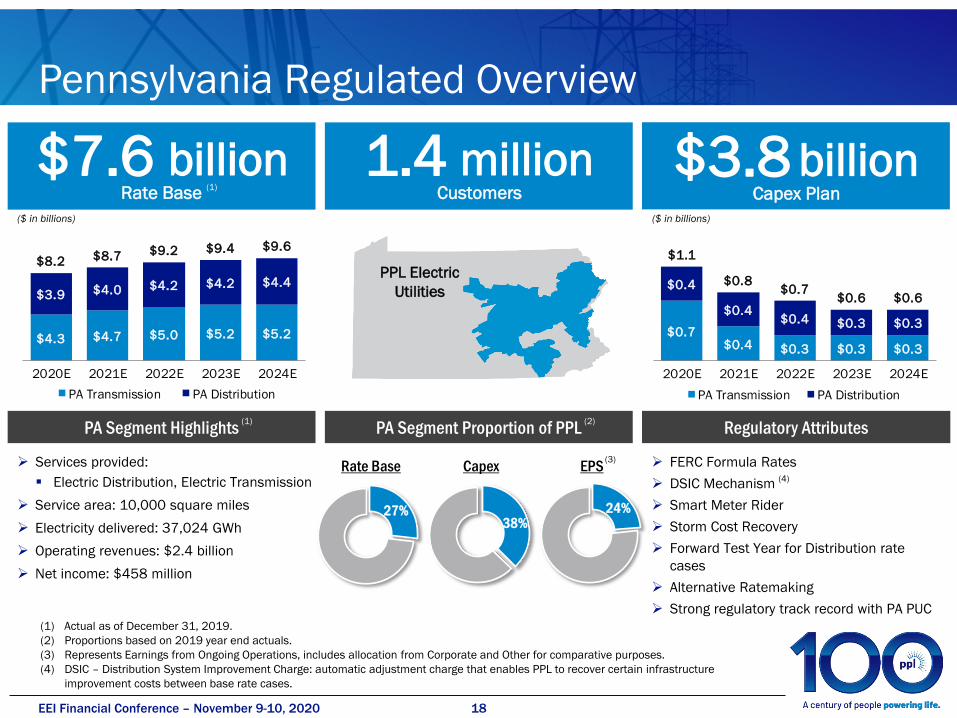
Pennsylvania Regulated Overview
1.4Customers
million$7.6Rate Base
billion
(1) Actual as of December 31, 2019.
(2) Proportions based on 2019 year end actuals.
(3) Represents Earnings from Ongoing Operations, includes allocation from Corporate and Other for comparative purposes.
(4) DSIC – Distribution System Improvement Charge: automatic adjustment charge that enables PPL to recover certain infrastructure
improvement costs between base rate cases.
PA Segment Highlights Regulatory Attributes
➢ Services provided:
▪ Electric Distribution, Electric Transmission
➢ Service area: 10,000 square miles
➢ Electricity delivered: 37,024 GWh
➢ Operating revenues: $2.4 billion
➢ Net income: $458 million
➢ FERC Formula Rates
➢ DSIC Mechanism
➢ Smart Meter Rider
➢ Storm Cost Recovery
➢ Forward Test Year for Distribution rate
cases
➢ Alternative Ratemaking
➢ Strong regulatory track record with PA PUC
PA Segment Proportion of PPL
(1)
(2)
(4)
(1)
Capex Plan
$3.8 billion
PPL Electric
Utilities
27%38%
24%
Rate Base Capex EPS(3)
$0.7 $0.4 $0.3 $0.3 $0.3
$0.4
$0.4 $0.4 $0.3 $0.3
$1.1
$0.8 $0.7
$0.6 $0.6
2020E 2021E 2022E 2023E 2024E
PA Transmission PA Distribution
($ in billions) ($ in billions)
$4.3 $4.7 $5.0 $5.2 $5.2
$3.9 $4.0 $4.2 $4.2 $4.4
$8.2 $8.7 $9.2 $9.4 $9.6
2020E 2021E 2022E 2023E 2024E
PA Transmission PA Distribution
19EEI Financial Conference – November 9-10, 2020
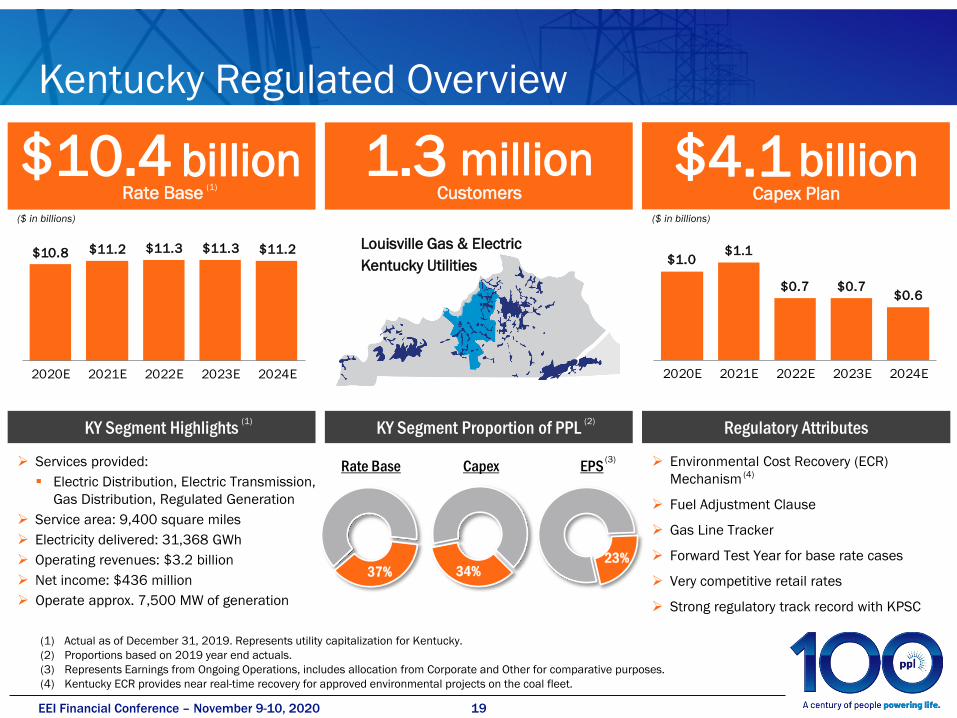
Kentucky Regulated Overview
$10.4Rate Base
billion $4.1Capex Plan
billion1.3Customers
million
➢ Services provided:
▪ Electric Distribution, Electric Transmission,
Gas Distribution, Regulated Generation
➢ Service area: 9,400 square miles
➢ Electricity delivered: 31,368 GWh
➢ Operating revenues: $3.2 billion
➢ Net income: $436 million
➢ Operate approx. 7,500 MW of generation
➢ Environmental Cost Recovery (ECR)
Mechanism
➢ Fuel Adjustment Clause
➢ Gas Line Tracker
➢ Forward Test Year for base rate cases
➢ Very competitive retail rates
➢ Strong regulatory track record with KPSC
KY Segment Highlights Regulatory Attributes
(1)
(1) Actual as of December 31, 2019. Represents utility capitalization for Kentucky.
(2) Proportions based on 2019 year end actuals.
(3) Represents Earnings from Ongoing Operations, includes allocation from Corporate and Other for comparative purposes.
(4) Kentucky ECR provides near real-time recovery for approved environmental projects on the coal fleet.
KY Segment Proportion of PPL
Rate Base
(2)
37% 34%23%
(4)
(1)
Louisville Gas & Electric
Kentucky Utilities
Capex EPS(3)
$1.0 $1.1
$0.7 $0.7 $0.6
2020E 2021E 2022E 2023E 2024E
$10.8 $11.2 $11.3 $11.3 $11.2
2020E 2021E 2022E 2023E 2024E
($ in billions) ($ in billions)
20EEI Financial Conference – November 9-10, 2020
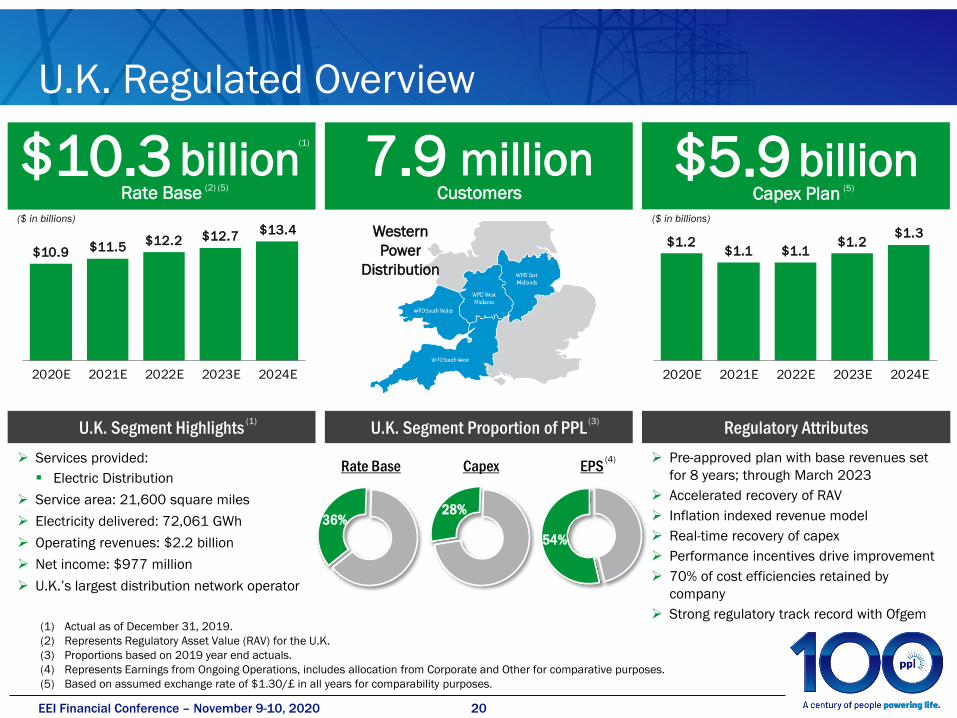
U.K. Regulated Overview
(1) Actual as of December 31, 2019.
(2) Represents Regulatory Asset Value (RAV) for the U.K.
(3) Proportions based on 2019 year end actuals.
(4) Represents Earnings from Ongoing Operations, includes allocation from Corporate and Other for comparative purposes.
(5) Based on assumed exchange rate of $1.30/£ in all years for comparability purposes.
(1)
$10.3Rate Base
billion 7.9Customers
million $5.9Capex Plan
➢ Services provided:
▪ Electric Distribution
➢ Service area: 21,600 square miles
➢ Electricity delivered: 72,061 GWh
➢ Operating revenues: $2.2 billion
➢ Net income: $977 million
➢ U.K.’s largest distribution network operator
➢ Pre-approved plan with base revenues set
for 8 years; through March 2023
➢ Accelerated recovery of RAV
➢ Inflation indexed revenue model
➢ Real-time recovery of capex
➢ Performance incentives drive improvement
➢ 70% of cost efficiencies retained by
company
➢ Strong regulatory track record with Ofgem
U.K. Segment Highlights Regulatory Attributes
(1)
(2) (5)
U.K. Segment Proportion of PPL(3)
36%28%
54%
(1)
billion
Western
Power
Distribution
Rate Base Capex EPS(4)
(5)
$1.2 $1.1 $1.1
$1.2 $1.3
2020E 2021E 2022E 2023E 2024E
$10.9 $11.5 $12.2 $12.7
$13.4
2020E 2021E 2022E 2023E 2024E
($ in billions) ($ in billions)
21EEI Financial Conference – November 9-10, 2020
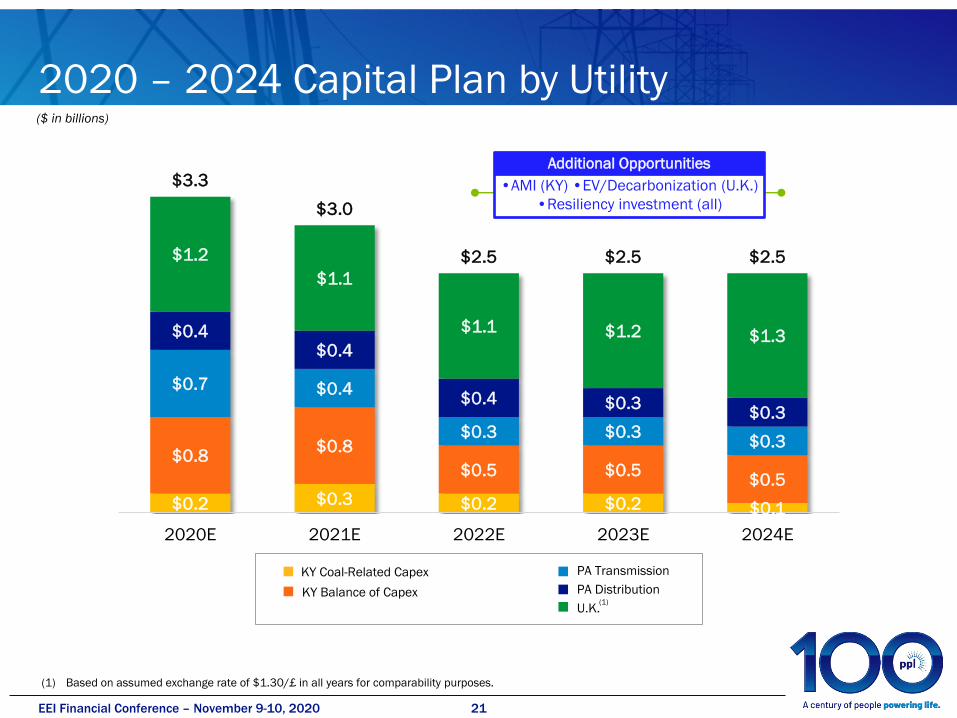
2020 – 2024 Capital Plan by Utility($ in billions)
U.K.
KY Balance of Capex
KY Coal-Related Capex
(1)
PA Transmission
PA Distribution
(1) Based on assumed exchange rate of $1.30/£ in all years for comparability purposes.
•AMI (KY) •EV/Decarbonization (U.K.)
•Resiliency investment (all)
Additional Opportunities
$0.2 $0.3 $0.2 $0.2 $0.1
$0.8$0.8
$0.5 $0.5$0.5
$0.7 $0.4
$0.3 $0.3$0.3
$0.4$0.4
$0.4 $0.3$0.3
$1.2
$1.1
$1.1 $1.2 $1.3
$3.3
$3.0
$2.5 $2.5 $2.5
2020E 2021E 2022E 2023E 2024E
22EEI Financial Conference – November 9-10, 2020
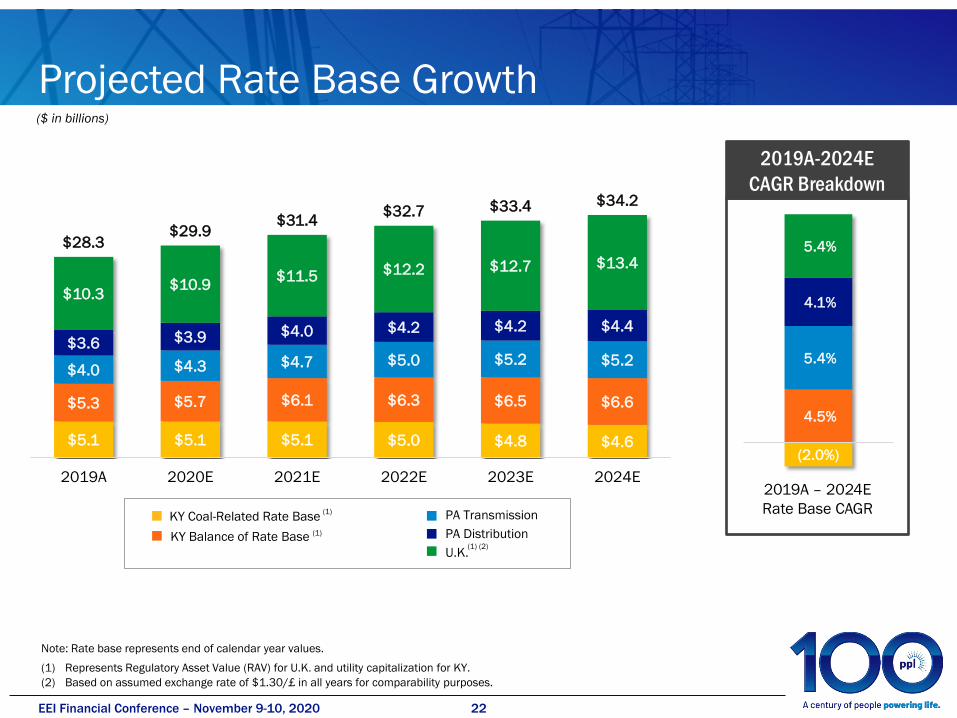
Projected Rate Base Growth
(2.0%)
4.5%
5.4%
4.1%
5.4%
($ in billions)
Note: Rate base represents end of calendar year values.
(1) Represents Regulatory Asset Value (RAV) for U.K. and utility capitalization for KY.
(2) Based on assumed exchange rate of $1.30/£ in all years for comparability purposes.
2019A-2024E
CAGR Breakdown
2019A – 2024E
Rate Base CAGR
(1) (2)
(1)
(1)
KY Coal-Related Rate Base
KY Balance of Rate Base
PA Transmission
PA Distribution
U.K.
$5.1 $5.1 $5.1 $5.0 $4.8 $4.6
$5.3 $5.7 $6.1 $6.3 $6.5 $6.6
$4.0 $4.3 $4.7 $5.0 $5.2 $5.2$3.6 $3.9 $4.0 $4.2 $4.2 $4.4
$10.3$10.9
$11.5 $12.2 $12.7 $13.4
$28.3$29.9
$31.4$32.7 $33.4 $34.2
2019A 2020E 2021E 2022E 2023E 2024E
23EEI Financial Conference – November 9-10, 2020
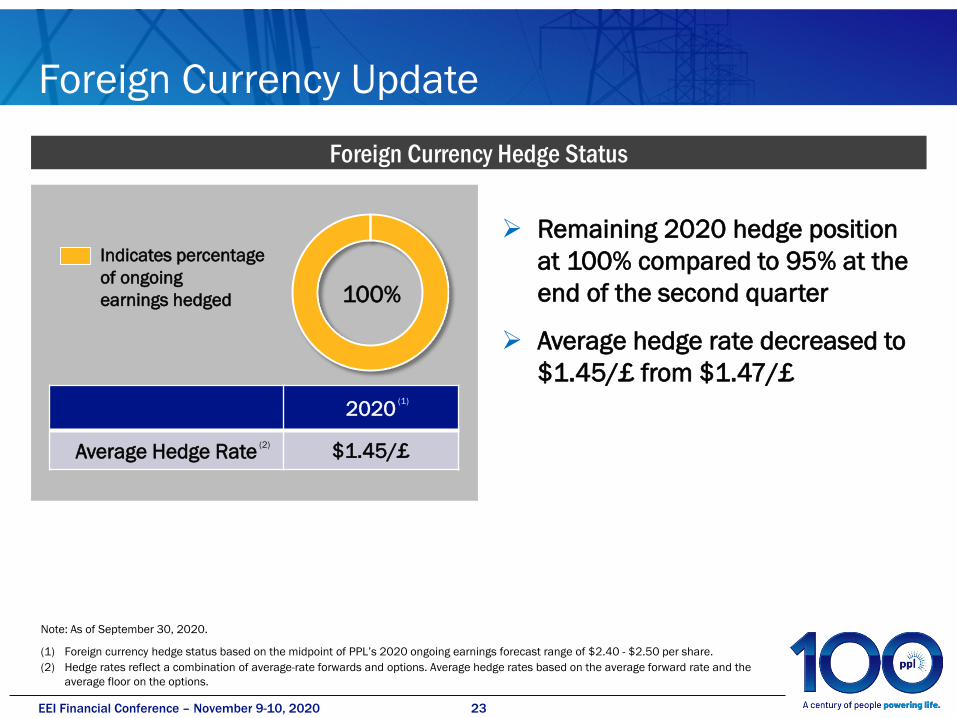
Foreign Currency Update
Foreign Currency Hedge Status
Note: As of September 30, 2020.
(1) Foreign currency hedge status based on the midpoint of PPL’s 2020 ongoing earnings forecast range of $2.40 - $2.50 per share.
(2) Hedge rates reflect a combination of average-rate forwards and options. Average hedge rates based on the average forward rate and the
average floor on the options.
➢ Remaining 2020 hedge position
at 100% compared to 95% at the
end of the second quarter
➢ Average hedge rate decreased to
$1.45/£ from $1.47/£
Indicates percentage
of ongoing
earnings hedged
2020
Average Hedge Rate $1.45/£(2)
(1)
100%
24EEI Financial Conference – November 9-10, 2020
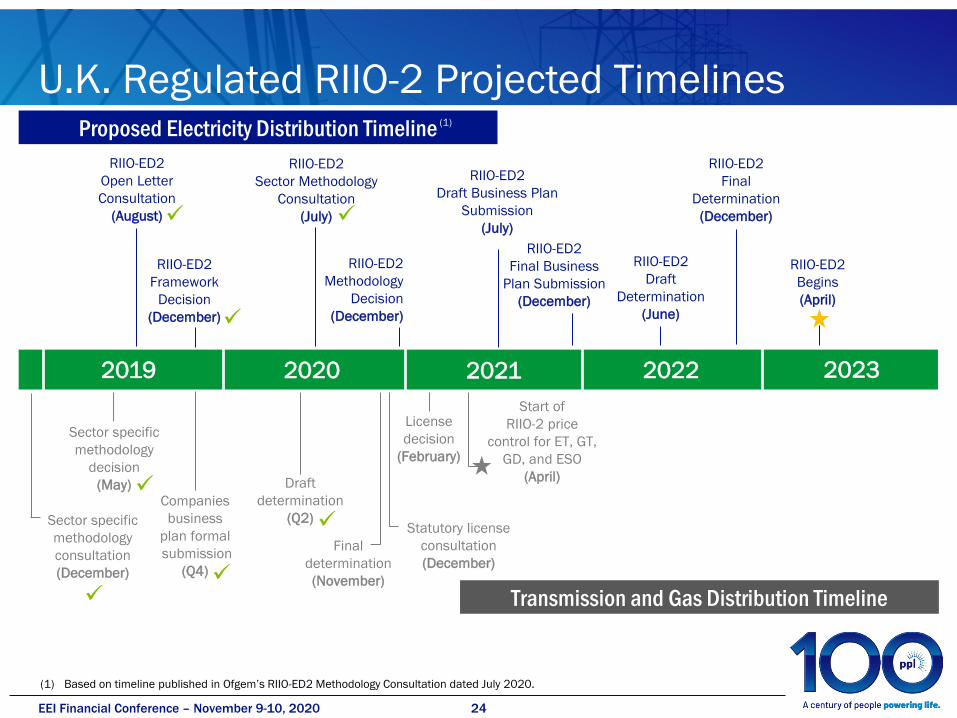
U.K. Regulated RIIO-2 Projected Timelines
Final
determination
(November)
Statutory license
consultation
(December)
2019 2020 2021 2022 2023
RIIO-ED2
Sector Methodology
Consultation
(July)
RIIO-ED2
Methodology
Decision
(December)
RIIO-ED2
Draft Business Plan
Submission
(July)
RIIO-ED2
Draft
Determination
(June)
RIIO-ED2
Begins
(April)
Proposed Electricity Distribution Timeline
Transmission and Gas Distribution Timeline
Sector specific
methodology
consultation
(December)
Sector specific
methodology
decision
(May)Companies
business
plan formal
submission
(Q4)
Draft
determination
(Q2)
License
decision
(February)
Start of
RIIO-2 price
control for ET, GT,
GD, and ESO
(April)
✓
RIIO-ED2
Open Letter
Consultation
(August)
RIIO-ED2
Framework
Decision
(December)
RIIO-ED2
Final Business
Plan Submission
(December)
RIIO-ED2
Final
Determination
(December)
(1) Based on timeline published in Ofgem’s RIIO-ED2 Methodology Consultation dated July 2020.
✓
✓
✓
✓
(1)
✓
✓
25EEI Financial Conference – November 9-10, 2020
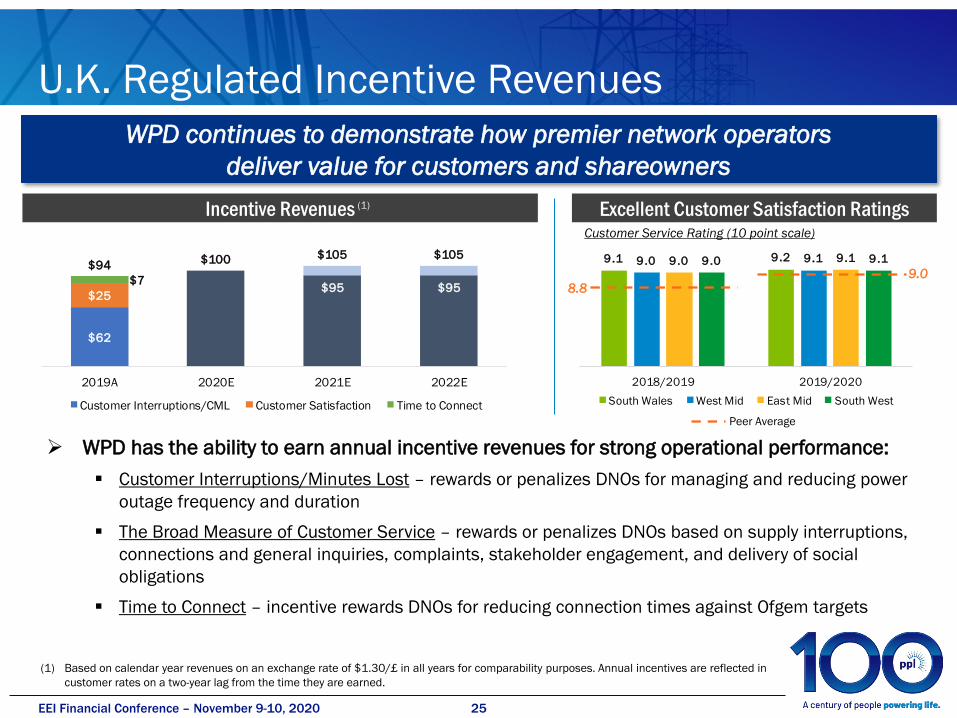
U.K. Regulated Incentive Revenues
WPD continues to demonstrate how premier network operators
deliver value for customers and shareowners
➢ WPD has the ability to earn annual incentive revenues for strong operational performance:
▪ Customer Interruptions/Minutes Lost – rewards or penalizes DNOs for managing and reducing power
outage frequency and duration
▪ The Broad Measure of Customer Service – rewards or penalizes DNOs based on supply interruptions,
connections and general inquiries, complaints, stakeholder engagement, and delivery of social
obligations
▪ Time to Connect – incentive rewards DNOs for reducing connection times against Ofgem targets
(1) Based on calendar year revenues on an exchange rate of $1.30/£ in all years for comparability purposes. Annual incentives are reflected in
customer rates on a two-year lag from the time they are earned.
Excellent Customer Satisfaction RatingsCustomer Service Rating (10 point scale)
Incentive Revenues (1)
9.1 9.2 9.0 9.1 9.0 9.1 9.0 9.1
2018/2019 2019/2020
South Wales West Mid East Mid South West
9.0
Peer Average
$62
$25
$7 $95 $95
$94 $100 $105 $105
2019A 2020E 2021E 2022E
Customer Interruptions/CML Customer Satisfaction Time to Connect
8.8
26EEI Financial Conference – November 9-10, 2020
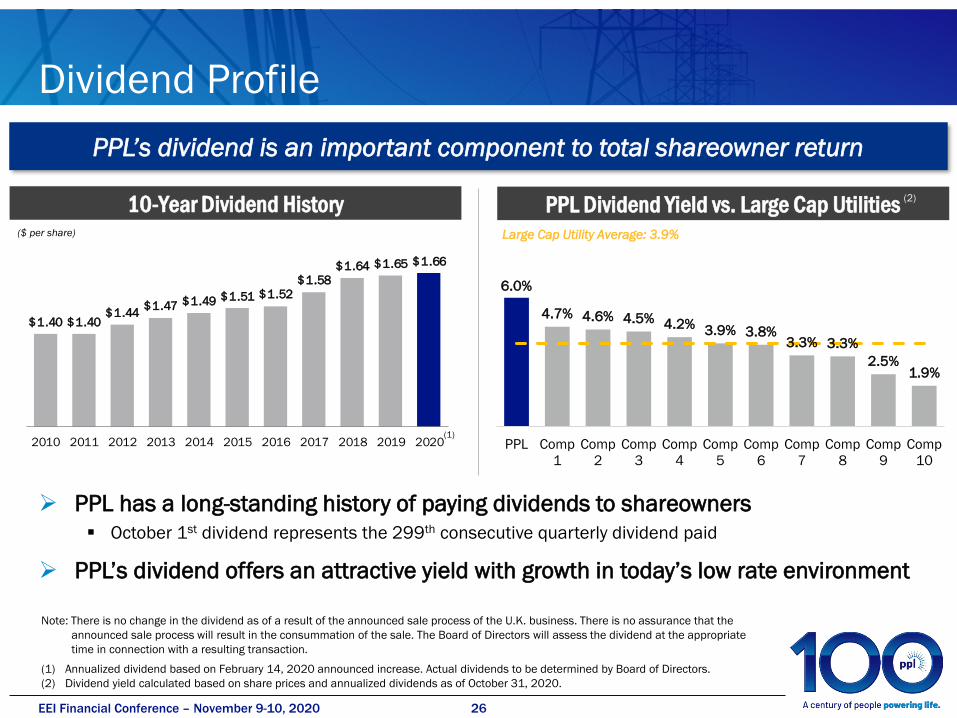
Dividend Profile
PPL’s dividend is an important component to total shareowner return
6.0%
4.7% 4.6% 4.5% 4.2% 3.9% 3.8%3.3% 3.3%
2.5%1.9%
PPL Comp
1
Comp
2
Comp
3
Comp
4
Comp
5
Comp
6
Comp
7
Comp
8
Comp
9
Comp
10
Note: There is no change in the dividend as of a result of the announced sale process of the U.K. business. There is no assurance that the
announced sale process will result in the consummation of the sale. The Board of Directors will assess the dividend at the appropriate
time in connection with a resulting transaction.
(1) Annualized dividend based on February 14, 2020 announced increase. Actual dividends to be determined by Board of Directors.
(2) Dividend yield calculated based on share prices and annualized dividends as of October 31, 2020.
$1.66 $1.65 $1.64
$1.58
$1.52 $1.51 $1.49 $1.47 $1.44
$1.40 $1.40
20202019201820172016201520142013201220112010
10-Year Dividend History
➢ PPL has a long-standing history of paying dividends to shareowners
▪ October 1st dividend represents the 299th consecutive quarterly dividend paid
➢ PPL’s dividend offers an attractive yield with growth in today’s low rate environment
($ per share) Large Cap Utility Average: 3.9%
PPL Dividend Yield vs. Large Cap Utilities(2)
(1)
27EEI Financial Conference – November 9-10, 2020
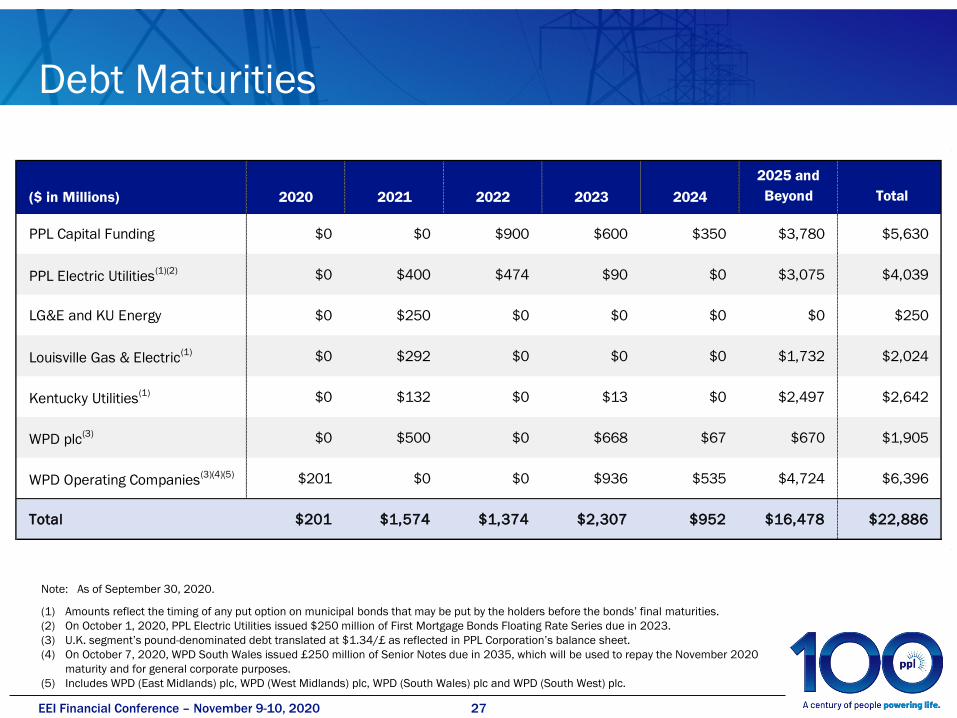
Debt Maturities
Note: As of September 30, 2020.
(1) Amounts reflect the timing of any put option on municipal bonds that may be put by the holders before the bonds’ final maturities.
(2) On October 1, 2020, PPL Electric Utilities issued $250 million of First Mortgage Bonds Floating Rate Series due in 2023.
(3) U.K. segment’s pound-denominated debt translated at $1.34/£ as reflected in PPL Corporation’s balance sheet.
(4) On October 7, 2020, WPD South Wales issued £250 million of Senior Notes due in 2035, which will be used to repay the November 2020
maturity and for general corporate purposes.
(5) Includes WPD (East Midlands) plc, WPD (West Midlands) plc, WPD (South Wales) plc and WPD (South West) plc.
($ in Millions) 2020 2021 2022 2023 2024
2025 and
Beyond Total
PPL Capital Funding $0 $0 $900 $600 $350 $3,780 $5,630
PPL Electric Utilities(1)(2) $0 $400 $474 $90 $0 $3,075 $4,039
LG&E and KU Energy $0 $250 $0 $0 $0 $0 $250
Louisville Gas & Electric(1) $0 $292 $0 $0 $0 $1,732 $2,024
Kentucky Utilities(1) $0 $132 $0 $13 $0 $2,497 $2,642
WPD plc(3) $0 $500 $0 $668 $67 $670 $1,905
WPD Operating Companies(3)(4)(5) $201 $0 $0 $936 $535 $4,724 $6,396
Total $201 $1,574 $1,374 $2,307 $952 $16,478 $22,886
28EEI Financial Conference – November 9-10, 2020
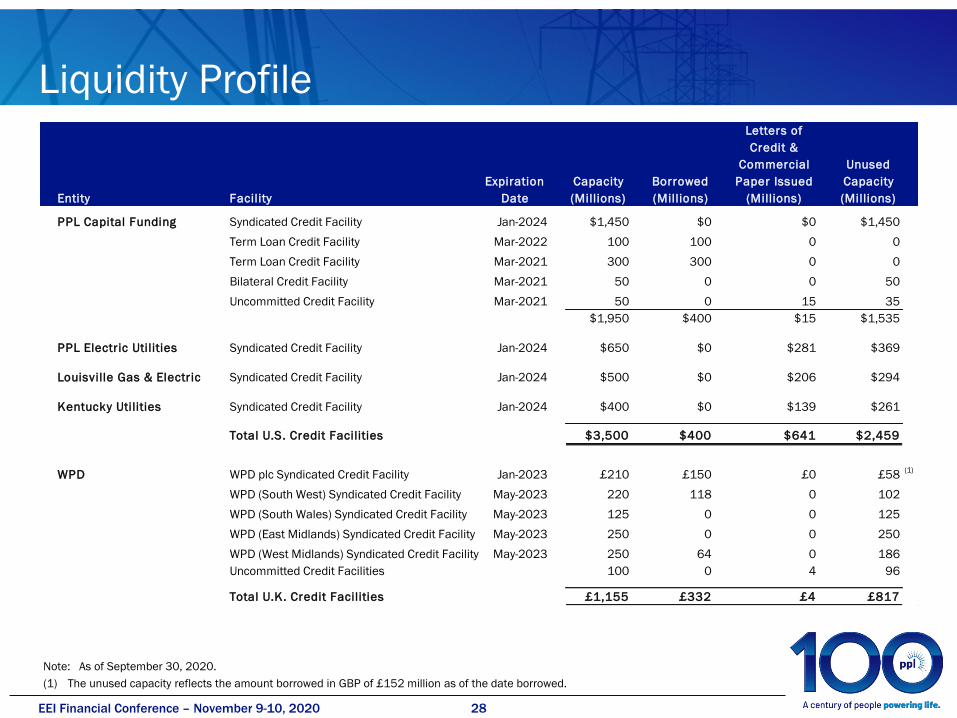
Liquidity Profile
Note: As of September 30, 2020.
(1) The unused capacity reflects the amount borrowed in GBP of £152 million as of the date borrowed.
Entity Facility
Expiration
Date
Capacity
(Millions)
Borrowed
(Millions)
Letters of
Credit &
Commercial
Paper Issued
(Millions)
Unused
Capacity
(Millions)
PPL Capital Funding Syndicated Credit Facility Jan-2024 $1,450 $0 $0 $1,450
Term Loan Credit Facility Mar-2022 100 100 0 0
Term Loan Credit Facility Mar-2021 300 300 0 0
Bilateral Credit Facility Mar-2021 50 0 0 50
Uncommitted Credit Facility Mar-2021 50 0 15 35
$1,950 $400 $15 $1,535
PPL Electric Utilities Syndicated Credit Facility Jan-2024 $650 $0 $281 $369
Louisville Gas & Electric Syndicated Credit Facility Jan-2024 $500 $0 $206 $294
Kentucky Utilities Syndicated Credit Facility Jan-2024 $400 $0 $139 $261
Total U.S. Credit Facilities $3,500 $400 $641 $2,459
WPD WPD plc Syndicated Credit Facility Jan-2023 £210 £150 £0 £58(1)
WPD (South West) Syndicated Credit Facility May-2023 220 118 0 102
WPD (South Wales) Syndicated Credit Facility May-2023 125 0 0 125
WPD (East Midlands) Syndicated Credit Facility May-2023 250 0 0 250
WPD (West Midlands) Syndicated Credit Facility May-2023 250 64 0 186
Uncommitted Credit Facilities 100 0 4 96
Total U.K. Credit Facilities £1,155 £332 £4 £817
29EEI Financial Conference – November 9-10, 2020
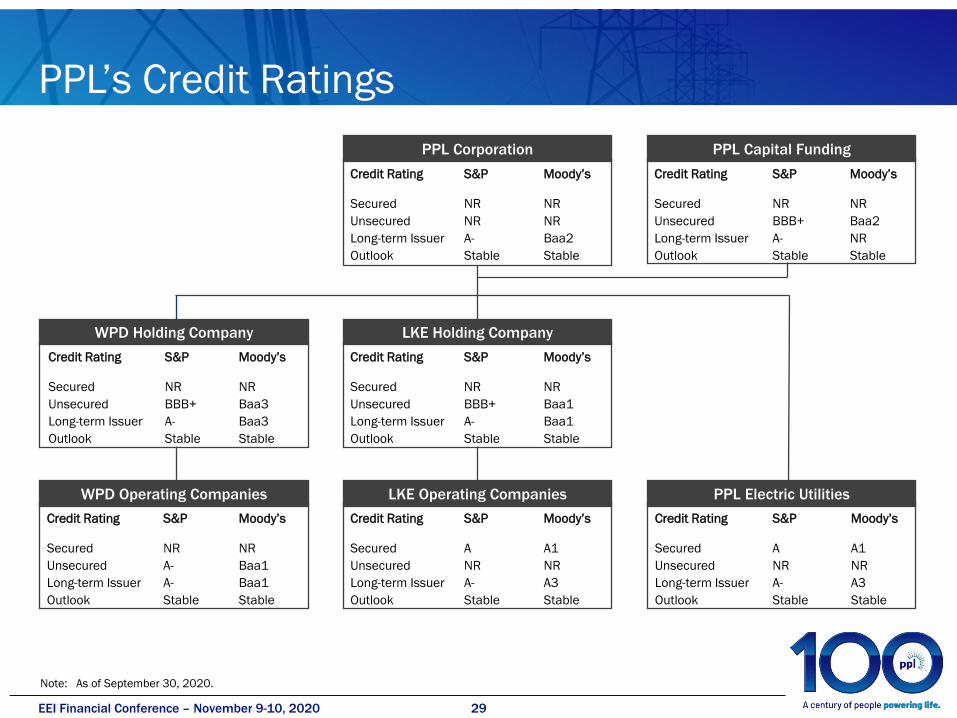
PPL’s Credit Ratings
Note: As of September 30, 2020.
WPD Holding Company LKE Holding Company
PPL Electric UtilitiesLKE Operating Companies
Credit Rating
Secured
Unsecured
Long-term Issuer
Outlook
S&P
NR
BBB+
A-
Stable
Moody’s
NR
Baa2
NR
Stable
Credit Rating
Secured
Unsecured
Long-term Issuer
Outlook
S&P
NR
BBB+
A-
Stable
Moody’s
NR
Baa3
Baa3
Stable
Credit Rating
Secured
Unsecured
Long-term Issuer
Outlook
S&P
NR
A-
A-
Stable
Moody’s
NR
Baa1
Baa1
Stable
Credit Rating
Secured
Unsecured
Long-term Issuer
Outlook
S&P
A
NR
A-
Stable
Moody’s
A1
NR
A3
Stable
Credit Rating
Secured
Unsecured
Long-term Issuer
Outlook
S&P
NR
BBB+
A-
Stable
Moody’s
NR
Baa1
Baa1
Stable
Credit Rating
Secured
Unsecured
Long-term Issuer
Outlook
S&P
A
NR
A-
Stable
PPL Corporation
Credit Rating
Secured
Unsecured
Long-term Issuer
Outlook
S&P
NR
NR
A-
Stable
Moody’s
NR
NR
Baa2
Stable
Moody’s
A1
NR
A3
Stable
WPD Operating Companies
PPL Capital Funding

30EEI Financial Conference – November 9-10, 2020
Forward-Looking Information StatementStatements contained in this presentation, including statements with respect to future earnings, cash flows, dividends, financing,
regulation and corporate strategy, including the process to sell PPL Corporation’s U.K. business, are “forward-looking statements”
within the meaning of the federal securities laws. Although PPL Corporation believes that the expectations and assumptions
reflected in these forward-looking statements are reasonable, these statements are subject to a number of risks and
uncertainties, and actual results may differ materially from the results discussed in the statements. The following are among the
important factors that could cause actual results to differ materially from the forward-looking statements: the COVID-19
pandemic or other pandemic health events or other catastrophic events, including severe weather, and their effect on financial
markets, economic conditions and our businesses; asset or business acquisitions and dispositions, including our ability to
successfully execute our plan to divest PPL Corporation’s U.K. business within the anticipated timeframe or on any particular
terms, if at all, or that such plan may not yield the anticipated benefits; market demand for energy in our U.S. service territories;
weather conditions affecting customer energy usage and operating costs; the effect of any business or industry restructuring; the
profitability and liquidity of PPL Corporation and its subsidiaries; new accounting requirements or new interpretations or
applications of existing requirements; operating performance of our facilities; the length of scheduled and unscheduled outages
at our generating plants; environmental conditions and requirements, and the related costs of compliance; system conditions
and operating costs; development of new projects, markets and technologies; performance of new ventures; receipt of necessary
government permits, approvals, rate relief and regulatory cost recovery; capital market conditions, including interest rates, and
decisions regarding capital structure; the impact of state, federal or foreign investigations applicable to PPL Corporation and its
subsidiaries; the outcome of litigation involving PPL Corporation and its subsidiaries; stock price performance; the market prices
of debt and equity securities and the impact on pension income and resultant cash funding requirements for defined benefit
pension plans; the securities and credit ratings of PPL Corporation and its subsidiaries; political, regulatory or economic
conditions in states, regions or countries where PPL Corporation or its subsidiaries conduct business, including any potential
effects of threatened or actual cyberattack, terrorism, or war or other hostilities; British pound sterling to U.S. dollar exchange
rates; new state, federal or foreign legislation or regulatory developments, including new tax legislation; and the commitments
and liabilities of PPL Corporation and its subsidiaries. Any such forward-looking statements should be considered in light of such
important factors and in conjunction with factors and other matters discussed in PPL Corporation's Form 10-K and other reports
on file with the Securities and Exchange Commission.
31EEI Financial Conference – November 9-10, 2020
Definitions of non-GAAP Financial Measures
Management utilizes "Earnings from Ongoing Operations" as a non-GAAP financial measure that should not be considered
as an alternative to reported earnings, or net income, an indicator of operating performance determined in accordance with
GAAP. PPL believes that Earnings from Ongoing Operations is useful and meaningful to investors because it provides
management's view of PPL's earnings performance as another criterion in making investment decisions. In addition, PPL's
management uses Earnings from Ongoing Operations in measuring achievement of certain corporate performance goals,
including targets for certain executive incentive compensation. Other companies may use different measures to present
financial performance.
Earnings from Ongoing Operations is adjusted for the impact of special items. Special items are presented in the financial
tables on an after-tax basis with the related income taxes on special items separately disclosed. Income taxes on special
items, when applicable, are calculated based on the statutory tax rate of the entity where the activity is recorded. Special
items may include items such as:
• Unrealized gains or losses on foreign currency economic hedges (as discussed below).
• Gains and losses on sales of assets not in the ordinary course of business.
• Impairment charges.
• Significant workforce reduction and other restructuring effects.
• Acquisition and divestiture-related adjustments.
• Other charges or credits that are, in management's view, non-recurring or otherwise not reflective of the company's
ongoing operations.
Unrealized gains or losses on foreign currency economic hedges include the changes in fair value of foreign currency
contracts used to hedge GBP-denominated anticipated earnings. The changes in fair value of these contracts are
recognized immediately within GAAP earnings. Management believes that excluding these amounts from Earnings from
Ongoing Operations until settlement of the contracts provides a better matching of the financial impacts of those contracts
with the economic value of PPL's underlying hedged earnings.
32EEI Financial Conference – November 9-10, 2020
Definitions of non-GAAP Financial Measures
Management also utilizes the following non-GAAP financial measures as indicators of performance for its businesses:
"U.K. Adjusted Gross Margins" is a single financial performance measure of the electricity distribution operations of the U.K. Regulated segment. In
calculating this measure, direct costs such as connection charges from National Grid, which owns and manages the electricity transmission network
in England and Wales, and Ofgem license fees (recorded in "Other operation and maintenance" on the Statements of Income) are deducted from
operating revenues, as they are costs passed through to customers. As a result, this measure represents the net revenues from the delivery of
electricity across WPD's distribution network in the U.K. and directly related activities.
"Kentucky Adjusted Gross Margins" is a single financial performance measure of the electricity generation, transmission and distribution operations
of the Kentucky Regulated segment, as well as the Kentucky Regulated segment’s distribution and sale of natural gas. In calculating this measure,
fuel, energy purchases and certain variable costs of production (recorded in "Other operation and maintenance" on the Statements of Income) are
deducted from operating revenues. In addition, certain other expenses, recorded in "Other operation and maintenance", "Depreciation" and "Taxes,
other than income" on the Statements of Income, associated with approved cost recovery mechanisms are offset against the recovery of those
expenses, which are included in revenues. These mechanisms allow for direct recovery of these expenses and, in some cases, returns on capital
investments and performance incentives. As a result, this measure represents the net revenues from electricity and gas operations.
"Pennsylvania Adjusted Gross Margins" is a single financial performance measure of the electricity transmission and distribution operations of the
Pennsylvania Regulated segment. In calculating this measure, utility revenues and expenses associated with approved recovery mechanisms,
including energy provided as a PLR, are offset with minimal impact on earnings. Costs associated with these mechanisms are recorded in "Energy
purchases," "Other operation and maintenance," (which are primarily Act 129, Storm Damage and Universal Service program costs), "Depreciation"
(which is primarily related to the Act 129 Smart Meter program) and "Taxes, other than income," (which is primarily gross receipts tax) on the
Statements of Income. This measure represents the net revenues from the Pennsylvania Regulated segment's electricity delivery operations.
These measures are not intended to replace "Operating Income," which is determined in accordance with GAAP, as an indicator of overall operating
performance. Other companies may use different measures to analyze and report their results of operations. Management believes these measures
provide additional useful criteria to make investment decisions. These performance measures are used, in conjunction with other information, by
senior management and PPL's Board of Directors to manage operations and analyze actual results compared with budget.
Reconciliations of adjusted gross margins for future periods are not provided as certain items excluded from Operating Income are inherently subject
to change and are not significant.