eele 3332 electromagnetic ii chapter 11...
TRANSCRIPT
EELE 3332 – Electromagnetic II
Chapter 11
Transmission Lines
Islamic University of Gaza
Electrical Engineering Department
Dr. Talal Skaik
2012 1

2
11.5 The Smith Chart
The Smith Chart is a graphical tool for analyzing transmission
lines.
The Smith Chart is made up of circles and arcs of circles.
The circles are called “constant resistance circles”
The arcs are “constant reactance circles”
The combination of intersecting circles and arcs inside the chart
allow us to locate the normalized impedance and then to find the
impedance anywhere on the line.
We will assume lossless transmission lines. (Zo=R0)
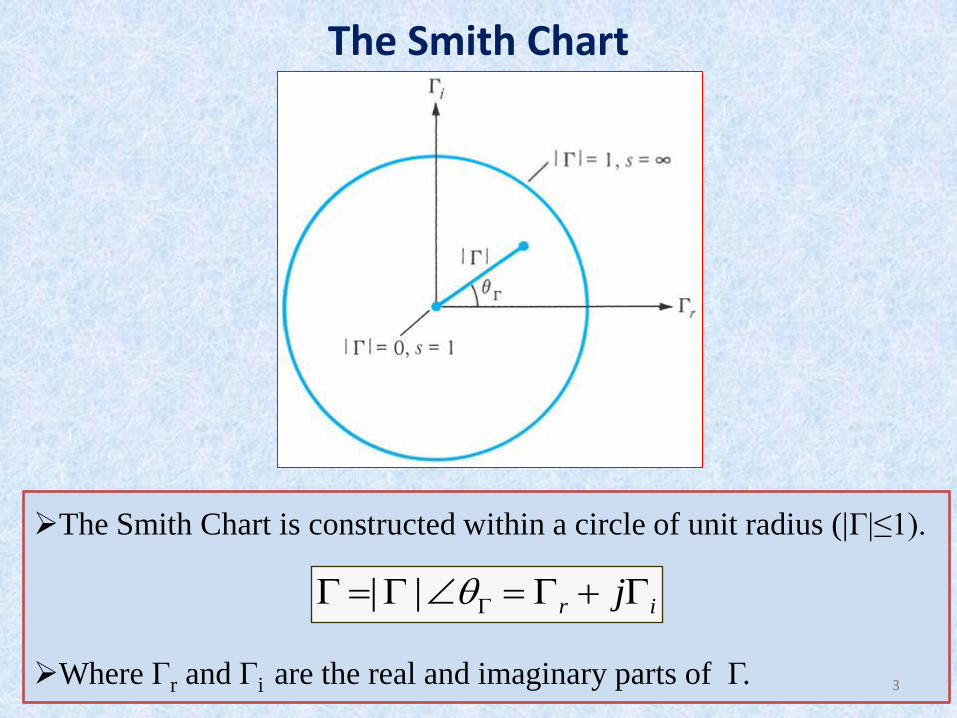
The Smith Chart is constructed within a circle of unit radius (|Γ|≤1).
Where Γr and Γi are the real and imaginary parts of Γ. 3
The Smith Chart
| | r ij

4
The Smith Chart
L
L
0
For the load impedance Z , the normalized impedance is:
Z
Z
L
L
z
z r jx
Smith Chart is normalized so that all impedances are normalized to the
characteristic impedance Z0. (Hence, it can be used for any line)
r-circles x-circles Resistance Circles
Reactance Circles

5
The Smith Chart
Plot
normalized
impedance
zL=1+j2

6
The Smith Chart

7
The Smith Chart • Impedance:
– Z1 = 100 + j50 – Z2 = 75 -j100 – Z3 = j200 – Z4 = 150 – Z5 = infinity (an open circuit) – Z6 = 0 (a short circuit) – Z7 = 50 – Z8 = 184 -j900
• Normalized impedance (line
impedance (50 Ohms) : – z1 = 2 + j – z2 = 1.5 -j2 – z3 = j4 – z4 = 3 – z5 = infinity – z6 = 0 – z7 = 1 – z8 = 3.68 -j18

8
The Smith Chart
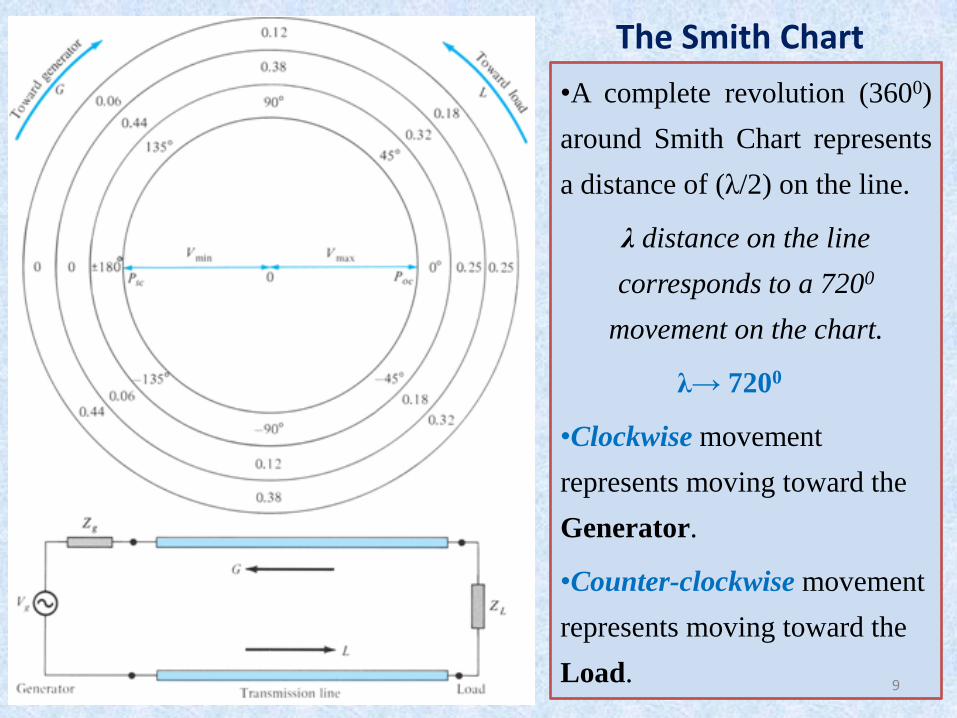
•A complete revolution (3600)
around Smith Chart represents
a distance of (λ/2) on the line.
λ distance on the line
corresponds to a 7200
movement on the chart.
λ→ 7200
•Clockwise movement
represents moving toward the
Generator.
•Counter-clockwise movement
represents moving toward the
Load. 9
The Smith Chart
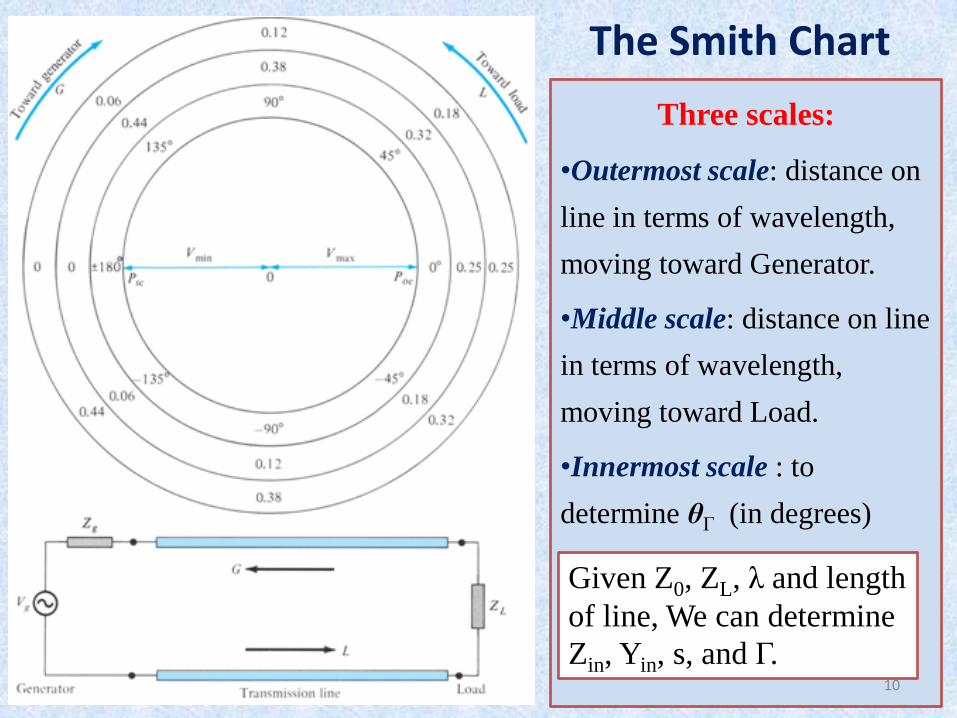
Three scales:
•Outermost scale: distance on
line in terms of wavelength,
moving toward Generator.
•Middle scale: distance on line
in terms of wavelength,
moving toward Load.
•Innermost scale : to
determine θΓ (in degrees)
10
The Smith Chart
Given Z0, ZL, λ and length
of line, We can determine
Zin, Yin, s, and Γ.

11
Example 11.4
•A lossless transmission line with Z0=50 Ω is 30 m long and operates
at 2 MHz. The line is terminated with a load ZL=60+j40 Ω. If u=0.6c
on the line, find
•(a) The reflection coefficient Γ
•(b) The standing wave ratio s
•(c) The input impedance.
0L 0
L 0
Method 1 (Without the Smith Chart)
Z Z 60 40 50 10 40(a) = 0.3523 56
Z +Z 60 40 50 110 40
1 | | 1 0.3523( ) s= 2.088
1 | | 1 0.3523
Solution
j j
j j
b

12
Example 11.4- Solution continued
60
8
00
0
0
0
0
2 (2 10 ) 2(c) = (30) 120 (electrical length)
0.6(3 10 ) 3
tan
tan
60 40 50 tan120 50
50 (60 40) tan120
23.97 1.35 24.01 3.22
Lin
L
l lu
Z jZ lZ Z
Z jZ l
j j
j j
j

0
0
0
(a) :
60 40 =1.2+j0.8
50
Locate at point
0| | 0.3516
0
is between 0 and 0 :
angle 0 56
0.3516 56
_____________________
( ) To find standing wave
ratio , draw s-ci
LL
L
L
L
ZNormalized z
Z
j
z
P
Q
S P
P S
b
s
P
rcle
(radius 0P and center 0)
s-circle meets -axis
at 2.1
r
s
13
Example 11.4
in
8 00
6
0
(c) to find Z , express interms of or in degrees.
0.6(3 10 ) 30 72090 m, =30 m= 240
2 10 90 3 3
Move clockwise from load toward Generator 240 on the
s-circle from point to point . A
l
ul
f
P G
0
t , We obtain: 0.47 0.03
Hence 50(0.47 0.03) 23.5 1.5
in
in in
G z j
Z Z z j j
zL

14
Example 11.5
A load of 100+j150 Ω is connected to a 75 Ω lossless line. Find:
a) The reflection coefficient Γ
b) The standing wave ratio s
c) The load admittance YL
d) Zin at 0.4λ from the load.
e) The locations of Vmax and Vmin with respect to the load if the line
is 0.6 λ long.
f) Zin at the generator.

15
Example 11.5
0
0
0
0
0
0
100 150(a)
75
=1.33+j2 (point )
0| | 0.659
0
angle 0 40
0.659 40
:
100 150 75
100 150 75
0.659 40
____________________
( ) Draw s-circle passing
thro
LL
L
L
LL
L
L
L
Z jz
Z
P
P
Q
P S
Z Z
Z Z
j
C
j
heck
b
chec
ugh
k:
and obtain
s=4.82
1 | | s= 4.865
1 | |
P

16
Example 11.5
0
0 0
0
(c) y 0.228 0.35
y
1 (0.228 0.35)
75
3.04 4.67
:
1 1
100 150
3.07 4.62
( ) The 0.4 corresponds
to 0.4 720 288
Move 288 on s-circle
from toward generator
L
L L
L
L
L
j
Y Y
j
Y j mS
YZ j
j
Che
mS
d
k
P
c
0
(clockwise) to reach point .
0.3 0.63
75(0.3 0.63)
=22.5+j47.25
in
in in
R
z j
Z Z z j

17
Example 11.5 – Solution continued
0
0
00
0
0
0
0
( )
2(0.4 ) 360 (0.4) 144
tan
tan tan
100 150 75 tan144 =75
75 (100 150) tan tan144
=54.41 65.
:
25
Lin
L
in
d
l
Z jZ
C
lZ Z
Z jZ l
j j
j j
or
Z
heck
21.9 47.6 j

18
Example 11.5 0
mi
0
0
0
0
n
(e) 0.6 0.6 720 432
1 72
Start from (Load), move
alone s-circle 432 , or one
revolution +72 , and reach
Generator at point .
We have passed through
point (location of V )
once, and po
P
G
revolution
T
max
max
0
0
max
min
int (location
of ) twice. From load:
1st V is located at :
400.055
720
2nd V is located at :
0.055 0.5552
The only V is located at :
0.0
V
55 / 4 0.3055
S

19
Example 11.5
(f) At (Generator end),
1.8 - 2.2
75(1.8 - 2.2)
135- 165
in
in
G
z j
Z j
j