effect of chloride on electrical resistivity in carbonated
TRANSCRIPT
applied sciences
Article
Effect of Chloride on Electrical Resistivity inCarbonated and Non-Carbonated Concrete
In-Seok Yoon 1,* and Chun-Ho Chang 2
1 Construction Information Engineering, Induk University, Seoul 01878, Korea2 Civil Engineering, Keimyung University, Daegu 42601, Korea; [email protected]* Correspondence: [email protected]; Tel.: +82-2-950-7585
Received: 20 August 2020; Accepted: 8 September 2020; Published: 9 September 2020
Abstract: The resistivity of a concrete structure exposed to chloride ions indicates the risk of earlycorrosion damage, because a low resistivity is related to rapid chloride penetration and to a highcorrosion rate. Concrete resistivity is a geometry-independent material property that describes theelectrical resistance, which is the ratio between the applied voltage and resulting current in a unit cell.The current is carried by ions dissolved in the pore liquid. While some data exist on the relationshipbetween the moisture content and electrical resistivity of concrete, very little research has beenconducted to evaluate the effect of chloride on the conduction of electricity through carbonated andnon-carbonated concrete. The purpose of this study is to examine the effect of chloride concentrationon the surface electrical resistivity measurement of carbonated and non-carbonated concrete. Chlorideconcentration had influenced the resistivity of concrete and the relationship showed a linear function.However, for concrete under the combined deterioration of carbonation and chlorides, a reduction inporosity due to the carbonation had a greater effect on the electrical resistivity than the increase inconductivity due to the chloride ions. Conclusively, this paper suggested the quantitative solution todepict the electrical resistivity of concrete with various chloride concentrations.
Keywords: electrical resistivity; chloride; carbonation; combined deterioration
1. Introduction
Electrical conductivity is a measure of how well a material accommodates the movement of anelectric charge. It is the ratio of the current density to the electric field strength. Electrical resistivityis the reciprocal of conductivity. It is the is the opposition of a body or substance to the flow of anelectrical current through it, resulting in a change of electrical energy into heat, light, or other formsof energy.
Electrical resistivity in concrete is a reversed function of conductivity and is related to the diffusivityof ions in the pores [1]. The measurement of electrical resistivity is considered to be a very attractivemethod for evaluating the properties of geomaterials and for the quality control of concrete becausesuch non-destructive testing (NDT) is simple, rapid, and cost-effective [2]. Particularly, electricalresistivity can be classified into two stages of durability, as proposed by Tuutti [3], which are beforeand after steel corrosion and thus can be used as the barometer of durability during the latent periodrelating to the micro structure of the concrete as well as the corrosion progress period [4–6]. Electricalresistivity measurements as NDT in the concrete industry are employed for the following reasons:(i) to measure resistivity without damage; (ii) to save time and costs; and (iii) to obtain the results of themeasurements in real time. Figure 1 shows the classification of the service life of a concrete structureinto stages: (i) the initiation period; and (ii) the propagation period. In general, the initiation andpropagation periods are strongly dominated by the chloride diffusivity and corrosion current densityof the reinforcement, respectively, both of which are qualitative indices. However, these experimental
Appl. Sci. 2020, 10, 6272; doi:10.3390/app10186272 www.mdpi.com/journal/applsci

Appl. Sci. 2020, 10, 6272 2 of 16
data are not easy to obtain on site. As an alternative to these two indices, electrical resistivity can bemeasured relatively easily and used as a qualitative index for evaluating the corrosion rate of concreteand eventually predicting its service life [7–9]. Nevertheless, electrical resistivity measurements havemany factors causing data interference. The chloride and water content in concrete may also have aneffect on electrical resistivity [10]. Even so, electrical resistivity has some disadvantages because it isaffected by several other factors, e.g., (i) the amount of cement paste; (ii) a water–cementitious materialratio; (iii) curing condition; (iv) exposure temperature; (v) chlorides; (vi) moisture content; (vii) cementtype, and the volumetric fraction of the cement paste; (viii) type and amount of admixtures; and (ix)quality and volumetric fraction of the aggregate [9]. When a current is applied, the electric field isdependent on the chloride concentration that has an effect on the pore water transfer [11,12], and thusit is necessary to monitor the data on the change in electrical resistivity of concrete containing variouschloride concentrations over time.
Appl. Sci. 2020, 10, x FOR PEER REVIEW 2 of 17
current density of the reinforcement, respectively, both of which are qualitative indices. However, these experimental data are not easy to obtain on site. As an alternative to these two indices, electrical resistivity can be measured relatively easily and used as a qualitative index for evaluating the corrosion rate of concrete and eventually predicting its service life [7–9]. Nevertheless, electrical resistivity measurements have many factors causing data interference. The chloride and water content in concrete may also have an effect on electrical resistivity [10]. Even so, electrical resistivity has some disadvantages because it is affected by several other factors, e.g., (i) the amount of cement paste; (ii) a water–cementitious material ratio; (iii) curing condition; (iv) exposure temperature; (v) chlorides; (vi) moisture content; (vii) cement type, and the volumetric fraction of the cement paste; (viii) type and amount of admixtures; and (ix) quality and volumetric fraction of the aggregate [9]. When a current is applied, the electric field is dependent on the chloride concentration that has an effect on the pore water transfer [11,12], and thus it is necessary to monitor the data on the change in electrical resistivity of concrete containing various chloride concentrations over time.
Figure 1. Modified schematic sketch of the steel corrosion sequence in concrete (updated from [3]).
Meanwhile, the electrical conductivity is not caused by the binding of electrons in an electrolyte solution but depends on the movement of charges. The resistance of the electrolyte solution is highly dependent on the concentration, while distilled water is generally an insulator and seawater is considered a high conductor. Therefore, when the chloride concentration increase, the electrical resistivity should decrease [13]. The decrease in resistivity between subsequent intervals of increasing chloride concentration decreased as the moisture content increased [14]. Since resistivity is measured by applying a current through the concrete and a potential difference is measured, increasing the chloride concentration of the pore water solution will improve the current conduction as ions help carry the current [15]. Nevertheless, it is rare to study the change in the electrical resistivity of concrete due to the effect of the chloride ions and carbonation. Because of the electrical nature of the resistivity measurements, the presence of ions within the section of concrete to be tested should affect the results. Because the electrical resistivity is closely related to the porosity of the concrete, it is possible to judge the resistance to chloride penetration, as shown in Table 1. Electrical resistivity is well correlated with certain performance characteristics of concrete, such as the chloride diffusivity, water absorption, and corrosion rate of the embedded steel. The technique also shows promise as a quality assurance tool for fresh and hardened concrete, as shown in Table 2. It is also a function of the
Figure 1. Modified schematic sketch of the steel corrosion sequence in concrete (updated from [3]).
Meanwhile, the electrical conductivity is not caused by the binding of electrons in an electrolytesolution but depends on the movement of charges. The resistance of the electrolyte solution is highlydependent on the concentration, while distilled water is generally an insulator and seawater is considereda high conductor. Therefore, when the chloride concentration increase, the electrical resistivity shoulddecrease [13]. The decrease in resistivity between subsequent intervals of increasing chloride concentrationdecreased as the moisture content increased [14]. Since resistivity is measured by applying a currentthrough the concrete and a potential difference is measured, increasing the chloride concentration of thepore water solution will improve the current conduction as ions help carry the current [15]. Nevertheless,it is rare to study the change in the electrical resistivity of concrete due to the effect of the chloride ionsand carbonation. Because of the electrical nature of the resistivity measurements, the presence of ionswithin the section of concrete to be tested should affect the results. Because the electrical resistivity isclosely related to the porosity of the concrete, it is possible to judge the resistance to chloride penetration,as shown in Table 1. Electrical resistivity is well correlated with certain performance characteristicsof concrete, such as the chloride diffusivity, water absorption, and corrosion rate of the embeddedsteel. The technique also shows promise as a quality assurance tool for fresh and hardened concrete,

Appl. Sci. 2020, 10, 6272 3 of 16
as shown in Table 2. It is also a function of the concentration of the ions and their mobility in the poresolution [16,17]. However, only the correlation between the durability criteria and electrical resistancewas presented in terms of chloride penetration, and the change in electrical resistivity due to the presenceof the chloride ions in carbonated or non-carbonated concrete was not illustrated.
Table 1. Chloride ions penetrability.
Chloride IonPenetrability
AASHTO TP 95 [1] AASHTO T358-15 [18]Thomas [19]
100 mm × 200 mm Cylinder (KΩ·cm) 150 mm × 300 mm Cylinder (KΩ·cm)
High <12 <9.5 <5
Moderate 12~21 9.5~16.5 5~10
Low 21~37 16.5~29 10~20
Very low 37~254 29~199 20~200
Negligible >254 >199 >200
Table 2. Comparison of chloride penetrability levels established for standards based on electricalresistivity (AASHTO TP 95) and charged passed (ASTM C 1202).
Chloride Ion Penetrability AASHTO TP 95 [1] (KΩ·cm) ASTM C 1202 [20] (Coulombs)
High <12 >4000
Moderate 12~21 2000~4000
Low 21~37 1000~2000
Very low 37~254 100~1000
Negligible >254 <100
This paper is intended to evaluate the variation characteristics of the electrical resistivity, depending onthe chloride concentration, for carbonated and non-carbonated concrete. Many structures are deterioratedby chloride or the combined deterioration by carbonation and chlorides, and this mechanism is verycomplicated, as shown in Figure 2. The variation in electrical resistivity was examined over time aftermixing chloride ions in the concrete with various w/c ratios and after carbonation in the concrete withchloride ions. Therefore, electrical resistivity still can be useful even after the concrete is deteriorated bycarbonation and chloride penetration.
Appl. Sci. 2020, 10, x FOR PEER REVIEW 3 of 17
concentration of the ions and their mobility in the pore solution [16,17]. However, only the correlation between the durability criteria and electrical resistance was presented in terms of chloride penetration, and the change in electrical resistivity due to the presence of the chloride ions in carbonated or non-carbonated concrete was not illustrated.
Table 1. Chloride ions penetrability.
Chloride Ion Penetrability
AASHTO TP 95 [1] AASHTO T358-15 [18] Thomas [19] 100 mm × 200 mm Cylinder
(KΩ·cm) 150 mm × 300 mm Cylinder
(KΩ·cm) High <12 <9.5 <5
Moderate 12~21 9.5~16.5 5~10 Low 21~37 16.5~29 10~20
Very low 37~254 29~199 20~200 Negligible >254 >199 >200
Table 2. Comparison of chloride penetrability levels established for standards based on electrical resistivity (AASHTO TP 95) and charged passed (ASTM C 1202).
Chloride Ion Penetrability
AASHTO TP 95 [1] (KΩ·cm) ASTM C 1202 [20] (Coulombs)
High <12 >4000 Moderate 12~21 2000~4000
Low 21~37 1000~2000 Very low 37~254 100~1000
Negligible >254 <100
This paper is intended to evaluate the variation characteristics of the electrical resistivity, depending on the chloride concentration, for carbonated and non-carbonated concrete. Many structures are deteriorated by chloride or the combined deterioration by carbonation and chlorides, and this mechanism is very complicated, as shown in Figure 2. The variation in electrical resistivity was examined over time after mixing chloride ions in the concrete with various w/c ratios and after carbonation in the concrete with chloride ions. Therefore, electrical resistivity still can be useful even after the concrete is deteriorated by carbonation and chloride penetration.
Figure 2. Mechanism of interaction between carbonation and chloride penetration [21].
Figure 2. Mechanism of interaction between carbonation and chloride penetration [21].

Appl. Sci. 2020, 10, 6272 4 of 16
2. Experiment Program
2.1. Preperation of Samples
Commercial cement, Type I KS L 5201 Ordinary Portland Cement (OPC), was used with a water-cementratio (w/c) of 0.45, 0.50, and 0.55, as shown in Table 3. For the chloride-contaminated specimen, sodiumchloride was mixed with mixing water, 0%, 0.5%, 1.0%, 1.5%, and 2.0% by weight of cement. The specimenwas submerged in the same saltwater as the sodium chloride-mixed water used when producing theinitial specimen till measuring. The size of each specimen was determined to be 100 mm (L) × 100 mm(W) × 200 mm (H), such that the spacing of the electrodes was much smaller than the height of thematerials. The curing temperature was 20 C. After 28 days of water curing, followed three different curingconditions, i.e., (1) air-dry; (2) water curing; (3) pre-mixed chloride; and (4) combined deterioration due tocarbonation and chloride ions. Testing with the three types of conditions was intended to investigate thechange in electrical resistivity due to the water content and chloride concentration.
Table 3. Mixing proportion of the concrete.
w/cUnit Weight (kg/m3)
Water Cement Sand Gravel
0.45 185 411 706 1001
0.50 185 370 720 1021
0.55 185 336 732 1038
2.2. Carbonation of Concrete
For the combined deterioration experiment due to carbonation and chloride, a concrete specimenwith chloride of 1.0%, 2.0% by weight of cement, was exposed to an accelerating carbonation chamber.The concrete specimens were placed in a chamber with a controlled CO2 concentration of 5% at atemperature of 20 C, and a relative humidity of 65%. A phenolphthalein indicator was applied on thefresh fractured surfaces of the specimens to measure the carbonation depth.
2.3. Measurment of Electrical Resistivity
It is important to prepare the specimen with the same conditions before testing because theelectrical resistivity of concrete is significantly sensitive to moisture. The four-electrode method, knownas the Wenner four-pin method, was developed initially for conducting soil resistivity tests by the U.S.Bureau of Standards.
A four-pin resistivity meter was used to measure the electrical resistivity of the concrete specimens(Figure 3). The measurement was based on ASTM C1760-12 [22]. For each specimen, four separatemeasurements were made on four different surfaces. Electrical resistivity is in reverse proportion tothe current applied (I) and the potential difference (V) is measured on an electrode inside; the apparentelectrical resistivity is measured by the following equation according to Ohms law:
ρ =2π a V
I(1)
where ρ is the electrical resistivity of the concrete, a is interval between the electrodes.

Appl. Sci. 2020, 10, 6272 5 of 16Appl. Sci. 2020, 10, x FOR PEER REVIEW 5 of 17
Figure 3. Measurement of the electrical resistivity measurements in concrete.
3. Results and Discussion
3.1. Effect of the Age of Samples
Figure 4 describes the electrical resistivity measurements of a saturated specimen over a period of time. A gradual increase in electrical resistivity was observed for the greater age of the specimen.
Figure 4. Electrical resistivity measurements of the saturated concrete without chloride.
At an early age, there are no differences in the electrical measurements among the different pastes, but it was observed that the mixture that had the lowest w/c ratio had the highest electrical resistivity at the end of the experiments. The primary reason should be that the paste that has the lowest w/c ratio has more hydration products and less porosity than the other two mixtures.
Figure 5 shows the measurements of the electrical resistivity of the air-dried concrete. Until 100 days of air-dried curing, it was observed that the resistivity increased gradually as the age increased. However, the electrical resistivity increased dramatically from an age of 100 days to the completion of the experiment. The electrical resistivity measurement at the end of the experiment was approximately 1400 KΩ∙cm. According to the guideline value provided by RESI (2002), corrosion is very low if the electrical resistivity is greater than 12 KΩ∙cm. Therefore, it is expected that the environment for anti-corrosion is driven after 70 days of air-dried and saturated curing.
0
2
4
6
8
10
12
14
16
18
20
0 100 200 300
Time (days)
Elec
tric
al r
esis
tivity
(KΩ
·cm
).
W/C 0.45
W/C 0.50
W/C 0.55
Figure 3. Measurement of the electrical resistivity measurements in concrete.
3. Results and Discussion
3.1. Effect of the Age of Samples
Figure 4 describes the electrical resistivity measurements of a saturated specimen over a period oftime. A gradual increase in electrical resistivity was observed for the greater age of the specimen.
Appl. Sci. 2020, 10, x FOR PEER REVIEW 5 of 17
Figure 3. Measurement of the electrical resistivity measurements in concrete.
3. Results and Discussion
3.1. Effect of the Age of Samples
Figure 4 describes the electrical resistivity measurements of a saturated specimen over a period of time. A gradual increase in electrical resistivity was observed for the greater age of the specimen.
Figure 4. Electrical resistivity measurements of the saturated concrete without chloride.
At an early age, there are no differences in the electrical measurements among the different pastes, but it was observed that the mixture that had the lowest w/c ratio had the highest electrical resistivity at the end of the experiments. The primary reason should be that the paste that has the lowest w/c ratio has more hydration products and less porosity than the other two mixtures.
Figure 5 shows the measurements of the electrical resistivity of the air-dried concrete. Until 100 days of air-dried curing, it was observed that the resistivity increased gradually as the age increased. However, the electrical resistivity increased dramatically from an age of 100 days to the completion of the experiment. The electrical resistivity measurement at the end of the experiment was approximately 1400 KΩ∙cm. According to the guideline value provided by RESI (2002), corrosion is very low if the electrical resistivity is greater than 12 KΩ∙cm. Therefore, it is expected that the environment for anti-corrosion is driven after 70 days of air-dried and saturated curing.
0
2
4
6
8
10
12
14
16
18
20
0 100 200 300
Time (days)
Elec
tric
al r
esis
tivity
(KΩ
·cm
).
W/C 0.45
W/C 0.50
W/C 0.55
Figure 4. Electrical resistivity measurements of the saturated concrete without chloride.
At an early age, there are no differences in the electrical measurements among the different pastes,but it was observed that the mixture that had the lowest w/c ratio had the highest electrical resistivityat the end of the experiments. The primary reason should be that the paste that has the lowest w/c ratiohas more hydration products and less porosity than the other two mixtures.
Figure 5 shows the measurements of the electrical resistivity of the air-dried concrete. Until 100 daysof air-dried curing, it was observed that the resistivity increased gradually as the age increased. However,the electrical resistivity increased dramatically from an age of 100 days to the completion of the experiment.The electrical resistivity measurement at the end of the experiment was approximately 1400 KΩ·cm.According to the guideline value provided by RESI (2002), corrosion is very low if the electrical resistivity

Appl. Sci. 2020, 10, 6272 6 of 16
is greater than 12 KΩ·cm. Therefore, it is expected that the environment for anti-corrosion is drivenafter 70 days of air-dried and saturated curing.Appl. Sci. 2020, 10, x FOR PEER REVIEW 6 of 17
Figure 5. Electrical resistivity measurements of the air-dried concrete without chloride.
3.2. Effect of the Pore Water of Concrete
Moisture within the concrete’s pores is essential for the passage of electrical current, through which resistivity can be determined. Lowering the moisture content will restrict the current flow and will consequently increase the measured resistivity. For this reason, the measurement of electrical resistivity is strongly influenced by the amount of water in the materials (Figure 6). According to Buenfeld et al. [4] and Goni and Andrade [10], the electrical resistivity of water in the pores is about 5 × 10⁻² KΩ∙cm. According to Yoon’s experimental results [23], completely dried concrete does not allow ions or charges to move. Therefore, the small amount of pore water in concrete can lead to high conductivity and low resistivity.
Figure 6. Effect of pore water on the electrical resistivity of concrete.
0
200
400
600
800
1000
1200
1400
0 50 100 150 200 250
Time (days)
Elec
tric
al r
esis
tivity
(KΩ
·cm
)
W/C 0.45W/C 0.50W/C 0.55
Figure 5. Electrical resistivity measurements of the air-dried concrete without chloride.
3.2. Effect of the Pore Water of Concrete
Moisture within the concrete’s pores is essential for the passage of electrical current, throughwhich resistivity can be determined. Lowering the moisture content will restrict the current flow andwill consequently increase the measured resistivity. For this reason, the measurement of electricalresistivity is strongly influenced by the amount of water in the materials (Figure 6). According toBuenfeld et al. [4] and Goni and Andrade [10], the electrical resistivity of water in the pores is about5 × 10−2 KΩ·cm. According to Yoon’s experimental results [23], completely dried concrete does notallow ions or charges to move. Therefore, the small amount of pore water in concrete can lead to highconductivity and low resistivity.
Figure 7 shows the relationship between the electrical resistivity and the volumetric fraction ofthe capillary pore water of the specimens. The amount of capillary water in the pores was estimatedby the cement hydration model proposed by van Breugel [24]. The maximum volumetric fraction ofthe capillary pore water was approximately 0.6 and the ratio of the electrical resistivity of the air-driedconcrete to that of the saturated concrete decreased dramatically as the amount of pore water increased.The relationship between the electrical resistivity ratio of the concrete and the volumetric fraction ofthe capillary water in the pores is expressed in Equation.
In particular, the electrical resistivity ratio of air-dried to saturated concrete is very sensitive to theamount of capillary water in the pores. A sudden decrease in the resistivity ratio from 0.3 to 0.45 wasobserved. However, a gradual decrease of the ratio of air-dried to saturated concrete was observed as afunction of the volumetric fraction of the capillary water in the pores between 0.45 and 0.6. From theseobservations, it can be concluded that the capillary pore water in concrete significantly influences itselectrical resistivity and its relationship can be expressed as follows:
ρair = 1.822× 10⁴ exp[−17.079
(Vwater
Vpore
)]· ρsat (2)

Appl. Sci. 2020, 10, 6272 7 of 16
Appl. Sci. 2020, 10, x FOR PEER REVIEW 6 of 17
Figure 5. Electrical resistivity measurements of the air-dried concrete without chloride.
3.2. Effect of the Pore Water of Concrete
Moisture within the concrete’s pores is essential for the passage of electrical current, through which resistivity can be determined. Lowering the moisture content will restrict the current flow and will consequently increase the measured resistivity. For this reason, the measurement of electrical resistivity is strongly influenced by the amount of water in the materials (Figure 6). According to Buenfeld et al. [4] and Goni and Andrade [10], the electrical resistivity of water in the pores is about 5 × 10⁻² KΩ∙cm. According to Yoon’s experimental results [23], completely dried concrete does not allow ions or charges to move. Therefore, the small amount of pore water in concrete can lead to high conductivity and low resistivity.
Figure 6. Effect of pore water on the electrical resistivity of concrete.
0
200
400
600
800
1000
1200
1400
0 50 100 150 200 250
Time (days)
Elec
tric
al r
esis
tivity
(KΩ
·cm
)
W/C 0.45W/C 0.50W/C 0.55
Figure 6. Effect of pore water on the electrical resistivity of concrete.
Appl. Sci. 2020, 10, x FOR PEER REVIEW 7 of 17
Figure 7 shows the relationship between the electrical resistivity and the volumetric fraction of the capillary pore water of the specimens. The amount of capillary water in the pores was estimated by the cement hydration model proposed by van Breugel [24]. The maximum volumetric fraction of the capillary pore water was approximately 0.6 and the ratio of the electrical resistivity of the air-dried concrete to that of the saturated concrete decreased dramatically as the amount of pore water increased. The relationship between the electrical resistivity ratio of the concrete and the volumetric fraction of the capillary water in the pores is expressed in Equation
41.822 10 exp 17.079 waterair sat
pore
Vρ ρV
= × − ⋅
(2)
In particular, the electrical resistivity ratio of air-dried to saturated concrete is very sensitive to the amount of capillary water in the pores. A sudden decrease in the resistivity ratio from 0.3 to 0.45 was observed. However, a gradual decrease of the ratio of air-dried to saturated concrete was observed as a function of the volumetric fraction of the capillary water in the pores between 0.45 and 0.6. From these observations, it can be concluded that the capillary pore water in concrete significantly influences its electrical resistivity and its relationship can be expressed as follows:
41.822 10 exp 17.079 waterair sat
pore
Vρ ρV
= × − ⋅
(2)
Figure 7. Relationship between the electrical resistivity of the concrete and the volumetric fraction of the capillary water in the pores.
3.3. Effect of Chloride Concentration
Figure 8 represents the variation in electrical resistivity of the concrete, depending on chloride concentration. The electrical resistivity continued rising due to the generation of hydrates and a pore structure in line with increasing hydration over time. At the early stage, concrete has a low electrical resistivity. As the microstructure of the concrete was developed with elapsed time, however, the electrical resistivity tended to increase. The trend was obvious depending on the chloride concentration. The higher the chloride concentration, the less the electrical resistivity. According to the RESI-specific resistance measurement standard and Broomfield [25], the risk of reinforcement corrosion is extremely low when its 12 KΩ∙cm or 20 KΩ∙cm. The common value of the two suggestions was 12 KΩ∙cm. All concrete, excluding the specimen with chloride ions of 2.0% and a w/c ratio of 0.55, failed to meet
0
10
20
30
40
50
60
70
80
90
0 0.2 0.4 0.6 0.8
Volumeric fraction of capillary water in pore
Rat
io o
f el
ectr
ical
res
istiv
ity (
air
/ sa
tura
tion)
Figure 7. Relationship between the electrical resistivity of the concrete and the volumetric fraction ofthe capillary water in the pores.
3.3. Effect of Chloride Concentration
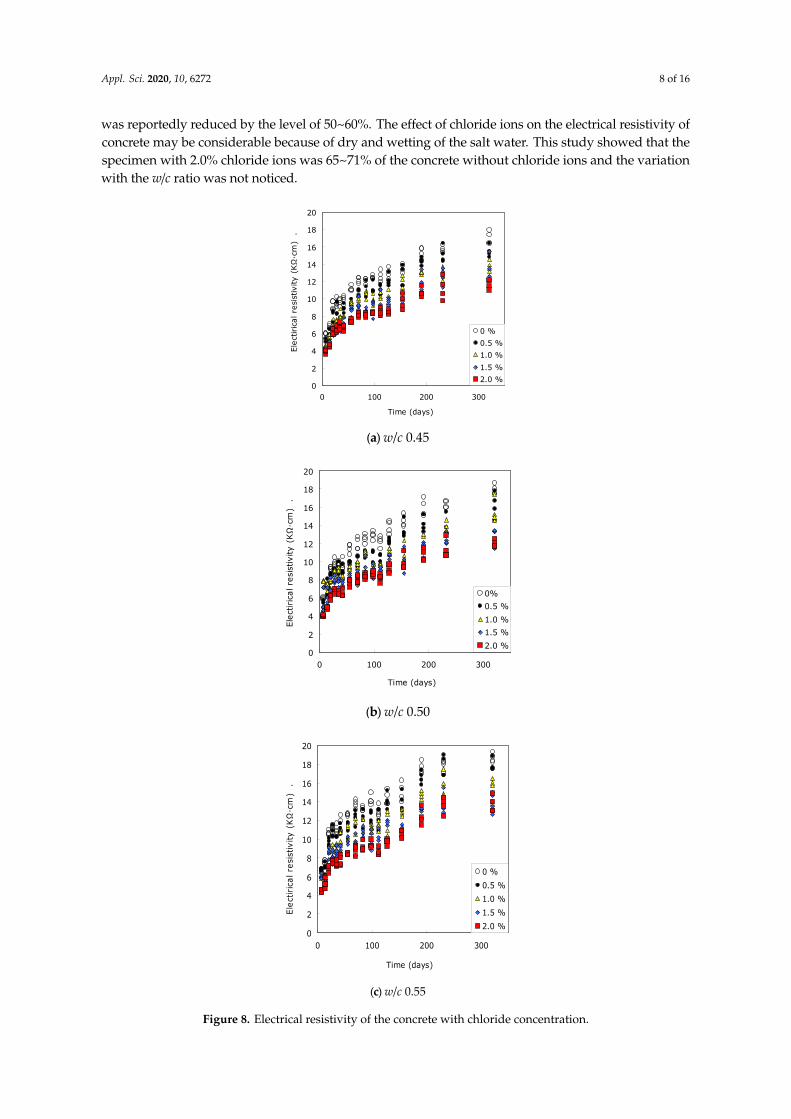
Figure 8 represents the variation in electrical resistivity of the concrete, depending on chlorideconcentration. The electrical resistivity continued rising due to the generation of hydrates and a porestructure in line with increasing hydration over time. At the early stage, concrete has a low electricalresistivity. As the microstructure of the concrete was developed with elapsed time, however, the electricalresistivity tended to increase. The trend was obvious depending on the chloride concentration. The higherthe chloride concentration, the less the electrical resistivity. According to the RESI-specific resistancemeasurement standard and Broomfield [25], the risk of reinforcement corrosion is extremely low whenits 12 KΩ·cm or 20 KΩ·cm. The common value of the two suggestions was 12 KΩ·cm. All concrete,excluding the specimen with chloride ions of 2.0% and a w/c ratio of 0.55, failed to meet the value.According to Liu et al. [9], the electrical resistivity of concrete containing 2% chloride ions in weight
Appl. Sci. 2020, 10, 6272 8 of 16
was reportedly reduced by the level of 50~60%. The effect of chloride ions on the electrical resistivity ofconcrete may be considerable because of dry and wetting of the salt water. This study showed that thespecimen with 2.0% chloride ions was 65~71% of the concrete without chloride ions and the variationwith the w/c ratio was not noticed.
Appl. Sci. 2020, 10, x FOR PEER REVIEW 8 of 17
the value. According to Liu et al. [9], the electrical resistivity of concrete containing 2% chloride ions in weight was reportedly reduced by the level of 50~60%. The effect of chloride ions on the electrical resistivity of concrete may be considerable because of dry and wetting of the salt water. This study showed that the specimen with 2.0% chloride ions was 65~71% of the concrete without chloride ions and the variation with the w/c ratio was not noticed.
(a) w/c 0.45
(b) w/c 0.50
(c) w/c 0.55
Figure 8. Electrical resistivity of the concrete with chloride concentration.
0
2
4
6
8
10
12
14
16
18
20
0 100 200 300
Time (days)
Elec
tiric
al r
esis
tivity
(KΩ
·cm
) .
0 %0.5 %1.0 %1.5 %2.0 %
0
2
4
6
8
10
12
14
16
18
20
0 100 200 300
Time (days)
Elec
tiric
al r
esis
tivity
(KΩ
·cm
) .
0%0.5 %1.0 %1.5 %2.0 %
0
2
4
6
8
10
12
14
16
18
20
0 100 200 300
Time (days)
Elec
tiric
al r
esis
tivity
(KΩ
·cm
) .
0 %0.5 %1.0 %1.5 %2.0 %
Figure 8. Electrical resistivity of the concrete with chloride concentration.

Appl. Sci. 2020, 10, 6272 9 of 16
3.4. Effect of Chloride Ions with Time
Figure 9 shows the variation of determinant coefficient as a result of the linear regression analysisof the electrical resistivity ratio vs. the chloride concentration over time. Though the accuracy wasnot high, the correlation between the chloride concentration and the ratio of electrical resistivity ratioexceeded 0.70, which means the obvious effect of chloride ion on electrical resistivity. At the earlystage of concrete curing, the determinant coefficient was low and then increased over time; however,the effect with the w/c ratio was not clear. A low determinant coefficient seemed to be attributable to theirregular variation in electrical resistivity of concrete with chloride concentration when the hydrationof the concrete was not activated in earnest during the early time.
Appl. Sci. 2020, 10, x FOR PEER REVIEW 10 of 17
3.4. Effect of Chloride Ions with Time
Figure 9 shows the variation of determinant coefficient as a result of the linear regression analysis of the electrical resistivity ratio vs. the chloride concentration over time. Though the accuracy was not high, the correlation between the chloride concentration and the ratio of electrical resistivity ratio exceeded 0.70, which means the obvious effect of chloride ion on electrical resistivity. At the early stage of concrete curing, the determinant coefficient was low and then increased over time; however, the effect with the w/c ratio was not clear. A low determinant coefficient seemed to be attributable to the irregular variation in electrical resistivity of concrete with chloride concentration when the hydration of the concrete was not activated in earnest during the early time.
Figure 9. Coefficient of determination in the linear regression deriving from the resistivity ratio vs. chloride concentration.
Figure 10 shows the incline of the linear regression analysis equation of the electrical resistivity ratio and chloride concentration with the concrete without chloride concentration. The gradient of the linear regression analysis equation was low during the early time; however, it was constant without significant variation from 50 days onwards. That is, a decrease in the electrical resistivity depending on chloride concentration was rather low till 50 days and then continued to rise. After 50 days, the trend could not be examined. The electrical resistivity of concrete vs. chloride concentration was insignificant after 50 days and this was attributable to two reasons. First, the C-S-H phase and AFm phase, which can react with water-soluble chloride to form bound chloride, are not well developed [26]. At the early stage, chloride adsorption is not active because of immature development of the two hydrates. In addition, it is known that chloride can reduce the electrical resistivity of water. Secondly, chloride can be a cause of the change of the micro-structural characteristics of cementitious materials. In general, sodium chloride increases the pH of the pore solution in concrete and increase in alkali content, which causes a heterogeneous C-S-H phase [27]. Therefore, chloride leads to capillary porosity with a large pore space and this can be a cause of the low electrical resistivity of concrete. The first reason of chloride ion absorption and the second reason of micro-structure on the electrical resistivity of concrete are not consistent. The micro-structure of hardened cementitious material has a greater influence on electrical resistivity than chloride absorption; however, consider the low gradient at the early stage and its increase with time.
0.70
0.75
0.80
0.85
0.90
0.95
1.00
0 50 100 150 200 250 300 350Time (days)
Coe
ffic
ient
of de
term
inat
ion
w/c 0.45
w/c 0.50
w/c 0.55
Figure 9. Coefficient of determination in the linear regression deriving from the resistivity ratio vs.chloride concentration.
Figure 10 shows the incline of the linear regression analysis equation of the electrical resistivityratio and chloride concentration with the concrete without chloride concentration. The gradient of thelinear regression analysis equation was low during the early time; however, it was constant withoutsignificant variation from 50 days onwards. That is, a decrease in the electrical resistivity depending onchloride concentration was rather low till 50 days and then continued to rise. After 50 days, the trendcould not be examined. The electrical resistivity of concrete vs. chloride concentration was insignificantafter 50 days and this was attributable to two reasons. First, the C-S-H phase and AFm phase, whichcan react with water-soluble chloride to form bound chloride, are not well developed [26]. At theearly stage, chloride adsorption is not active because of immature development of the two hydrates.In addition, it is known that chloride can reduce the electrical resistivity of water. Secondly, chloridecan be a cause of the change of the micro-structural characteristics of cementitious materials. In general,sodium chloride increases the pH of the pore solution in concrete and increase in alkali content, whichcauses a heterogeneous C-S-H phase [27]. Therefore, chloride leads to capillary porosity with a largepore space and this can be a cause of the low electrical resistivity of concrete. The first reason of chlorideion absorption and the second reason of micro-structure on the electrical resistivity of concrete are notconsistent. The micro-structure of hardened cementitious material has a greater influence on electricalresistivity than chloride absorption; however, consider the low gradient at the early stage and its increasewith time.

Appl. Sci. 2020, 10, 6272 10 of 16Appl. Sci. 2020, 10, x FOR PEER REVIEW 11 of 17
Figure 10. Gradient in the linear regression deriving from the resistivity ratio vs. chloride concentration.
3.5. Effect of Chloride Ions on Electirical Resisitvity
Figure 11 represents the variation in electrical resistivity depending on chloride concentration. In the figure, the Y label, the electrical resistivity ratio between the concrete with chloride and concrete without chloride, was calculated from Figure 8. The variation in electrical resistivity of the concrete with the w/c ratio was not monitored; however, the electrical resistivity had decreased for concrete with a high chloride concentration.
Figure 11. Chloride concentration vs. resistivity of the concrete.
Based on the Figure 11, the average electrical resistivity of concrete contaminated with the same chloride concentration was calculated. Figure 12 shows the correlation between the chloride concentration and ratio of the average electrical resistivity of concrete with chloride concentration. The variation with the w/c ratio was not monitored. It is obvious that the chloride concentration leads to reduced resistivity of the concrete. The determinant coefficient was 0.97, which is meaningful in determining the variation in electrical resistivity of concrete with chloride ion content, as follows:
Clwat
Cl C163.01−=ρρ (3)
0.08
0.10
0.12
0.14
0.16
0.18
0.20
0.22
0 50 100 150 200 250 300 350Time (days)
Gra
dien
t (a
bsol
ute
valu
e)w/c 0.45
w/c 0.50
w/c 0.55
0.4
0.5
0.6
0.7
0.8
0.9
1.0
0.0 0.5 1.0 1.5 2.0
Chloride content (% by cement wt.)
Res
istiv
ity r
atio
(vs
. co
ncre
te w
ith C
l- 0%
)
Figure 10. Gradient in the linear regression deriving from the resistivity ratio vs. chloride concentration.
3.5. Effect of Chloride Ions on Electirical Resisitvity
Figure 11 represents the variation in electrical resistivity depending on chloride concentration.In the figure, the Y label, the electrical resistivity ratio between the concrete with chloride and concretewithout chloride, was calculated from Figure 8. The variation in electrical resistivity of the concretewith the w/c ratio was not monitored; however, the electrical resistivity had decreased for concretewith a high chloride concentration.
Appl. Sci. 2020, 10, x FOR PEER REVIEW 11 of 17
Figure 10. Gradient in the linear regression deriving from the resistivity ratio vs. chloride concentration.
3.5. Effect of Chloride Ions on Electirical Resisitvity
Figure 11 represents the variation in electrical resistivity depending on chloride concentration. In the figure, the Y label, the electrical resistivity ratio between the concrete with chloride and concrete without chloride, was calculated from Figure 8. The variation in electrical resistivity of the concrete with the w/c ratio was not monitored; however, the electrical resistivity had decreased for concrete with a high chloride concentration.
Figure 11. Chloride concentration vs. resistivity of the concrete.
Based on the Figure 11, the average electrical resistivity of concrete contaminated with the same chloride concentration was calculated. Figure 12 shows the correlation between the chloride concentration and ratio of the average electrical resistivity of concrete with chloride concentration. The variation with the w/c ratio was not monitored. It is obvious that the chloride concentration leads to reduced resistivity of the concrete. The determinant coefficient was 0.97, which is meaningful in determining the variation in electrical resistivity of concrete with chloride ion content, as follows:
Clwat
Cl C163.01−=ρρ (3)
0.08
0.10
0.12
0.14
0.16
0.18
0.20
0.22
0 50 100 150 200 250 300 350Time (days)
Gra
dien
t (a
bsol
ute
valu
e)w/c 0.45
w/c 0.50
w/c 0.55
0.4
0.5
0.6
0.7
0.8
0.9
1.0
0.0 0.5 1.0 1.5 2.0
Chloride content (% by cement wt.)
Res
istiv
ity r
atio
(vs
. co
ncre
te w
ith C
l- 0%
)
Figure 11. Chloride concentration vs. resistivity of the concrete.
Based on the Figure 11, the average electrical resistivity of concrete contaminated with thesame chloride concentration was calculated. Figure 12 shows the correlation between the chlorideconcentration and ratio of the average electrical resistivity of concrete with chloride concentration.The variation with the w/c ratio was not monitored. It is obvious that the chloride concentration leads

Appl. Sci. 2020, 10, 6272 11 of 16
to reduced resistivity of the concrete. The determinant coefficient was 0.97, which is meaningful indetermining the variation in electrical resistivity of concrete with chloride ion content, as follows:
ρCl
ρwat= 1− 0.163 CCl (3)
where ρCl is the electrical resistivity of the concrete with chloride ions; ρwat is the electrical resistivity ofthe concrete without chloride ions, CCl is the chloride ion in the concrete (by weight of the cement).
Appl. Sci. 2020, 10, x FOR PEER REVIEW 12 of 17
where Clρ is the electrical resistivity of the concrete with chloride ions; watρ is the electrical resistivity of the concrete without chloride ions, ClC is the chloride ion in the concrete (by weight of the cement).
Figure 12. Effect of chloride concentration on the resistivity of concrete.
Figure 13 represents the result of measuring the carbonation depth of concrete mixed with chloride ions. The higher the chloride ion, the higher the carbonation depth. This trend was more evident for concrete with a high w/c ratio.
Figure 14 shows the average value of the electrical resistivity of the carbonated concrete mixed with chloride ions and a clear experimental trend was not observed. Although concrete without chloride ions should show a higher electrical resistivity than concrete with chloride ions at the beginning, the opposite trend was noticed as time elapsed. Electrical conductivity is decreased by carbonation, revealing the complex nature of the microstructure change [28], while the chloride-binding capacity is decreased due to consumption of the chloride adsorbent, C-S-H phase, and Friedel’s salt [29]. These two have mutually contradictory effects on the electrical resistivity of carbonated concrete. At the early stage, the effect of carbonation on resistivity is not significant, thus the electrical resistivity decreases because of only the influence of the chloride ions on the electrical conductivity. However, it showed a somewhat opposite trend as time elapsed. This means that electrical resistivity should be influenced by carbonation with elapsed time because of the reduction in porosity [30]. In particular, because the bound chlorides can be converted into water-soluble chloride ions due to carbonation [31], electrical resistivity should be further lowered. Nevertheless, the opposite result was examined. It is believed, therefore, that the reduction in porosity due to carbonation has a greater effect on the electrical resistivity than the increase in conductivity due to chloride ions.
0.4
0.5
0.6
0.7
0.8
0.9
1.0
0.0 0.5 1.0 1.5 2.0
Chloride content (% by cement wt.)
Res
istiv
ity r
atio
(vs
. co
ncre
te w
ith C
l- 0%
)
w/c 0.45
w/c 0.50
w/c 0.55
Figure 12. Effect of chloride concentration on the resistivity of concrete.
Figure 13 represents the result of measuring the carbonation depth of concrete mixed with chlorideions. The higher the chloride ion, the higher the carbonation depth. This trend was more evident forconcrete with a high w/c ratio.
Figure 14 shows the average value of the electrical resistivity of the carbonated concrete mixed withchloride ions and a clear experimental trend was not observed. Although concrete without chlorideions should show a higher electrical resistivity than concrete with chloride ions at the beginning,the opposite trend was noticed as time elapsed. Electrical conductivity is decreased by carbonation,revealing the complex nature of the microstructure change [28], while the chloride-binding capacity isdecreased due to consumption of the chloride adsorbent, C-S-H phase, and Friedel’s salt [29]. Thesetwo have mutually contradictory effects on the electrical resistivity of carbonated concrete. At theearly stage, the effect of carbonation on resistivity is not significant, thus the electrical resistivitydecreases because of only the influence of the chloride ions on the electrical conductivity. However, itshowed a somewhat opposite trend as time elapsed. This means that electrical resistivity should beinfluenced by carbonation with elapsed time because of the reduction in porosity [30]. In particular,because the bound chlorides can be converted into water-soluble chloride ions due to carbonation [31],electrical resistivity should be further lowered. Nevertheless, the opposite result was examined. It isbelieved, therefore, that the reduction in porosity due to carbonation has a greater effect on the electricalresistivity than the increase in conductivity due to chloride ions.

Appl. Sci. 2020, 10, 6272 12 of 16Appl. Sci. 2020, 10, x FOR PEER REVIEW 13 of 17
(a) w/c 0.45
(b) w/c 0.50
(c) w/c 0.55
Figure 13. Carbonation depth of the concrete with various chloride concentrations.
0
2
4
6
8
10
12
14
16
18
20
0 100 200 300Time (days)
Car
bona
tion
dept
h (m
m)
.
0 % 1.0 %2.0 %
0
2
4
6
8
10
12
14
16
18
20
0 100 200 300Time (days)
Car
bona
tion
dept
h (m
m)
.
0%1.0 %2.0 %
0
2
4
6
8
10
12
14
16
18
20
0 100 200 300Time (days)
Car
bona
tion
dept
h (m
m)
.
0%1.0 %2.0 %
Figure 13. Carbonation depth of the concrete with various chloride concentrations.

Appl. Sci. 2020, 10, 6272 13 of 16Appl. Sci. 2020, 10, x FOR PEER REVIEW 14 of 17
(a) w/c 0.45
(b) w/c 0.50
(c) w/c 0.55
Figure 14. Electrical resistivity of the carbonated concrete pre-mixed with chloride.
0
5
10
15
20
25
30
35
0 100 200 300Time (days)
Elec
tric
al r
esis
tivity
(KΩ
·cm
) .
0%1.0 %2.0 %
0
5
10
15
20
25
30
35
0 100 200 300Time (days)
Elec
tric
al r
esis
tivity
(KΩ
·cm
) .
0%1.0 %2.0 %
0
5
10
15
20
25
30
35
0 100 200 300 400Time (days)
Elec
tric
al r
esis
tivity
(KΩ
·cm
) .
0%1.0 %2.0 %
Figure 14. Electrical resistivity of the carbonated concrete pre-mixed with chloride.
Appl. Sci. 2020, 10, 6272 14 of 16
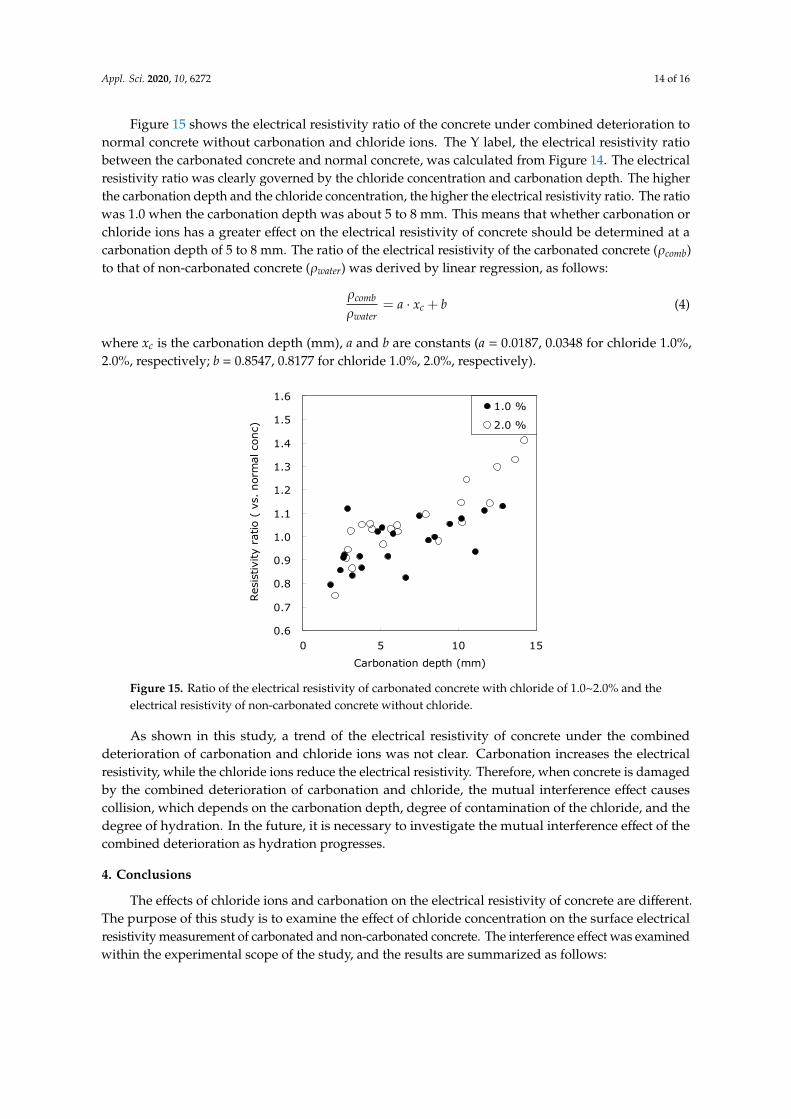
Figure 15 shows the electrical resistivity ratio of the concrete under combined deterioration tonormal concrete without carbonation and chloride ions. The Y label, the electrical resistivity ratiobetween the carbonated concrete and normal concrete, was calculated from Figure 14. The electricalresistivity ratio was clearly governed by the chloride concentration and carbonation depth. The higherthe carbonation depth and the chloride concentration, the higher the electrical resistivity ratio. The ratiowas 1.0 when the carbonation depth was about 5 to 8 mm. This means that whether carbonation orchloride ions has a greater effect on the electrical resistivity of concrete should be determined at acarbonation depth of 5 to 8 mm. The ratio of the electrical resistivity of the carbonated concrete (ρcomb)to that of non-carbonated concrete (ρwater) was derived by linear regression, as follows:
ρcomb
ρwater= a · xc + b (4)
where xc is the carbonation depth (mm), a and b are constants (a = 0.0187, 0.0348 for chloride 1.0%,2.0%, respectively; b = 0.8547, 0.8177 for chloride 1.0%, 2.0%, respectively).
Appl. Sci. 2020, 10, x FOR PEER REVIEW 15 of 17
Figure 15 shows the electrical resistivity ratio of the concrete under combined deterioration to normal concrete without carbonation and chloride ions. The Y label, the electrical resistivity ratio between the carbonated concrete and normal concrete, was calculated from Figure 14. The electrical resistivity ratio was clearly governed by the chloride concentration and carbonation depth. The higher the carbonation depth and the chloride concentration, the higher the electrical resistivity ratio. The ratio was 1.0 when the carbonation depth was about 5 to 8 mm. This means that whether carbonation or chloride ions has a greater effect on the electrical resistivity of concrete should be determined at a carbonation depth of 5 to 8 mm. The ratio of the electrical resistivity of the carbonated concrete (ρcomb) to that of non-carbonated concrete (ρwater) was derived by linear regression, as follows: = ∙ + (4)
where xc is the carbonation depth (mm), a and b are constants (a = 0.0187, 0.0348 for chloride 1.0%, 2.0%, respectively; b = 0.8547, 0.8177 for chloride 1.0%, 2.0%, respectively).
Figure 15. Ratio of the electrical resistivity of carbonated concrete with chloride of 1.0~2.0% and the electrical resistivity of non-carbonated concrete without chloride.
As shown in this study, a trend of the electrical resistivity of concrete under the combined deterioration of carbonation and chloride ions was not clear. Carbonation increases the electrical resistivity, while the chloride ions reduce the electrical resistivity. Therefore, when concrete is damaged by the combined deterioration of carbonation and chloride, the mutual interference effect causes collision, which depends on the carbonation depth, degree of contamination of the chloride, and the degree of hydration. In the future, it is necessary to investigate the mutual interference effect of the combined deterioration as hydration progresses.
4. Conclusions
The effects of chloride ions and carbonation on the electrical resistivity of concrete are different. The purpose of this study is to examine the effect of chloride concentration on the surface electrical resistivity measurement of carbonated and non-carbonated concrete. The interference effect was examined within the experimental scope of the study, and the results are summarized as follows:
(1) Chloride concentration leads to reduced resistivity of the concrete. The electrical resistivity of the concrete kept rising over time and all concrete showed the value 12 KΩ∙cm or more, except the specimen with 2.0% chloride ions and a w/c ratio of 0.55. As a result of viewing the electrical resistivity
0.6
0.7
0.8
0.9
1.0
1.1
1.2
1.3
1.4
1.5
1.6
0 5 10 15
Carbonation depth (mm)
Res
istiv
ity r
atio
( v
s. n
orm
al c
onc)
1.0 %
2.0 %
Figure 15. Ratio of the electrical resistivity of carbonated concrete with chloride of 1.0~2.0% and theelectrical resistivity of non-carbonated concrete without chloride.
As shown in this study, a trend of the electrical resistivity of concrete under the combineddeterioration of carbonation and chloride ions was not clear. Carbonation increases the electricalresistivity, while the chloride ions reduce the electrical resistivity. Therefore, when concrete is damagedby the combined deterioration of carbonation and chloride, the mutual interference effect causescollision, which depends on the carbonation depth, degree of contamination of the chloride, and thedegree of hydration. In the future, it is necessary to investigate the mutual interference effect of thecombined deterioration as hydration progresses.
4. Conclusions
The effects of chloride ions and carbonation on the electrical resistivity of concrete are different.The purpose of this study is to examine the effect of chloride concentration on the surface electricalresistivity measurement of carbonated and non-carbonated concrete. The interference effect was examinedwithin the experimental scope of the study, and the results are summarized as follows:
Appl. Sci. 2020, 10, 6272 15 of 16
(1) Chloride concentration leads to reduced resistivity of the concrete. The electrical resistivity of theconcrete kept rising over time and all concrete showed the value 12 KΩ·cm or more, except thespecimen with 2.0% chloride ions and a w/c ratio of 0.55. As a result of viewing the electricalresistivity rate, the value of the specimen with 2% chloride ions was 65~71% of the specimenwithout chloride ions.
(2) For the correlation between chloride ion content and electrical resistivity in the specimenwithout chloride ions, the correlation between chloride concentration and electrical resistivityexceeded the determination coefficient of 0.70, indicating the obvious effect of chloride ions onelectrical resistivity.
(3) The rate of change in the electrical resistivity of concrete with chloride was low in the early ages.However, the electrical resistivity showed a more stable trend with no change in the long-termage. These influences are generated by the adsorption of chloride ions and the micro-structuredevelopment of concrete due to on-going hydration of the cement. The micro-structure of thehardened cement paste has a greater influence on the electrical resistivity than chloride adsorption.
(4) The ratio of the electrical resistivity of concrete with chloride to that of concrete without chloridesdecreased as the chloride concentration increased. The electrical resistivity of the concrete wassignificantly influenced by chloride concentration, even when the concentration was low.
(5) The electrical resistivity of concrete under combined deterioration tended to increase in proportion tothe chloride concentration and carbonation depth. In the environment of a combined deterioration,the carbonation depth of 5 to 8 mm was a meaningful criterion for determining whether carbonationor chloride ions has a large effect on the electrical resistivity of concrete.
Author Contributions: I.-S.Y. conceived and designed the experiments; I.-S.Y. performed the experiments; I.-S.Y.and C.-H.C. analyzed the data; I.-S.Y. and C.-H.C. wrote the paper. All authors have read and agreed to thepublished version of the manuscript.
Funding: This research was supported by the Korea Basic Science Institute (National Research Facilities andEquipment Center) grant funded by the Korean Ministry of Education (grant No.2020R1A6C1020263).
Conflicts of Interest: The authors declare no conflict of interest.
References
1. AASHTO. AASHTO Designation TP 95, Standard Method of Test for Surface Resistivity of Concrete’s Ability to ResistChloride Ion Penetration; American Association of State Highway and Transportation Officials: Washington,DC, USA, 2011.
2. Ghosh, P.; Tran, Q. Correlation Between Bulk and Surface Resistivity of Concrete. Int. J. Concr. Struct. Mater.2015, 9, 119–132. [CrossRef]
3. Tuutti, K. Corrosion of Steel in Concrete; Swedish Cement and Concrete Research Institute (CBI): Stockholm,Sweden, 1982.
4. Buenfeld, N.R.; Newman, J.B.; Page, C.L. The Resistivity of Mortar Immersed in Sea Water. Cem. Concr. Res.1986, 16, 511–524. [CrossRef]
5. Hope, B.B.; Ip, A.K.; Manning, D.G. Corrosion and Electrical Impedance in Concrete. Cem. Concr. Res. 1985,15, 525–534. [CrossRef]
6. Simon, G.; Tamas, K.; Vass, V. The Electrical Resistivity of Concrete, Concrete Structures. In Corrosion of Steelin Concrete; Tuutti, K., Ed.; Swedish Cement and Concrete Research Institute (CBI): Stockholm, Sweden, 2012;pp. 61–65.
7. Gjørv, O.E. Durability Design of Concrete Structures in Severe Environments; Taylor & Francis: New York, NY,USA, 2009.
8. Altobat, S.; Maalej, M.; Shaikh, F.U.A. Laboratory Simulation of Corrosion Damage in Reinforced Concrete.Int. J. Concr. Struct. Mater. 2016, 17, 1–9. [CrossRef]
9. Liu, Y.; Suarez, A.; Presuel-Moreno, F.J. Final Report: Characterization of New and Old Concrete Structures UsingSurface Resistivity Measurements; Florida Department of Transportation Research Center: Brooksville, FL,USA, 2010.

Appl. Sci. 2020, 10, 6272 16 of 16
10. Goni, S.; Andrade, C. Synthetic Concrete Pore Solution Chemistry and Rebar Corrosion Rate in the Presenceof Chlorides. Cem. Concr. Res. 1990, 20, 525–539. [CrossRef]
11. Millard, S.G. Reinforced Concrete Resistivity Measurement Techniques. Proc. Civ. Eng. 1991, 91, 71–78.[CrossRef]
12. Millard, S.G.; Gowers, K.R. Resistivity Assessment of In-Situ Concrete: The Influence of Conductivity andResistivity Layers. Proc. Civ. Eng. Struct. Build. 1992, 94, 389–395. [CrossRef]
13. Atkins, P.W.; De Paula, J. Physical Chemistry, 8th ed.; Oxford University Press: Oxford, UK, 2006.14. Saleem, M.; Shameem, M.; Hussain, S.E.; Maslehuddin, M. Effect of Moisture, Chloride, and Sulphate
Contamination on the Electrical Resistivity of Portland Cement Concrete. Constr. Build. Mater. 1996, 16,209–214. [CrossRef]
15. Shaikhon, O. The Effect of Chloride and Sulfate Ions on the Resistivity of Concrete; McGill University: Montréal,QC, Canada, 2015.
16. Bertolini, L.; Polder, R.B. Concrete Resistivity and Reinforcement Corrosion Rate as Function of Temperatureand Humidity of the Environment. In TNO Report 97-BT-R0574; TNO: The Hague, The Netherlands, 1997.
17. Bürchler, D.; Elsener, B.; Böhni, H. Electrical Resistivity and Dielectric Properties of Hardened Cement and Mortar;Institute of Materials Chemistry and Corrosion; Swiss Federal Institute of Technology; ETH Hönggerber:Zurich, Switzerland, 1996.
18. AASHTO. AASHTO T 358-17, Standard Method of Test for Surface Resistivity Indication of Concrete’s Abilityto Resist Chloride Ion Penetration; American Association of State Highway and Transportation Officials:Washington, DC, USA, 2017.
19. Thomas, R.J. Properties and Performance of Alkali-Activated Concrete. Ph.D. Thesis, Department of CivilEngineering, Clarkson University, Potsdam, NY, USA, 2016.
20. American Society of Testing and Materials. ASTM C1202-12, Standard Test Method for Electrical Indication ofConcrete’s Ability to Resist Chloride Ion Penetration; American Society of Testing and Materials: West Conshohocken,PA, USA, 2012.
21. JCI. Report: Committee on Investigation and Maintenance of Combined Deterioration of Concrete; JCI: St. Louis,MO, USA, 2001. (In Japanese)
22. American Society of Testing and Materials. ASTM C1760-12, Standard Test Method for Bulk Electrical Conductivityof Hardened Concrete; American Society of Testing and Materials: West Conshohocken, PA, USA, 2012.
23. Yoon, I.S. Influence of Micro-Structural Characteristics of Concrete on Electrical Resistivity. J. Korea Inst.Struct. Maint. Insp. 2013, 17, 122–129.
24. Van Breugel, K. Simulation of Hydration and Formation of Structures in Hardening Cement-Based Materials.Ph.D. Thesis, Delft University of Technology, Delft, The Netherlands, 1991.
25. Broomfield, J.P. Steel Corrosion in Concrete; E & FN Spon: London, UK, 1997.26. Yoon, I.S.; Saeki, T. Mechanism of Chloride Ion Adsorption in Cement Hydrates as Per the Time-Dependent
Behavior. ACI Mater. J. 2020, accepted.27. Dehwah, H.A.F.; Austin, S.A.; Maslehuddin, M. Effect of Cement Alkalinity on Pore Solution Chemistry and
Chloride Induced Reinforcement Corrosion. ACI Mater. J. 2002, 99, 227–233.28. Das, B.B.; Singh, D.N.; Pandey, S.P. Rapid Chloride Ion Permeability of OPC and PPC based carbonated
concrete. J. Mater. Civ. Eng. 2012, 24, 606–611. [CrossRef]29. Saillio, M.; Baroghel-Bouny, V.; Barberon, F. Chloride Binding in Sound and Carbonated Cementitious
Materials. Constr. Build. Mater. 2014, 68, 82–91. [CrossRef]30. Papadakis, V.G.; Vayenas, C.G.; Fardis, M.N. Fundamental Modeling and Experimental Investigation of
Concrete Carbonation. ACI Mater. J. 1991, 88, 363–373.31. Saeki, T.; Ueki, S.; Shima, T. A Model for Predicting the Deterioration of Concrete Due to the Compound
Influence of Salt Damage and Carbonation. Proc. JSCE 2002, 54, 269–282.
© 2020 by the authors. Licensee MDPI, Basel, Switzerland. This article is an open accessarticle distributed under the terms and conditions of the Creative Commons Attribution(CC BY) license (http://creativecommons.org/licenses/by/4.0/).