effect of financial performance on capital structure …
TRANSCRIPT

EFFECT OF FINANCIAL PERFORMANCE ON
CAPITAL STRUCTURE OF NON-FINANCIAL FIRMS
IN THE NIGERIAN STOCK EXCHANGE
OLANREWAJU ISOLA FATOKI
DOCTOR OF PHILOSOPHY
(Finance)
JOMO KENYATTA UNIVERSITY OF
AGRICULTURE AND TECHNOLOGY
2018

Effect of Financial Performance on Capital Structure of Non-
Financial Firms in the Nigerian Stock Exchange
Olanrewaju Isola Fatoki
A thesis submitted in partial fulfilment for the degree of Doctor of
Philosophy in Finance in the Jomo Kenyatta University of
Agriculture and Technology
2018

iii
DECLARATION
This thesis is my original work and has not been presented for a degree in any other
University.
Signature ......................................... Date.........................................
Olanrewaju Isola Fatoki
This thesis has been submitted for examination with our approval as University
Supervisors.
Signature........................................ Date........................................
Dr. Tobias Olweny PhD.
JKUAT, Kenya
Signature............................................. Date..........................................
Dr. Tabitha Nasieku PhD.
JKUAT, Kenya

iv
DEDICATION
To the entire
ADAGBAJA LORI IFA FAMILY

v
ACKNOWNLEDGEMENT
My sincere appreciation goes to my supervisors: Dr Tobias Olweny and Dr Tabitha
Nasieku for their valuable contributions, guidance and constructive criticisms towards
this work. I acknowledge all my lecturers who impacted knowledge to me during the
course and the management of Jomo Kenyatta University of Technology and
Agriculture for the opportunity given to actualise my dream.

vi
TABLE OF CONTENTS
DECLARATION ....................................................................................................... iii
DEDICATION ........................................................................................................... iv
ACKNOWNLEDGEMENT ..................................................................................... iv
TABLE OF CONTENTS .......................................................................................... vi
LIST OF TABLES .................................................................................................... xi
LIST OF FIGURES ................................................................................................. xii
LIST OF APPENDICES ........................................................................................ xiii
ABBREVIATIONS ................................................................................................. xiv
DEFINITIONS OF KEY TERMS .......................................................................... xv
ABSTRACT ............................................................................................................. xvi
CHAPTER ONE ........................................................................................................ 1
INTRODUCTION ...................................................................................................... 1
1.1 Background to the Study ............................................................................... 1
1.2 Statement of the Problem .............................................................................. 7
1.3 General Objectives of the study .................................................................... 8
1.3.1 Specific objectives ................................................................................. 8
1.4 Research Hypotheses ..................................................................................... 9
1.5 Significance of the study ............................................................................. 10
1.6 Scope of the study ....................................................................................... 10

vii
1.7 Limitations of the Study .............................................................................. 11
CHAPTER TWO ..................................................................................................... 12
LITERATURE REVIEW ........................................................................................ 12
2.1 Introduction ................................................................................................. 12
2.2 Theoretical Review ...................................................................................... 12
2.2.1 Trade-off Theory .................................................................................. 13
2.2.2 Pecking order theory ........................................................................... 16
2.2.3 Theories of Reverse Causality ............................................................. 20
2.3 Conceptual Framework ............................................................................... 22
2.4 Empirical Review ........................................................................................ 23
2.4.1 Earnings per Share and Capital Structure ............................................ 23
2.4.2 Market to Book Value and Capital Structure ....................................... 25
2.4.3 Return on Assets (ROA) and Capital Structure ................................... 28
2.4.4 Return on Capital Employed (ROCE) and Capital Structure .............. 30
2.4.5 Firm Size .............................................................................................. 32
2.5 Critique of existing literature relevant to the study ..................................... 36
2.6 Research gap ................................................................................................ 36
2.7 Chapter summary ........................................................................................ 37
CHAPTER THREE ................................................................................................. 38
RESEARCH METHODOLOGY ........................................................................... 38
3.1 Introduction ................................................................................................. 38
3.2 Research Philosophy ................................................................................... 38
viii
3.3 Research Design .......................................................................................... 39
3.4 Population .................................................................................................... 39
3.5 Sampling frame ........................................................................................... 40
3.6 Sample and Sampling Technique ................................................................ 40
3.7 Instruments of Data Collection .................................................................... 42
3.8 Data Collection Procedure ........................................................................... 42
3.9 Data Processing and Analysis ..................................................................... 43
3.9.1 Measurement of Study Variables ......................................................... 44
3.8.2 Model Specification ............................................................................. 47
3.9.2.1 Specification tests for the Panel Model ........................................ 50
CHAPTER FOUR .................................................................................................... 51
RESULTS AND DISCUSSION .............................................................................. 51
4.1 Introduction ................................................................................................. 51
4.2 Descriptive Analysis .................................................................................... 51
4.2.1 Trend Analysis of the Mean Distributions of Variables ...................... 54
4.2.1.1 Mean Distribution of Total Debt Ratio ......................................... 54
4.2.1.2 Mean Distribution of Debt to Equity Ratio .................................. 55
4.2.1.3 Mean Distribution of Long-term Debt Ratio ................................ 57
4.2.1.4 Mean Distribution of Earnings Per Share ..................................... 57
4.2.1.5 Mean Distribution of Market to Book Value ................................ 58
4.2.1.6 Distribution of Return on Assets .................................................. 59
4.2.1.7 Mean Distribution of Return on Capital Employed ...................... 60
4.2.1.8 Mean Distribution of Firm Size .................................................... 61
4.2.2 Analysis of Normal Distribution .......................................................... 62
4.2.3 Correlation............................................................................................ 63

ix
4.3 Panel Specification test ............................................................................... 66
4.3.1 Visual Plot ............................................................................................ 66
4.3.2 Stationary Test ..................................................................................... 71
4.3.3 Granger Causality Test ......................................................................... 73
4.3.4 Multicollinearity Test ........................................................................... 77
4.3.5 Serial Correlation Test ......................................................................... 78
4.3.6 Panel Cointegration test ....................................................................... 79
4.3.7 Heteroscedasticity test .......................................................................... 81
4.3.6 Hausman test of the fixed and Random effect ........................................... 82
4.4 Panel Regression Analysis .......................................................................... 83
4.4.1 Effect of Earnings Per Share on Capital Structure ............................... 84
4.4.2 Effect of Market to Book Value of Equity on Capital Structure ......... 88
4.4.3 Effect of Return on Assets on Capital Structure .................................. 91
4.4.4 Effect of Return on Capital Employed on Capital Structure................ 95
4.4.5 Moderating effect of firm Size on the relationship between Financial
Performance and Capital Structure ..................................................................... 98
4.4.6 Result of the Reverse Causality Hypothesis ............................................ 102
CHAPTER FIVE .................................................................................................... 107
SUMMARY, CONCLUSION AND RECOMMENDATIONS .......................... 107
5.1 Introduction ............................................................................................... 107
5.2 Summary ................................................................................................... 107
5.2.1 Effect of Earnings Per Share on Capital structure ................................... 109
5.2.2 Effect of Market to Book value of Equity on Capital structure ......... 109
5.2.3 Effect of Return on Assets on Capital Structure ................................ 110

x
5.2.4 Effect of Return on Capital Employed on Capital Structure.............. 110
5.2.5 Moderating effect of Size on Capital Structure.................................. 111
5.3 Conclusions ............................................................................................... 111
5.4 Recommendations ..................................................................................... 112
5.5 Suggestions for Further Research .............................................................. 113
REFERENCES ....................................................................................................... 115
APPENDICES ........................................................................................................ 139

xi
LIST OF TABLES
Table 3.1: Sectoral classification of listed companies in the NSE ............................ 40
Table 3.2: Sectoral classification of sampled non-financial companies in the NSE . 41
Table 3.3: Variables and Measurement ..................................................................... 47
Table 4.1: Panel Variables Summary Statistics ........................................................ 52
Table 4.2: Mean Summary of the Variables from 1999-2015 .................................. 54
Table 4.3: Correlation Matrix.................................................................................... 64
Table 4.4: Panel Unit root test ................................................................................... 72
Table 4.5: Granger causality test between financial performance variables and
Capital structure (Total Debt) .................................................................. 74
Table 4.6: Granger causality test between financial performance variables and
Capital structure (Debt to Equity Ratio) .................................................. 75
Table 4.7: Granger causality test between financial performance variables and
Capital structure (Long-term Debt) .......................................................... 76
Table 4.8: Multicollinearity test result ...................................................................... 78
Table 4.9: Breusch-Godfrey Serial Correlation LM Test ......................................... 79
Table 4.10: Johansen Fisher Panel Cointegration Test result ................................... 80
Table 4.11: Breusch-Pagan-Godfrey Heteroscedasticity Test Result ....................... 82
Table 4.12: Hausman test result ................................................................................ 83
Table 4.13: Two-step dynamic GMM estimated results of effect of Earnings Per
Share (performance) on Capital Structure.............................................. 85
Table 4.14: Two- step dynamic GMM estimated results of Market to Book Value of
Equity (performance) on Capital Structure ............................................ 88
Table 4.15: Two-step dynamic GMM estimated results of effect of return on asset
(performance) on Capital Structure ........................................................ 92
Table 4.16: Two-step dynamic GMM estimated results of effect of return on capital
employed (performance) on Capital Structure ....................................... 95
Table 4.17: The two-step dynamic GMM estimated results of moderating effect of
size on the performance variables on Capital Structure ........................ 99
Table 4.18: Findings on the Reverse Causality Hypothesis .................................... 103
Table 4.19: List of the hypotheses accepted or rejected based on significance of
results ................................................................................................... 105

xii
LIST OF FIGURES
Figure 2.1: Conceptual framework ........................................................................... 22
Figure 4.1: Mean distribution of Total Debt to Total Asset Ratio (TDR) ................ 55
Figure 4.2: Mean distribution of Total Debt to Total Equity Ratio (DER) .............. 56
Figure 4.3: Mean distribution of Long-term Debt to Total Asset (LTD) ................. 57
Figure 4.4: Mean distribution of Earnings Per Shares (EPS) ................................... 58
Figure 4.5: Mean distribution of Market to Book Value of Equity .......................... 59
Figure 4.6: Mean distribution of Return on Asset (ROA) ........................................ 60
Figure 4.7: Mean distribution of Return on Capital Employed ................................ 61
Figure 4.8: Mean distribution of Size ....................................................................... 62
Figure 4.9: Plot for TDR stacked by cross sections ................................................. 67
Figure 4.10: Plot for DER stacked by cross sections ............................................... 67
Figure 4.11: Plot for LTD stacked by cross sections ............................................... 68
Figure 4.12: Plot for EPS stacked by cross sections ................................................ 68
Figure 4.13: Plot for MBV stacked by cross sections .............................................. 69
Figure 4.14: Plot for ROA stacked by cross sections .............................................. 69
Figure 4.15: Plot for ROCE stacked by cross sections ............................................ 70
Figure 4.16: Plot for SIZE stacked by cross sections .............................................. 70

xiii
LIST OF APPENDICES
Appendix A: Study Population ............................................................................... 139
Appendix B: Secondary Data Collection Template ................................................ 144

xiv
ABBREVIATIONS
ADF Augmented Dickey and Fullar
ASEAN Association of Southeast Asian Nations
ATS Automatic Trading System
AR1 First Order Auto Regression
AR2 Second Order Auto Regression
CS Capital Structure
DEA Data Envelopment Analysis
DER Debt to Equity Ratio
EBIT Earnings Before Interest and Tax
EPS Earnings per Share
FEM Fixed effect Model
FGN Federal Government of Nigeria
GMM General Moment Method
LTD Long Term Debt
MBV Market to Book Value of Equity
NSE Nigerian Stock Exchange
OLS Ordinary Least Squares
REM Random effect Model
ROA Return on Assets
ROCE Return on Capital Employed
SAP Structural Adjustment Programme
STD Short term Debt
TDR Total Debt Ratio
VIF Variance Inflation Factor

xv
DEFINITIONS OF KEY TERMS
Capital Structure: Capital structure refers to the sources of financing, particularly
the proportions of debt (leverage/gearing) and equity that a business firm
employs to fund its assets, operations and future growth (Jensen & Meckling,
1979).
Earnings per Share: this is earnings that the company has achieved in a fiscal period
for an ordinary share and often is used to evaluate the profitability and risk
associated with earning and judgments about stock prices. (Goya, 2013;
Savathaasan & Rathika, 2013)
Financial Performance: Financial Performance is used to measure firm's overall
financial health over a given period of time and can also be used to compare
similar firms across the same industry or to compare industries or sectors in
aggregation (Cho & Pucik, 2005; Venkatraman & Ramanujam, 1986).
Firm Size: Firm size has been defined as the amount and variety of production
capacity and ability a firm possesses or the amount and variety of services a
firm can provide concurrently to the customers (Mule, Mukras, & Nzioka,
2015).
Market to Book Value of Equity: market to book value ratio is a valuation ratio that
is used by investment advisors, fund managers and investors to compare a
company’s market value to its book value. (Marangu and Jagongo 2014).
Return on Assets: return on assets measures the overall effectiveness of management
in generating profits with its available assets. The higher the firm’s ROA the
better (Ibrahim & AbdulSamad, 2011).
Return on Capital Employed: A measurement of financial performance of a
company's operating division that is not responsible for its financing and
income taxes (McClure, 2017).
Total debt ratio: The total debt ratio is a financial ratio which is expressed as
percentage of a company’s assets that are provided in comparison to debt. It is
calculated by dividing total debt to total assets (Nasimi, 2016).

xvi
ABSTRACT
The main objective of this thesis was to examine the effect of financial performance
on capital structure of non-financial firms on the Nigerian Stock Exchange (NSE). This
was guided by assessing the effect of earnings per share, market to book value of
equity, return on assets and return on capital employed on capital structure choice
while size was included as the moderating variable. The causal research design was
adopted. Panel data involving the 186 listed companies on the NSE as at December
2015 for a period of 16 years (1999 to 2015) was extracted from the annual reports and
financial statements of the firms, Central Bank of Nigeria statistical bulletins, NSE
fact books and bulletins. Due to the nature of business of some organisations and
incomplete data a total of 87 samples were included in the study. Both descriptive
which involve tables, graphs, virtual plots and inferential statistics with the application
of the general method of moments (GMM) were used to interpret and estimate the
capital structure regression equation. The effects of all the explanatory variables are
statistically significant at all levels of capital structure measure except for return on
capital employed (ROCE), total debt ratio (TDR) and debt to equity ratio (DER) whose
conclusions are statistically insignificant. Based on the significance of these results it
was concluded that both the efficiency risk and franchise value hypotheses of the
reverse causality hypothesis are observable in the capital structure choice of the non-
financial firms in the NSE. However, the dominance of the efficiency risk hypothesis
cannot be overlooked. In view of this, the study therefore recommend that managers
should strive more towards financial performance to be able explore more the best
option available in capital combination be able to achieve the wealth maximization
goal of the shareholders while those saddled with the responsibility of enabling a
conductive atmosphere for financing and investment in the country should not just sit
and create regulations but to see that it is effectively implemented so as to make an
upward impact on government revenue. It is further recommended that researchers in
the field of corporate finance and the entire academia in this area should strive to
explore the suggested reverse causality from capital structure and firms’ financial
performance.
1
CHAPTER ONE
INTRODUCTION
1.1 Background to the Study
Since the seminal work of Modigliani and Miller (1958, 1963) on the relevance and
irrelevance of capital structure, researchers in corporate financial theory have always
been interested in the causal effect of capital structure on financial performance and
value of the firm. The classical thinking from the theories propounded since then was
premised on causal relationship that capital structure choice determines or affect
performance thereby impact on the value of the firm (Kraus & Litzenberger, 1973;
Meckling & Jensen, 1976; Myer & Majluf,1984). As a departure from the classical
thinking Berger and Bonaccorsi di Patti (2002), suggested the possibility of a reverse
causal relationship as reflected in the reverse causality hypothesis. For an instant, debt
holders like any other investors always get attracted to profitable and financially sound
firms. The theory predicts performance as a factor in explaining the use of debt, which
indicates that productive and money-making firms will use more debt (Margaritis &
Psillaki, 2010). The reverse of this proposition is that efficient firms may use less debt
to minimize their exposure to financial risk (He & Matvos, 2012). That is, the more
profitable and liquid the firm is, the lower the leverage usage (Berger & Bonaccorsi di
Patti, 2006; Cheng & Tzeng, 2011; Margaritis & Psillak, 2007).
In the recent past, some authors have been investigating the nexus between financial
performance and capital structure. Fosu (2013), incorporated the reverse causation
between performance and capital structure in econometric modelling and to the best
of the author's knowledge, only a few studies stand out as they directly test this
theoretical relationship (Margaritis & Psillaki, 2010, 2007; Berger & Bonaccorsi di
Patti, 2006). Berger and Bonaccorsi di Patti (2006) tested the efficiency-risk and
franchise value hypotheses on the U.S banking industry. On the other hand, Margaritis
and Psillaki (2007, 2010) tested the same hypotheses on firms in New Zealand and
France respectively. Berger and Bonaccorsi di Patti found that, in the U.S banking

2
industry, none of these hypotheses dominated themselves, implying, efficiency
presents only an infinitesimal effect on leverage. This is consistent with findings from
New Zealand firms which also revealed that both the efficiency-risk and franchise
value hypotheses operate (Margaritis & Psillaki, 2007).
Financial performance can be described as the extent to which financial goal of a firm
is being or has been accomplished. It is the process of measuring the results of an
organisation’s policies and operations in monetary terms. It measures the overall
financial health of a firm over a given period of time. According to Chakravarthy
(1986) it is a way to satisfy investors and can be represented by profitability, growth
and market value (Cho & Pucik, 2005; Venkatraman & Ramanujam, 1986). These
three aspects complement each other. Profitability measures a firm’s past ability to
generate returns (Glick et al., 2005). Growth demonstrates a firm's past ability to
increase its size (Whetten, 1987). Increasing size, even at the same profitability level,
will increase its absolute profit and cash generation. The larger size also can bring
economies of scale and market power, leading to enhanced future profitability.
Market value represents the external assessment and expectation of firms' future
performance. Therefore, the outcome of a good financial performance by a firm does
not only affect the sources of financing, growth and survival, but also has a powerful
influence on the larger economy because of its utmost importance to both the
shareholders (in form of returns on their investment), managers of firms (in form of
compensation), creditors (firms' ability to repay) and government (tax purposes). A
dwindling financial performance may seriously affect access to both internal and
external financing as well as growth and survival of the firm. Subsequently a
reasonable level of financial performance is a critical decision area for any company
which is not only important because of the need to maximize returns to numerous
organizational constituencies, but also because of the impact such decisions may have
on a company's ability to deal with its competitive environment (Santos & Brito,
2012).
3
Capital structure refers to the sources of financing, particularly the proportions of debt
and equity that a business firm employs to fund its assets, operations and future growth
(Jensen & Meckling, 1979). It is the proportion of financial resources attributed to the
firm through different sources, which may include internal and external financers
(Abor, 2008). It includes, publicly issued securities, private placements trade debt,
bank debt, leasing contracts, pension liabilities, tax liabilities, unpaid compensation to
employees and management, performance guarantees, contingent liabilities and other
product warrantees (Mireku, Mensa & Ogoe, 2014). Corporate leverage decisions are,
as several theories suggest, thus among the paramount decisions made by firm
management. The connotation, capital structure, capitalization, financial structure,
leverage ratio and capital employed, are the same, that is, how much is invested and
the numerous sources at which the invested funds were gotten by a company to
establish, maintain its numerous activities and finance its assets.
Theoretically, the importance of financial performance derives from the fact that it is
strongly related to the ability of firms to fulfill the needs of various stakeholders while
the research on the relationship between financial performance and capital structure is
gathering momentum Berger & Bonaccorsi di Patti (2002, 2006); Margaritis and
Psillaki (2010), Otieno and Ngwenya (2015), Yinusa, Somoye, Alimi and Ilo (2016),
whereas, the relationship between capital structure and financial performance has been
a topical issue and one of the most interesting issues in the corporate finance literature
since late 1950s studies of Lintner (1956), Hirshleifer (1958) and Modigliani and
Miller (1958). However, Modigliani and Miller (1958, 1963) seminar work on the
irrelevance of capital structure on firm value and later supported by Miller (1977)
indeed spark off the debate on capital structure (Al-Taani, 2013; Ogebe, Ogebe &
Alewi, 2013). This has led to the emergence and development of new theories on the
issue of capital structure and firm performance. Additional capital structure theories,
such as the static trade-off theory and the pecking order theory have emerged over the
years.
According to Kraus and Litzenberger (1973), the static trade-off theories assume that
firm's trade-off the benefits and costs of debt and equity financing and find an optimal

4
capital structure after accounting for market imperfection such as taxes, bankruptcy
costs and agency costs. As elucidated by Jensen and Meckling (1976), the optimal
capital structure of organizations involves the trade-off between the bankruptcy costs
and agency costs, the effects of corporate and personal taxes, etc. This theory assumed
that capital structure moves towards an optimum leverage which is determined by
balancing the corporate tax savings merit of debt and the costs of financial distress.
This idea has been developed in many papers, including, DeAngelo and Masulis
(1980) and Bradley et al., (1984). However, it has been questioned by many others,
including Miller (1977), who argues that the Static Tradeoff model implies that firms
should be highly geared than they really are, as the tax savings of debt seem large
while the costs of financial distress seem minor.
In contrast, Myers and Majluf (1984) favour the pecking order theory, which suggests
that firms should follow a financing hierarchy to minimize information asymmetry
between parties. So, the pecking order theory predicts that firms prefer to finance
themselves internally before opting for debt or equity. It states that only when all
internal finances have been depleted, firms will opt for debt and as last resort will turn
to equity. Thus, firms that are profitable and therefore generate high cash flow are
expected to use less debt capital than those who do not generate high cash flow. This
theory, therefore, supports the fact that firms prefer debt rather than equity (Fama and
French, 2002; Karadeniz et. al, 2009; Rajan and Zingales, 1995; Wald, 1999).
Furthermore, the agency cost theory is premised on the idea that the interest of the
company's managers and its shareholders are not perfectly aligned. It explains the
relationship of principal, shareholders of the firm, with the agent, management of the
firm, in the decision-making process regarding the firm's capital structure. Jensen and
Meckling (1976) indicate that in the decisions about a firm's capital structure, the level
of leverage affects the agency conflicts between shareholders and managers. After five
decades of studies and research, economists have still not reached an agreement on
how and to what extent the capital structure of firms' impact their performance.
Interestingly, many studies have discovered that a firm's capital structure and its link
to performance, is highly dependent upon context-related issues, such as the company's

5
industry, strategy, growth or country (Berger & Bonaccorsi di Patti, 2006; Degryse,
Goeij, & Kappert, 2010; Lindblom, Sandahl, & Sjogren, 2011; O'Brien, 2003). Many
studies had also pointed out, in opposition to the Miller and Modigliani propositions,
that capital structure is an active choice or strategy undertaken by a company and that
the choice is dynamic, not fixed over time (O'Brien, 2003).
In addition, Berger and Bonaccorsi di Patti (2006) and Margaritis and Psillaki (2010)
consider two additional hypotheses (efficiency risk and franchise value) as reflected
in the reverse causality theory explaining how firm efficiency, influences the choice
of capital structure. The efficiency risk hypothesis predicts a positive relation between
efficiency and leverage, as more efficient firms choose lower equity ratios due to a
lower expected cost of bankruptcy and financial distress (Berger & Bonaccorsi di Patti,
2006; Yeh, 2010). In contrast, the franchise-value hypothesis predicts a negative effect
of efficiency on leverage. The rationale for that is that the economic rents coming from
higher efficiency are safer from the threat of liquidation if the debt-to-equity ratio is
lower (Demsetz, 1973; Berger & Bonaccorsi di Patti, 2006).
Decades after independence, the Nigerian financial system was repressed, as
evidenced by ceilings on interest rates and credit expansion, selective credit policies,
high reserve requirements, and restriction on entry into the banking industry (Ogujiuba
& Obiechina, 2011). This situation subdued the functioning of the financial system
and especially, constrained its ability to muster savings and facilitate productive
investment (Sylvanus & Abayomi, 2001). However, in 1986 the Federal Government
of Nigeria (FGN) embraced the Structural Adjustment Programme (SAP) with the aim
of rectifying the prevailing macroeconomic and structural imbalances in the economy,
to restructure and diversify the productive base, lessen the dominance of unproductive
investment and to achieve fiscal and balance of payment viability. As anticipated, the
capital market was a major aspect of the programme when it was introduced. The
programme which includes liberalization of the capital market is one of its
conditionalities led to various reforms especially between the late 1980s and early
1990s with the major reforms being the enthronement of market forces as the major
price determinants in the market rather than the Securities and Exchange Commission
6
which is the apex regulatory body in the market, the full or partial privatization and
commercialization of about 111 public owned enterprises which the NSE plays key
role in the offer for sale of their shares (Anyanwu, 1993; Oyefusi &Mogbolu, 2003)
and establishment of the Second-Tier Securities Market in 1986.
Abdul (2015) posited that in other to decide the debt-equity combination of financing,
the capital market is important and plays a prominent role because companies that seek
for long-term funding to finance their business activities will approach the capital
market. The relationship between capital structure decisions and the Nigerian capital
market lies on how often companies place offers on NSE and on the number of equities
listed and traded on NSE. The Nigerian corporate sector is characterized by many firms
operating in a largely diversified, competitive and deregulated environment. This is
because of financial liberalization that was brought about by the introduction of SAP.
SAP influenced many changes in the operating environment of firms and thus gives
more flexibility to firms in determining their capital structure and made the basis for
the determination to become more expanded and deepened both at the money and
capital markets.
Studies on the effect of Capital structure on financial performance is not a new
phenomenon to Nigeria corporate finance researcher, many researchers have tried to
deal with the signs of their relationship, the causal effect while others have examined
determinants and tested the existing theories (Abata & Migiro, 2016; Akintoye, 2008,
2009; Muritala, 2014; Oladeji, Ikpefan & Olokoyo, 2015; Onaolapo & Kajola, 2010).
Regardless of the context, their findings have been different, mix and inconclusive.
The existing literature attributed the cause to the differences in methodological
approach, choice of variables employed in analysis, duration of the study and the
choice of data applied. Another major defect is that virtually all these studies were
carried out using a unidirectional approach that only capital structure choice influences
the financial performance of a firm without any recourse to assessing the possibility of
a reverse causal relationship between performance and capital structure (Yinusa, et al.,
2016).

7
Nonetheless, the literature and empirical findings of the last decades have at least
demonstrated that capital structure has more importance than in the simple Modigliani
and Miller model and because of the inconsistency in the theories, methodologies and
inconclusive results that has pervaded the field it is of utmost importance to provide
additional empirical result that can help validate or disprove these theories and
findings.
1.2 Statement of the Problem
The corporate financing decision incorporates the capital structure decision a firm
makes on the choice of debt to equity mix use to finance its operation with the intention
to maximize the shareholder's return (Babalola, 2016). In Nigeria, the role of capital
structure in determining the value of the firm cannot be underestimated, however, the
deteriorating corporate liquidity, declining bank credit, outrageous increases in interest
rate has had an adverse effect on the capital structure of Nigerian firm listed on the
NSE in recent past. Many firms have collapsed due to various reasons among which
finance is most prominent while the emphases of the capital structure research have
always been on its effect on financial performance and value of the firm thus
establishing a unidirectional relationship approach.
There is an on-going debate in the capital structure literature about the effect of
financial performance on the capital structure which is theoretically based on the
reverse causality hypothesis (Berger & Bonaccorsi di Patti, 2002). Berger and
Bonaccorsi di Patti (2006) and Margaritis and Psillaki (2010) both study the effect of
leverage on firm efficiency while considering the reverse causality between efficiency
and the firm capital structure. The two studies differ in the empirical approach. Berger
and Bonaccorsi di Patti (2006) run a two-stage least squares regression, whereas
Margaritis and Psillaki (2010), estimate the two parts of the circular relation separately
by OLS and use lagged values of the endogenous regressors to achieve exogeneity.
Both studies find a positive relationship between leverage and efficiency. This
relationship was further evident in ASEAN countries (Rizal Adhari & Viverita, (2016),
Pakistan (Fazle, Tahir, Ahmad & Mohammed, 2016).
8
In Nigeria, capital structure and the impact on performance have been investigated for
many years, but researchers have found different results in different contexts
(Chandrasekharan, 2012; Modugu, 2013; Oke & Obalade, 2015; Onaolapo, Kajola &
Nwidobie, 2015). For instance, a recent study by Abata and Migiro (2016), found an
insignificantly negative correlation between financial leverage and ROA on one hand
and a significantly negative relationship between debt/equity mix and ROE on the
other hand. However, this study failed to consider the possibility of a reverse causal
relationship between capital structure and performance of Nigerian firms.
Therefore, all attempts of these previous studies are focused on a unidirectional
relationship except the study carried out by Yinusa, et al. (2016), which seeks to
establish a bidirectional relationship between capital structure and firm performance.
As a departure from proxy efficiency as the performance measure, their study
employed return on equity and found support for the franchise value hypothesis.
Invariably the study failed to consider other financial performance variables to
properly assess the reverse causality situation in Nigeria in the light of the two
underline hypotheses the efficiency risk hypothesis and franchise value hypothesis
thus, creating avenue for new research in different context for achieving a more
complete understanding of the effect of financial performance and capital structure
choice in Nigeria. Therefore, it is against this backdrop that this research work was
conducted to address the research gap to know if there is a possibility of a reverse
causality in financial performance and capital structure of the firms listed in NSE in
the face of the two competing hypotheses.
1.3 General Objectives of the Study
The general objective of this study is to ascertain the effect of financial performance
on capital structure of firms listed on the Nigeria Stock Exchange.
1.3.1 Specific Objectives
The specific objectives are:
9
1. To assess the effect of earnings per share on the capital structure of firms listed
in Nigeria Stock Exchange.
2. To investigate the effect of market to book value of equity on the capital
structure of firms listed in Nigeria Stock Exchange.
3. To examine the effect of return on Assets on the capital structure of firms
listed in Nigeria Stock Exchange.
4. To examine the effect of return on capital employed on the capital structure of
firms listed in Nigeria Stock Exchange
5. To ascertain the moderating effect of firm size on the relationship between
financial performance and capital structure of firms listed in Nigeria Stock
Exchange.
1.4 Research Hypotheses
To achieve the research objectives, the following hypotheses were tested.
H01: Earnings per Share has no significant effect on the Capital structure of firms
in NSE
H02. Market to Book value of equity has no significant effect on the Capital
structure of firms in NSE
H03. Return on Assets has no significant effect on the Capital structure of firms in
NSE
H04: Return on Capital Employed has no significant effect on the Capital structure
of firms in NSE
H05: Firm size has no significant moderating effect on the relationship between
Financial performance and capital structure of firms in NSE
10
1.5 Significance of the Study
To the academic field: The concepts of the capital structure may not have been new,
however, not much work has been carried out of the possibility of firm performance
dictating the choice of capital to be employed by managers especially in the Nigerian
context. The research will serve as an eye-opener to past, present and future
researchers whose scope is only limited to the unidirectional relationship between
capital structure and firm performance without any recourse to the possibility of a
reverse causality. It will further help in enlarging the scope in modelling financing
concepts beyond the common ordinary least squares (OLS) of Pooled OLS, the Fixed
Effect Model (FEM) and the Random Effect Model (REM)
To Managers: The findings from this study will further help management of various
organisations to be able to assess all possible options in their quest for an appropriate
capital composition of their organisations in relation to the objective of wealth
maximization. Precisely, it has further demonstrated the importance of generating
steady and sustainable financial performance as key objective that firms managements
should take serious in increasing the value of the firm thereby translating to the
maximization of the shareholders wealth as a guide to achieving the best combination
of different sources of finance.
To the Policy Makers: It could also benefit policy makers who are expected to
provide an enabling financial and legal environment for the successful running of
organizations in developing strategies to make the organisations survive more in the
face of other competing problems with this the government will be able to attract more
revenue through increase taxation due to increase in profit generation capacity of the
non-financial firms on the Nigerian Stock Exchange which will increase the tax base
of the government and further reduce over reliance on oil revenue in Nigeria.
1.6 Scope of the Study
With the advent of a stable democratic governance in Nigeria since 1999, the
developments witnessed in the NSE cannot be underestimated. The depths of activities

11
have expanded while the number of issues has increased over time. For instant, the
capitalization in the sector as at December 1987 was 8.2bn while it stood at 300bn in
1999. It then closes at 2112.5bn, 7030.8bn and 11.49tn in December 2004, 2009 and
2014 respectively (NSE Factsheet, 2015; CBN, 2016). Therefore, this analysis was
focused on the non-financial firms listed on the Nigerian stock exchange for a period
of sixteen (16) years from 1999-2015 out of the companies that have ever been listed
on the Nigerian Stock Exchange.
1.7 Limitations of the Study
Being one of the least research areas in the field of corporate finance the study was
plagued by a few challenges. Especially in the areas of related literature, there was the
dearth of literature on the effect of firms' financial performance and its resultant effect
on capital structure not only in Nigerian context but in most economies of the world.
In addition, some industries were left out in the analysis because of the nature of their
business source, and application of fund, some were excluded because of the
incompleteness of the required data during the period of study while others who were
not listed before 1999 were equally excused. Above all, conceptualizing this idea
which was an attempt to deviate from the usual research paradigm of capital structure
and firm performance posed some challenges which were overcome by extensive
search of literature while the limitation experienced in modelling was faced by
analyzing different techniques like the FEM and REM for which none was fitting due
to the possibility of being bias since the years involved in the analysis was small.
Eventually the researcher was able to identify the General Method of Moments
(GMM) which was used in the analysis.
12
CHAPTER TWO
LITERATURE REVIEW
2.1 Introduction
Investors and potential investors will be obliged to invest their hard-earned savings in
a company that promised to make a return that will change their wealth position at a
point in time. However, as sound as this objective is, it will be illusive if the hard-
earned resources are not combined for optimum utilization. The essence of capital
structure decision is to ensure the right combination of financing resources that will
yield maximum return without necessarily hampering the interest of stakeholders. This
chapter takes a review of relevant and related literature to the study. The main issues
discussed include the theoretical foundation of capital structure decision and firm
performance, the conceptual framework adopted for this study and the empirical
evidence as detected in literature.
2.2 Theoretical Review
The Modigliani and Miller (1958), in their known capital structure irrelevance theory,
claims that in an efficient market which has no tax, no transaction cost, no information
asymmetry, the value of a firm is unaffected by how that firm is financed. MM theory
predicts that there is no relationship between a firm’s capital structure and its
performance. The MM theory makes the core stone of the modern corporate finance.
After the original paper in 1958, Modigliani and Miller (1963) state that considering
the effect of corporate tax and tax deduction, the firm's value will increase when the
firm takes on more debt and this increasing amount will be the value of tax shield. This
means that firms will benefit from taking more leverage. However, the Modigliani-
Miller theorem will lose its explaining power when the market is not efficient. The
inefficient market concept is closer to reality, which has taken taxes, information
asymmetry, transaction costs, bankruptcy costs, agency conflicts and other "imperfect"
elements into considerations. Since then, the following literature is premised on the

13
various extensions of the Modigliani-Miller theory. Usually, one of the "imperfect"
elements mentioned above is chosen, and the researcher will test how the introduction
of this imperfect elements will affect the MM theory which is based on an efficient
market features. And then a lot of departures from irrelevance theory are found and
the modern capital structure theory is developing in the meantime.
When considering the corporate income tax, there is a tax shield benefit, so according
to Modigliani and Miller (1963), the firms should use as many debts as possible. But
more debt than necessary in a firm's capital structure is found in reality and it is obvious
that excessive debt will introduce risk to firms. Then the concept of bankruptcy cost is
introduced as an offset effect to the benefit of using debt as the tax shield. Kraus and
Litzenberger (1973) considered a balance between the benefit of tax shield and the risk
added from bankruptcy cost, so there will be an optimal capital structure, any departure
from the optimal capital structure cannot maximize the value of the firm. This is the
trade-off theory.
Myers (1984) identifies the pecking order theory. Because of information asymmetry,
managers will first use internal funds, then debt, then equity as their source of finance
when making financing decisions. Jensen and Meckling (1976) identify agency cost.
The agency cost theory suggests that because of the separation of control and
ownership, the agency of a firm will not always work on the behalf of the shareholders.
When the firm raises debts, there will also be conflicts between shareholders and
bondholders. The conflicts between shareholders and managers, as well as the conflicts
between shareholders and bondholders, will all raise the cost of the firms' operation,
investing and financing activities.
2.2.1 Trade-off Theory
Kraus and Litzenberger (1973) propounded the trade-off theory which reflects a
balance between the dead-weight costs of bankruptcy and the tax saving benefits of
debt. This theory is often set up as a competitor theory to the pecking order theory of
capital structure. The trade-off theory which clearly dominates the literature on capital

14
structure claims that a firm’s optimal financing mix is determined by balancing the
losses and gains of debt (Myers, 1977). This stream of literature predicts a unique
capital structure for every firm where the marginal benefit equals the marginal cost of
debt and changes in debt “should be dictated by the difference between current level
and optimal debt level” (DeAngelo & Masulis, 1980).
Modigliani and Miller (1963) showed that the benefit of debt is primarily the tax-shield
effect that arises due to the deductibility of interest payments. Basically, Myers (1977)
combined this model with the bankruptcy cost framework of Kraus and Litzenberger
(1973) and Scott (1976). Hence, in the classic, so-called static trade-off theory the
costs of debt are mainly associated with direct and indirect costs of bankruptcy. These
include legal and administrative costs and more subtle costs resulting from the loss of
reputation among customers and the loss of trust among staff and suppliers’ due to
uncertainties (Bradley et al., 1984; Myers, 1984). However, the consensus view is that
“bankruptcy costs alone are too small to offset the value of tax shields” (Ju et al., 2005)
and additional factors must be included in a more general cost-benefit analysis of debt
(Miller, 1977). For that reason, the agency costs framework of Jensen and Meckling
(1976) that is known as a principal-agent problem is also considered in the trade-off
model.
According to Jensen and Meckling (1976), agency costs arise due to the "separation of
ownership and control" in situations in which agents make decisions affecting the
welfare of the principals. The finance providers (principals) try to incentivise the
managers (agents) to act in their best interest. The agency costs are the direct and
indirect costs resulting from this attempt as well as the failure to make the agents act
this way (Arnold, 2008). However, Frank and Goyal (2008) argue that the impact of
the various agency conflicts on capital structure has not been completely clarified.
Bradley et al. (1984) contend that these costs which could include "costs of
renegotiating the firm's debt contracts and the opportunity costs of non-optimal
production/investment decisions" become economically significant especially when
the firm is having difficulties to meet the obligations to creditors. Therefore, the

15
broader term "costs of financial distress" is often used to refer to both bankruptcy and
the various agency costs of debt (Myers, 2001).
This illustrates that the trade-off theory is based on the original theory of capital
structure by Modigliani and Miller (1958) because the perfect market assumptions are
loosened by including taxes, bankruptcy and agency costs (Ozkan, 2001). In contrast
to the M&M framework, this stream of literature justifies moderate gearing levels.
Furthermore, it plausibly substantiates the existence of an optimal or target capital
structure that firms gradually try to achieve and maintain to be able to increase
shareholder wealth (Brounen et al., 2005; Myers, 1984). According to this model, a
value-maximizing firm facing a low probability of going bankrupt should use debt to
full capacity. Thus, one key prediction of the trade-off model is the positive correlation
between profitability and gearing. Hovakimian et al. (2004) argue that high
profitability suggests that the firm can yield higher tax savings coupled with a lower
possibility of bankruptcy.
Different variations of trade-off models can be found in the literature taking even more
factors into account. For example, Auerbach (1985) created and tested an adjusted
trade-off model and arrived at the conclusion that risky and fast-growing firms should
borrow less. But none of these theoretical and empirical further developments has
managed to fully replace the traditional version. So, most researchers still refer to the
original assumptions described above when testing the trade-off theory.
While some researchers’ findings try to expand the literature, others reproduce tests
with minor adjustments on different samples. Hence, there have been more developed
and specific models of firm behaviour with more complex predictions and implications
to be found in the body of literature. However, this theory is of significant importance
to this study because the efficiency risk hypothesis has been adjudged to be an off shot
of the trade-off theory (Ayiku, 2015; Berger& Bonaccorsi di Patti, 2006; Fazle, et al,
2016).
16
2.2.2 Pecking Order Theory
The pecking order theory has become a widely-used model to analyse and explain
firms' financing behaviour. In contrast to the trade-off theory, the pecking order theory
challenges the existence of a well-defined optimal gearing ratio (Myers, 1984).
Instead, firms seem to follow a hierarchical order of financing practices which can be
traced back to Donaldson (1961) who was the first to observe that "management
strongly favoured internal generation as a source of new funds". Based on this finding,
Myers and Majluf (1984) developed the theory suggesting that firms will not seek
external finance at capital markets until the reserve of retained earnings is exhausted.
Then, "the debt market is called on first, and only as a last resort will companies raise
equity finance" (Arnold, 2008).
In contrast to the trade-off theory, research in this aspect considers interest tax shields
and the potential threat of bankruptcy to be only of secondary importance. In fact,
gearing ratios are adjusted when there is a need for external funds which results from
the imbalance between internal cash flow, net of dividends, and real investment
opportunities (Shyam-Sunder & Myers, 1999). In other words, only firms whose
investment needs exceeded internally generated funds would borrow more debt. Myers
(2001) concludes that "each firm's debt ratio, therefore, reflects its cumulative
requirement for external financing" and that profitable companies with limited growth
opportunities would always use their cash surplus to reduce debt rather than
repurchasing shares.
There is an agreement in the literature about the key implications of the pecking order
theory: due to the preference for internal funds, it predicts lower debt levels than the
trade-off theory (Shyam-Sunder & Myers, 1999). Furthermore, Myers and Majluf
(1984) state that the theory justifies why firms tend to create financial slack to finance
future projects. Several motivations for pecking order behaviour can be found in the
literature. Initially, the principal-agent problems associated with the separation of
ownership and control served as an explanation why firms try to avoid capital markets
(Myers, 2001). Baumol (1965) argued that firms with no or relatively infrequent use
17
of stock can "proceed to make its decisions confident in its immunity from punishment
from the impersonal mechanism of the stock exchange".
Other literature highlights the signalling effects of capital structure choices to outside
investors (Ross, 1977). Some scholars go further by saying that debt issues can signal
confidence to the capital market that the firm is, in fact, an excellent firm and that the
management is not afraid to borrow money (Frydenberg, 2004). Myers and Majluf
(1984), extended this approach by taking asymmetric information between managers
and investors and its effects on investment and financing decisions into account.
However, it is important to mention Akerlof's (1970) adverse selection argument that
explains why prices of used cars drop significantly compared to new cars. The seller
of a used car will usually have more information about the true performance of the car
than the prospective buyer. The buyers require a discount to compensate for the
possibility that they might purchase an "Akerlof lemon", i.e. a car that appears to be in
good condition but has a major flaw that is not visible from the outside.
Analogically, Myers and Majluf (1984) claim that managers have access to inside
information and are able to make better statements regarding the true value, the
riskiness and future prospects of the firm than less informed outside investors who are
unable to accurately value the securities issued. Hence, it is likely that the market
misprices a firm's shares since investors are unable to accurately value the securities
issued (Harris & Raviv, 1991; Myers & Majluf, 1984; Myers, 2001). Therefore, equity
investors demand an increased level of return for the informational disadvantage which
represents an additional risk. That means that for firms who are unable to convince
rational investors of their true quality and future performance, equity finance has an
"adverse selection premium" making it more expensive (Akerlof, 1970; Myers &
Majluf, 1984).
Stewart (1990) who contends that any equity issue raises doubts because "investors
suspect that management is attempting to shore up the firm's financial resources for
rough times ahead by selling over-valued shares". This is in line with the adverse
selection problem that states that firms will only issue new equity when the stock is

18
overpriced. Allotting overpriced shares would transfer value from new investors to
existing shareholders (Myers, 2001). This argument drives down share prices which
can lead to an underinvestment problem so severe that potentially profitable projects
have to be rejected (Myers & Majluf, 1984). This demonstrates how the signalling
effects and the consequences of the informational disadvantage taken together
influence equity investors to require a “risk premium”. It makes equity finance more
expensive and therefore less attractive for companies as a financing instrument.
Harris and Raviv (1991) argue that within the original pecking order framework,
capital structure decisions are designed to avoid inefficiencies that are caused by the
information asymmetry, particularly the mispricing of shares. The logical conclusion
is that from a firm's point of view, internal finance is most preferred because sending
a signal is avoided. Furthermore, debt dominates equity because it leads to less severe
value impacts and minimizes chances of any misinterpretation (Neus & Walter, 2008).
In other words, if external financing is inevitable, firms would rather issue securities
that are less affected by asymmetric information, such as riskless debt. However, this
explanation has been criticized because it does not take into account the mentioned
principal-agent conflict. In the signalling model, managers are assumed to act in the
shareholder's best interest and to not take advantage of their superior information to
serve their own interests (Neus & Walter, 2008). Whereas the pecking order model by
Myers & Majluf (1984) recommends that managers should have high discretionary
power over free cash flows, Jensen and Meckling (1976) advise the opposite.
The idea that managers tend to hold cash excessively to avoid the scrutiny of external
investors is part of behavioural finance theory, in which agents behave irrationally
(Elsas & Florysiak, 2008). To reduce the related agency costs, shareholders have an
interest to reduce the managers’ access to internal funds, thereby inducing them to
raise external finance (Grossman & Hart, 1982; Jensen, 1986). This argument is based
on the model’s assumption that the efficiency of the capital markets would inevitably
lead to the best allocation of funds to profitable projects (Neus & Walter, 2008).
Furthermore, Grossman and Hart (1982) and Jensen (1986) imply that debt is a more

19
effective mean to discipline managers and to reduce agency costs than equity because
the implicit obligation to pay interests is more binding than a pledge to pay dividends.
The literature suggests additional factors but Myers (1984) contends that they are not
significant enough to serve as single explanations. According to Myers (1984) firms
tend to take the “path of least resistance” when internal funds are available because the
process of obtaining external financing is more complex and time-consuming.
Communicating with outside investors and convincing them to invest with the help of
prospectus and advertisement is expensive. If external financing is inevitable, debt is
next in the pecking order because “the degree of questioning and publicity associated
with a bank loan or bond issue is usually significantly less than that associated with a
share issue” (Arnold, 2008). Hence, funds with low transaction costs, such as
administrative costs, are preferred.
In summary, the theory predicts that more profitable firms that generate high cash
flows are expected to use less debt capital than those who generate lower cash flows.
The pecking order theory argues that businesses adhere to a hierarchy of financing
sources and prefer internal financing when available. However, when external
financing is required, firms prefer debt over equity. Equity entails the issuance of
additional shares of a company, which generally brings a higher level of external
ownership into the company. Hence, the form of debt that a firm chooses can act as a
signal for its need of external finance.
Thus, firms that are profitable and therefore generate high cash flows are expected to
use less debt compared to those who do not generate high cash flows. This theory,
therefore, suggests that firms prefer debt to equity. (Muritala, 2012). All the previously
mentioned mechanisms suggest that the pecking order theory claims a negative
relationship between capital structure and firm performance since more profitable
firms opt to use internal financing over debt. This theory is of relevance because it
shows the preference of the internal sources of funding which is in relation to the aim
of the franchise value hypothesis that needs to be related to Nigeria situation.
20
2.2.3 Theories of Reverse Causality
It has been argued in capital structure and firm performance literature that there exists
a bi-directional causal relationship between leverage and firm performance (Demsetz
& Villalonga, 2001; Harvey, Lins & Roper, 2004; Rajan & Zingales, 1995). On one
hand, the amount of leverage employed by a firm determines how well it would
perform. On the other hand, the performance of the firm can determine the proportion
of leverage that the firm would employ in financing its operations. In simple
terminology, the degree of a firm’s efficiency may place it in a better position to
replace equity with debt. This leads to the efficiency-risk and franchise value
hypotheses of the reverse causation of performance from capital structure introduced
by Berger and Bonaccorsi di Patti (2002).
According to these two hypotheses, firm performance can affect its capital structure in
two ways, and the two effects are opposite to each other. Berger and Bonaccorsi di
Patti (2002) does not actually solve the reverse causality problem, however, they
propounded the reverse causality hypothesis to demonstrate how firm performance can
affect the firm capital structure. The reverse causality hypothesis was explained
through two competing hypotheses, the efficiency risk hypothesis and franchise value
hypothesis.
The efficiency-risk hypothesis postulates that more efficient firms choose lower equity
ratios than other firms, all else equal because higher efficiency reduces the expected
costs of bankruptcy and financial distress (Berger & Bonaccorsi di Patti 2006; Fazle
et al 2016). The efficiency-risk hypothesis claims that higher profitability often
reduces the bankruptcy cost of a firm. Because when a firm is performing well, the
firm will usually have a high expected return. A high expected return can be seen as a
substitute for equity because they can both be used for deduction of potential portfolio
risk of the firm. So according to the positive relationship between performance and
expected return, and the substitute relationship between expected return and equity, a
firm with better performance will tend to use less equity in its capital structure. This
21
hypothesis suggests a positive relationship between a firm's leverage and its
performance.
However, the franchise-value hypothesis is an inverse of the efficiency risk in that it
focuses on the income effect of the economic rents generated by profit efficiency on
the choice of leverage. Under this hypothesis, more efficient firms choose higher
equity capital ratios as postulated, to protect the economic rents or franchise value
associated with high efficiency from the possibility of liquidation (Yinusa et al, 2016).
Higher profit efficiency may create economic rents if the efficiency is expected to
continue in the future, and shareholders may choose to hold extra equity capital to
protect these rents, which would be lost in the event of liquidation, even if the
liquidation involves no overt bankruptcy or distress costs. According to Berger and
Bonaccorsi di Patti (2006), the franchise-value hypothesis is a joint hypothesis that
profit efficiency is a source of rents, and that firm holds additional equity capital to
prevent the loss of these rents in the event of liquidation. These two hypotheses
discussed to serve as the theoretical basis to test the reverse causality from
performance to capital structure in this study.
22
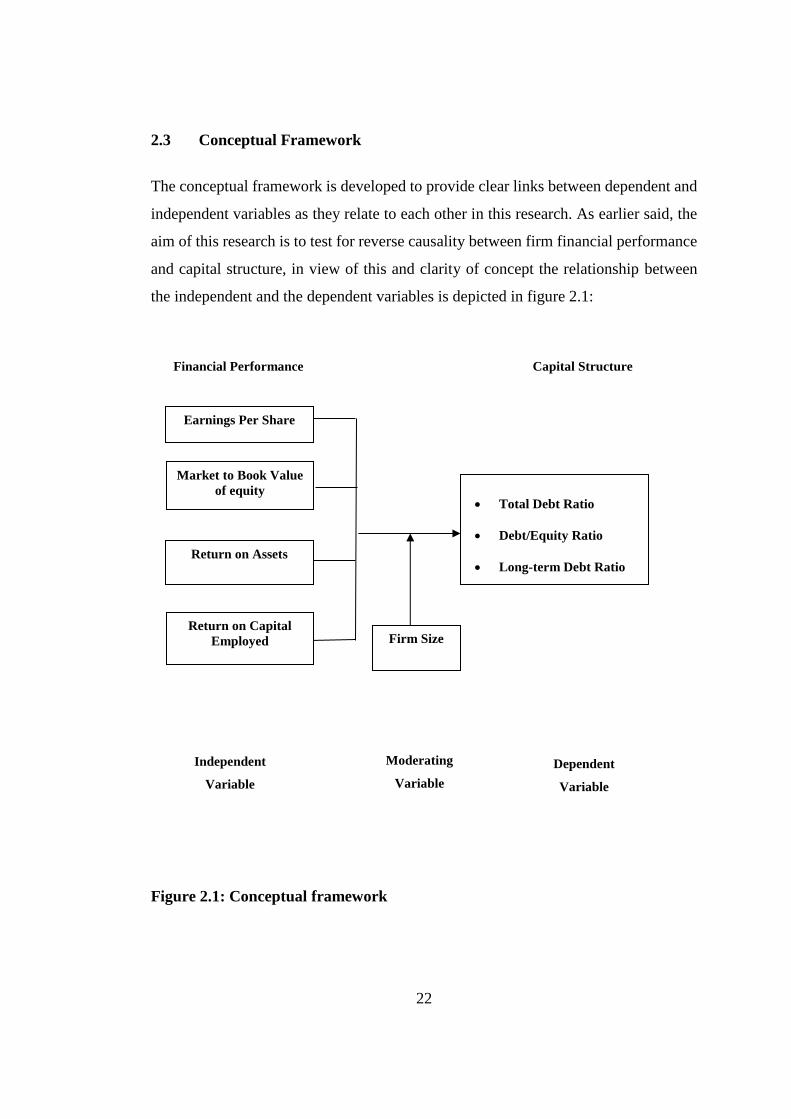
2.3 Conceptual Framework
The conceptual framework is developed to provide clear links between dependent and
independent variables as they relate to each other in this research. As earlier said, the
aim of this research is to test for reverse causality between firm financial performance
and capital structure, in view of this and clarity of concept the relationship between
the independent and the dependent variables is depicted in figure 2.1:
Figure 2.1: Conceptual framework
Independent
Variable
Dependent
Variable
Moderating
Variable
Financial Performance
Earnings Per Share
Return on Assets
Market to Book Value
of equity
Capital Structure
• Total Debt Ratio
• Debt/Equity Ratio
• Long-term Debt Ratio
Firm Size Return on Capital
Employed

23
2.4 Empirical Review
In line with the general objective of the study financial performance is the independent
while the capital structure is the dependent variables. This is for the purpose of
establishing a bi-directional relationship between capital structure and financial
performance as recently observed by (Berger & Bonaccorsi di Patti, 2006; Margariti
& Psillak 2007, Otieno & Ngwenya, 2015; Yinusa et al 2016), a departure from the
norm of uni-directional relationship that has pervaded the capital structure and
financial performance literature for more than five decades. Their findings have always
been based on the signs of the relationship without any recourse to empirically testing
for the possibility of a reverse causal relationship between them (Abata & Migoro,
2016; Adesina, Nwidobe & Adesina, 2015; Karus & Litzenberger, 1973; Jensen &
Meckling, 1986; Meyers & Najluf, 1984).
2.4.1 Earnings per Share and Capital Structure
Milad et al. (2013) describes earnings per share (EPS), as one of the most important
financial statistics that is noteworthy for investors and financial analysts is which
shows earnings that the company has achieved in a fiscal period for an ordinary share
and often is used to evaluate the profitability and risk associated with earning and
judgments about stock prices. EPS can be defined as the ratio of net income to number
of equities in a firm (Goya, 2013; Mujahid & Akhtar, 2014; Savathaasan & Rathika,
2013) and has been consistently applied as a proxy of performance in various studies,
for instant, Mujahid and Akhtar (2014) used the overall textile sector EPS along
other ratios as accounting measures to evaluate the impact of capital structure on
the financial performance of firms and shareholders’ wealth in Pakistan. They
conducted regression analysis on a sample of 155 textile firms for the years 2006 to
2011. Their results show that capital structure positively impacts firm financial
performance and shareholder wealth.
Mahfuzah and Yadav (2012) investigated the relationship between capital structure
and firm performance. They used panel data procedure for a sample of 237

24
Malaysian listed companies on the Bursa Malaysia Stock exchange during 1995-
2011. Four performance measures (including return on equity, return on asset,
Tobin's Q and earning per share) were used as dependent variable. The five capital
structure measures (including long-term debt, short-term debt, total debt ratios and
growth) were used as independent variables while the size was included as a control
variable. The results indicated that a firm's performance has a negative relationship
with short-term debt (STD), long-term debt (LTD), total debt (TD). Moreover, they
found positive relationships between the growth and performance for all the studied
sectors. Tobin's Q reports demonstrated a significantly positive relationship
between short-term debt (STD) and long-term debt (LTD). It was also concluded
that total debt (TD) has a significant negative relationship with the performance of
the firm.
Abdulkadir and Sayilir (2015) while examining the relationship between capital
structure and firm performance in Borsa Istanbul investigated 130 manufacturing
listed firms for the period between 2008-2013. Using panel data analysis, short-term
debt to total asset (STDTA) and long-term debt to total asset (LTDTA) are proxies of
financial leverage (independent variables) while Return on equity (ROE), return on
asset (ROA), earnings per share (EPS) and Tobin's Q ratio were used as proxies of
firm performance (dependent variables). Sales growth rate and firm size were used as
control variables in the study. Their findings reveal that STDA has a significant
negative relationship with ROA, EPS and Tobin's Q ratio. Besides, they find that
LTDTA has a significant negative relationship with ROE, EPS and Tobin's Q ratio,
while it is positively and significantly correlated with ROA
Sivathaasan and Rathika (2013) studied the impact of capital structure on earnings per
share (EPS) in selected financial institutions listed on Colombo Stock Exchange in Sri
Lanka during 2006 to 2010. The study employs the distinctive methodologies of
correlation and regression model to test the operational hypotheses. The results
revealed that Equity and debt ratio have a negative association with EPS, whereas
leverage ratio has a positive association according to correlation analysis (r = -.244, -

25
.326 and .389 respectively). In addition, capital structure ratios have an impact which
is approximately (R2) 22.6 % on EPS at 0.05 significant levels.
Another effort by Kalpana (2014) to study the impact of leverage on profitability i.e.
Earnings per share of selected steel companies traded in BSE shows that that there is
a negative correlation between degree of operating leverage and Earning per share,
degree of financial leverage and Earning per share, and degree of combined leverage
and Earning per share. It is concluded that the use of debt and fixed cost expenses
would reduce the profitability of the firms
Anafo, Amponteng and Yin (2015) in determining the impact of capital structure or
leverage on profitability employed data collected from 17 listed banks on Ghana stock
exchange from 2007 to 2013 using descriptive statistics and multiple regression
models. Their result revealed that financial leverage measured by short-term debt to
total assets (STDTA) had a significant positive relationship with profitability
measured by return on assets (ROA), return on equity (ROE) and earnings per share
(EPS). Long-Term Debt to Total Asset (LTDTA) also had a significant positive
relationship with ROA and ROE but however, had a negative and insignificant
relationship with EPS. Asset growth rate had a negative and insignificant relationship
with profitability measured by ROA, ROE and EPS. Firm size also showed a positive
and significant relation with all the profitability measures such as ROA, ROE and EPS.
2.4.2 Market to Book Value and Capital Structure
According to Marangu and Jagongo (2014), market to book value ratio is a valuation
ratio that is used by investment advisors, fund managers and investors to compare a
company’s market value (market capitalization) to its book value (shareholders'
equity). The market to book value ratio is expressed as a multiple (how many times a
company's share is trading per share compared to the company's book value per share)
is an indication of how much shareholders are paying for the net assets of a company.
The market-to-book ratio is used as a proxy for investment opportunities. Firms with
high market-to-book ratios tend to grow quickly. This variable often appears in

26
underinvestment as emphasized by Myers (1977) and Stulz (1990): highly leveraged
firms tend to pass up promising projects. Thus, firms with high market-to-book ratios
tend to lower leverage. The market timing hypothesis also indicates a negative sign
because firms with high market-to-book ratios have an incentive to take advantage of
high/low equity prices to issue/repurchase equities. On the other hand, the default
probability theory by Merton (1974) implies a positive sign since a higher market-to-
book ratio shows a higher expected growth rate of firm value.
The market-to-book ratio has been one of the major sources from which the costly
external financing theory draws inspiration to interpret capital structure decisions.
According to this theory, firms with higher market-to-book ratios are more likely to
issue equity because a higher market-to-book ratio signals a lower cost of external
equity financing (Bayless & Chaplinsky, 1996; Choe, Masulis, & Nanda, 1993;
Korajczyk & Levy, 2003; Myers & Mujluf, 1984). This view of market-to-book ratio
has been the main basis for a formal argument of the market timing hypothesis (Baker
& Wurgler (2002). Welch (2004) shows that the driving force of leverage ratios is the
market valuation of equity. Firms do not put countermeasures into effect to offset
changes in these leverage ratios that stem from variations in market valuations. In fact,
when resorting to external financing, firms with more favourable equity market
valuations are more likely to issue equity, thus further deviating away from their
original leverage ratios. This evidence is consistent with the notion that firms care
more about external financing costs than their target leverage ratios.
That negative relation between the market-to-book ratio and leverage ratio is one of
the most widely documented empirical regularities in the capital structure literature.
Smith and Watts (1992), Barclay, Smith, and Watts (1995), Rajan and Zingales (1996),
Jung, Kim, and Stulz (1996), Lang, Ofek, and Stulz (1996), Hovakimian, Opler, and
Titman (2001), Baker and Wurgler (2002), Hovakimian (2004), Hovakimian,
Hovakimian, and Tehranian (2004), Kayhan and Titman (2004) and Chen and Zhao
(2005). Erickson and Whited (1992), however, argue that the market-to-book ratio is
a poor measure of growth opportunities.

27
For instance, in a study carried out by Chen and Zhao (2004) trying to understand the
roles of the market-to-book ratio and profitability in corporate financing decisions in
which they focused on scenarios where two theories (costly external financing theory
and trade-off theory) have drastically different or even opposite predictions about these
variables. In each case, they find strong evidence in support of the costly external
financing theory but inconsistent with the trade-off theory. They conclude that firms
with higher market-to-book ratios are more likely to issue equity not because they
intend to downwardly adjust their target leverage ratios, but because they face lower
external financing costs. Similarly, firms with higher profitability are more likely to
issue debt, not because they intend to move toward their target leverage ratios, but
because they face lower debt financing costs.
According to Barclay, Smith, and Watts (1995) stock prices should reflect intangible
assets such as growth opportunities, but corporate balance sheets do not reflect them.
It is logical that the larger a company's growth options relative to its assets in place the
higher on average will be its market value in relation to its book value. They
accordingly used a company's market-to-book equity ratio as their proxy for its
investment opportunity set. They opined that companies with high market-to-book
ratios had significantly lower leverage than companies with low market-to-book ratios.
They also discovered that drugs and medical industries have the highest market-to-
book ratio and lowest leverage ratios. Conversely, railroad equipment and lumber
industries have the lowest market-to-book ratios and the highest leverage ratios.
Hovakimian, Opler, and Titman (2001) suggested that stock prices play a significant
role in determining a firm's leverage. The probability of equity issue for firms with
huge stock price increases is more and firms with stock price decline retire debt. This
observation is consistent with the idea that stock price increases are generally
associated with improved growth opportunities, which would lower a firm's optimal
debt ratio. Bhaduri (2002) presented evidence suggests that the optimal capital
structure can be influenced by growth. Antoniou, Guney and Paudyal (2002)
investigated the determinants of leverage ratio for companies located in France,
Germany and England. The results suggest that the leverage ratio is inversely related
28
to market-to-book equity ratio. Kayhan and Titman (2003) found that financial deficits
(the amount of capital raised externally) do not have an effect on changes in debt ratios
for firms with a high market to book ratios. Hovakimian, Hovakimian, and Tehranian
(2004) found result consistent with the hypothesis that high market-to-book firms have
good growth opportunities and, therefore, have low target debt ratio.
On the contrary with most of the literature, Chen and Zhao (2006) argued that most
related studies take this negative relation as given and debate about its economic
interpretation. They believe firms with higher market-to-book ratios face lower debt
financing costs and borrow more and emphasise that the relationship between the
market-to-book ratio and leverage ratio is not monotonic but positive for most firms
and that the previously documented negative relation is driven by a subset of firms
with high market-to-book ratios. Antoniou, et al. (2008) found that the leverage
declines with an increase in growth opportunities. According to Frank and Goyal
(2009), market-to-book equity ratio has a negative relationship with the market
leverage of firm but this result is not reliable for book leverage. Bayrakdaroglu, Ege,
and Yazici (2013) despite their expectations discovered that the Turkish companies
with high growth opportunities may have high debt ratios.
2.4.3 Return on Assets (ROA) and Capital Structure
ROA measures the overall effectiveness of management in generating profits with its
available assets. The higher the firm's ROA the better. The profitability measure by
ROA is the most comprehensive measure of the performance management by
employing three variables: total revenues, total cost and the assets, if the company has
a good ROA it will generate a satisfactory ROE (Walsh, 2006). Moreover, determining
the numerator of its equation is considered the subject of disagreement among
scholars. The simplest way to determine ROA is to take net income reported for a
period and divide that by total assets according to Gitman and Zutter (2012), Ehrhardt
and Brigham (2011), and Ross et al. (2011). In contrast, some analysts take EBIT and
divide over total assets such as Lindow (2013), Glantz (2003), Ross et al. (2003) as a
gross ROA and Friedlob and Schleifer (2003) while this study applied the earlier stand.
29
There is extant literature on capital structure and ROA but their conclusions are mixed.
While some researchers concluded its positive (Aburub, 2012; Anderson, 2005;
Mujahid, 2014), some authors (Ebaid, 2009; Fosberg & Ghosh, 2006; Huang & Song
2006; Khan, 2016; Mramor & Crnigoj, 2009) have revealed a negative relationship.
For an instant, Nirajini and Priya (2013), in a study, on the Capital structure and
financial performance during 2006 to 2010 carried out on listed trading companies in
Sri Lanka employing data extracted from the annual reports of sample companies
which were analysed using correlation and multiple regression analysis. Their results
revealed a positive relationship between capital structure and financial performance.
And also, conclude that capital structure has significant impact on financial
performance of the firm as proxy by debt asset ratio, debt-equity ratio and long-term
debt correlated with gross profit margin(GPM), net profit margin(NPM), Return on
Capital Employed(ROCE), Return on Asset (ROA) and Return on Equity (ROE) at
significant level of 0.05 and 0.1.
In a study carried out on the effect of capital structure on firm performance, Assad
(2016) while exploring the effect of capital structure on firm profitability, he
empirically investigated a sample of 30 firms selected from FTSE-100 index of the
London Stock Exchange between years 2005 to 2014. The study applied multiple
regression analysis methods to explore the impact of capital structure on firm
performance. The results revealed that Interest Coverage has a positive significant
impact on ROA, ROE and ROIC where DE has a positive significant impact on ROE
but a negative significant impact on ROA and ROIC. In the same vein, Lawal, Edwin,
Kiyanjui and Adisa (2014), examines the effect of capital structure on firm's
performance (ROA and ROE) in Nigeria manufacturing companies from 2003 to 2012.
The descriptive and regression research techniques were employed in their analyses
for 10 manufacturing companies and their finding revealed that capital structure is
negatively related to firm's performance.

30
2.4.4 Return on Capital Employed (ROCE) and Capital Structure
A study by Priya and Nirajini (2013) to examine the effect of capital structure on the
performance of listed companies in Sri Lanka from 2006 to 2011 showed that capital
structure had a significant effect on the financial performance of the firms. Using
regression analysis at 5% and 1% significance levels, the study revealed that long-term
debt, debt/equity ratio was strongly associated with the profitability measures. The
profitability measures were gross profit margin, return on assets, return on equity and
return on capital employed.
In addition, (Singh, 2013) analysed how far capital structure affects the profitability of
corporate firms in India. The study tried to establish the hypothesized relationship as
to how far the capital structure affects the business revenue of firms and what the
interrelationship is between capital structure and Profitability. This study is carried out
after categorizing the selected firms into three categories based on two attributes, viz.
business revenue and asset size. The study proved that there has been a strong one-to-
one relationship between Capital Structure variables and Profitability variables, Return
on Assets (ROA) and Return on Capital Employed (ROCE). The Capital Structure
found to have a significant influence on Profitability, an increase in the use of debt
fund in Capital Structure tend to minimize the net profit of the Manufacturing firms
listed in Bombay Stock Exchange in India.
Efobi, and Uremadu (2009). Determining the capital structure of a company is a very
critical factor to consider while projecting corporate performance in any business
environment. This decision becomes even more difficult in a country like Nigeria,
where the business and economic environment is highly unstable. This leaves the firms
in a dilemma about what capital structure to adopt in financing their operations:
Furthermore, the choice made by the company on what capital structure to adopt in
financing their operations has a serious impact on the performance of the firm. This
study used regression analysis to determine the effect of capital structure on corporate
profitability for 10 selected manufacturing firms for the period studied 2002-2005. We
found out that the ratio of long-term debt to total asset (debt financing) and the ratio
31
of equity to total liability of the firm (equity financing) had negative impact on the
return on capital employed (ROE), while the ratio of short-term debt to total liability
had insignificant effect on return on capital employed (ROE). Based on these findings,
they made some recommendations, which advised that the firm management should
ensure that they manage the composition of their capital structure well, most especially
as it relates to long-term debts and equities as well as to the corporate reserves of the
firm.
Based on another study carried out to investigate the impact of capital structure on
profitability of 10 listed Sri-Lankan banks over the 8-year period from 2002 to 2009.
Niresh (2012) employed debt/equity and debt to total funds ratios as a measure of the
capital structure while net profit, return on capital employed, return on equity and net
interest margin are proxied as performance measurements. The data gathered from the
handbook of listed companies and the annual reports of respective banks were
analyzed using regression model. In his findings, total debt was found to be significant
in determining net profit and return on capital employed in the banking industry of Sri
Lanka.
Mohamed and InunJariya (2015) studied the "Effect of Capital structure on
profitability of Food and Beverage sectors in Sri Lanka" by taking 14 companies of
the Beverage, Food & Tobacco industry and 24 companies from the Manufacturing
industry. They conducted the study to find out the relationship between capital
structure and profitability of the listed Beverage, Food and Tobacco industry in Sri
Lanka and to recognize the extent of the impact of capital Structure on the profitability
of the listed Beverage, Food and Tobacco industry in Sri Lanka. The study revealed
that leverage, measured in terms of total debt to asset (TDA) has a negative impact on
profitability measured by return on equity (ROE) and return on capital employed
(ROCE) and is significant at 0.05 significance level whereas leverage, measured by
total debt to equity (TDE) shows a negative relationship but not significant. TDA is
also found to have a negative impact on profitability measured by ROCE after
controlling for LNS at 0.01 significant levels. It is clear that both the measures of
leverage (TDA & TDE) have a negative impact on both the measures of profitability

32
(ROE & ROCE). The value is less than 0.01 for all the cases. Therefore, it could be
concluded that at 1% significance level, leverage/debt capital has a negative impact on
the profitability of beverage, food and tobacco sector firms listed on Sri Lanka.
Kumar (2015) studied “Capital Structure and its Impact on Profitability” with the
intention to identifying the relationship between capital structure and profitability of
SME, finding an optimal capital structure that would be associated with the best
performance, finding an optimal capital structure that would be associated with the
best performance and finding out the impact of capital structure on profitability. From
a data set collected from some secondary sources considered from 2008 to 2013 and it
is concluded that the debt/equity composition varies substantially among the SME and
there is a significant relationship between Debt to total funds and ROE. There is no
relation or there is insignificance between debt to total funds and ROCE.
In finding out the determinants of capital structure and its impact on financial
performance, Swain and Das (2017) by means of data generated from listed companies
on the Indian stock exchange for a time period of 10 years analysed a total of 50
sampled manufacturing companies using regression model. Capital structure was
measured by debt-equity ratio, total debt to total asset, current ratio and long-term debt
to total asset ratio while the financial performance was proxied by return on capital
employed, return on assets, earnings per shares and return on equity. From their
findings, a statistically significant positive relationship was concluded between all the
independent and the dependent variables.
2.4.5 Firm Size
A moderation effect is a causal model that postulates ‘‘when’’ or ‘‘for whom’’ an
independent variable most strongly (or weakly) causes a dependent variable (Frazier
et al., 2004; Kraemer et al., 2002). A moderator modifies the strength or direction (i.e.,
positive or negative) of a causal relationship. Conceivably the moderation effect is
more commonly known as the statistical term ‘‘interaction’’ effect where the strength
or direction of an independent variable effect on the dependent variable depends on

33
the level or the value of the other independent variable. Therefore, the term
‘‘moderation effect’’ has continuously been reserved for models that intend to make
causal hypotheses. Specifically, a moderation effect is a special case of an interaction
effect, a causal interaction effect, which requires a causal theory and design behind the
data. In other words, a moderation effect is certainly an interaction effect, but an
interaction effect is not necessarily a moderation effect (Wu & Zumbo, 2008). The
study adopted firm size to control for differences in total assets among the studied
firms. This decision is informed by prior empirical literature that showed that the firm
size has the potential to influence capital structure (Yinusa et al., 2016; Berger &
Bonaccorsi di Patti, 2006; Margaritis & Psillaki, 2007).
Nzeoha (2008), opined that the size of a firm plays a significant role in determining
the form of relationship the firm enjoys within and outside its operating environment.
The larger a firm is, the better the influence it has on its stakeholders. Another thing is
the growing influences of conglomerates and multinational corporations in today's
global and local economies where they operate portend an indication of what role size
plays within the corporate environment. Buttressing the position of size in corporate
discourse, Kumar Rajan and Zingales (2001) argue that a fascinating aspect of
economic growth is that much of it takes place through the growth in the size of
existing organizations.
Size plays an important role in capital structure (Abor & Biekpe, 2006; Abor & Biekpe,
2009; Amidu, 2007; Booth, Aivazian, Demirguc¸-Kunt & Maksimovic, 2001). Its
importance as moderating variable has become such a routine to employ in empirical
corporate finance studies. There are several theoretical reasons why firm size is related
to capital structure, these include, economies of scale in lowering information
asymmetry, scale in transaction costs and market access (Krasauskaite, 2011). For an
instant, in the presence of non- trivially fixed costs of raising external funds large firms
have cheaper access to outside financing per each amount borrowed (Leary & Roberts,
2004). Large firms are more likely to diversify their financing sources. Alternatively,
size may be a proxy for the probability of default, for it is sometimes contended that
larger firms are more difficult to fail and liquidate, or, once the firm finds itself in
34
distress, for recovery rate (Duffie, Saita & Wang, 2005; Shumway, 2001). Size may
also proxy for the volatility of firm assets, for small firms are more likely to be growing
firms in rapidly developing and thus fundamentally unpredictable industries. Another
explanation is the extent of the distortion in the degree of information asymmetry
between insiders and the capital markets which may be lower for larger firms because
they face more examination by ever-suspicious investors (Fama & French, 2002).
In the alternative, smaller firms are more informationally opaque than larger firms and,
consequently, the costs to resolve information asymmetry with lenders are higher for
small firms than for large enterprises. Financing decisions might also be affected by
the transaction costs associated with a specific type of financing. As Titman and
Wessels (1988) point out, transaction costs are a function of scale. Hence, relatively
high transaction costs may effectively make some financing options unavailable for
smaller firms. Hussain and Matlay (2007) assert that small firms strive for external
sources of finance only if the internal sources are exhaust. Small firms try to meet
financial needs with a pecking order of personal and retained earnings, debt and
issuance of new equity. These theoretical reasons suggest that smaller firms should
have lower debt levels. The size of a company is assumed to have a positive
relationship with leverage. The reason is first and foremost that bigger firms tend to
have less volatile cash flows and that they take on more debt to maximize the benefits
from a tax shield. Another aspect that stems from the pecking order theory is that
bigger firms have greater prospects to attract more analysts to provide information
about the company. In turn, this decreases the information asymmetry with the market,
which makes it possible for the firm to get access to equity financing without ruin firm
value.
A substantial number of authors have suggested a positive relationship between firm
size and leverage (Fama & French, 2002; Karadeniz, Kandir & Iskenderoglu, 2011;
Gill & Mathur, 2011; Olakunle & Jones, 2014), while other researchers have reported
a negative relationship in various contexts (Srivastava, 2014; Yadiv, 2014; Onofrei,
Tudose, Anton & Durdureanu, 2015). For instance, Baloch, Ihsan, Kakakhel & Sethi
(2015) while investigating the impact of firm size, asset tangibility and retained

35
earnings on the financial leverage in the auto sector of Pakistan. The data employed
were gotten form 22 firms financial statement analysis document issued by the State
Bank of Pakistan (SBP). The multiple regression model was used to determine the
relationship between the underlying variables. The results indicated that firm size and
asset tangibility significantly affect the financial leverage.
Olakunle and Jones (2014), seeks to examine the impact of size on the capital structure
choice of listed Nigeria firms in influencing their corporate financing strategy and
performance analysis. The research study analysed data gotten from the NSE on 47
listed firms over the period 1997 – 2007 using the OLS regression analysis of natural
log of sales (size of the firm), against leverage (total debt to total asset and short-term
debt to the total asset). Results show that size of the firm has a positive influence on
the leverage ratio of listed Nigeria firms. In like manner, Wahome, Memba and Muturi
(2015), conducted a study to determine the influence of firm-specific factors on the
capital structure of Kenyan insurance firms between a period of 2003 and 2012 using
panel data methodology and two independent variables size and firm risk. The panel
regression results indicated that size had a significant influence on capital structure.
Yadav (2014) in studying the determinants of the capital structure and financial
leverage of selected Indian companies applied the correlations and multiple regression
analysis and found among other measures a negative correlation between firm size and
financial leverage as measured through debt to equity ratio, while Srivastava (2014)
study was carried out on Indian cement sector with the aid of a linear regression model
in estimating the effect of five variables which includes size on leverage and risk of
companies but found a negative correlation between firm size and financial leverage
whereas asset tangibility was noted to have positive effect on financial leverage. Based
on the empirical literature it is obvious that the studies on the effects of firm size on
capital structure have generated varied results ranging from those supporting a positive
relationship among the variables used in the study to those opposing it.
36
2.5 Critique of Existing Literature Relevant to the Study
Although many theories and factors had been identified in the literature to explaining
and establishing the relationship between capital structure and financial performance
these studies concentrated on the nature of their signs of the relationship. The decision
is because most of the empirical studies are concentrated on a unidirectional
relationship thereby ignoring the possibility of reverse causality between financial
performance and capital structure (Berger & Bonaccorsi di Patti, 2006)
The inconsistency of methodological approaches and method of data collection is of
great concern. For instance, Rizal Adhari and Viverita (2015) and Fazle et al., (2016),
collected their data using the Data Envelopment Analysis (DEA) while their analysis
was based on a two-stage estimation method, OLS, and quantile regression
respectively. Berger and Bonaccorssi di Patti (2002; 2006) used both simultaneous
equation model and a two-stage structural equation method to account for reverse
causality. While the OLS may be biased if the number of years involved in the analysis
is small the dynamism expected to be clear in the equations as postulated by the reverse
causality hypothesis was deficient. The GMM as involved in this analysis clearly
demonstrated the dynamism in financial performance
Most of the studies reviewed on the possibility of a reverse causality have handled the
issue based on the perspective of developed countries especially in United States of
America, France and New Zealand (Berger & Bonaccorsi di Patti, 2006; Margaritis &
Psillaki, 2007, 2010). Few studies have looked at the African context and emerging
markets (Fazle et al., 2016; Otieno & Ngwenya, 2015; Rizal Adhari & Viverita, 2016;
Yeh, 2011; Yinusa et al., 2016). However, the Nigerian context remains very scanty
which informed a further inquest.
2.6 Research Gap
Many scholars in the world have studied the influence of capital structure on firm
financial performance in various contexts with different methodologies and
inconsistent findings as reviewed in the literature. However, the few scholars who have
37
focused in this area in Nigeria situation have approached it solely on unidirectional
basis and are mostly interested in the signs of their relationship without any recourse
to look at a reverse of the normal approach (Akintoye, 2009; Akinyomi, 2013;
Babatunde, 2016; Kajola, 2010; Lawal, et al., 2014; Muritala, 2012; Nyor & Yunusa,
2016; Ubesie, 2016). However, the attempt made by Yinusa et al. (2016) could deal
partially with the issue by proxying the return on equity as the only measure of
financial performance out of numerous measures which may further strengthened our
understanding of the reverse causality relationship between firm financial performance
and capital structure choice of non-financial firms in the Nigeria stock exchange. This
is the gap this study was carried out to fill.
2.7 Chapter Summary
The chapter has presented the literature review on the various theories and their link
to the present one. Different works of literature have been reviewed based on the
relationship between capital structure and firm financial performance and vice versa
while a conceptual framework for better clarity of purpose was developed from the
literature review as well as a critique and study gap explained.
38
CHAPTER THREE
RESEARCH METHODOLOGY
3.1 Introduction
Research methodology is concerned with what you will do to address the specific
objectives and hypotheses/research questions you have developed (Newing, 2011).
This involves deciding the research design structure, choosing the specific methods,
developing a sampling strategy and describing what analyses that were carried out.
This chapter presents the methodology employed in the study. This includes the
research design, population of the study, sources of data and instruments of data
collection and treatment. It also contains the specified empirical models estimated by
the study and provides the techniques of estimating and analyzing the model.
3.2 Research Philosophy
Saunders, Lewis and Thornhill (2009) defines research philosophy as the development
of knowledge adopted by the researchers in their research. It is a set of assumptions
about what is important to study and be known (ontology and epistemology), what
research designs and tools are suitable as well as standards that should be employed to
judge the quality of the study (Mkansi & Acheampong, 2012). As such, mixed methods
pattern provides basis for the methodology of this study. That is, the study drawn from
combined assumptions of positivistic and naturalistic viewpoints of research
philosophy. According to Crossan (2003), positivism adopts a clear quantitative
approach to investigate events while naturalistic approach explains and explores in-
depth phenomena from a qualitative perspective. The preference of this combined
approaches is anchored on its key feature of methodological pluralism, which
frequently results in superior research, with maxim refers to as sensible effect-oriented
(or outcome oriented) rule through thinking, practical experiences or experiments
(Johnson & Onwuegbuzie, 2004).
39
3.3 Research Design
Research design as posited by Trochim (2006), "provides the glue that holds the
research project together. It is used to structure the research, to show how all of the
major parts of the research project work together to try to address the central research
questions." According to Kothari (2014), research design describes the blueprint for
collecting, measuring and analyzing the data needed for a study. The causal design
approach to research was adopted in this study because it is quantitative in nature as
well as pre-planned and structured in design. The suitability of adopting this design is
that it explains the cause and effect relationship between variables and help to
understand which variable is the cause and which variable is the effect, the nature of
the relationship between the causal variables and the effect to be predicted.
This method is further considered appropriate for achieving the research objectives of
the study because the data and the study depend grossly on secondary data collected
from the annual report and account of firms listed in NSE and investigate the causal
relationship between the relevant variables of the study. This approach is useful for
this kind of study because it also makes it possible to deduce since the inferences from
the test of statistical hypotheses lead to general inferences about the features of the
population (Harwell, 2011)
3.4 Population
The population of this study comprises of the entire 186 companies listed (Appendix
A) in the NSE as at December 2015 (NSE fact sheet, 2016). According to Neuman
(2000), a population can be described as a number of things such as individuals or
groups, the researcher wants to investigate. Whereas, Saunders, Lewis and Thornhill
(2009) refer to it as an entire group that allows data to be sourced and investigated
while Mugenda (2010), sees it as an entire group of individuals, events or objects
having common characteristics that conform to a given specification.
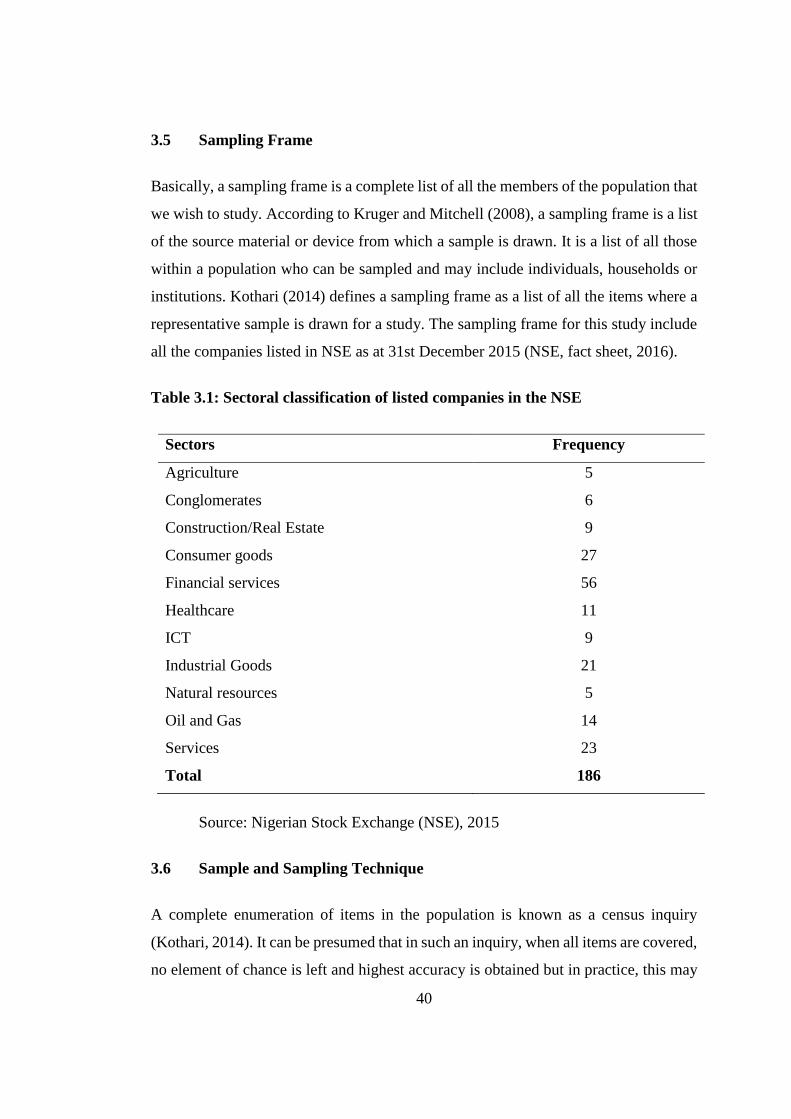
40
3.5 Sampling Frame
Basically, a sampling frame is a complete list of all the members of the population that
we wish to study. According to Kruger and Mitchell (2008), a sampling frame is a list
of the source material or device from which a sample is drawn. It is a list of all those
within a population who can be sampled and may include individuals, households or
institutions. Kothari (2014) defines a sampling frame as a list of all the items where a
representative sample is drawn for a study. The sampling frame for this study include
all the companies listed in NSE as at 31st December 2015 (NSE, fact sheet, 2016).
Table 3.1: Sectoral classification of listed companies in the NSE
Sectors Frequency
Agriculture 5
Conglomerates 6
Construction/Real Estate 9
Consumer goods 27
Financial services 56
Healthcare 11
ICT 9
Industrial Goods 21
Natural resources 5
Oil and Gas 14
Services 23
Total 186
Source: Nigerian Stock Exchange (NSE), 2015
3.6 Sample and Sampling Technique
A complete enumeration of items in the population is known as a census inquiry
(Kothari, 2014). It can be presumed that in such an inquiry, when all items are covered,
no element of chance is left and highest accuracy is obtained but in practice, this may

41
not be true (Kothari, 2014). According to Neuman (2000), a sample is defined as a set
of individuals selected from a population with the aim of representing the population
in a research study. Sampling refers to the systematic selection of a limited number of
elements out of a theoretically specified population of elements. The sample selection
for this study was based on nature of business and data availability. The 87-sampled
size was attained from the entire population of 186 listed companies as at 2015 by
excluding the listed 56 financial services companies' due to the nature of their assets
and liabilities and uses of the fund while other 43 companies with incomplete data set
for the years under investigation were equally excused. The outcome of the samples
included in the analysis is presented in Table 3.2:
Table 3.2: Sectoral classification of sampled non-financial companies in the NSE
Sectors Frequency
Agriculture 5
Conglomerates 6
Construction/Real Estate 9
Consumer goods 27
Healthcare 11
ICT 9
Industrial Goods 21
Natural resources 5
Oil and Gas 14
Services 23
The actual Working population of the study 130
Excluded: Companies without complete data point from 1999 - 2015 43
Actual sample firms for the study 87
Source: Author’s compilation 2017

42
3.7 Instruments of Data Collection
There are basically two sources of data collection; namely, primary and secondary
sources of data collection (Olaogun, 2010). For this study, the secondary method of
data collection was utilized. According to Kothari (2014), secondary data defined as
data that is already available or which have already been collected and analyzed by
someone else while Polit and Beck (2003) sees it as the use of data gathered in a
previous study to test new hypotheses or explore new relationships. The data,
specifically market and accounting data required in this study were obtained from the
financial statements of listed companies and Nigerian Stock Exchange Market. This
include, published Annual Financial Reports of companies quoted on the Nigerian
Stock Exchange, Central Bank of Nigeria Statistical Bulletin, Nigerian Stock
Exchange Fact-books, and the Nigerian Stock Market Bulletins.
3.8 Data Collection Procedure
In the words of Burns and Grove (2003), data collection is the precise, systematic
gathering of information relevant to the research sub-problems. To achieving the set
objectives of this study, only secondary data from the Nigerian stock exchange and the
audited financial statements of companies listed on NSE was used. The procedure
involves visiting the websites of the individual company selected to download their
audited financial statements from which the required figures were extracted and
processed for further analysis. The information obtained from the audited financial
statement of the quoted companies were compared with the documentation of the
security and exchange commission, (Nigeria stock exchange fact books) to ensure
accuracy in data collection. Therefore, the study only involved the use of secondary
data from sampled quoted company's financial statements covering the period January
1999 to December 2015 (16 years period) in other to fully enrich its fitness in the
regression.

43
3.9 Data Processing and Analysis
Data analysis is the processing of data collected to make meaningful information out
of them because as raw data may convey little or no meaning to most people (Saunder,
et al., 2009). This study basically employed secondary data which was collected from
the sampled companies listed on the Nigerian Stock Exchange market between 1999
and 2015. In this research endeavour, the data collected were analyzed using both
descriptive and inferential statistics. The Generalized method of moments (GMM) was
used to estimate the specified model. The data so gathered was subjected to hypothesis
testing based on models identified in this section and the variables defined in Table
3.3.
To avoid violating the assumptions of the OLS test of the possibility of
multicollinearity was addressed using the Variance Inflation Factor (VIF) on the
variance of the estimators. This was expressed as VIF = 1/(1-R2). The decision rule
was that a VIF 1 means the absence of correlation among predictors, while a VIF of 4
and above indicate a need for further probe, however, a VIF of 10 and above implies
serious multicollinearity presence in the predictors (Gujarati, 2013).
Stern (2011) opined that correlation does not imply causation. Without additional
information, regression analysis can only be used to estimate the partial correlations
between variables. Brooks (2008) assert that it is likely that, when a variable
autoregressive includes many lags of variables, it will be difficult to see which sets of
variables have significant effects on each dependent variable and which do not. To
address this issue, tests are usually conducted that restrict all the lags of a variable to
zero. In this study to ascertain the causal relationship between financial performance
and capital structure, the Granger causality test was employed. Moreover, it is worth
to note that Granger-causality means only a correlation between the current value of
one variable and the past values of others; it does not mean that movements of one
variable cause movements of another (Studenmund, 2017).
44
3.9.1 Measurement of Study Variables
The main objective of this study is to investigate effect of financial performance on
capital structure. This in addition to evaluate the potentiality of the reverse causality
hypothesis. Therefore, the study adopts financial performance as the independent
variable and capital structure (Leverage) as the dependent variable while firm size was
adopted as the moderating variables. These variables are discussed below:
Independent Variable
The independent variable for this study is financial performance. Financial
Performance refers to the degree to which financial objectives being or has been
accomplished in a firm which indicates a process of measuring the results of a firm's
policies and operations in monetary terms. It is used to measure firm's overall financial
health over a given period of time and can also be used to compare similar firms across
the same industry, compare industries or sectors in aggregation. Due to the nature of
this research as indicated in the research gap the proxies of financial performance
measures used in this study include, firstly, Earning per Shares (EPS). This is the
portion of a company’s profit that is allocated to each outstanding share of common
stock, serving as an indicator of the company’s profitability. It is often considered to
be one of the most important variables in determining a stock’s value and can be
defined as the ratio of net income to number of equities in a firm (Goya, 2013;
Savathaasan & Rathika, 2013). It shows earnings that the company has achieved in a
fiscal period for an ordinary share and often is used to evaluate the profitability and
risk associated with earning and also judgments about stock prices.
Secondly, the Market value to the Book value ratio (MBV): This is also the market
assessment of the firm from investor’s perspective relative to a share's book value. The
market-to-book ratio has been one of the major sources from which the costly external
financing theory draws inspiration to interpret capital structure decisions. According
to this theory, firms with higher market-to-book ratios are more likely to issue equity
because a higher market-to-book ratio signals a lower cost of external equity financing
45
(Myers & Mujluf, 1984; Korajczyk & Levy, 2003). The choice of this variable is
appropriate since the major objective of this study is to determine the effect of financial
performance on capital structure choice of firms listed in NSE.
Thirdly, the Return on Assets (ROA): ROA, as an accounting-based measurement that
gauges the operating and financial performance of the firm (Klapper & Love, 2002).
The measurement is such that the higher the ROA, the more effective is the use of
assets to the advantage of shareholders (Haniffa & Huduib, 2006). Higher ROA also
reflects the company’s effective use of its assets in serving the economic interests of
its shareholders (Ibrahim & AbdulSamad, 2011). This variable is of importance
because profitability measure by ROA is the most comprehensive measure of the
performance management because three variables: (1) total revenues, (2) total cost and
(3) the assets are used. If the company has a good ROA it will generate a satisfactory
ROE (Walsh, 2006).
Fourthly, Return on Capital Employed (ROCE): ROCE is an important shareholder
value metric in that it compares a firm’s earnings from its primary operations with the
capital invested in the company. It can help investors see through growth forecasts and
can serve as a reliable measure of corporate performance (McClure, 2017). ROCE
provides a means of measure to determine how well a company invests funds in its
basic business operation (Eilon, 1992). The choice of this metric was informed by its
potent use as a performance measure in the profit-seeking sector (Rutherford, 2002)
and can be employed in making intra and inter-organisational comparisons (Drury,
2000; Skinner, 1990).
Finally, the study employed firm size as the moderating variable for the study. The
choice of this moderating variable was informed by its relevance and significance as a
firm-specific factor that may affect the performance of firms as employed by previous
financial performance and capital structure studies (Yeh, 2010; Margaritis & Psillaki,
2010; Yinusa et al., 2016). In empirical research, different measures have been adopted
to operationalize firm size. Measures such as natural logarithm of total assets, natural
logarithm of total sales, as well as natural logarithm of total employees have been
46
extensively employed with success to depict the size of the firm in empirical research
(Kodongo, Mokoaleli-Mokoteli & Maina, 2014; Mwangi, Muathe, & Kosimbei,
2014). For this study, firm size was measured by taking the natural logarithm of total
assets.
Dependent Variable
Capital structure signifies the extent to which a firm employs both debt and equity in
financing its activities. Total equity comprises of the sum of paid-up share capital,
share-premium, reserves, minority interest and retained earnings (Fabozzi & Drake,
2009). On the other hand, total debt variable represents the combination of current and
non-current liabilities. This is measured as leverage and segregated into three parts
namely: total debt to total assets, total debt to total equity and long-term debts to total
assets. The inclusion and segregation into these three dimensions was informed by the
inconclusive and mixed report by researchers in different context while studying the
relationship between financial performance and capital structure (Otieno & Ngwenya,
2015).
The debt-to-assets ratio is the most basic solvency ratio, measuring the percentage of
a company’s total assets that is financed by debt. Secondly, the debt-to-equity ratio
measures the amount of debt capital a firm uses compared to the amount of equity
capital it uses. And lastly, the long-term debt to total assets ratio is a measurement
representing the percentage of a corporation's assets financed with loans or other
financial obligations lasting more than one year. The ratio provides a general measure
of the long-term financial position of a company, including its ability to meet financial
requirements for outstanding loans.
However, the choice proxy for the dependent and independent variables are
summarized in Table 3.3with their measurements.

47
Table 3.3: Variables and Measurement
Variables Selected Indicators Proxy Measurement
Independent
Financial
Performance
Earnings Per Share EPS Net Profit/Total Shareholders’ Equity
Market to Book Value of
equity
MBV Market Value/Book Value of Equity
Return on Assets ROA Net Income/ Total Assets
Return on Capital
Employed
ROCE EBIT/ Capital Employed
Moderating
Firm size Total Assets Z Natural log of total assets
Dependent
Capital structure Total debt ratio (TDR) CS Total debt to total asset
Debt to Equity ratio
(DER)
CS Total Debt/ Total Equity
Long-term debt ratio
(LTDR)
CS Long-term debt/ Total asset
Sources: and Ngwenya, 2015; Goya, 2013; Ibrahim and AbdulSamad, 2011; McClure, 2017;
Yinusa, et al, 2016; Fabozzi and Drake 2009; Baker & Wurgler 2002
3.8.2 Model Specification
Many studies on capital structure and firms’ performance in the literature have been
inspired by the seminar work of Modigliani and Miller (1958, 1963). Most tests carried
out in this instance employed the OLS model as presented below:
Y = α + βX + µ ……………………………………………… 3.1
Where, Y is the dependent variable, X = independent variable, α = constant, β =
coefficient of the explanatory variables and µ = stochastic variable. However, Berger
and Bonaccorsi di Patti (2006), examined reverse causality from performance to
capital structure by estimating the leverage equation as derived from equation 3.1:
48
Leverage = f (Efficiency) ……………………………………………… 3.2
Equation 3.2 represents a static leverage equation form of the reverse from
performance to the capital structure where Leverage is used to capture capital structure
while efficiency was used to capture performance. However, based on the theoretical
postulation of the reverse causality hypothesis, this study employs the lagged values
of performance indicators as suggested by the theoretical position of the reverse
causality hypothesis. From a technical point of view, endogeneity appears when two
variables exhibit a bi-directional relationship between them. In this context, OLS
methods yield biased and inconsistent estimators, because endogeneity affects the
orthogonality of the variables to the residual errors (Federico, 2016). The basic
problem of using OLS is that the lagged dependent variable is correlated with the error
term as the dependent variable is a function of the error term and it immediately
follows that lagged dependent variable is also a function of the error term. The fixed
effect (FEM) and random effect (REM) estimators are also biased and inconsistent
unless the number of time periods is large (Baltagi, 2002).
One method to solve this problem is to introduce dynamic panel data models, i.e.
models in which lagged values of the dependent variable are included as explanatory.
In this context, Arellano and Bond (1991) proposed a GMM estimator for panel data
which may deal with potentially endogenous regressors in dynamic panel data models.
As Bond (2002) opined, ‘…even when coefficients on lagged dependent variables are
not of direct interest, allowing for dynamics in the underlying process may be crucial
for recovering consistent estimates of other parameters…’
This study exploits the GMM technique of Arellano and Bond (1991), which suggests
to first difference the model and to use lags of the dependent and explanatory variables
as instruments for the lagged dependent variable as a regressor. First differencing the
dynamic model, in general, the GMM estimator could be viewed as a simultaneous
estimation of a system of equations, one for each year, using different instruments in
each equation and restricting the parameters to be equal across equations. First-
differencing the equations removes the individual effects thus eliminating a potential

49
source of omitted variables bias estimation and secured against the problems of series
non-stationary. The standard approach is to estimate the GMM model in first differences,
using previous lags of the dependent variables as instruments (Caselli, Esquivel & Lefort,
1996; Dollar & Kraay, 2003).
The general empirical capital structure used in this study was defined as follows:
Capital Structure = f (Financial Performance) …………………………………........ 3.3
This Equation was transformed to a GMM dynamic model as shown in equation 3.4
CSit = αCSit-1 + βiXit-1 + Ɛit……………………………….……………………….... 3.4
Where:
CS = Capital structure (TDR, DER, LTD)
X = Financial Performance (EPS, MBV, ROA, ROCE)
α = Constant
β = Parameter estimates of the explanatory variables while
Ɛ = Error term.
i = 1 2 3 …………. n firms
t = time 1999 - 2015
In addition, lagged values of the dependent variables are introduced in each Equation
to account for possible omitted variables, to weaken any autocorrelation in the
residuals and to improve the efficiency of the estimators in the presence of endogenous
variables.
However, the study considered the combined effect of the moderating effect of firm
size on financial performance indicators on capital structure choice using equation 3.5.
50
This was because it enables the comparison of the magnitude of the probabilities
(Twisk, 2013). The multivariate model thus estimated for this study was formulated as
leverage equation format in equation 3.9.
CSit = α CSit-1 + βiXZit-1 + Ɛit…………………………….……………………………... 3.5
Where:
Z = Firm Size
Other variables are as defined in 3.4
3.9.2.1 Specification tests for the Panel Model
To test the validity of the GMM estimates, two tests were performed. First, since
lagged values are used as instruments, unbiased estimation requires the absence of
second-order serial correlation in the error term (Arellano & Bond, 1991). To test
this requirement, the Arellano-Bond AR (2) test was carried out. A p-value of
greater than 0.05 implies the absence of second-order autocorrelation. In that case,
the systems GMM can be applied without any adjustments to the instrument set. A
p-value of less than 0.05 indicates the presence of a moving average error term of
order one or higher.
Secondly, determining the validity of the instrument employed for the justification of
its relevance and appropriateness for the study the Hansen J-test was performed. This
is because it is more robust and appropriate in a dynamic model estimated with GMM
(Yinusa, 2015). The probability value of Hansen is expected not to be less than 0.1.
Hansen value less than 0.1 signals problem with the validity of instruments employed
in the models.

51
CHAPTER FOUR
RESULTS AND DISCUSSION
4.1 Introduction
The general objective of this study was to ascertain the effect of Financial Performance
on Capital Structure of non-financial firms on the Nigerian Stock Exchange. In
pursuant of this objective the following specific objectives were set: to assess the effect
of Earnings per share on capital structure, investigate the effect of Market to book
value of equity on capital structure, examine the effect of Return on Assets on capital
structure, determine the effect of return on capital employed on capital structure and
ascertain the moderating effect of firm size on the relationship between financial
performance and capital structure. This chapter which contains the empirical analysis
of the study include a detailed analysis of the descriptive statistics of the data, the pane
model specification test, the general method of moment estimation results and test of
the hypotheses earlier formulated.
4.2 Descriptive Analysis
This section contains the descriptive statistics of all the variables included in the
analysis. According to Kothari (2014), descriptive statistics is concerned with the
development of some important statistical measures or indices that are used to
summarize research data such as measures of central tendency or statistical averages,
measures of dispersion, measures of asymmetry (skewness), measures of relationship
and other measures from the raw data. Table 4.1 presents the summaries of the
descriptive statistics of all the variables employed in this thesis. This include earnings
per share, market to book value of equity, return on assets and return on capital
employed which proxy financial performance as the independent variables. On the
other hand, capital structure which is the dependent variable was measured by total
debt to total assets, debt to equity ratio and long-term debt to total assets.
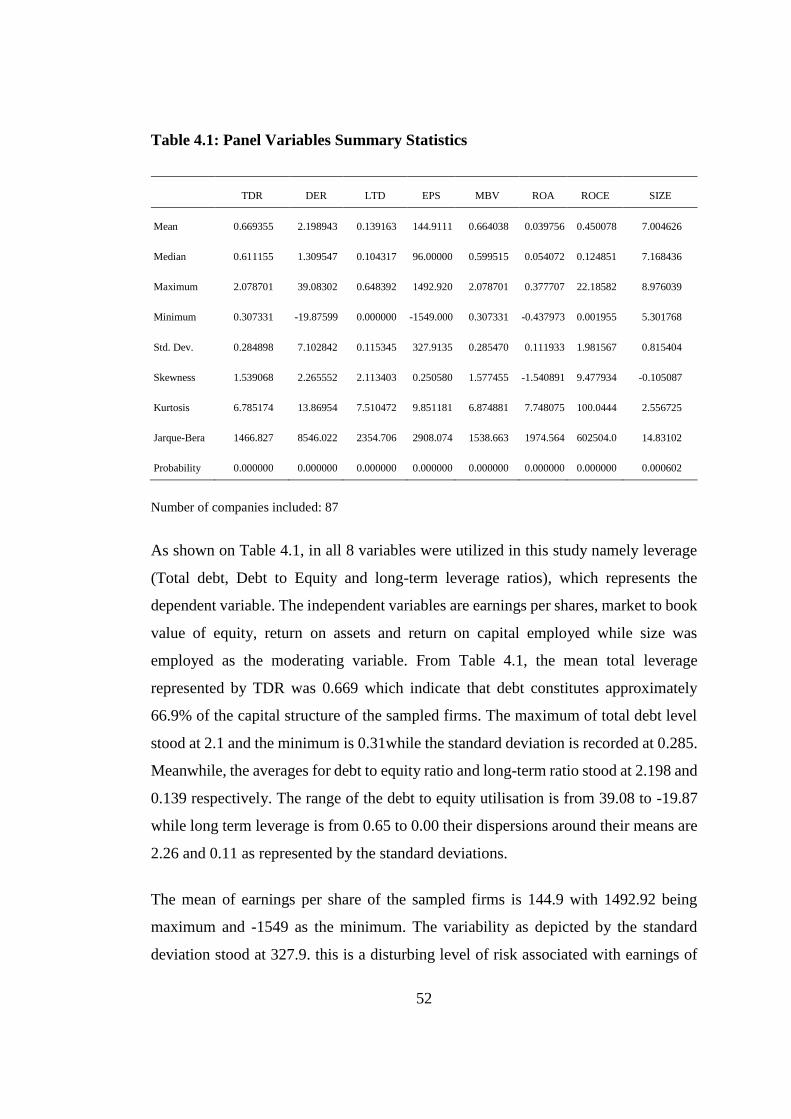
52
Table 4.1: Panel Variables Summary Statistics
TDR DER LTD EPS MBV ROA ROCE SIZE
Mean 0.669355 2.198943 0.139163 144.9111 0.664038 0.039756 0.450078 7.004626
Median 0.611155 1.309547 0.104317 96.00000 0.599515 0.054072 0.124851 7.168436
Maximum 2.078701 39.08302 0.648392 1492.920 2.078701 0.377707 22.18582 8.976039
Minimum 0.307331 -19.87599 0.000000 -1549.000 0.307331 -0.437973 0.001955 5.301768
Std. Dev. 0.284898 7.102842 0.115345 327.9135 0.285470 0.111933 1.981567 0.815404
Skewness 1.539068 2.265552 2.113403 0.250580 1.577455 -1.540891 9.477934 -0.105087
Kurtosis 6.785174 13.86954 7.510472 9.851181 6.874881 7.748075 100.0444 2.556725
Jarque-Bera 1466.827 8546.022 2354.706 2908.074 1538.663 1974.564 602504.0 14.83102
Probability 0.000000 0.000000 0.000000 0.000000 0.000000 0.000000 0.000000 0.000602
Number of companies included: 87
As shown on Table 4.1, in all 8 variables were utilized in this study namely leverage
(Total debt, Debt to Equity and long-term leverage ratios), which represents the
dependent variable. The independent variables are earnings per shares, market to book
value of equity, return on assets and return on capital employed while size was
employed as the moderating variable. From Table 4.1, the mean total leverage
represented by TDR was 0.669 which indicate that debt constitutes approximately
66.9% of the capital structure of the sampled firms. The maximum of total debt level
stood at 2.1 and the minimum is 0.31while the standard deviation is recorded at 0.285.
Meanwhile, the averages for debt to equity ratio and long-term ratio stood at 2.198 and
0.139 respectively. The range of the debt to equity utilisation is from 39.08 to -19.87
while long term leverage is from 0.65 to 0.00 their dispersions around their means are
2.26 and 0.11 as represented by the standard deviations.
The mean of earnings per share of the sampled firms is 144.9 with 1492.92 being
maximum and -1549 as the minimum. The variability as depicted by the standard
deviation stood at 327.9. this is a disturbing level of risk associated with earnings of
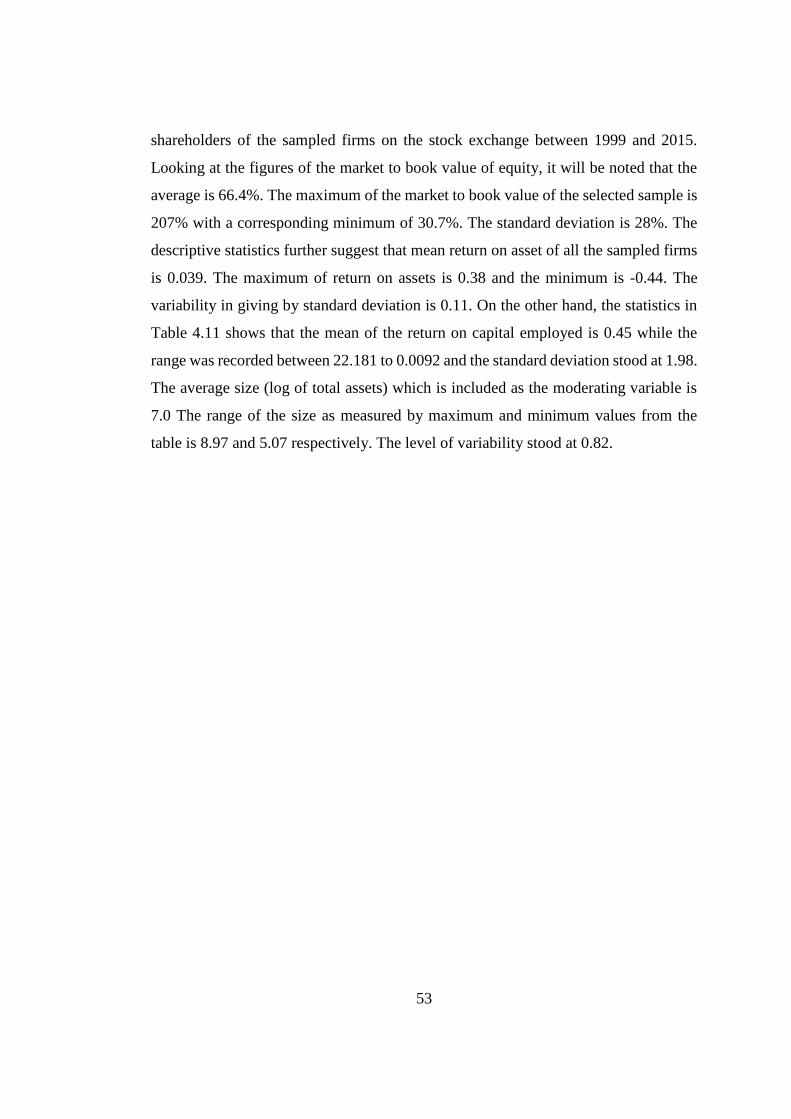
53
shareholders of the sampled firms on the stock exchange between 1999 and 2015.
Looking at the figures of the market to book value of equity, it will be noted that the
average is 66.4%. The maximum of the market to book value of the selected sample is
207% with a corresponding minimum of 30.7%. The standard deviation is 28%. The
descriptive statistics further suggest that mean return on asset of all the sampled firms
is 0.039. The maximum of return on assets is 0.38 and the minimum is -0.44. The
variability in giving by standard deviation is 0.11. On the other hand, the statistics in
Table 4.11 shows that the mean of the return on capital employed is 0.45 while the
range was recorded between 22.181 to 0.0092 and the standard deviation stood at 1.98.
The average size (log of total assets) which is included as the moderating variable is
7.0 The range of the size as measured by maximum and minimum values from the
table is 8.97 and 5.07 respectively. The level of variability stood at 0.82.
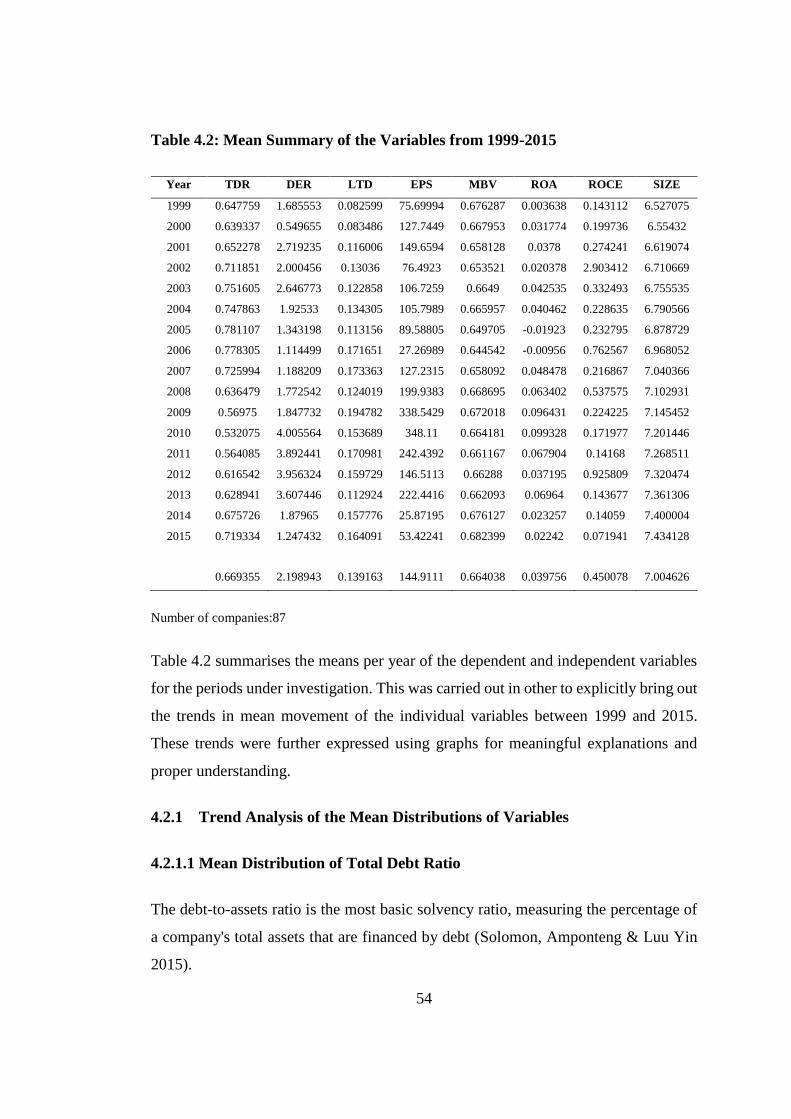
54
Table 4.2: Mean Summary of the Variables from 1999-2015
Year TDR DER LTD EPS MBV ROA ROCE SIZE
1999 0.647759 1.685553 0.082599 75.69994 0.676287 0.003638 0.143112 6.527075
2000 0.639337 0.549655 0.083486 127.7449 0.667953 0.031774 0.199736 6.55432
2001 0.652278 2.719235 0.116006 149.6594 0.658128 0.0378 0.274241 6.619074
2002 0.711851 2.000456 0.13036 76.4923 0.653521 0.020378 2.903412 6.710669
2003 0.751605 2.646773 0.122858 106.7259 0.6649 0.042535 0.332493 6.755535
2004 0.747863 1.92533 0.134305 105.7989 0.665957 0.040462 0.228635 6.790566
2005 0.781107 1.343198 0.113156 89.58805 0.649705 -0.01923 0.232795 6.878729
2006 0.778305 1.114499 0.171651 27.26989 0.644542 -0.00956 0.762567 6.968052
2007 0.725994 1.188209 0.173363 127.2315 0.658092 0.048478 0.216867 7.040366
2008 0.636479 1.772542 0.124019 199.9383 0.668695 0.063402 0.537575 7.102931
2009 0.56975 1.847732 0.194782 338.5429 0.672018 0.096431 0.224225 7.145452
2010 0.532075 4.005564 0.153689 348.11 0.664181 0.099328 0.171977 7.201446
2011 0.564085 3.892441 0.170981 242.4392 0.661167 0.067904 0.14168 7.268511
2012 0.616542 3.956324 0.159729 146.5113 0.66288 0.037195 0.925809 7.320474
2013 0.628941 3.607446 0.112924 222.4416 0.662093 0.06964 0.143677 7.361306
2014 0.675726 1.87965 0.157776 25.87195 0.676127 0.023257 0.14059 7.400004
2015 0.719334 1.247432 0.164091 53.42241 0.682399 0.02242 0.071941 7.434128
0.669355 2.198943 0.139163 144.9111 0.664038 0.039756 0.450078 7.004626
Number of companies:87
Table 4.2 summarises the means per year of the dependent and independent variables
for the periods under investigation. This was carried out in other to explicitly bring out
the trends in mean movement of the individual variables between 1999 and 2015.
These trends were further expressed using graphs for meaningful explanations and
proper understanding.
4.2.1 Trend Analysis of the Mean Distributions of Variables
4.2.1.1 Mean Distribution of Total Debt Ratio
The debt-to-assets ratio is the most basic solvency ratio, measuring the percentage of
a company's total assets that are financed by debt (Solomon, Amponteng & Luu Yin
2015).
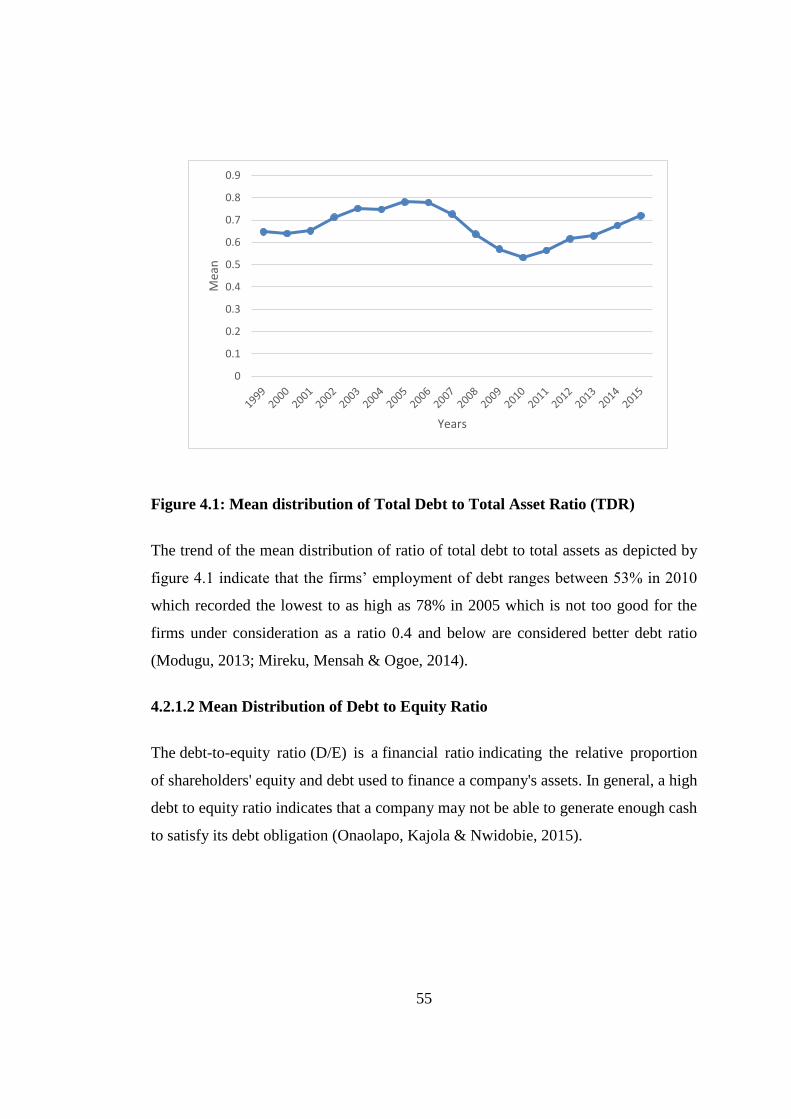
55
Figure 4.1: Mean distribution of Total Debt to Total Asset Ratio (TDR)
The trend of the mean distribution of ratio of total debt to total assets as depicted by
figure 4.1 indicate that the firms’ employment of debt ranges between 53% in 2010
which recorded the lowest to as high as 78% in 2005 which is not too good for the
firms under consideration as a ratio 0.4 and below are considered better debt ratio
(Modugu, 2013; Mireku, Mensah & Ogoe, 2014).
4.2.1.2 Mean Distribution of Debt to Equity Ratio
The debt-to-equity ratio (D/E) is a financial ratio indicating the relative proportion
of shareholders' equity and debt used to finance a company's assets. In general, a high
debt to equity ratio indicates that a company may not be able to generate enough cash
to satisfy its debt obligation (Onaolapo, Kajola & Nwidobie, 2015).
0
0.1
0.2
0.3
0.4
0.5
0.6
0.7
0.8
0.9
Mea
n
Years

56
Figure 4.2: Mean distribution of Total Debt to Total Equity Ratio (DER)
From figure 4.2, the mean distribution from 1999 to 2015 indicate different high levels
of financial leverage above the owner’s contribution except at 2000 which is slightly
above. The implication of this is that the non-financial firms in Nigeria under this
period are very sensitive to financing their activities in relation to shareholders equity
probably depending on the profit they are making to employ more debt than equity as
debt is adjudged to be a cheaper source.
0
0.5
1
1.5
2
2.5
3
3.5
4
4.5
Mea
ns
Years
57
4.2.1.3 Mean Distribution of Long-term Debt Ratio
The long-term debt to total assets ratio is a measurement representing the percentage
of a corporation's assets financed with loans or other financial obligations lasting more
than one year. The ratio provides a general measure of the long-term financial position
of a company, including its ability to meet financial requirements for outstanding loans
(Rahul, 2016).
Figure 4.3: Mean distribution of Long-term Debt to Total Asset (LTD)
The trend of the mean distribution of the long-term debt to total assets ratio shows
fluctuations in its applicability as applied in the capital structure of the non-financial
firms on the NSE. It shows an unstable movement up and down throughout the period
under observation as represented in figure 4.3.
4.2.1.4 Mean Distribution of Earnings Per Share
According to Milad et al. (2013) earnings per share (EPS), is one of the most important
financial statistics that is noteworthy for investors and financial analysts which shows
earnings that the company has achieved in a fiscal period for an ordinary share and
0
0.05
0.1
0.15
0.2
0.25
Mea
ns
Years
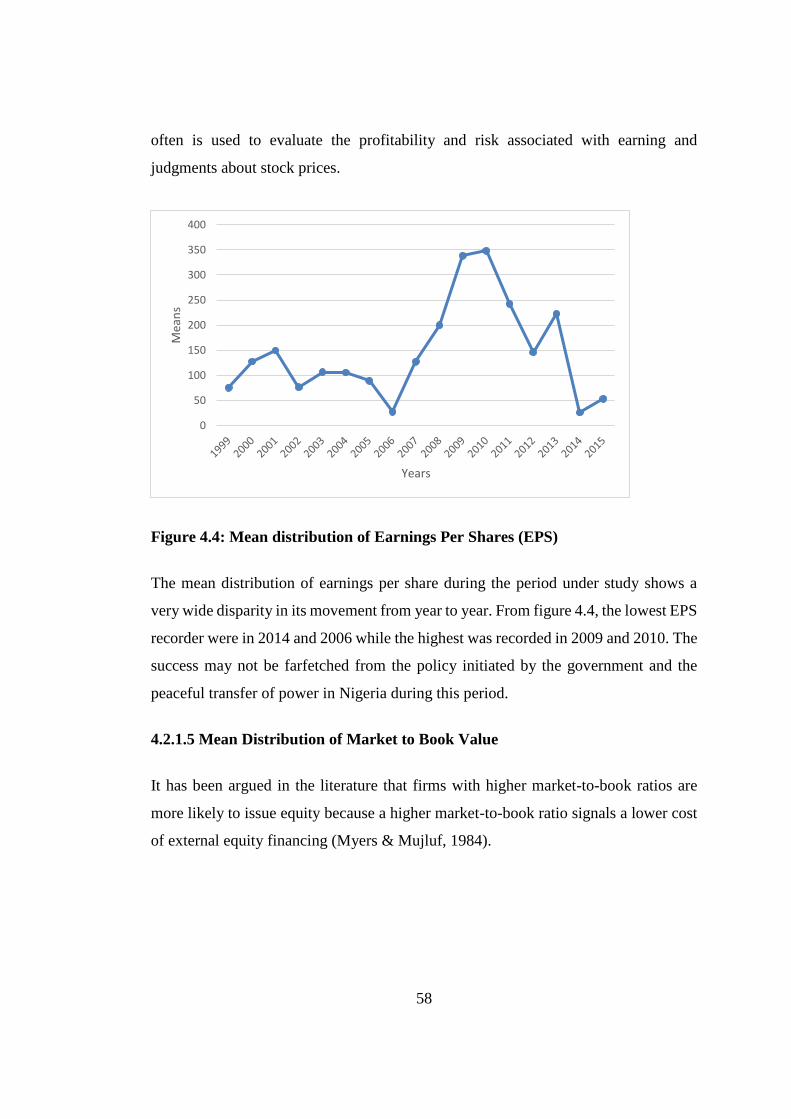
58
often is used to evaluate the profitability and risk associated with earning and
judgments about stock prices.
Figure 4.4: Mean distribution of Earnings Per Shares (EPS)
The mean distribution of earnings per share during the period under study shows a
very wide disparity in its movement from year to year. From figure 4.4, the lowest EPS
recorder were in 2014 and 2006 while the highest was recorded in 2009 and 2010. The
success may not be farfetched from the policy initiated by the government and the
peaceful transfer of power in Nigeria during this period.
4.2.1.5 Mean Distribution of Market to Book Value
It has been argued in the literature that firms with higher market-to-book ratios are
more likely to issue equity because a higher market-to-book ratio signals a lower cost
of external equity financing (Myers & Mujluf, 1984).
0
50
100
150
200
250
300
350
400
Mea
ns
Years
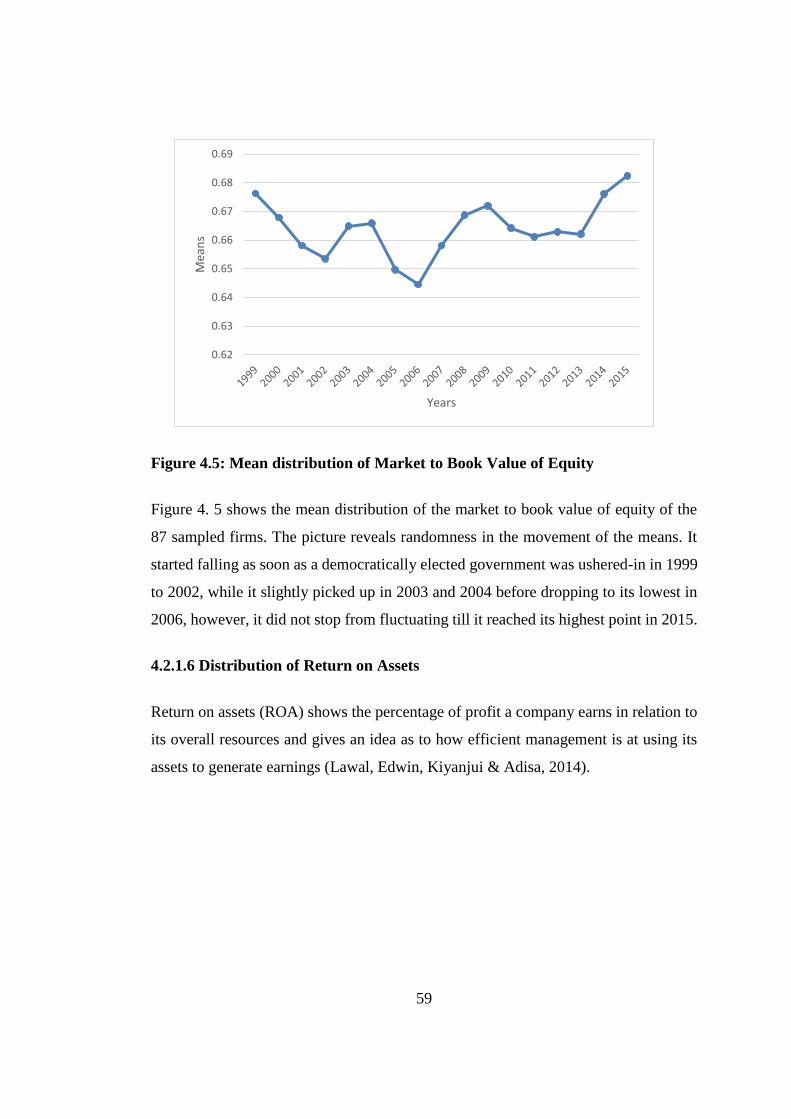
59
Figure 4.5: Mean distribution of Market to Book Value of Equity
Figure 4. 5 shows the mean distribution of the market to book value of equity of the
87 sampled firms. The picture reveals randomness in the movement of the means. It
started falling as soon as a democratically elected government was ushered-in in 1999
to 2002, while it slightly picked up in 2003 and 2004 before dropping to its lowest in
2006, however, it did not stop from fluctuating till it reached its highest point in 2015.
4.2.1.6 Distribution of Return on Assets
Return on assets (ROA) shows the percentage of profit a company earns in relation to
its overall resources and gives an idea as to how efficient management is at using its
assets to generate earnings (Lawal, Edwin, Kiyanjui & Adisa, 2014).
0.62
0.63
0.64
0.65
0.66
0.67
0.68
0.69
Mea
ns
Years
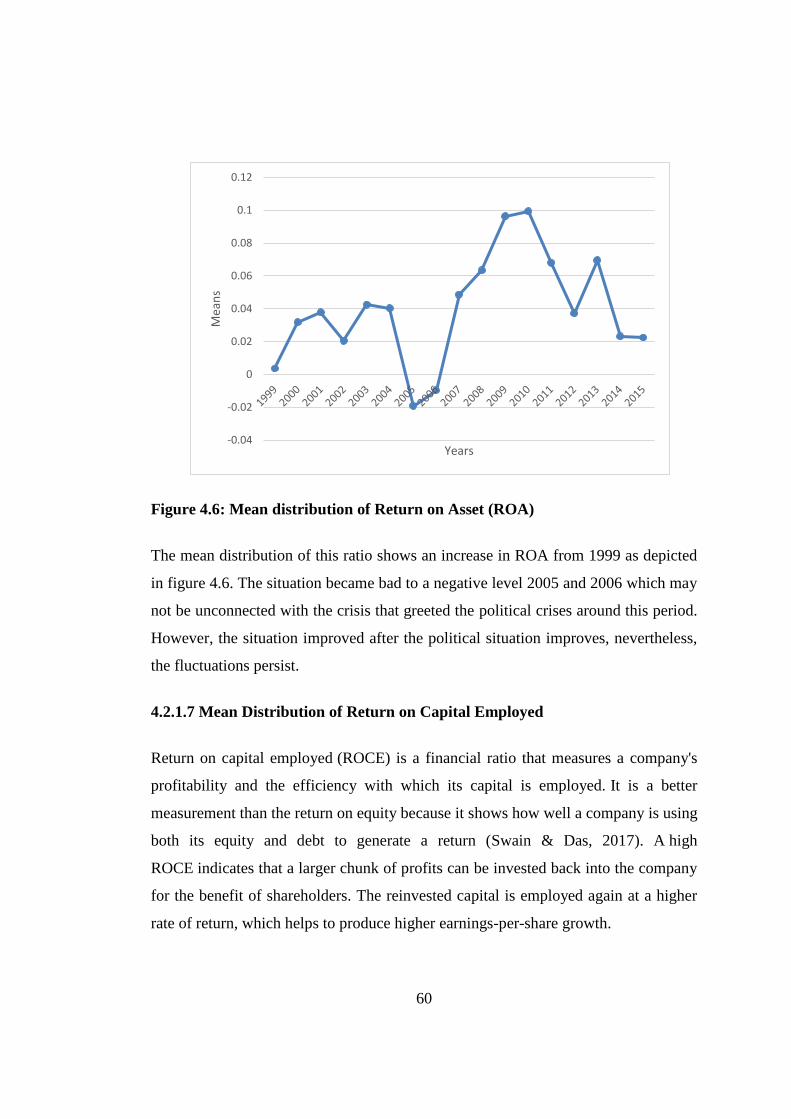
60
Figure 4.6: Mean distribution of Return on Asset (ROA)
The mean distribution of this ratio shows an increase in ROA from 1999 as depicted
in figure 4.6. The situation became bad to a negative level 2005 and 2006 which may
not be unconnected with the crisis that greeted the political crises around this period.
However, the situation improved after the political situation improves, nevertheless,
the fluctuations persist.
4.2.1.7 Mean Distribution of Return on Capital Employed
Return on capital employed (ROCE) is a financial ratio that measures a company's
profitability and the efficiency with which its capital is employed. It is a better
measurement than the return on equity because it shows how well a company is using
both its equity and debt to generate a return (Swain & Das, 2017). A high
ROCE indicates that a larger chunk of profits can be invested back into the company
for the benefit of shareholders. The reinvested capital is employed again at a higher
rate of return, which helps to produce higher earnings-per-share growth.
-0.04
-0.02
0
0.02
0.04
0.06
0.08
0.1
0.12
Mea
ns
Years
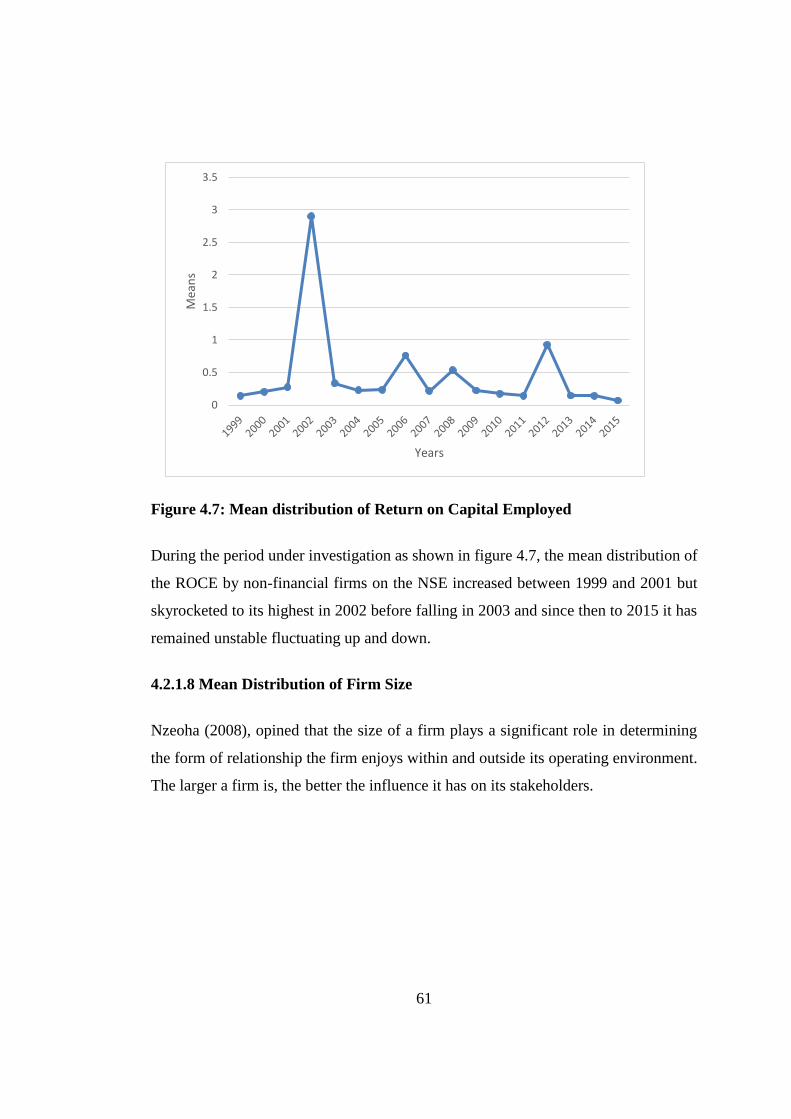
61
Figure 4.7: Mean distribution of Return on Capital Employed
During the period under investigation as shown in figure 4.7, the mean distribution of
the ROCE by non-financial firms on the NSE increased between 1999 and 2001 but
skyrocketed to its highest in 2002 before falling in 2003 and since then to 2015 it has
remained unstable fluctuating up and down.
4.2.1.8 Mean Distribution of Firm Size
Nzeoha (2008), opined that the size of a firm plays a significant role in determining
the form of relationship the firm enjoys within and outside its operating environment.
The larger a firm is, the better the influence it has on its stakeholders.
0
0.5
1
1.5
2
2.5
3
3.5M
ean
s
Years
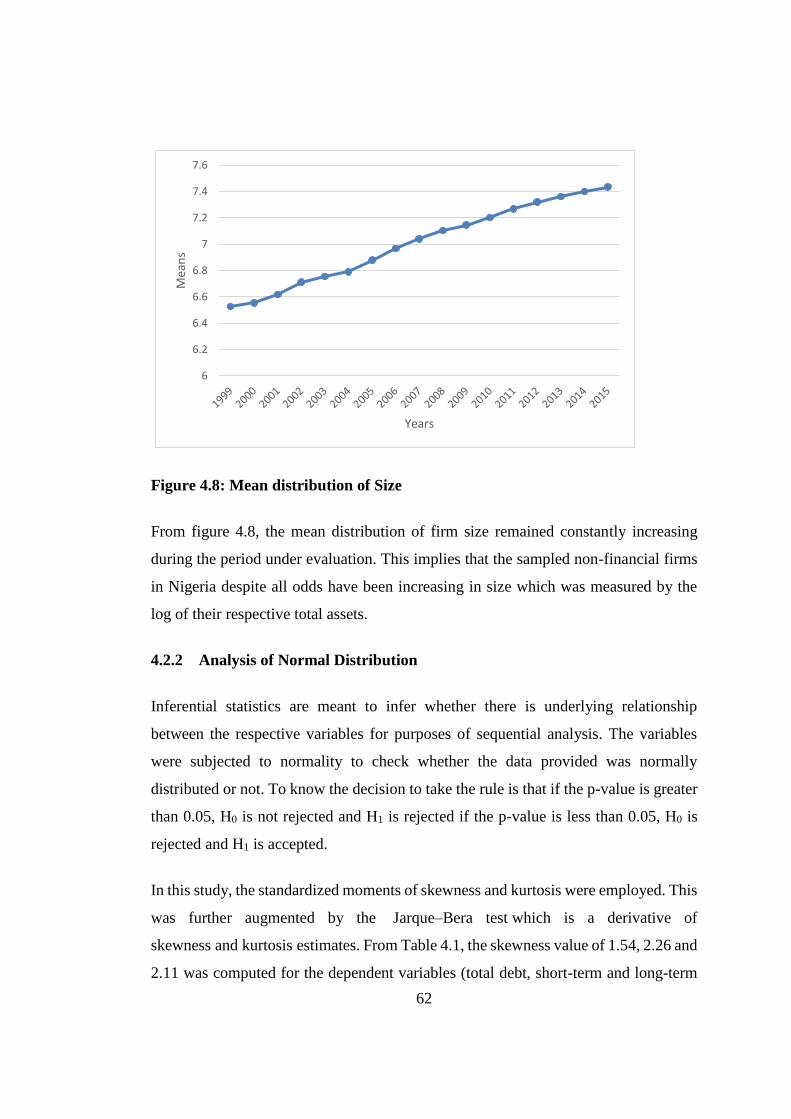
62
Figure 4.8: Mean distribution of Size
From figure 4.8, the mean distribution of firm size remained constantly increasing
during the period under evaluation. This implies that the sampled non-financial firms
in Nigeria despite all odds have been increasing in size which was measured by the
log of their respective total assets.
4.2.2 Analysis of Normal Distribution
Inferential statistics are meant to infer whether there is underlying relationship
between the respective variables for purposes of sequential analysis. The variables
were subjected to normality to check whether the data provided was normally
distributed or not. To know the decision to take the rule is that if the p-value is greater
than 0.05, H0 is not rejected and H1 is rejected if the p-value is less than 0.05, H0 is
rejected and H1 is accepted.
In this study, the standardized moments of skewness and kurtosis were employed. This
was further augmented by the Jarque–Bera test which is a derivative of
skewness and kurtosis estimates. From Table 4.1, the skewness value of 1.54, 2.26 and
2.11 was computed for the dependent variables (total debt, short-term and long-term
6
6.2
6.4
6.6
6.8
7
7.2
7.4
7.6M
ean
s
Years

63
ratio) as shows that TDR, DER, and LTD are positively skewed. The positive skewness
is also enjoyed by earnings per share 0.25 and market to book value of equity 1.58
among the independent variables. However, return on assets, return on capital
employed and the moderating variable are negatively skewed at -1.54, 11.99 and -0.11
respectively. The recorded figures for kurtosis from the total, debt to equity and long-
term leverages to earnings per share, market-book-value of equity return on assets,
return on capital employed and the moderating variable (size) are 6.8, 13.86, 7.5, 9.85,
6.87, 7.74, 145.2 and 2.55 respectively. In conclusion, the probability values obtained
from the Jarque-Bera test statistics result suggest that all the variables failed the
normality at five percent level of significance. In view of this, we cannot reject the null
hypothesis that the data for this analysis is not normally distributed.
4.2.3 Correlation
To determine whether an association exists between the variables employed in the
study, a pairwise correlation analysis was conducted to see the severity of the
relationship. The resulting value in the correlation analysis shows whether the change
in the dependent variable was caused by a change in the independent variable (Cohen,
Cohen, West & Aiken, 2002). Correlation analysis results give a correlation coefficient
which measures the linear association between two variables (Crossman, 2013).
According to Mugenda and Mugenda (2003), correlation technique is used to analyze
the degree of relationship between two variables. Correlation is the measure of the
relationship or association between two continuous numeric variables (Kothari, 2014).
Kothari and Garg (2014) suggest that the value of correlation coefficient ranges
between -1 and +1 and that a correlation coefficient of +1 indicates that two variables
are perfectly in a positive linear relation while a correlation of -1 indicates a perfect
linear negative relationship between two variables and a correlation coefficient of 0
indicates no relationship between two variables.
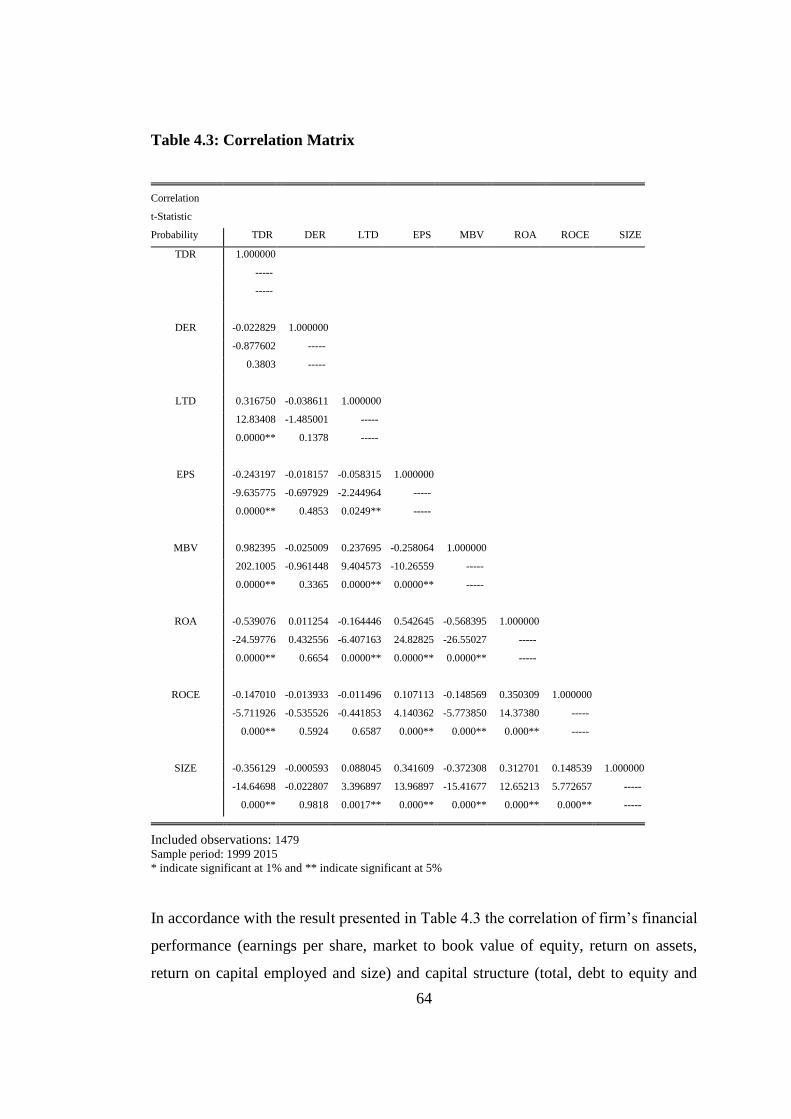
64
Table 4.3: Correlation Matrix
Correlation
t-Statistic
Probability TDR DER LTD EPS MBV ROA ROCE SIZE
TDR 1.000000
-----
-----
DER -0.022829 1.000000
-0.877602 -----
0.3803 -----
LTD 0.316750 -0.038611 1.000000
12.83408 -1.485001 -----
0.0000** 0.1378 -----
EPS -0.243197 -0.018157 -0.058315 1.000000
-9.635775 -0.697929 -2.244964 -----
0.0000** 0.4853 0.0249** -----
MBV 0.982395 -0.025009 0.237695 -0.258064 1.000000
202.1005 -0.961448 9.404573 -10.26559 -----
0.0000** 0.3365 0.0000** 0.0000** -----
ROA -0.539076 0.011254 -0.164446 0.542645 -0.568395 1.000000
-24.59776 0.432556 -6.407163 24.82825 -26.55027 -----
0.0000** 0.6654 0.0000** 0.0000** 0.0000** -----
ROCE -0.147010 -0.013933 -0.011496 0.107113 -0.148569 0.350309 1.000000
-5.711926 -0.535526 -0.441853 4.140362 -5.773850 14.37380 -----
0.000** 0.5924 0.6587 0.000** 0.000** 0.000** -----
SIZE -0.356129 -0.000593 0.088045 0.341609 -0.372308 0.312701 0.148539 1.000000
-14.64698 -0.022807 3.396897 13.96897 -15.41677 12.65213 5.772657 -----
0.000** 0.9818 0.0017** 0.000** 0.000** 0.000** 0.000** -----
Included observations: 1479
Sample period: 1999 2015
* indicate significant at 1% and ** indicate significant at 5%
In accordance with the result presented in Table 4.3 the correlation of firm’s financial
performance (earnings per share, market to book value of equity, return on assets,
return on capital employed and size) and capital structure (total, debt to equity and
65
long-term leverage) were computed. However, proxying earnings per share as a
variable of financial performance against all variables of capital structure established
their correlation coefficient as -0.243, -0.018 and -0.058. These outputs as contained
in Table 4.2 suggests a statistically significant negative relationship exists between
financial performance and capital structure of non-financial companies in the context
of total debt ratio and long-term debt at p-value=0.000, 0.000 <0.05 and an
insignificant conclusion on the part of the debt to equity ratio at a p-value= 0.485>0.05.
The correlation coefficients computed between Market to book value of equity and
capital structure at all level of leverages was established as 0.982, -0.025 and 0.237
respectively. The result revealed a positive and statistically significant relationship
between the MBV, TDR and LTD with a p-value=0.000 < 0.05 in each situation while
a negative and insignificant correlation relationship exist between MBV and DER at
p-value = 0.337. Furthermore, the computed results as displayed in Table 4.3 between
return on the asset as a variable of financial performance against all variables of capital
structure established their correlation coefficients as -0.539, 0.011 and -0.164. The
results indicated that a statistically significant negatively correlated relationship exists
between financial performance and capital structure of non-financial companies in
NSE at p-value=0.000<0.05 at the levels of TDR and LTD while a positively
insignificant correlation was observed between ROA and DER with an associated p-
value=0.664>0.05.
To show the kind of a relationship that existed between the independent variable
measured as return on capital employed and the dependent variable capital structure at
all levels of leverages, the computed correlation coefficients were established as -
0.147, -0.014 and -0.011 respectively. This result as indicated in Table 4.3 suggested
a negatively and statistically significant correlation between return on capital
employed, total debt ratio at a p-value=0.000<0.05. It further reveals a negative but
statistically insignificant relationship between ROCE, DER and LTD at a p-
value=0.592 and 0.658>0.05. On the other hand, firm size was included as a
moderating variable to expand the reliability of this studies and what invariable may
be its effects on the explanatory variables in influencing capital structure of non-
66
financial companies in the NSE. A cursory look at Table 4.2 revealed a statistically
significant negative correlation between size, total debt, debt to equity ratio and market
to book value of equity as established by the correlation coefficients of -0.356, -0.439
and -0.372 respectively and a p-value=0.000<0.05 in all cases. A further assessment
of the relationship showed statistically significant positively related correlation exists
between size, long-term leverage, assets turn over, earnings per share, return on assets
and return on capital employed. The correlation coefficient from Table 4.3 do establish
this suggestion at the values of 0.080, 0.168, 0.341, 0.313 and 0.149 with a p-
value=0.000<0.05 in all ramifications. However, none of these relationships either
negative or positive could be expressed beyond 38% as they ranged between 37.2%
and 8%.
4.3 Panel Specification Test
To determine the suitability of the panel data for statistical analysis, various tests were
conducted. These tests that were carried out to establish if the panel data fulfilled the
cardinal requirements of classical linear regression analysis include visual plot
presentation, panel unit root test, multicollinearity test, panel-level heteroscedasticity
test, serial correlation test as well as the Hausman effect test. In addition, panel
cointegration test was conducted to determine if the variables used in the study had a
long run association. This section, therefore, presents the results of these various
diagnostic tests carried out on the panel data.
4.3.1 Visual Plot
Visual plot helps to visualize the trend of the panel regression variables (Green, 2008).
The visual plot inherent describes a way to verify and to present, the behaviour of a
data set based on a user’s interactively defined set of properties, over which the records
will be confronted in order to determine their importance according to what was stated
as important by the user, that is, to what is more relevant to the analyst. This procedure
permits the verification, the discovering and the validation of hypothesis, providing a
data insight capable of revealing essential features of the data (Rodrigues, Traina &
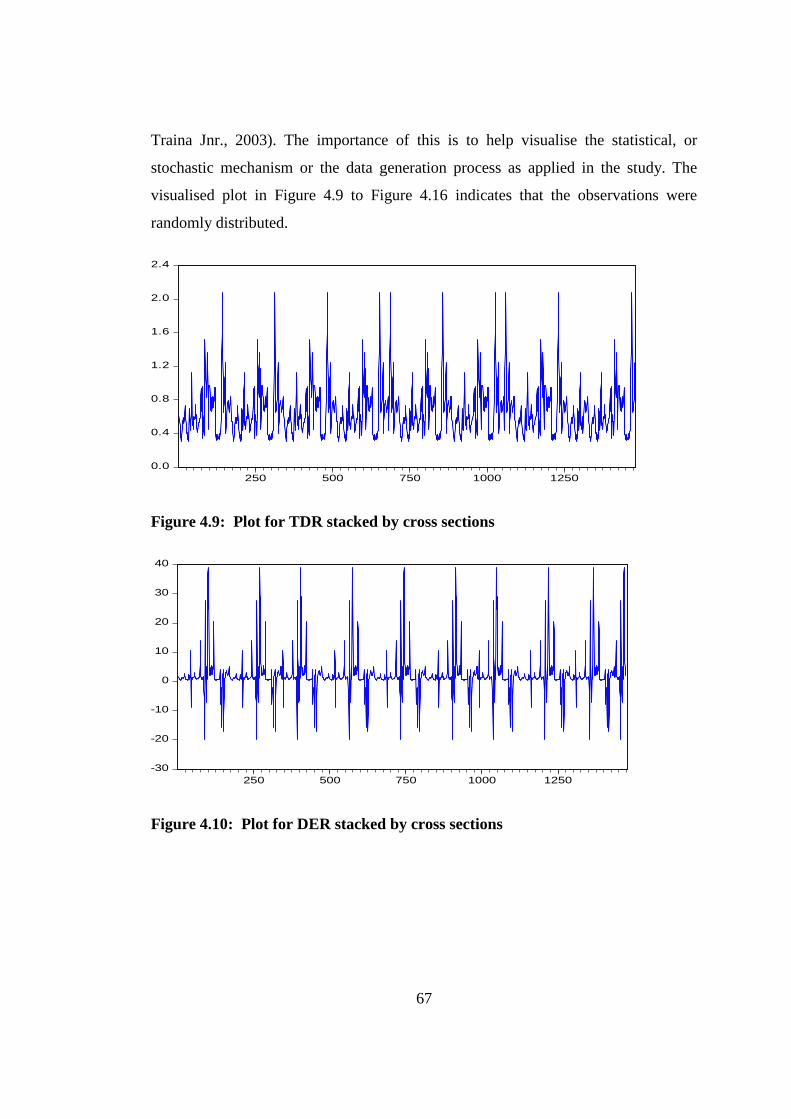
67
Traina Jnr., 2003). The importance of this is to help visualise the statistical, or
stochastic mechanism or the data generation process as applied in the study. The
visualised plot in Figure 4.9 to Figure 4.16 indicates that the observations were
randomly distributed.
0.0
0.4
0.8
1.2
1.6
2.0
2.4
250 500 750 1000 1250
Figure 4.9: Plot for TDR stacked by cross sections
-30
-20
-10
0
10
20
30
40
250 500 750 1000 1250
Figure 4.10: Plot for DER stacked by cross sections
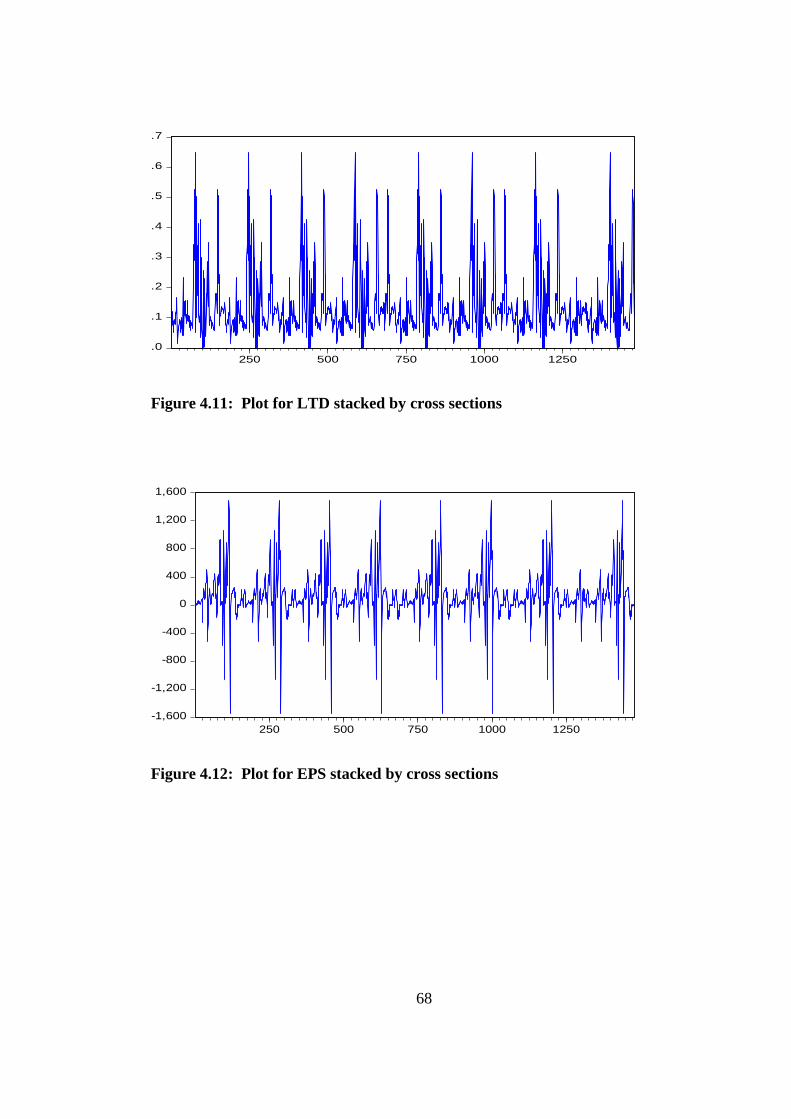
68
.0
.1
.2
.3
.4
.5
.6
.7
250 500 750 1000 1250
Figure 4.11: Plot for LTD stacked by cross sections
-1,600
-1,200
-800
-400
0
400
800
1,200
1,600
250 500 750 1000 1250
Figure 4.12: Plot for EPS stacked by cross sections

69
0.0
0.4
0.8
1.2
1.6
2.0
2.4
250 500 750 1000 1250
Figure 4.13: Plot for MBV stacked by cross sections
-.5
-.4
-.3
-.2
-.1
.0
.1
.2
.3
.4
250 500 750 1000 1250
Figure 4.14: Plot for ROA stacked by cross sections

70
0
4
8
12
16
20
24
250 500 750 1000 1250
Figure 4.15: Plot for ROCE stacked by cross sections
5.2
5.6
6.0
6.4
6.8
7.2
7.6
8.0
8.4
8.8
9.2
250 500 750 1000 1250
Figure 4.16: Plot for SIZE stacked by cross sections
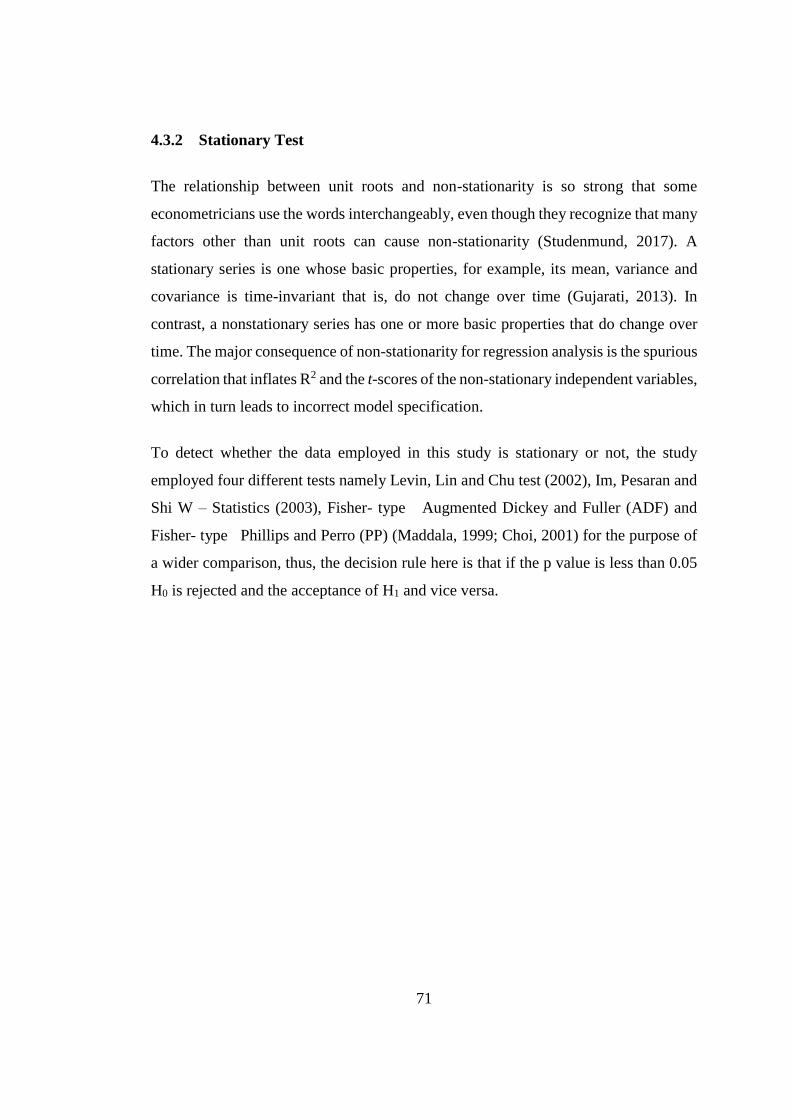
71
4.3.2 Stationary Test
The relationship between unit roots and non-stationarity is so strong that some
econometricians use the words interchangeably, even though they recognize that many
factors other than unit roots can cause non-stationarity (Studenmund, 2017). A
stationary series is one whose basic properties, for example, its mean, variance and
covariance is time-invariant that is, do not change over time (Gujarati, 2013). In
contrast, a nonstationary series has one or more basic properties that do change over
time. The major consequence of non-stationarity for regression analysis is the spurious
correlation that inflates R2 and the t-scores of the non-stationary independent variables,
which in turn leads to incorrect model specification.
To detect whether the data employed in this study is stationary or not, the study
employed four different tests namely Levin, Lin and Chu test (2002), Im, Pesaran and
Shi W – Statistics (2003), Fisher- type Augmented Dickey and Fuller (ADF) and
Fisher- type Phillips and Perro (PP) (Maddala, 1999; Choi, 2001) for the purpose of
a wider comparison, thus, the decision rule here is that if the p value is less than 0.05
H0 is rejected and the acceptance of H1 and vice versa.

72
Table 4.4: Panel Unit root test
Variables Test Statistic P** Result
Total Debt Leverage Levin, Lin & Chu t -9.83253 0.000 Stationary
Im, Pesaran & Shin W- Stat -12.0651 0.000 Stationary
Fisher ADF- Chi 459.996 0.000 Stationary
Fisher PP – Chi 953.837 0.000 Stationary
Debt to Equity Levin, Lin & Chu t -0.9666 0.000 Stationary
Im, Pesaran & Shin W- Stat -9.91981 0.000 Stationary
Fisher ADF- Chi 406.430 0.000 Stationary
Fisher PP – Chi 1102.19 0.000 Stationary
Long-term Leverage Levin, Lin & Chu t -5.62723 0.000 Stationary
Im, Pesaran & Shin W- Stat -9.74583 0.000 Stationary
Fisher ADF- Chi 409.997 0.000 Stationary
Fisher PP – Chi 1118.70 0.000 Stationary
Earnings per share Levin, Lin & Chu t -13.5962 0.000 Stationary
Im, Pesaran & Shin W- Stat -14.3378 0.000 Stationary
Fisher ADF- Chi 531.397 0.000 Stationary
Fisher PP – Chi 939.086 0.000 Stationary
Market to Book value Levin, Lin & Chu t -13.4108 0.000 Stationary
of equity Im, Pesaran & Shin W- Stat -13.0803 0.000 Stationary
Fisher ADF- Chi 494.785 0.000 Stationary
Fisher PP – Chi 1520.85 0.000 Stationary
Return on Assets Levin, Lin & Chu t -8.96954 0.000 Stationary
Im, Pesaran & Shin W- Stat -11.5695 0.000 Stationary
Fisher ADF- Chi 443.414 0.000 Stationary
Fisher PP – Chi 904.083 0.000 Stationary
Return on capital employed Levin, Lin & Chu t -12.3152 0.000 Stationary
Im, Pesaran & Shin W- Stat -8.84827 0.000 Stationary
Fisher ADF- Chi 368.000 0.000 Stationary
Fisher PP – Chi 505.773 0.000 Stationary
Size Levin, Lin & Chu t -7.18236 0.000 Stationary
Im, Pesaran & Shin W- Stat -15.4211 0.000 Stationary
Fisher ADF- Chi 596.219 0.000 Stationary
Fisher PP – Chi 2581.97 0.000 Stationary
Group Levin, Lin & Chu t -72.9743 0.000 Stationary
Im, Pesaran & Shin W- Stat -57.9401 0.000 Stationary
Fisher ADF- Chi 700.026 0.000 Stationary
Fisher PP – Chi 961.179 0.000 Stationary
** Probabilities for Fisher tests are computed using an asymptotic Chi-square
distribution. All other tests assume asymptotic normality
The output on Table 4.4 was based on the LLC, Im, Persaran & Shin W-Sta, Fisher-
type ADF and Fisher-type PP panel unit root test results carried out on the each of the
variables and the entire group. As may be seen from the earlier formulated hypothesis,
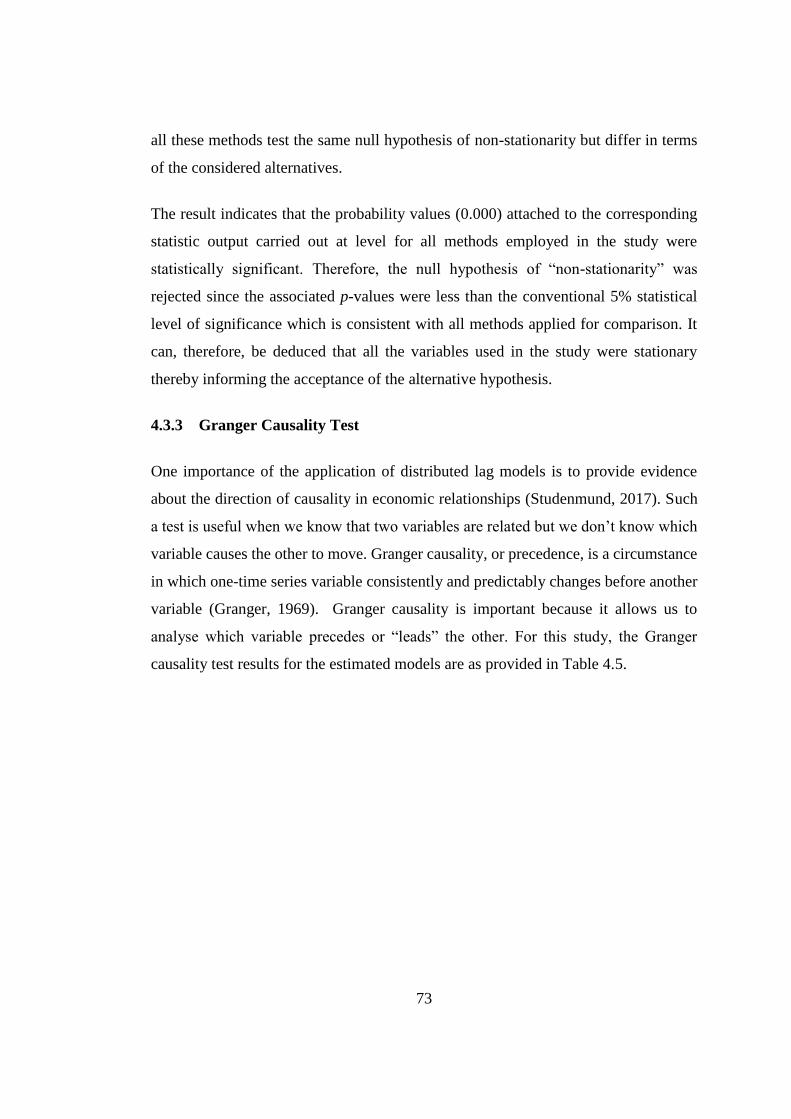
73
all these methods test the same null hypothesis of non-stationarity but differ in terms
of the considered alternatives.
The result indicates that the probability values (0.000) attached to the corresponding
statistic output carried out at level for all methods employed in the study were
statistically significant. Therefore, the null hypothesis of “non-stationarity” was
rejected since the associated p-values were less than the conventional 5% statistical
level of significance which is consistent with all methods applied for comparison. It
can, therefore, be deduced that all the variables used in the study were stationary
thereby informing the acceptance of the alternative hypothesis.
4.3.3 Granger Causality Test
One importance of the application of distributed lag models is to provide evidence
about the direction of causality in economic relationships (Studenmund, 2017). Such
a test is useful when we know that two variables are related but we don’t know which
variable causes the other to move. Granger causality, or precedence, is a circumstance
in which one-time series variable consistently and predictably changes before another
variable (Granger, 1969). Granger causality is important because it allows us to
analyse which variable precedes or “leads” the other. For this study, the Granger
causality test results for the estimated models are as provided in Table 4.5.

74
Table 4.5: Granger causality test between financial performance variables and
Capital structure (Total Debt)
The summary of the Granger causality results at lag 1 in Table 4.5 (model 1) suggests
a bidirectional relationship exit between the dependent variable as measured by total
leverage and independent variables as measured by earnings per share and size. The
Granger causality statistics computed proved that no causal relationship however little
exists between total leverage, market to book value of equity and return on assets.
Meanwhile, in the case of return on capital employed, a unidirectional relationship was
established. That is, the return on capital employed does Granger cause total leverage
while total leverage does not Granger cause return on capital employed.
Model Null Hypothesis:
F-
Statistic Prob. Result
Model 1 EPS does not Granger Cause TDR 6.20895 0.0128 Reject
TDR does not Granger Cause EPS 5.34481 0.0209 Reject
MBV does not Granger Cause TDR 0.41328 0.5204 Fail to
Reject
TDR does not Granger Cause MBV 0.08561 0.7699 Fail to
Reject
ROA does not Granger Cause TDR 0.36064 0.5482 Fail to
Reject
TDR does not Granger Cause ROA 0.35078 0.5538 Fail to
Reject
ROCE does not Granger Cause TDR 10.3263 0.0013 Reject
TDR does not Granger Cause ROCE 0.37553 0.5401 Fail to
Reject
SIZE does not Granger Cause TDR 33.0015 1.E-08 Reject
TDR does not Granger Cause SIZE 32.9364 1.E-08 Reject

75
Table 4.6: Granger causality test between financial performance variables and
Capital structure (Debt to Equity Ratio)
Model Null Hypothesis:
F-
Statistic Prob. Result
Model 2 EPS does not Granger Cause DER 0.01884 0.8909 Fail to
reject
DER does not Granger Cause EPS 1.08992 0.2967 Fail to
reject
MBV does not Granger Cause DER 3.17663 0.0749 Fail to
reject
DER does not Granger Cause MBV 2.32362 0.1277 Fail to
reject
ROA does not Granger Cause DER 2.57219 0.1090 Fail to
reject
DER does not Granger Cause ROA 0.01480 0.9032 Fail to
reject
ROCE does not Granger Cause DER 0.58762 0.4435 Fail to
reject
DER does not Granger Cause ROCE 0.01374 0.9067 Fail to
reject
SIZE does not Granger Cause DER 0.08625 0.7690 Fail to
reject
DER does not Granger Cause SIZE 1.04665 0.3065 Fail to
reject
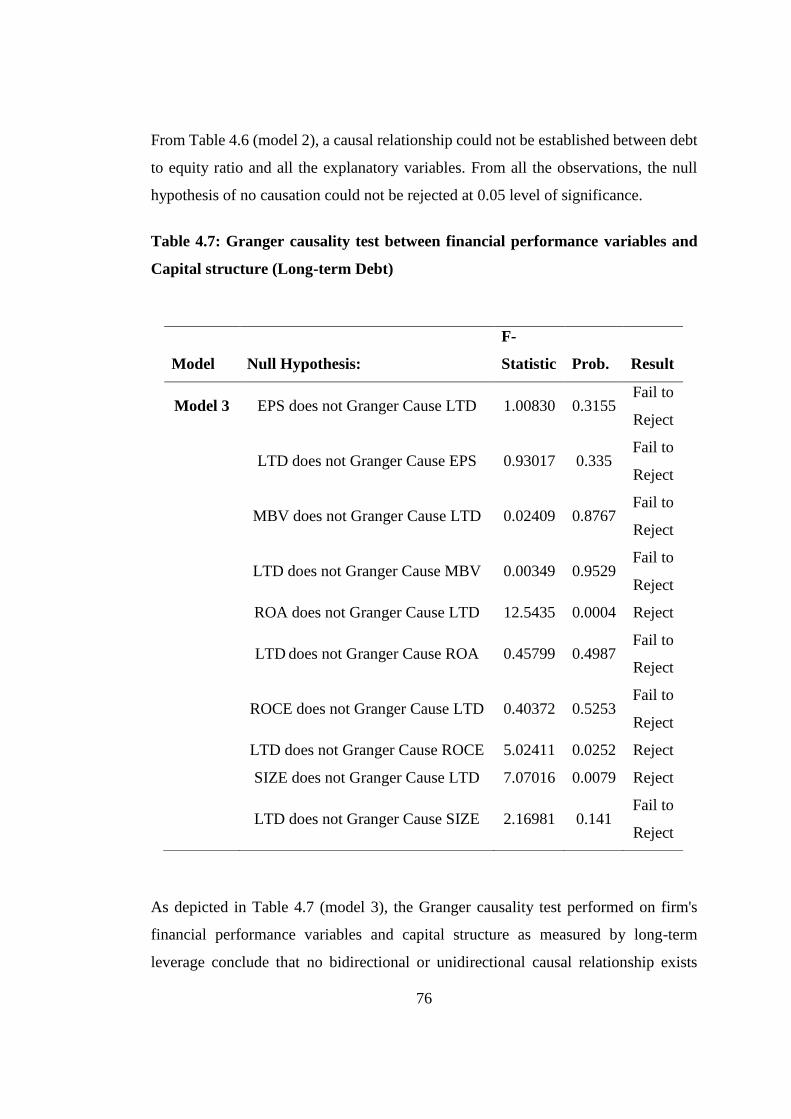
76
From Table 4.6 (model 2), a causal relationship could not be established between debt
to equity ratio and all the explanatory variables. From all the observations, the null
hypothesis of no causation could not be rejected at 0.05 level of significance.
Table 4.7: Granger causality test between financial performance variables and
Capital structure (Long-term Debt)
As depicted in Table 4.7 (model 3), the Granger causality test performed on firm's
financial performance variables and capital structure as measured by long-term
leverage conclude that no bidirectional or unidirectional causal relationship exists
Model Null Hypothesis:
F-
Statistic Prob. Result
Model 3 EPS does not Granger Cause LTD 1.00830 0.3155 Fail to
Reject
LTD does not Granger Cause EPS 0.93017 0.335 Fail to
Reject
MBV does not Granger Cause LTD 0.02409 0.8767 Fail to
Reject
LTD does not Granger Cause MBV 0.00349 0.9529 Fail to
Reject
ROA does not Granger Cause LTD 12.5435 0.0004 Reject
LTD does not Granger Cause ROA 0.45799 0.4987 Fail to
Reject
ROCE does not Granger Cause LTD 0.40372 0.5253 Fail to
Reject
LTD does not Granger Cause ROCE 5.02411 0.0252 Reject
SIZE does not Granger Cause LTD 7.07016 0.0079 Reject
LTD does not Granger Cause SIZE 2.16981 0.141 Fail to
Reject

77
between long-term leverage earnings per share and market to book value of equity.
Nevertheless, the analysis could establish a unidirectional relationship between long-
term leverage, return on assets, return on capital employed and size. Precisely it
concludes that return on assets granger causes long-term leverage while long-term
leverage does not Granger cause return on assets. While the latter situation applies to
size and long-term leverage the relationship between return on capital employed and
long-term leverage differs, it was established that return on capital employed does not
Granger causes long-term leverage while long-term leverage granger causes return on
capital employed.
4.3.4 Multicollinearity Test
Multicollinearity arises when a linear relationship exists between two or more
independent variables in a regression model (Pedace, 2013). It is a statistical situation
where some independent variables in a multiple regression model are highly
correlated. It is an unacceptable high level of intercorrelation among the independent
variables, such that effects of independent variables cannot be separated (Garson,
2012). According to Lauridsen and Mur (2005), when multicollinearity occurs the
correlated predictors provide redundant information about the responses. In multiple
regression, the variance inflation factor (VIF) is used as an indicator of
multicollinearity. Variance inflation factor (VIF) is a factor by which the variance of
the given partial regression coefficient increases due to given variable ‘s extent of
correlation with other predictors in the model (Dennis, 2011). As a rule of thumb,
lower levels of variance inflation factor (VIF) are desirable as higher levels of VIF are
known to affect adversely the results associated with multiple regression.
Garson (2012) asserts that the rule of thumb is that VIF > 4.0 multicollinearity is a
problem while other scholars use a more lenient cut-off of VIF > 5.0 when
multicollinearity is a problem. However, O'Brien (2007) suggests that this rule of
thumb should be assessed in contextual basis considering the factors that influence the
variance of the regression coefficient.
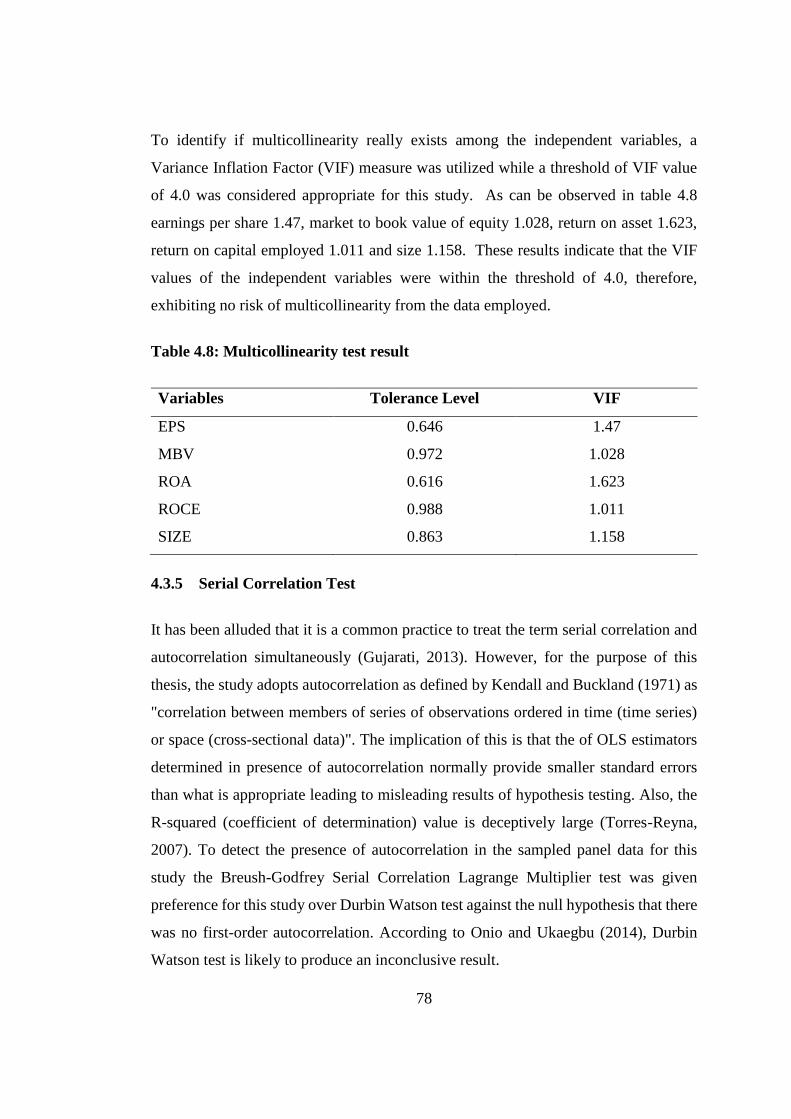
78
To identify if multicollinearity really exists among the independent variables, a
Variance Inflation Factor (VIF) measure was utilized while a threshold of VIF value
of 4.0 was considered appropriate for this study. As can be observed in table 4.8
earnings per share 1.47, market to book value of equity 1.028, return on asset 1.623,
return on capital employed 1.011 and size 1.158. These results indicate that the VIF
values of the independent variables were within the threshold of 4.0, therefore,
exhibiting no risk of multicollinearity from the data employed.
Table 4.8: Multicollinearity test result
Variables Tolerance Level VIF
EPS 0.646 1.47
MBV 0.972 1.028
ROA 0.616 1.623
ROCE 0.988 1.011
SIZE 0.863 1.158
4.3.5 Serial Correlation Test
It has been alluded that it is a common practice to treat the term serial correlation and
autocorrelation simultaneously (Gujarati, 2013). However, for the purpose of this
thesis, the study adopts autocorrelation as defined by Kendall and Buckland (1971) as
"correlation between members of series of observations ordered in time (time series)
or space (cross-sectional data)". The implication of this is that the of OLS estimators
determined in presence of autocorrelation normally provide smaller standard errors
than what is appropriate leading to misleading results of hypothesis testing. Also, the
R-squared (coefficient of determination) value is deceptively large (Torres-Reyna,
2007). To detect the presence of autocorrelation in the sampled panel data for this
study the Breush-Godfrey Serial Correlation Lagrange Multiplier test was given
preference for this study over Durbin Watson test against the null hypothesis that there
was no first-order autocorrelation. According to Onio and Ukaegbu (2014), Durbin
Watson test is likely to produce an inconclusive result.
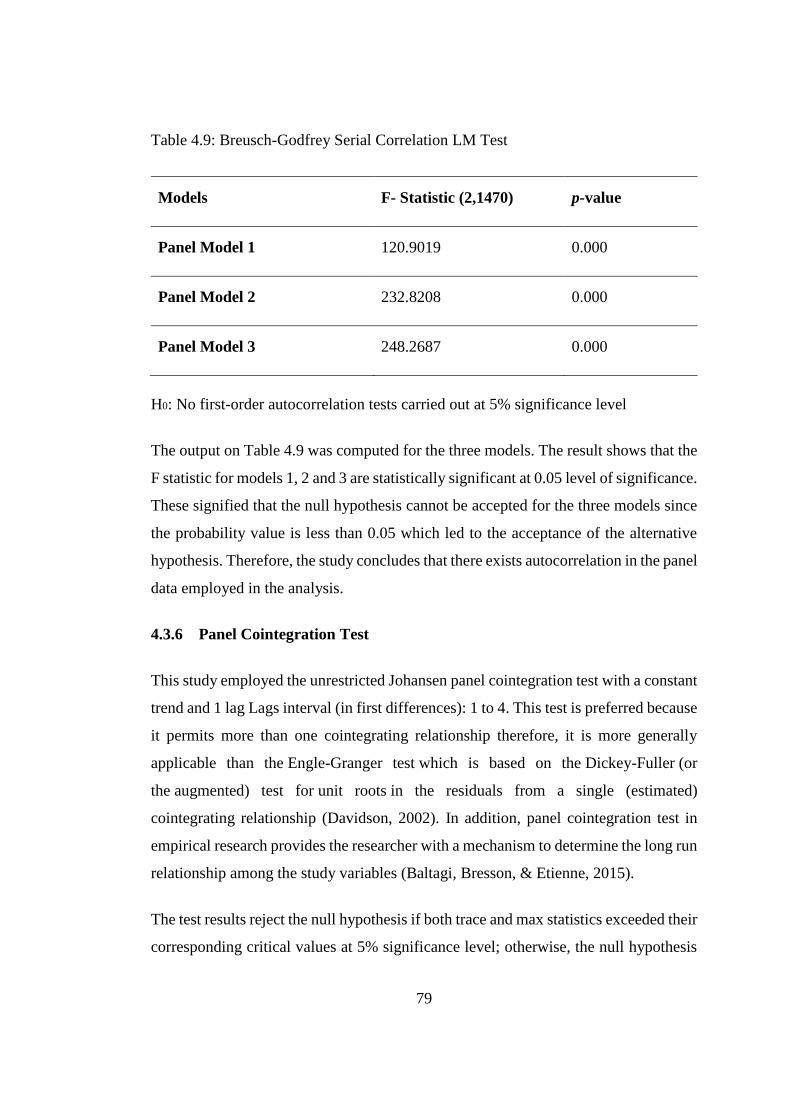
79
Table 4.9: Breusch-Godfrey Serial Correlation LM Test
Models F- Statistic (2,1470) p-value
Panel Model 1 120.9019 0.000
Panel Model 2 232.8208 0.000
Panel Model 3 248.2687 0.000
H0: No first-order autocorrelation tests carried out at 5% significance level
The output on Table 4.9 was computed for the three models. The result shows that the
F statistic for models 1, 2 and 3 are statistically significant at 0.05 level of significance.
These signified that the null hypothesis cannot be accepted for the three models since
the probability value is less than 0.05 which led to the acceptance of the alternative
hypothesis. Therefore, the study concludes that there exists autocorrelation in the panel
data employed in the analysis.
4.3.6 Panel Cointegration Test
This study employed the unrestricted Johansen panel cointegration test with a constant
trend and 1 lag Lags interval (in first differences): 1 to 4. This test is preferred because
it permits more than one cointegrating relationship therefore, it is more generally
applicable than the Engle-Granger test which is based on the Dickey-Fuller (or
the augmented) test for unit roots in the residuals from a single (estimated)
cointegrating relationship (Davidson, 2002). In addition, panel cointegration test in
empirical research provides the researcher with a mechanism to determine the long run
relationship among the study variables (Baltagi, Bresson, & Etienne, 2015).
The test results reject the null hypothesis if both trace and max statistics exceeded their
corresponding critical values at 5% significance level; otherwise, the null hypothesis

80
is accepted. The results of the panel cointegration tests on the variables are presented
in the Table 4.10:
Table 4.10: Johansen Fisher Panel Cointegration Test result
Hypothesized
No. of CE(s)
Fisher Stat.*
(from trace
test) Prob.
Fisher Stat.*
(from Max-
Eigen test) Prob**.
None * 2263.820 0.0001 708.4118 0.0001
At most 1 * 1555.408 0.0001 449.4174 0.0001
At most 2 * 1105.991 0.0001 347.8546 0.0001
At most 3 * 758.1364 0.0001 240.8483 0.0001
At most 4 * 517.2881 0.0001 213.7331 0.0001
At most 5 * 303.5550 0.0001 130.7440 0.0001
At most 6 * 172.8110 0.0001 96.40655 0.0000
At most 7 * 76.40445 0.0000 76.40445 0.0000
Trace and Max-eigenvalue test indicates 8 cointegrating eqn(s) at the 0.05 level
* denotes rejection of the hypothesis at the 0.05 level
**MacKinnon-Haug-Michelis (1999) p-values
The results of Johansen test for cointegration displayed in Table 4.10 indicate that
probability values of trace and Max-Eigen statistics are below the corresponding 5%
critical values at all levels of the variable combination under leverage model. This
suggested that the null hypothesis of no cointegration could be rejected at all levels of
variable combinations of trace and max-eigen tests for the model. The result implied
that the primary variables were cointegrated and therefore have a long-run association.
However, the study employed the dynamic two-step generalized method of moments
by Blundell and Bond (1998). This dynamic estimator does not test for panel unit root

81
and accounts for cointegration among the variables. It assumes the variables do not
have unit root and they cointegrate.
4.3.7 Heteroscedasticity Test
Heteroscedasticity means that previous error terms influence other error terms and
hence violating the statistical assumption that the error terms have a constant variance
But, Homoscedasticity suggests that the dependent variable has an equal level of
variability for each of the values of the independent variables (Garson, 2012). A test
for homoscedasticity is made to test for variance in residuals in the regression model
used. If there exist equal variance of the error terms, we have a normal distribution.
Lack of an equal level of variability for each value of the independent variables is
known as heteroscedasticity, The Breusch–Pagan test developed by Breusch and
Pagan (1979) was used to test for homogeneity in the linear regression model.
From the output in Table 4.11 for the three panel models, it can be observed that an F-
statistic of 12.27910 and probability value of 0.000 was produced for model 1 while
45.94626 (0.000) and 22.62196 (0.000) were produced for models 2 and 3
respectively. With this result, the null hypothesis is rejected at a p-value=0.000<0.05
while the alternative hypothesis indicating that the data is heterogeneous in variance
is accepted. According to Baum, Schaffer and Stillman (2003), the presence of
statistically significant heteroscedasticity will make a General Method of Moment
more efficient.
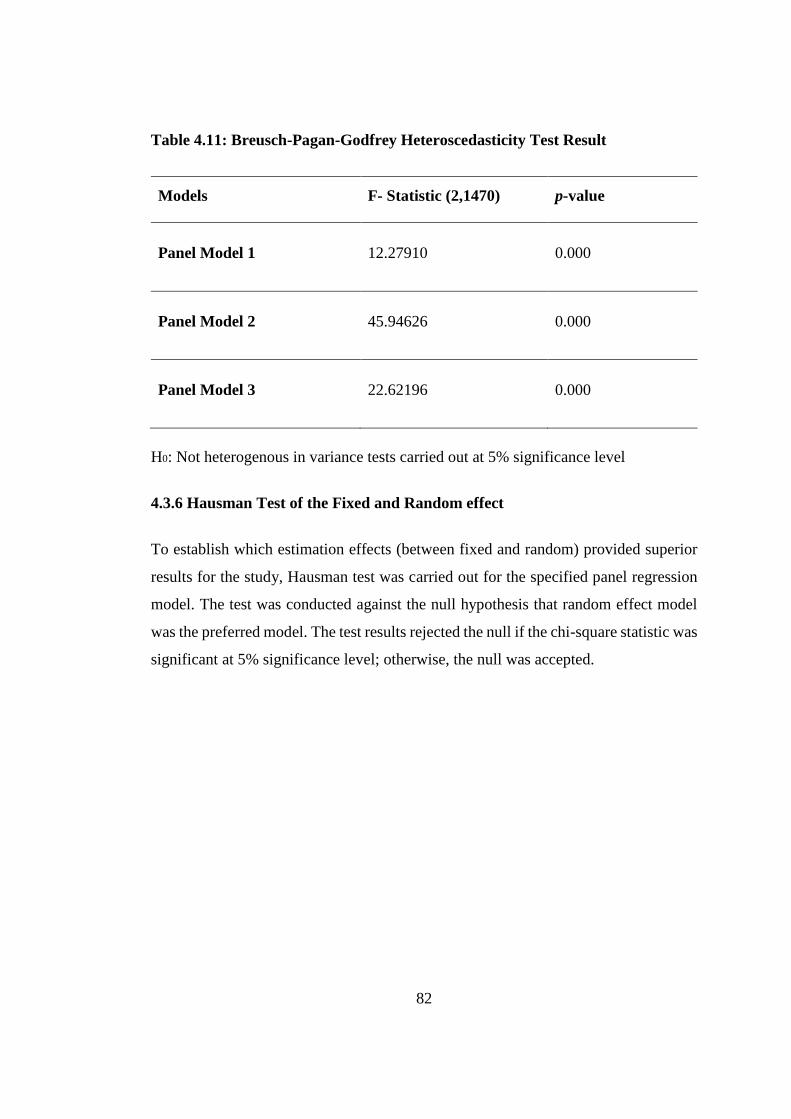
82
Table 4.11: Breusch-Pagan-Godfrey Heteroscedasticity Test Result
Models F- Statistic (2,1470) p-value
Panel Model 1 12.27910 0.000
Panel Model 2 45.94626 0.000
Panel Model 3 22.62196 0.000
H0: Not heterogenous in variance tests carried out at 5% significance level
4.3.6 Hausman Test of the Fixed and Random effect
To establish which estimation effects (between fixed and random) provided superior
results for the study, Hausman test was carried out for the specified panel regression
model. The test was conducted against the null hypothesis that random effect model
was the preferred model. The test results rejected the null if the chi-square statistic was
significant at 5% significance level; otherwise, the null was accepted.

83
Table 4.12: Hausman test result
Model Chi-Square Statistic Chi-Square degree of freedom p-value
1 123.799537 6 0.004
2 208.766887 6 0.000
3 249.693899 6 0.000
H0: Random effects model is appropriate at 0.05 significant level
Table 4.12 display the Hausman specification test results for panel regression
equations. The test results show that the chi-square statistics for the three panel
equations are statistically significant at 5% level as supported by the p-values of 0.004,
0.000 and 0.000 for models 1, 2 and 3 respectively. The study, therefore, rejects the
null hypothesis that the random effects estimation was appropriate for the model at
0.05 significance level. Nevertheless, the fixed effect (FEM) and random effect (REM)
estimators are also biased and inconsistent unless the number of time periods is large
n ≥ 30 (Baltagi, 2002). Moreover, the period included in this study is 15 years,
effectively, the study estimated the panel equations for dynamic GMM.
4.4 Panel Regression Analysis
Panel (or longitudinal) data are cross-sectional and time-series. There are multiple
entities, each of which has repeated measurements at different time periods (Park,
2009). A panel dataset contains n entities or subjects (e.g., firms and states), each of
which includes T observations measured at 1 through t time period. The combination
of time series and cross-sectional data enhances the quality and quantity of data
employed in this study in ways that would be impossible using only one of these data

84
set. Models like the constant coefficient model, fixed and random effect model among
others have been applied in various context to estimate panel regression analysis,
however, the application and appropriateness of these models are limited when time
lag is accounted for in a panel regression. A purely distributed lag model can be
estimated by the OLS but can have limited use in the presence of multicollinearity.
In guiding against the earlier mentioned inefficiency of the other panel regression
models in handling time lag, various dynamic models were assessed but the choice of
the Arellano-Bond linear GMM estimators was preferred for this study. The model has
a one- and two-step variants even though, a lot of applied work has been done with
focus on results from the one-step estimator than the two-step estimator, simulation
studies have suggested very modest efficiency gains from using the two-step version,
even in the presence of considerable heteroskedasticity (Ledyaeva & Linden, 2006).
As suggested by White (1980), the two-step uses the residuals of the one-step
estimation to estimate the covariance matrix and that makes it a preferred option for
this study. To this end, the capital structure as captured by leverage was decomposed
into three from where three leverage models were constructed and estimated for each
of the earlier stated objectives in chapter one. This is in anticipation of a robust
conclusion from this study.
4.4.1 Effect of Earnings Per Share on Capital Structure
The formulated null hypothesis was that Earnings per Share (performance) has no
significant effect on Capital structure (Leverage: TDR, DER, LTD). To validate or
otherwise this hypothesis a thorough analysis using Earnings per Share performance
indicator as a predictor variable. The results of the thorough analysis that was
conducted are presented in Table 4.13.

85
Table 4.13: Two-step dynamic GMM estimated results of the effect of Earnings
Per Share (performance) on Capital Structure
Dependent Variables TDR, DER and LTD
Explanatory variables Model1 Model2 Model3
CSit-1 0.892248
(0.000)
0.439197
(0.000)
0.801192
(0.000)
EPSit-1 -5.50E-05
(0.000)**
0.003982
(0.000)**
0.000225
(0.000)**
Observation 1305 1305 1305
Companies 87 87 87
Periods included 15 15 15
Instrument rank 40 57 40
Arellano and Bond AR (2) 0.261 0.579 0.228
Hansen Test p-value 0.388 0.314 0.579
Models 1, 2 & 3 Total debt to Total assets, Total Debt to Total Equity & Long-term debt to Total assets leverage models
* indicate significant at 1% and ** indicate significant at 5%
The output in Table 4.13 shows a negative significant relationship between financial
performance as measured by Earnings Per shares and Capital Structure (total leverage
to the total asset). The estimated result pulled a coefficient of -5.50E-05 and a
corresponding p-value of 0.000. For the estimated model1 the Arellano and Bond
(AR2) test of second-order autocorrelation shows a value of 0.261 which is greater
than 0.05 which suggested the absence of second-order autocorrelation, denotating that
the model was correctly specified. The Hansen test of instrument validity and first
difference condition shows probability value of 0.388 suggesting that the instruments
used in the estimated model are valid instruments since the probability value of the
Hansen test was greater than 0.1. The estimated model maintained the rule of the
thumb as regard instruments and groups. The number of the instrument is expected to

86
be less or equal to the number of groups. The estimated result shows that the number
of instruments is less than the number of groups.
To further validate the effect, of financial performance in the context of EPS on capital
structure, as measured by DER. The estimated result of model 2 indicates that a
statistically significant positive relationship exists between firm performance (EPS)
and capital structure (TDR). The estimated result produced a coefficient of 0.003982
and P value of 0.000. The Arellano and Bond tests of autocorrelation show (AR2)
value of 0.579 which is greater than 0.05 connotes the absence of second-order
autocorrelation suggesting that the model is correctly specified. The Hansen test of
instrument validity at first difference shows probability value that is not less than 0.1
which stood at 0.314. This suggests that the instruments used in the estimated models
are valid instruments while the instrument ranking further satisfied the rule of the
thumb that the number of the instrument should be less or equal to the number of
groups.
In addition, to strengthen and expand the horizon of the study in determining the effect
of financial performance in the context of EPS on capital structure using long-term
debt to total assets as a measure of leverage, the estimated result of model 3 in Table
4.13, revealed that a statistically significant positive relationship exists between firm
financial performance (EPS) and capital structure (long-term leverage). This is
confirmed by a coefficient value of 0.00225 and an associated P value of 0.000. The
Arellano and Bond tests of autocorrelation show (AR2) value of 0.329. Since this
autocorrelation value is greater than 0.05 the implication is that the problem of second-
order autocorrelation does not exist meaning the model was correctly specified. The
Hansen test of instrument validity at first differencing produced a probability value of
0.579 which is greater than 0.1 connoting that the instruments used in the estimated
models are valid instruments which were further satisfied by the rule of the thumb that
the number of the instrument should be less or equal to the number of groups.
The consequence of the negative significant relationship found between firm
performance (EPS) and capital structure proxied by total debt ratio is that the capital
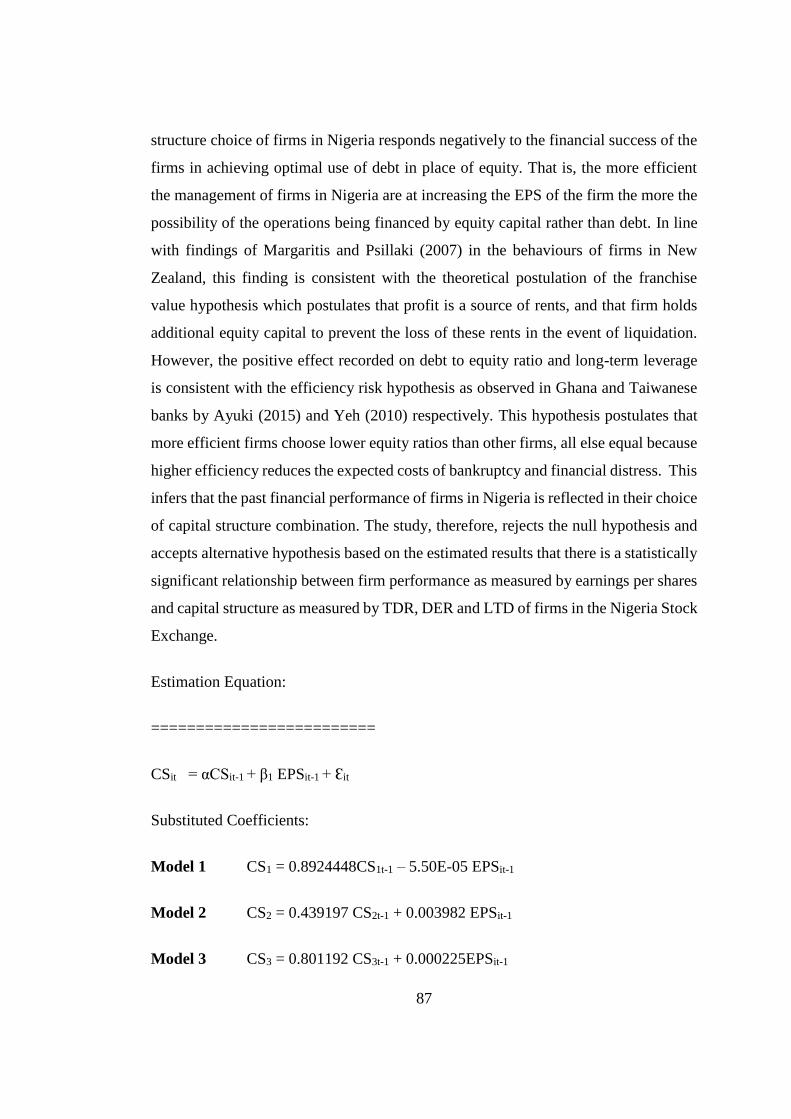
87
structure choice of firms in Nigeria responds negatively to the financial success of the
firms in achieving optimal use of debt in place of equity. That is, the more efficient
the management of firms in Nigeria are at increasing the EPS of the firm the more the
possibility of the operations being financed by equity capital rather than debt. In line
with findings of Margaritis and Psillaki (2007) in the behaviours of firms in New
Zealand, this finding is consistent with the theoretical postulation of the franchise
value hypothesis which postulates that profit is a source of rents, and that firm holds
additional equity capital to prevent the loss of these rents in the event of liquidation.
However, the positive effect recorded on debt to equity ratio and long-term leverage
is consistent with the efficiency risk hypothesis as observed in Ghana and Taiwanese
banks by Ayuki (2015) and Yeh (2010) respectively. This hypothesis postulates that
more efficient firms choose lower equity ratios than other firms, all else equal because
higher efficiency reduces the expected costs of bankruptcy and financial distress. This
infers that the past financial performance of firms in Nigeria is reflected in their choice
of capital structure combination. The study, therefore, rejects the null hypothesis and
accepts alternative hypothesis based on the estimated results that there is a statistically
significant relationship between firm performance as measured by earnings per shares
and capital structure as measured by TDR, DER and LTD of firms in the Nigeria Stock
Exchange.
Estimation Equation:
=========================
CSit = αCSit-1 + β1 EPSit-1 + Ɛit
Substituted Coefficients:
Model 1 CS1 = 0.8924448CS1t-1 – 5.50E-05 EPSit-1
Model 2 CS2 = 0.439197 CS2t-1 + 0.003982 EPSit-1
Model 3 CS3 = 0.801192 CS3t-1 + 0.000225EPSit-1
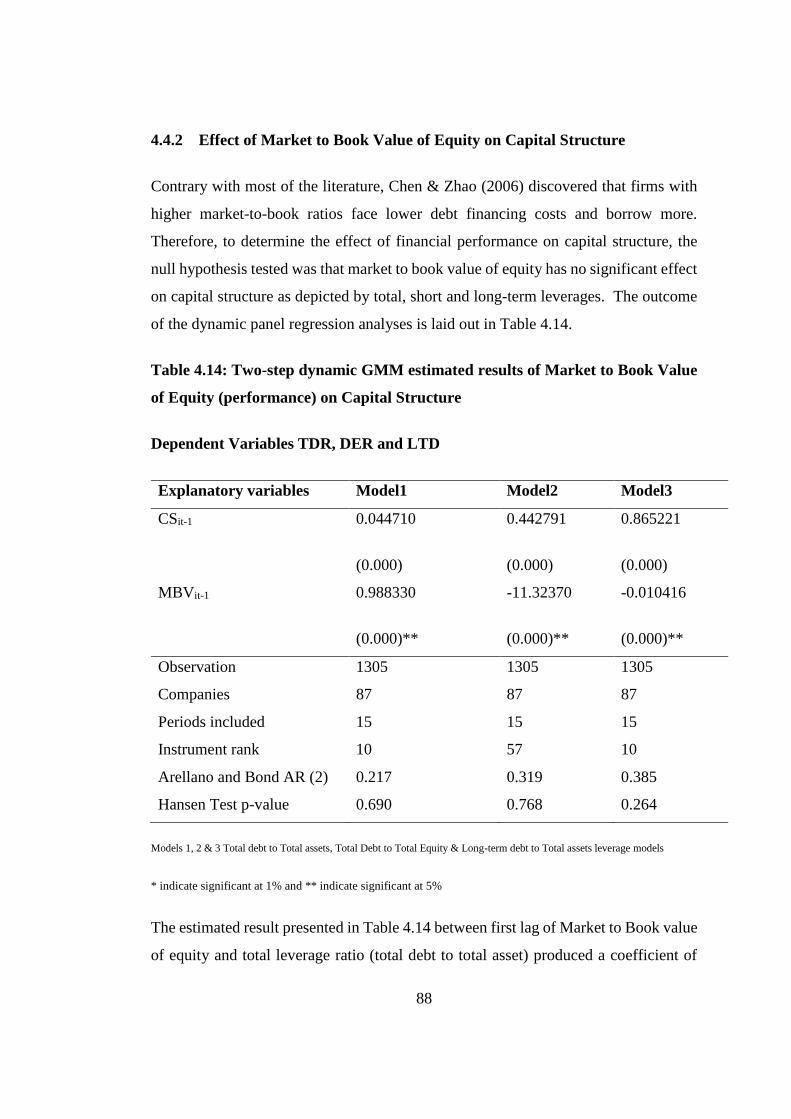
88
4.4.2 Effect of Market to Book Value of Equity on Capital Structure
Contrary with most of the literature, Chen & Zhao (2006) discovered that firms with
higher market-to-book ratios face lower debt financing costs and borrow more.
Therefore, to determine the effect of financial performance on capital structure, the
null hypothesis tested was that market to book value of equity has no significant effect
on capital structure as depicted by total, short and long-term leverages. The outcome
of the dynamic panel regression analyses is laid out in Table 4.14.
Table 4.14: Two-step dynamic GMM estimated results of Market to Book Value
of Equity (performance) on Capital Structure
Dependent Variables TDR, DER and LTD
Explanatory variables Model1 Model2 Model3
CSit-1 0.044710
(0.000)
0.442791
(0.000)
0.865221
(0.000)
MBVit-1 0.988330
(0.000)**
-11.32370
(0.000)**
-0.010416
(0.000)**
Observation 1305 1305 1305
Companies 87 87 87
Periods included 15 15 15
Instrument rank 10 57 10
Arellano and Bond AR (2) 0.217 0.319 0.385
Hansen Test p-value 0.690 0.768 0.264
Models 1, 2 & 3 Total debt to Total assets, Total Debt to Total Equity & Long-term debt to Total assets leverage models
* indicate significant at 1% and ** indicate significant at 5%
The estimated result presented in Table 4.14 between first lag of Market to Book value
of equity and total leverage ratio (total debt to total asset) produced a coefficient of

89
0.988330 and a corresponding p-value of 0.000. This result indicates that a statistically
significant positive relationship exists between MBV and total leverage ratio. For the
estimated model1 the Arellano and Bond (AR2) test of second-order autocorrelation
shows a value of 0.217 which is greater than 0.05 thereby indicating that there exists
no problem of second-order autocorrelation, meaning the model was correctly
specified. The Hansen test of instrument validity at first differencing shows a
probability value of 0.690. For the fact that the probability value of the Hansen test
was not less than 0.1. this suggests that the instruments used in the estimated model
are valid instruments. The estimated model indicates that the number of the instrument
is less than the number of groups thereby satisfied the rule of the thumb that the number
of the instrument should be less or equal to the number of groups.
Similarly, the effect of financial performance in the context of MBV on the capital
structure as measured by leverage (debt to equity ratio) was assessed. The estimated
result in model 2 indicates a statistically significant negative relationship between firm
performance (MBV) and capital structure (DER). The estimated result produced a
coefficient of -11.32370 (p-value of 0.000). The Arellano and Bond tests of
autocorrelation show (AR2) a value of 0.329. This autocorrelation value is greater than
0.005. This indicates that there is no problem of second-order autocorrelation and the
model is correctly specified. The Hansen test of instrument validity at first difference
shows probability value that is not less than 0.1 which is 0.768. This suggests that the
instruments used in the estimated models are valid instruments. The estimated model
indicates that the number of instruments ranked at 57 is less than the number of groups
(87) thereby satisfied the rule of the thumb that the number of the instrument should
be less or equal to the number of groups.
In addition, the effect of financial performance in the context of MBV on capital
structure proxied by long-term debt was determined. As estimated by model 3 in Table
4.14, the result shows that a statistically significant negative relationship exists
between firm financial performance (MBV) and capital structure (long-term leverage)
with a coefficient value of -0.010416 (P value of 0.000). The Arellano and Bond tests
of autocorrelation show (AR2) value of 0.385. This autocorrelation value is greater
90
than 0.05. This indicates that there is no problem of second-order autocorrelation and
the model is correctly specified. The Hansen test of instrument validity at first
difference shows a probability value of 0.264 which is greater than 0.1 suggesting that
the instruments used in the estimated models are valid instruments. The estimated
model indicates that the number of instruments is less than the number of groups
thereby satisfied the rule of the thumb that the number of the instrument should be less
or equal to the number of groups.
The implication of the positive significant relationship found between firm
performance (MBV) and capital structure (total debt ratio) is that the capital structure
choice of firms in Nigeria responds positively to the financial success of the firms to
achieve optimal use of debt in place of equity. That is, firms in Nigeria are having a
lower market to book value of equity which may make them favour more debt. This is
in congruent with the findings of Bayrakdaroglu, Ege, and Yazici (2013) that
companies with high market-to-book ratios had significantly lower leverage than
companies with low market-to-book ratios. Moreover, the statistically significant
negative relationship recorded between MBV and capital structure at the level of debt
to equity ratio and long-term leverage indicate a preference for equity rather than debt
which further confirmed the findings of Frank and Goya (2009) that market-to-book
equity ratio has a negative relationship with the market leverage of firm but this result
is not reliable for book leverage.
In conclusion, the effects deduced from total debt ratio supported the theoretical
position of the reverse causality hypothesis as postulated by the efficiency risk
hypothesis that efficient firms are more likely to favour more debt in their capital
structure than equity as confirmed by Cheng and Tzeng (2011) in Taiwanese textile
industry however, the position of the debt to equity ratio and long-term leverage is
consistence with the franchise value hypothesis which suggested that more efficient
firms will prefer the application of more equity into the capital structure rather than
debt in tandem with the findings of Otieno and Ngwenya (2015) among firms on the
Nairobi Stock Exchange. This implies that the past financial performance of firms in
Nigeria is reflected in their choice of capital structure combination. The study,
91
therefore, rejects the null hypothesis and accepts alternative hypothesis based on the
estimated results that there is a statistically significant relationship between firm
performance as measured by MBV and capital structure as measure TDR, DER and
LTD of firms in the Nigeria Stock Exchange.
Estimation Equation:
=========================
CSit = αCSit-1+ β1 MBVit-1 + Ɛit
Substituted Coefficients:
Model 1 CS1 = 0.044710CS1t-1 + 0.988330MBVit-1
Model 2 CS2 = 0.442791CS2t-1 – 11.32370 MBVit-1
Model 3 CS3 = 0.865221CS3t-1 – 0.010416MBVit-1
4.4.3 Effect of Return on Assets on Capital Structure
The study further adopted return on assets as a proxy of performance against the
decomposed three levels of leverage associated with capital structure in this study.
This was in the effort to have a wider coverage and improve the content of the study.
The result generated from the estimation are as presented in Table 4.15.

92
Table 4.15: Two-step dynamic GMM estimated results of the effect of return on
asset (performance) on Capital Structure
Dependent Variables TDR, DER and LTD
Explanatory variables Model1 Model2 Model3
CSit-1 0.895198
(0.000)
4.33E-06
(0.000)
0.841724
(0.000)
ROAit-1 -0.179922
(0.000)**
0.002263
(0.000)**
0.243650
(0.000)**
Observation 1305 1305 1305
Companies 87 87 87
Periods included 15 15 15
Instrument rank 10 57 10
Arellano and Bond AR (2) 0.258 0.105 0.99
Hansen Test p-value 0.554 0.371 0.129
Models 1, 2 & 3 Total debt to Total assets, Total debt to Total Equity & Long-term debt to Total assets leverage models
* indicate significant at 1% and ** indicate significant at 5%
The output in Table 4.15 shows a negative significant relationship between financial
performance as measured by Return on Assets and Capital Structure (total leverage to
the total asset). The estimated result pulled a coefficient of -0.179922 and a
corresponding p-value of 0.000. For the estimated model1 the Arellano and Bond
(AR2) test of second-order autocorrelation shows a value of 0.258 which is greater
than 0.05 suggested the absence of second-order autocorrelation thereby means the
model was correctly specified. The Hansen test of instrument validity and first
difference condition shows probability value of 0.554 suggesting that the instruments
used in the estimated model are valid instruments since the probability value of the
Hansen test was greater than 0.1. The estimated model maintained the rule of the
thumb as regard instruments and groups. The number of the instrument is expected to

93
be less or equal to the number of groups. The estimated result shows that the number
of instruments is less than the number of groups.
Table 4.16 further shows the effect, of financial performance in the context of ROA
on capital structure, as measured by debt to equity ratio. The estimated result of model
2 indicates that a statistically significant positive relationship exists between firm
performance (EPS) and capital structure (DER). The estimated result produced a
coefficient of 0.002263 and P value of 0.000. The Arellano and Bond tests of
autocorrelation show (AR2) value of 0.105 which is greater than 0.05 connotes the
absence of second-order autocorrelation suggesting that the model is correctly
specified. The Hansen test of instrument validity at first difference shows probability
value that is not less than 0.1 which stood at 0.371. This suggests that the instruments
used in the estimated models are valid instruments while the instrument ranking further
satisfied the rule of the thumb that the number of the instrument should be less or equal
to the number of groups.
It is a different twist of result looking at the effect of financial performance in the
context of ROA on the capital structure using long-term debt to total assets as a
measure. The estimated result of model 3 in Table 4.15, revealed that a statistically
significant positive relationship exists between firm financial performance (ROA) and
capital structure (long-term leverage). This is confirmed by a coefficient value of
0.243650 and an associated P value of 0.000. The Arellano and Bond tests of
autocorrelation show (AR2) value of 0.99. Since this autocorrelation value is greater
than 0.05 the implication is that the problem of second-order autocorrelation does not
exist meaning the model was correctly specified. The Hansen test of instrument
validity at first differencing produced a probability value of 0.129 which is greater than
0.1 connoting that the instruments used in the estimated models are valid instruments
which were further satisfied by the rule of the thumb that the number of the instrument
should be less or equal to the number of groups.
The implication of the negative significant relationship found between firm
performance (ROA) and capital structure proxied by total debt ratio is that the capital
94
structure choice of firms in Nigeria responds negatively to the financial success of the
firms in achieving optimal use of debt in place of equity. That is, the more efficient
the management of firms is at using its assets to generate returns the more the
possibility of debt been substituted by equity in the firm’s capital structure. The result
is consistent with the earlier research efforts of Yinusa et al., (2016) in Nigeria thereby
further strengthening the theoretical position of the franchise value hypothesis. While
the positive position of the debt to equity and long-term debt is consistent with the
efficiency risk hypothesis as observed by Fazel et al., (2016) in Pakistanis firms. This
suggests that the past financial performance of firms in Nigeria is reflected in their
choice of capital structure combination. The study, therefore, rejects the null
hypothesis and accepts alternative hypothesis based on the estimated results that there
is a statistically significant relationship between firm performance as measured by
ROA and capital structure as measured by leverage (TDR, DER and LTD) of non-
financial firms in the Nigeria Stock Exchange.
Estimation Equation:
=========================
CSit = αCSit-1+ β1 ROAit-1 + Ɛit
Substituted Coefficients:
Model 1 CS1 = 0.895198CS1t-1 – 0.179922ROAit-1
Model 2 CS2 = 4.33E-06CS2t-1 + 0.002263ROAit-1
Model 3 CS3 = 0.841724CS3t-1 + 0.243650ROAit-1
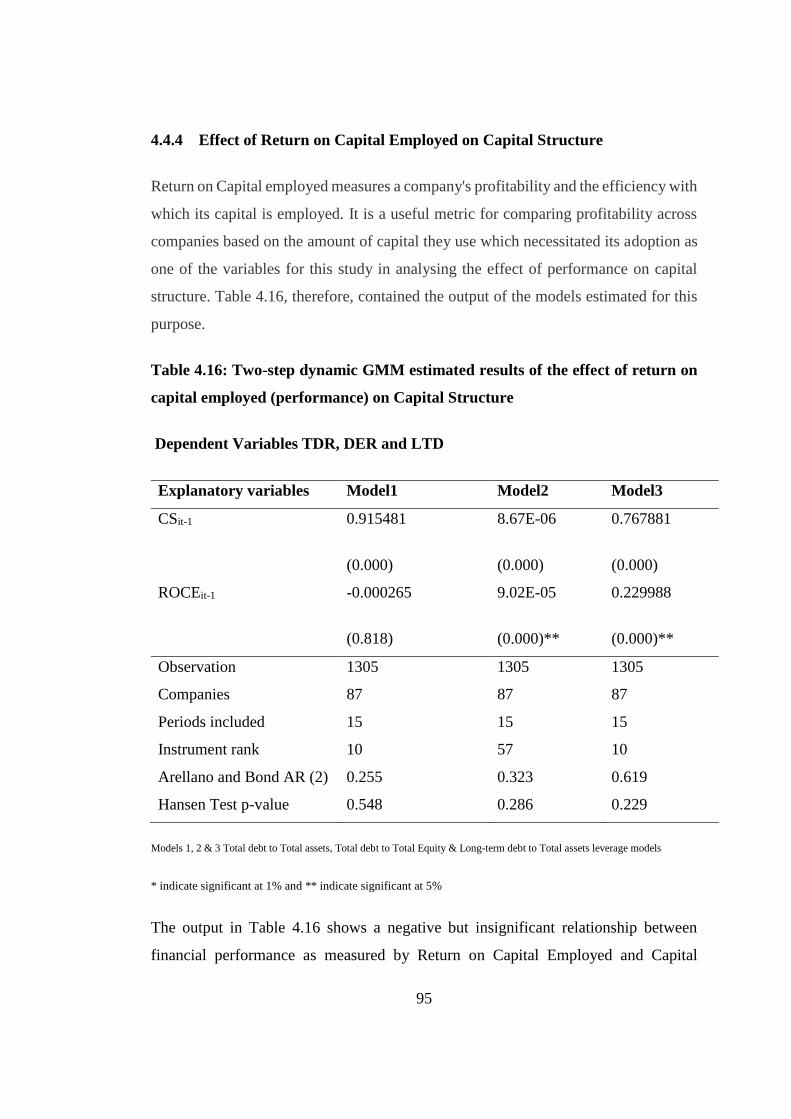
95
4.4.4 Effect of Return on Capital Employed on Capital Structure
Return on Capital employed measures a company's profitability and the efficiency with
which its capital is employed. It is a useful metric for comparing profitability across
companies based on the amount of capital they use which necessitated its adoption as
one of the variables for this study in analysing the effect of performance on capital
structure. Table 4.16, therefore, contained the output of the models estimated for this
purpose.
Table 4.16: Two-step dynamic GMM estimated results of the effect of return on
capital employed (performance) on Capital Structure
Dependent Variables TDR, DER and LTD
Explanatory variables Model1 Model2 Model3
CSit-1 0.915481
(0.000)
8.67E-06
(0.000)
0.767881
(0.000)
ROCEit-1 -0.000265
(0.818)
9.02E-05
(0.000)**
0.229988
(0.000)**
Observation 1305 1305 1305
Companies 87 87 87
Periods included 15 15 15
Instrument rank 10 57 10
Arellano and Bond AR (2) 0.255 0.323 0.619
Hansen Test p-value 0.548 0.286 0.229
Models 1, 2 & 3 Total debt to Total assets, Total debt to Total Equity & Long-term debt to Total assets leverage models
* indicate significant at 1% and ** indicate significant at 5%
The output in Table 4.16 shows a negative but insignificant relationship between
financial performance as measured by Return on Capital Employed and Capital
96
Structure (total leverage to the total asset). The estimated result pulled a coefficient of
-0.00265 and a corresponding p-value of 0.818. For the estimated model1 the Arellano
and Bond (AR2) test of second-order autocorrelation shows a value of 0.255 which is
greater than 0.05 which suggested the absence of second-order autocorrelation,
denotating that the model was correctly specified. The Hansen test of instrument
validity and first difference condition shows probability value of 0.548 suggesting that
the instruments used in the estimated model are valid instruments since the probability
value of the Hansen test was greater than 0.1. The estimated model maintained the
rule of the thumb as regard instruments and groups. The number of the instrument is
expected to be less or equal to the number of groups. The estimated result shows that
the number of instruments is less than the number of groups.
The study further sort to investigate the effect of financial performance in the context
of ROCE on capital structure, as measured by debt to equity ratio. The estimated result
of model 2 indicates that a statistically insignificant positive relationship exists
between firm performance (ROCE) and capital structure (DER). The estimated result
produced a coefficient of 9.02E-05 and P value of 0.000. The Arellano and Bond tests
of autocorrelation show (AR2) value of 0.322 which is greater than 0.05 connotes the
absence of second-order autocorrelation suggesting that the model is correctly
specified. The Hansen test of instrument validity at first difference shows probability
value that is not less than 0.1 which stood at 0.286. This suggests that the instruments
used in the estimated models are valid instruments while the instrument ranking further
satisfied the rule of the thumb that the number of the instrument should be less or equal
to the number of groups.
In addition, to strengthen and expand the horizon of the study in determining the effect
of financial performance in the context of ROCE on capital structure using long-term
debt to total assets as a measure of leverage, the estimated result of model 3 in Table
4.16, revealed that a statistically significant positive relationship exists between firm
financial performance (ROCE) and capital structure (long-term leverage). This is
confirmed by a coefficient value of 0.229988 and an associated P value of 0.000. The
Arellano and Bond tests of autocorrelation show (AR2) value of 0.619. Since this
97
autocorrelation value is greater than 0.05 the implication is that the problem of second-
order autocorrelation does not exist meaning the model was correctly specified. The
Hansen test of instrument validity at first differencing produced a probability value of
0.229 which is greater than 0.1 connoting that the instruments used in the estimated
models are valid instruments which were further certified by the rule of the thumb that
the number of the instrument should be less or equal to the number of groups.
The implication of the negative significant relationship found between firm
performance (ROCE) and capital structure proxied by total leverage is that the capital
structure choice of firms in Nigeria responds negatively to the financial success of the
firms in achieving optimal use of debt in place of equity. That is, the more efficient
the management of firms in Nigeria are at achieving more ROCE of the firm the more
the possibility of the operations being financed by equity capital rather than debt. This
finding reflected the theoretical postulation of the franchise value hypothesis in line
with the results of Cheng and Tzeng (2011) in the beverage and electronic industries
in Taiwan. According to Berger and Bonaccorsi di Patti (2006), the franchise-value
hypothesis is a joint hypothesis that profit efficiency is a source of rents, and that firm
holds additional equity capital to prevent the loss of these rents in the event of
liquidation. While the position of the debt to equity ratio and long-term debt ratio is
consistent with the efficiency risk hypothesis. This hypothesis postulates that more
efficient firms choose lower equity ratios than other firms, all else equal because higher
efficiency reduces the expected costs of bankruptcy and financial distress. These
research findings are consistent with the research findings of (Berger & Bonaccorsi di
Patti 2006; Ahari & Viverita, 2015; Margaritis & Psillaki, 2010). This implies that the
past financial performance of firms in Nigeria is reflected in their choice of capital
structure combination. The study, therefore, rejects the null hypothesis and accepts
alternative hypothesis based on the estimated results that there is a statistically
significant relationship between firm performance as measured by ROCE and capital
structure as measured by leverage (TDR, DER and LTD) of firms in the Nigeria Stock
Exchange.
98
Estimation Equation:
=========================
CSit = αCSit-1+ βROCEit-1 + Ɛit
Substituted Coefficients:
Model 1 CS1 = 0.915481CS1t-1 – 0.000265ROCEit-1
Model 2 CS2 = 8.67E-06CS2t-1 + 9.02E-05ROCEit-1
Model 3 CS3 = 0.76881CS3t-1 + 0.229988ROCEit-1
4.4.5 Moderating effect of Firm Size on the Relationship between Financial
Performance and Capital Structure
A moderator variable influences the nature (e.g., magnitude and/or direction) of the
effect of an antecedent on an outcome (Aguinis, Edwards & Bradley, 2016). When the
moderator variable is categorical (e.g., industry type), the traditional data-analytic
approach is subgrouping analysis, which consists of comparing correlation or
regression coefficients across the various subgroups or categories (Boyd, Haynes, Hitt,
Bergh, & Ketchen, 2013). When the moderating effect is continuous (e.g., firm
resources), studies typically rely on moderated multiple regression (Aiken & West,
1991; Cohen, 1978), which consists of creating a regression model that predicts the
outcome based on a predictor X, a second predictor Z hypothesized to be a moderator,
and the product term between X and Z, which carries information on the moderating
effect of Z on the X-Y relation. The regression coefficient for the XZ product term
from which X and Z have been partial out offers information on the presence as well
as the magnitude of the moderating effect. From the estimated GMM results the
moderating effect of size is presented in Table 4.17
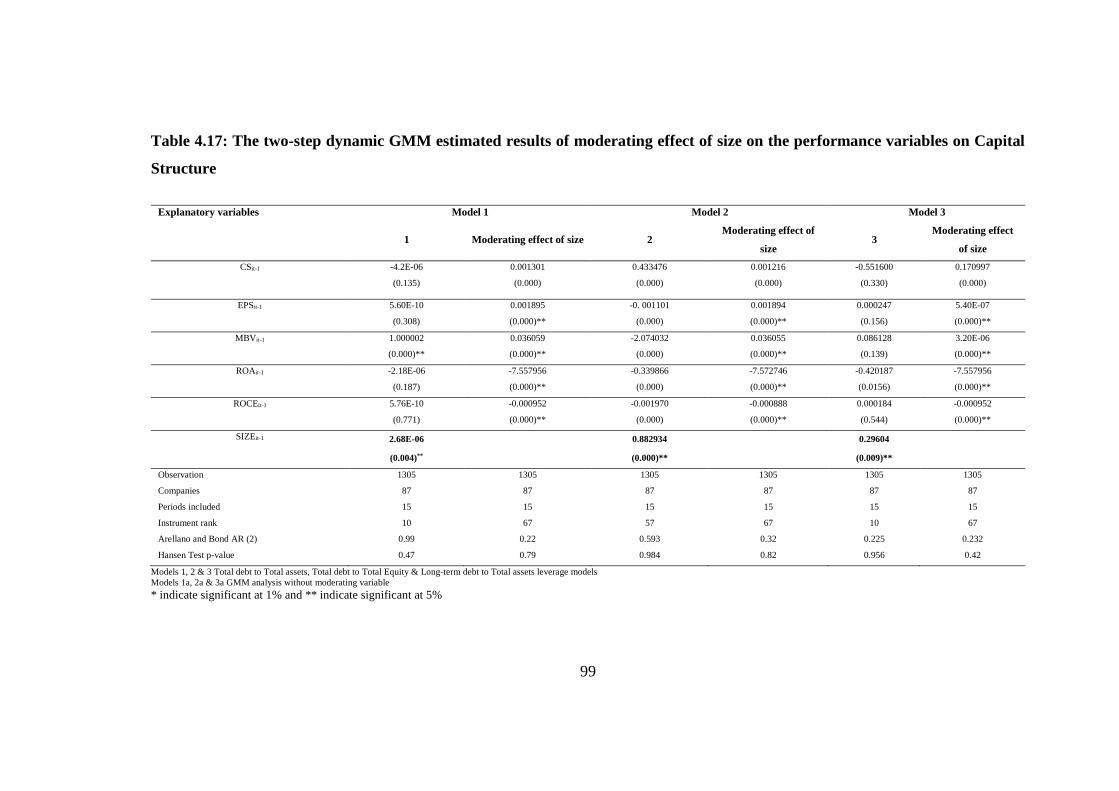
99
Table 4.17: The two-step dynamic GMM estimated results of moderating effect of size on the performance variables on Capital
Structure
Explanatory variables Model 1 Model 2 Model 3
1 Moderating effect of size 2
Moderating effect of
size 3
Moderating effect
of size
CSit-1 -4.2E-06 0.001301 0.433476 0.001216 -0.551600 0.170997
(0.135) (0.000) (0.000) (0.000) (0.330) (0.000)
EPSit-1 5.60E-10 0.001895 -0. 001101 0.001894 0.000247 5.40E-07
(0.308) (0.000)** (0.000) (0.000)** (0.156) (0.000)**
MBVit-1 1.000002 0.036059 -2.074032 0.036055 0.086128 3.20E-06
(0.000)** (0.000)** (0.000) (0.000)** (0.139) (0.000)**
ROAit-1 -2.18E-06 -7.557956 -0.339866 -7.572746 -0.420187 -7.557956
(0.187) (0.000)** (0.000) (0.000)** (0.0156) (0.000)**
ROCEit-1 5.76E-10 -0.000952 -0.001970 -0.000888 0.000184 -0.000952
(0.771) (0.000)** (0.000) (0.000)** (0.544) (0.000)**
SIZEit-1 2.68E-06 0.882934 0.29604
(0.004)** (0.000)** (0.009)**
Observation 1305 1305 1305 1305 1305 1305
Companies 87 87 87 87 87 87
Periods included 15 15 15 15 15 15
Instrument rank 10 67 57 67 10 67
Arellano and Bond AR (2) 0.99 0.22 0.593 0.32 0.225 0.232
Hansen Test p-value 0.47 0.79 0.984 0.82 0.956 0.42
Models 1, 2 & 3 Total debt to Total assets, Total debt to Total Equity & Long-term debt to Total assets leverage models
Models 1a, 2a & 3a GMM analysis without moderating variable
* indicate significant at 1% and ** indicate significant at 5%

100
In estimating the effect of the moderating variable depicted as size on financial
performance variables (EPS, MBV, ROA and ROCE) against capital structure
variables (TDR, DER and LTD). Firstly, it was revealed as shown on Table 4.17 that
a statistically positive significant effect exists between EPS, MBV and TDR at an
estimated coefficient value of 0.001895 and 0.036059 at a correspondent p-value
=0.000<0.0 while a statistically negatively significance was recorded against TDR by
ROA and ROCE at an estimated coefficient value of -7.557956 and -0.000952 at a
correspondent p-value =0.000<0.0 respectively.
As against the DER, the moderating effect of size of financial performance variables
and capital structure toll the same dimension with the TDR results, for example a
statistically positively significant outcome was recorded by EPS, MBV against DER
at an estimated coefficient value of 0.001894 and 0.036055 at a correspondent p-value
=0.000<0.0 while a statistically negatively significant results was displayed by ROA
and ROCE employed towards DER at an estimated coefficient value of -7.572746 and
-0.000888 at a correspondent p-value =0.000<0.0 respectively. Finally, the analysis
using LTD as a proxy oy capital structure while moderating with size showed a little
shift from the two earlier estimation as EPS, MBV and ROA results statistically
positively affects LTD at an estimated coefficient value of 5.40E-07, 3.20E-06 and
0.019689 with a correspondent p-value=0.000<0.0 while only ROCE was consistent
with its negatively significance stand against LTD as in the other capital structure
variables earlier discussed at an estimated coefficient value of -5.88E-05 with a
correspondent p-value =0.000<0.0. The Arellano and Bond test of autocorrelation
shows (AR2) value for TDR, DER and LTD models were 0.22, 0.32 and 0.232
respectively. The autocorrelation value is greater than 0.05 thereby indicating that
there is no problem of second-order autocorrelation, therefore, the models were
correctly specified. The Hansen test of instrument validity at first differencing
produced probability values which are greater than 0.1 at 0.79 (TDR), 0.82 (DER) and
0.42 (LTD). This connotes that the instruments used in the estimated models are valid
instruments and certified by the rule of the thumb that the number of the instrument
should be less or equal to the number of groups.
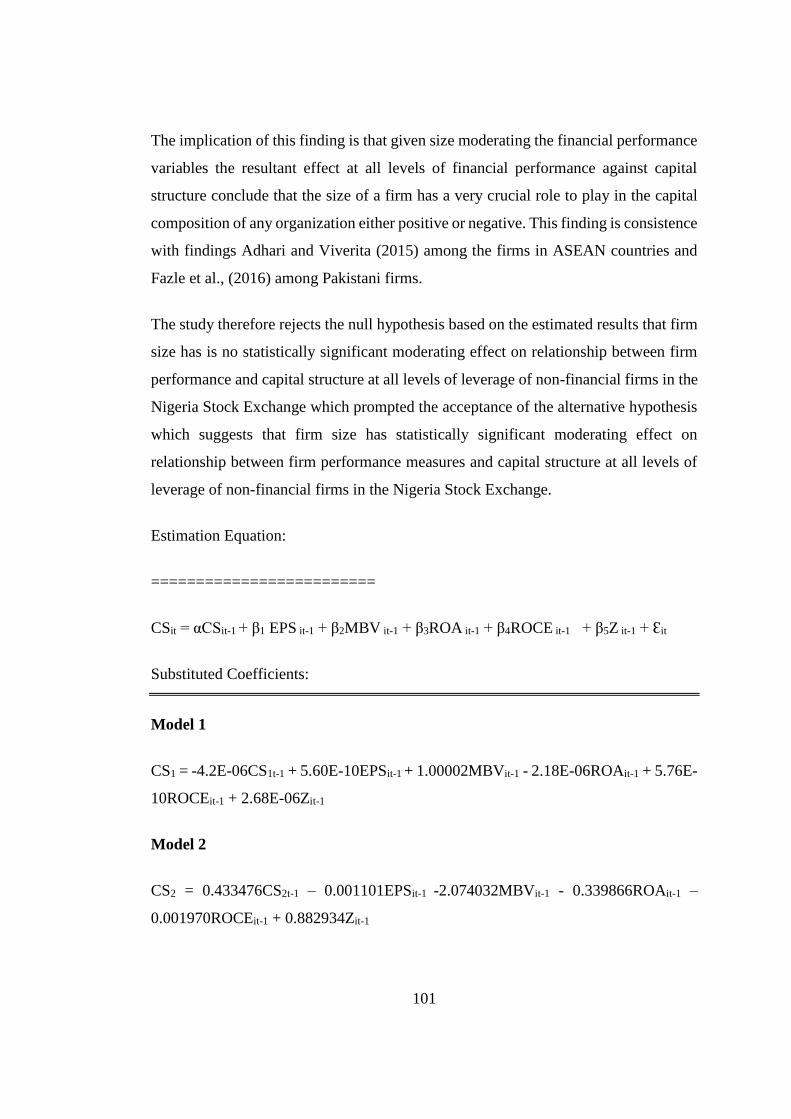
101
The implication of this finding is that given size moderating the financial performance
variables the resultant effect at all levels of financial performance against capital
structure conclude that the size of a firm has a very crucial role to play in the capital
composition of any organization either positive or negative. This finding is consistence
with findings Adhari and Viverita (2015) among the firms in ASEAN countries and
Fazle et al., (2016) among Pakistani firms.
The study therefore rejects the null hypothesis based on the estimated results that firm
size has is no statistically significant moderating effect on relationship between firm
performance and capital structure at all levels of leverage of non-financial firms in the
Nigeria Stock Exchange which prompted the acceptance of the alternative hypothesis
which suggests that firm size has statistically significant moderating effect on
relationship between firm performance measures and capital structure at all levels of
leverage of non-financial firms in the Nigeria Stock Exchange.
Estimation Equation:
=========================
CSit = αCSit-1 + β1 EPS it-1 + β2MBV it-1 + β3ROA it-1 + β4ROCE it-1 + β5Z it-1 + Ɛit
Substituted Coefficients:
Model 1
CS1 = -4.2E-06CS1t-1 + 5.60E-10EPSit-1 + 1.00002MBVit-1 - 2.18E-06ROAit-1 + 5.76E-
10ROCEit-1 + 2.68E-06Zit-1
Model 2
CS2 = 0.433476CS2t-1 – 0.001101EPSit-1 -2.074032MBVit-1 - 0.339866ROAit-1 –
0.001970ROCEit-1 + 0.882934Zit-1
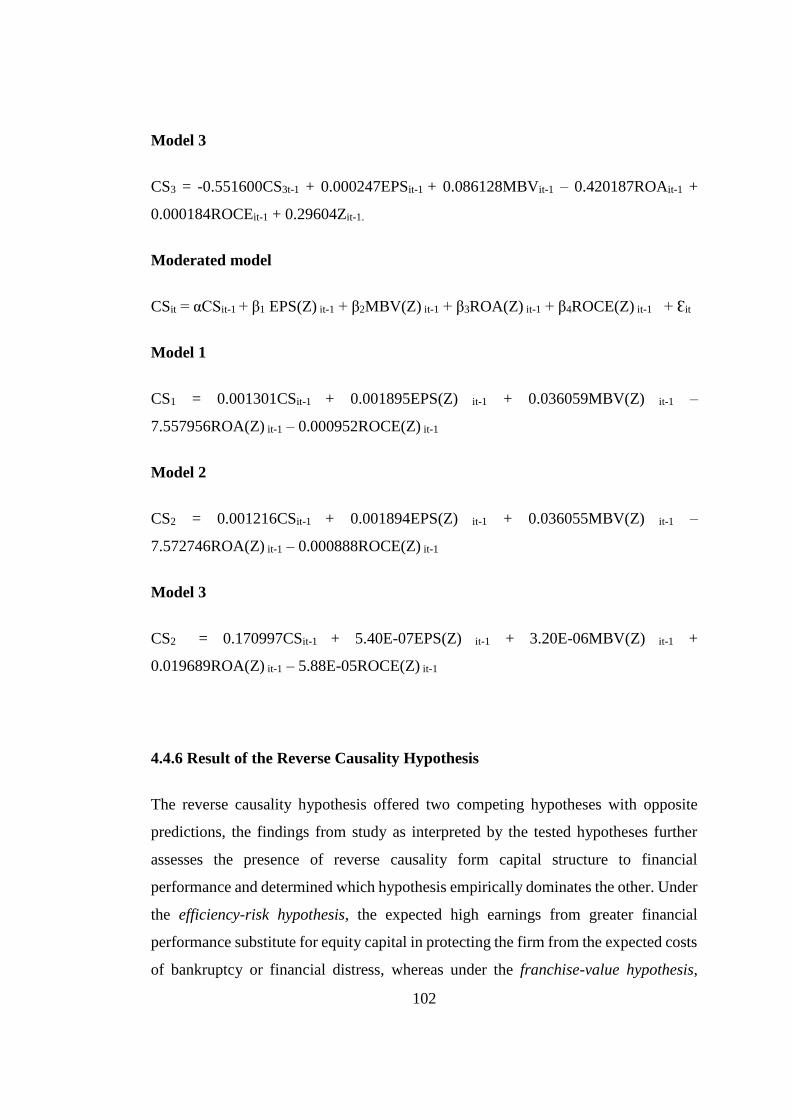
102
Model 3
CS3 = -0.551600CS3t-1 + 0.000247EPSit-1 + 0.086128MBVit-1 – 0.420187ROAit-1 +
0.000184ROCEit-1 + 0.29604Zit-1.
Moderated model
CSit = αCSit-1 + β1 EPS(Z) it-1 + β2MBV(Z) it-1 + β3ROA(Z) it-1 + β4ROCE(Z) it-1 + Ɛit
Model 1
CS1 = 0.001301CSit-1 + 0.001895EPS(Z) it-1 + 0.036059MBV(Z) it-1 –
7.557956ROA(Z) it-1 – 0.000952ROCE(Z) it-1
Model 2
CS2 = 0.001216CSit-1 + 0.001894EPS(Z) it-1 + 0.036055MBV(Z) it-1 –
7.572746ROA(Z) it-1 – 0.000888ROCE(Z) it-1
Model 3
CS2 = 0.170997CSit-1 + 5.40E-07EPS(Z) it-1 + 3.20E-06MBV(Z) it-1 +
0.019689ROA(Z) it-1 – 5.88E-05ROCE(Z) it-1
4.4.6 Result of the Reverse Causality Hypothesis
The reverse causality hypothesis offered two competing hypotheses with opposite
predictions, the findings from study as interpreted by the tested hypotheses further
assesses the presence of reverse causality form capital structure to financial
performance and determined which hypothesis empirically dominates the other. Under
the efficiency-risk hypothesis, the expected high earnings from greater financial
performance substitute for equity capital in protecting the firm from the expected costs
of bankruptcy or financial distress, whereas under the franchise-value hypothesis,
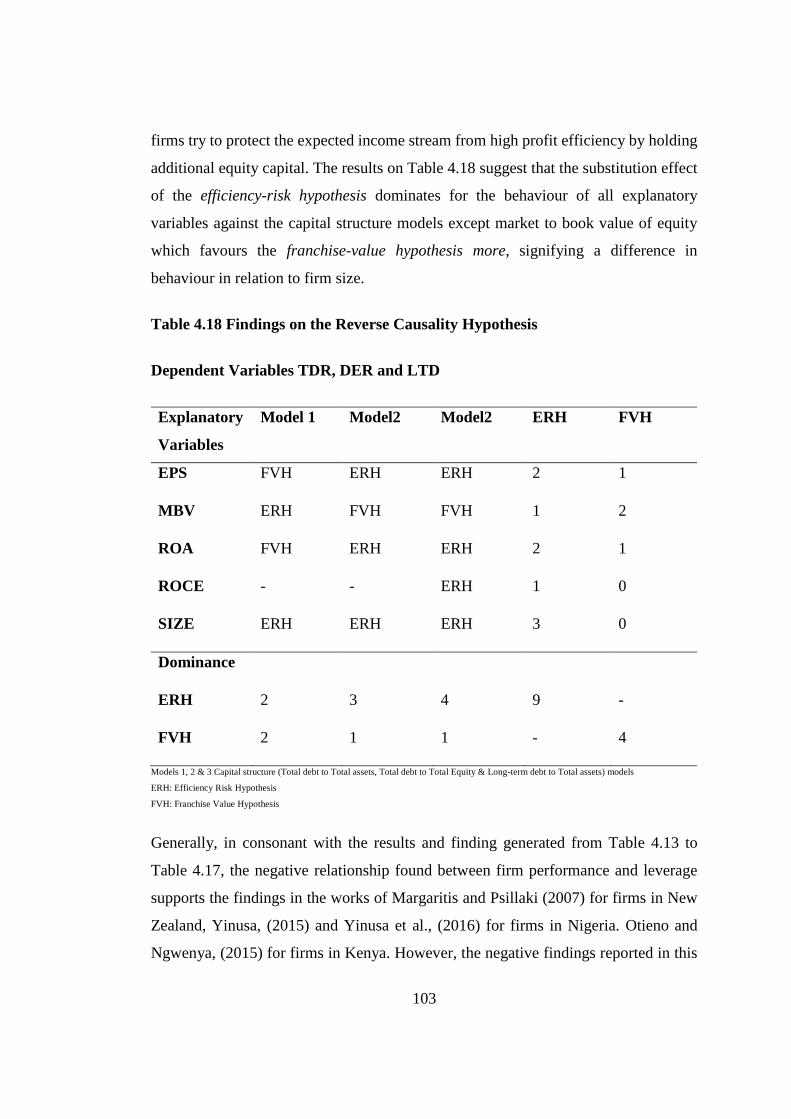
103
firms try to protect the expected income stream from high profit efficiency by holding
additional equity capital. The results on Table 4.18 suggest that the substitution effect
of the efficiency-risk hypothesis dominates for the behaviour of all explanatory
variables against the capital structure models except market to book value of equity
which favours the franchise-value hypothesis more, signifying a difference in
behaviour in relation to firm size.
Table 4.18 Findings on the Reverse Causality Hypothesis
Dependent Variables TDR, DER and LTD
Explanatory
Variables
Model 1 Model2 Model2 ERH FVH
EPS FVH ERH ERH 2 1
MBV ERH FVH FVH 1 2
ROA FVH ERH ERH 2 1
ROCE - - ERH 1 0
SIZE ERH ERH ERH 3 0
Dominance
ERH 2 3 4 9 -
FVH 2 1 1 - 4
Models 1, 2 & 3 Capital structure (Total debt to Total assets, Total debt to Total Equity & Long-term debt to Total assets) models
ERH: Efficiency Risk Hypothesis
FVH: Franchise Value Hypothesis
Generally, in consonant with the results and finding generated from Table 4.13 to
Table 4.17, the negative relationship found between firm performance and leverage
supports the findings in the works of Margaritis and Psillaki (2007) for firms in New
Zealand, Yinusa, (2015) and Yinusa et al., (2016) for firms in Nigeria. Otieno and
Ngwenya, (2015) for firms in Kenya. However, the negative findings reported in this

104
study ran contrary to the findings of Berger and Bonaccorsi di Patti (2006) on banks
in the United States, Margaritis and Psillaki (2010) for French firms, Yeh (2010) for
Taiwanese firms, Adhari and Viverita (2015) for ASEAN countries and Fazle et al.,
(2016) for Pakistani firms, that found positive relationship between performance and
capital structure as postulated in the efficiency-risk hypothesis (better performance is
related to higher leverage ratio).
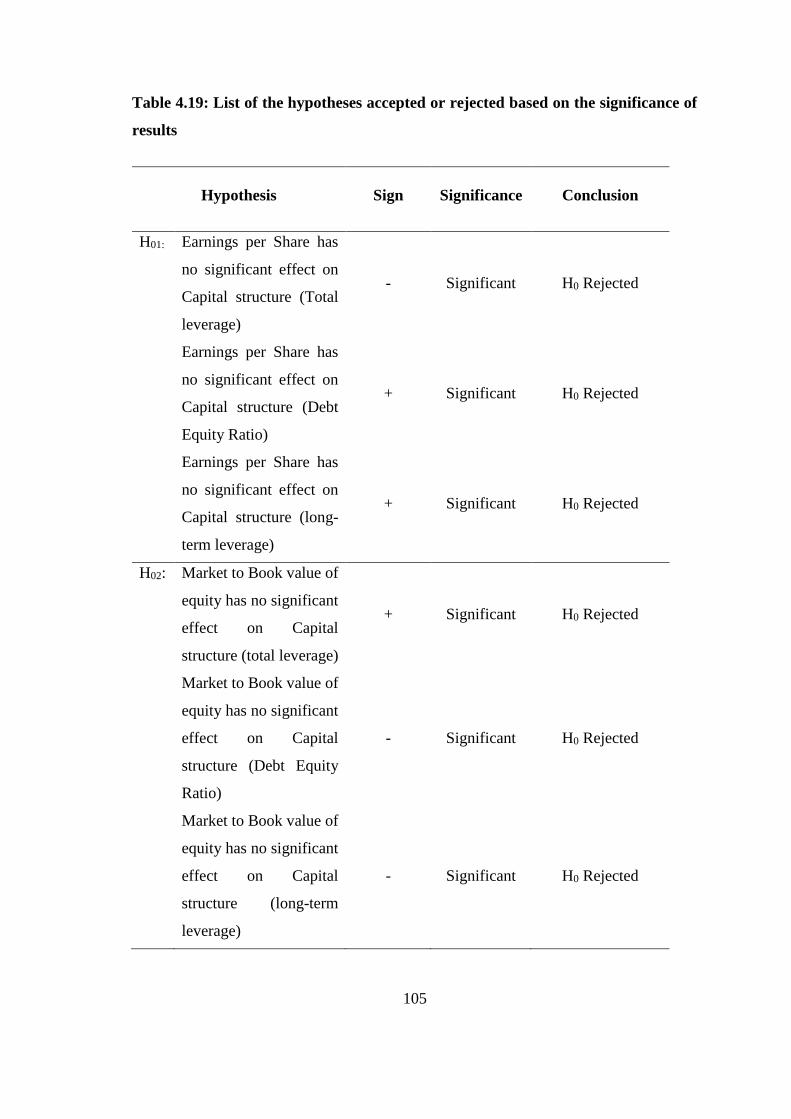
105
Table 4.19: List of the hypotheses accepted or rejected based on the significance of
results
Hypothesis Sign Significance Conclusion
H01: Earnings per Share has
no significant effect on
Capital structure (Total
leverage)
- Significant H0 Rejected
Earnings per Share has
no significant effect on
Capital structure (Debt
Equity Ratio)
+ Significant H0 Rejected
Earnings per Share has
no significant effect on
Capital structure (long-
term leverage)
+ Significant H0 Rejected
H02: Market to Book value of
equity has no significant
effect on Capital
structure (total leverage)
+ Significant H0 Rejected
Market to Book value of
equity has no significant
effect on Capital
structure (Debt Equity
Ratio)
- Significant H0 Rejected
Market to Book value of
equity has no significant
effect on Capital
structure (long-term
leverage)
- Significant H0 Rejected
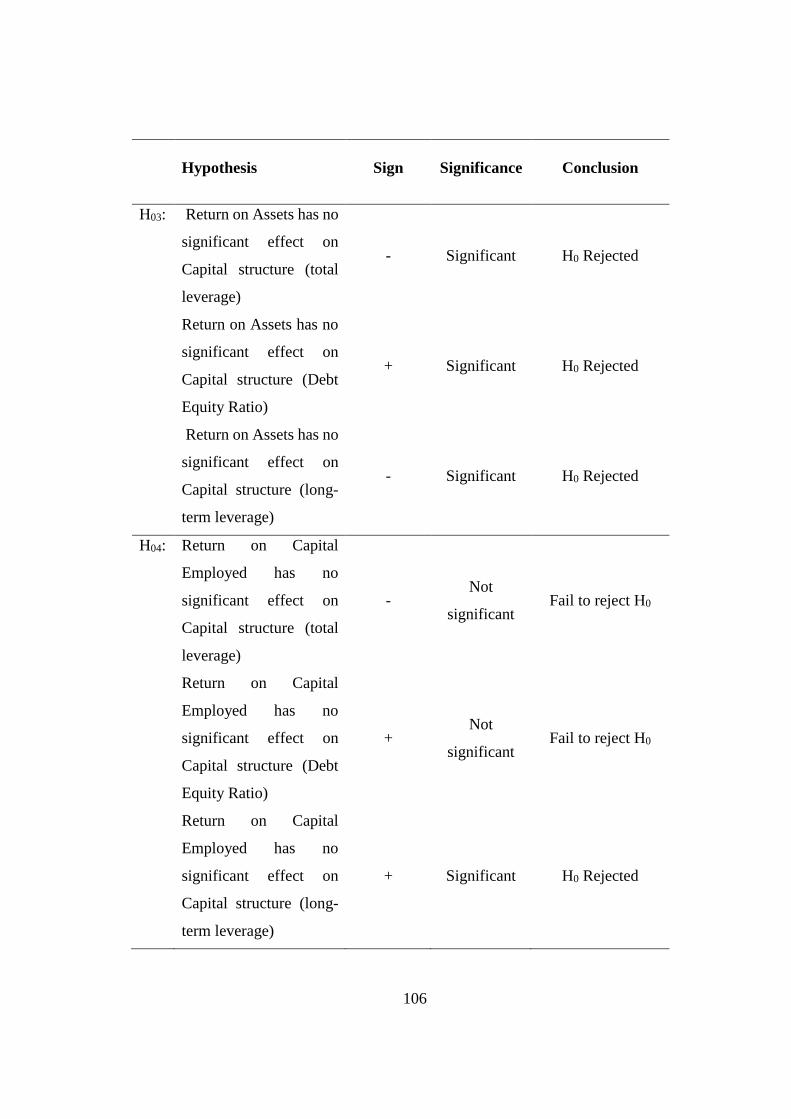
106
Hypothesis Sign Significance Conclusion
H03: Return on Assets has no
significant effect on
Capital structure (total
leverage)
- Significant H0 Rejected
Return on Assets has no
significant effect on
Capital structure (Debt
Equity Ratio)
+ Significant H0 Rejected
Return on Assets has no
significant effect on
Capital structure (long-
term leverage)
- Significant H0 Rejected
H04: Return on Capital
Employed has no
significant effect on
Capital structure (total
leverage)
- Not
significant Fail to reject H0
Return on Capital
Employed has no
significant effect on
Capital structure (Debt
Equity Ratio)
+ Not
significant Fail to reject H0
Return on Capital
Employed has no
significant effect on
Capital structure (long-
term leverage)
+ Significant H0 Rejected
107
CHAPTER FIVE
SUMMARY, CONCLUSION AND RECOMMENDATIONS
5.1 Introduction
This study provided evidence in line with the objective of this study which was to
ascertain the effect of Financial Performance on Capital Structure of firms listed on
the Nigeria Stock Exchange. Particularly, the study aimed at finding out if earnings
per share, market to book value of equity and return on asset as a proxy of financial
performance have effect on capital structure choice in Nigeria while firm size was
included as the moderating variable. This chapter provides a summary of the findings
of this study arrived at after testing the hypotheses earlier postulated in chapter one.
Based on these findings conclusions are arrived at for each of the research objectives.
Finally, based on both the findings and the limitations encountered in the study, policy
recommendations as well as suggestions for further research are made at the end of the
chapter.
5.2 Summary
The study was hinged on the hitherto lack of clarity as to whether it is only capital
structure that determines firms' financial performance as issues in finance literature or
firms' financial performance too do have effect on how capital structure choice is
determined in corporate financing with particular reference to firms listed on the
Nigeria stock exchange as entrenched in the reverse causality hypothesis. The analyses
performed using panel data employed a dynamic econometric analytical tool using
General Method of Moments in estimating 87 Nigerian quoted companies with 1479
observations for the period 1999 to 2015.
This study tries to expand on the study on firm performance and capital structure
choice in Nigeria in which the author's employed return on equity as performance
indicator and leverage measured by long-term, debt-equity ratio and total debt. Their

108
conclusion which informed that performance does really influence capital structure
choice in Nigeria by confirming the existence of the franchise value hypothesis and
refuting the efficiency risk hypothesis triggered the interest in this study. Therefore,
this study took a different dimension by introducing more financial performance
variables against the decomposed capital structure as earlier applied to further
investigate this influence on capital structure choice and the bidirectional situation at
hand.
To achieve this fit, both theoretical and empirical literature from capital structure to
financial performance and financial performance to the capital structure were
reviewed. From the review of the related literature, a comprehensive conceptual
framework was developed based on the apriori expectation of the reverse causality
hypothesis. The hypothesized relationship between firms' financial performance and
the capital structure was tested based on the specific objectives of the study. Based on
the specific objectives of the study and the conceptual framework, a panel balanced
data of 87 companies which excluded all the companies from the financial sector due
to the nature of their business, financial characteristics and the employment of leverage
that is totally different from other sectors was employed in the analysis.
However, to be specific chapter one of this study focuses on the general introduction
on capital structure and firm performance with explicit deliberations on background to
the study, statement of the problem, objectives of the study, research hypotheses,
significance of the study, scope of the study and organisation of the thesis. In chapter
two the relevant literature and theories were reviewed. Also, the conceptual framework
and empirical reviews were not left out in this chapter. The third chapter focuses on
the methodology employed in the study. The methodological framework in terms of
research design, sample and sample technique as well as sources of data and model
specification and estimation techniques were discussed in this chapter while results
and findings of this study were extensively analysed and discussed in chapter four. The
findings of the study include the following:
109
5.2.1 Effect of Earnings Per Share on Capital structure
Another key finding in this study has to do with the effect of earnings per share on
capital structure. Interestingly this variable according to the estimated result has a
negative significant effect on total debt while it has a positive effect on debt-equity
ratio and long-term leverage. The interpretation of this development is that the more
the earning powers of the return on the shares of these companies the more the reluctant
effect it will have on the injection of more debt in the capital structure. The reason is
not far fetch shareholders and other interested parties in the organization view will be
different in the sense that it will be seeing as an improvement on the profitability
position and injection of more debt will affect their ownership status and return on
their investment, in view of this, management may not have option than to look inward.
On the other hand, the positive effect it is having on debt-equity ratio and long-term
leverage shows that the companies sampled can only commensurate their financial
performance with long-term financial needs which may not likely to be frequent. In
addition, this is a strong support for the existence of the efficiency risk and franchise
value hypotheses of the reverse causality hypothesis in capital structure choice of
companies in the Nigerian stock exchange.
5.2.2 Effect of Market to Book value of Equity on Capital structure
Also, in the study the specific objective of determining the effect of market to book
value of equity on capital structure was included to have a broader insight into the
problem at hand in Nigeria situation using investment opportunity. As a departure from
using accounting ratio, market to book value of equity is a market-based valuation ratio
that has to do with organization timing the market to know when to issue more equity
or repurchase equity and when to incur debt or not in their capital structure. The
findings from the analysis show that a positive and statistically significant relationship
exists between market to book value of equity and capital structure as measured by
total leverages while a negative result was recorded against debt-equity ratio and long-
term leverage. The deduction here is that Nigerian firms when they are experiencing
high market to book ratio will favour debt in terms of total leverage while the
110
preference will shift to sell their shares in the market when the need arises rather than
looking out rightly for debt to catch up with their capital structure needs. This
development is a strong indication that the Nigerian firms are operating based on the
franchise value hypothesis when it comes to debt-equity ratio and long-term leverage
and efficiency risk when it relates to total leverage as in some other economies of the
world.
5.2.3 Effect of Return on Assets on Capital Structure
The fourth objective of this study which was to examine the effect of return on assets
on capital structure as measured by leverage and represented total, debt-equity ratio
and long-term debt ratios became necessary because of the limited scope on the
application of performance indicator by the previous authors in Nigeria context. The
generated output indicated a negative but significant relationship exists between return
on assets and capital structure in the context of total leverage while a positively
significant effect was established on debt-equity ratio and long-term leverage. The
implication of this finding is that, firms in Nigeria in most situation, in as much as they
are generating reasonable return on their assets, will prefer to be in favour of more
equity participation at the total leverage and will prefer the injection of debt at the level
of debt-equity ratio and long-term leverage in their capital structure than procuring
debt. Again, this finding seriously supported both the efficiency risk and franchise
value hypotheses of the reverse causality hypothesis.
5.2.4 Effect of Return on Capital Employed on Capital Structure
The study examines the effect of return on capital employed on capital structure as
measured leverage which was decomposed into three as earlier mentioned. The data
for return on capital employed was generated from getting the ratio of earnings before
interest and tax to capital employed. The generate output indicates that a negative but
significant relationship exists between return on capital employed and capital structure
in the context of total leverage while a positively significant effect was established on
debt-equity ratio and long-term leverage. The consequence of this finding is that in as
111
much as the return on capital employed is high, shareholders would not like to favour
debt in their capital structure at the level of total leverage but will favour debt at the
level of debt-equity ratio and long-term leverage in their capital structure than
procuring debt. Also, this finding seriously reinforced the consideration of both the
efficiency risk and franchise value hypotheses of the reverse causality hypothesis in
capital structure choice of non-financial firms in Nigerian.
5.2.5 Moderating effect of Size on Capital Structure
Lastly, in the analysis size was included as a moderating variable to further substantiate
the effect of the performance indicators used on the capital structure. This is to further
support or refute earlier findings by researchers on the effect of firm-specific factors
in determining the choice of capital structure of listed firms. The resultant effect of
this variable which was determined as the log of total assets as analysed by the dynamic
estimator was fascinating. For instance, all the performance variables conclude a
significantly positive relationship effect on capital structure except ROA and ROCE
when regressed against total leverage and debt equity which exhibits negativity. At the
level of long-term debt only ROCE exhibited a negative relationship when moderated.
5.3 Conclusions
As supported by the empirical findings of this study as documented in chapter four
quite a number of logical conclusions were drawn. The researcher was able to conclude
that firm’s past financial performance has effects on the capital structure choice of
non-financial firms on the Nigerian stock exchange. In addition, this study was able to
confirm with earlier researchers’ findings that there exists both efficiency risk and
franchise value hypotheses of the reverse causality hypothesis in the choice of their
capital structure mix on the platform from which their research was based. From the
perspective of this thesis it was however confirmed that the firms in Nigeria do not
only exhibit franchise value hypothesis but also efficiency risk hypothesis as exhibited
in the findings.

112
The study further concluded that the inclusion of size as a moderating variable has
really brought out considerable effects in lieu of the resultant changes in the
performance variables as they affect capital structure of the sampled firms. It is thus
agreed that the effect of size in capital structure choice in Nigeria cannot be
underestimated for instance most of the variables who have earlier renounced the risk
efficiency hypothesis concurred after the inclusion of size as the moderating variable.
The study finally conclude that in the choice of capital structure of non-financial firms
on the Nigeria Stock Exchange, the effectiveness and efficiency of past performance
is not to be underrated as proved by the study while researchers should no more look
at capital structure research from unidirectional angle alone instead, a bidirectional
approach should be adopted as the research on capital structure is still continuing
because of the lack of consensus on what and what not, how and how not capital
structure choice is been achieve by managers of firms.
5.4 Recommendations
This study was carried out to add to the existing pool of wealth of research knowledge
in corporate financing and the capital structure literature and to know whether the
direction of capital structure choice in Nigeria is unidirectional as portend by some
researchers or bidirectional as investigated by this thesis. In view of the findings of
this study, it is of great importance that recommendations should be made. For this
purpose, the recommendations are made not only for academic purposes but for
management decision and policy-making in the larger economy.
At the management level, it is recommended that management should endure to
intensify effort to further to look beyond academic research and be more practical in
their pursuit of optimum capital structure that maximizes the expectation of the
shareholder. It is equally recommended that in choosing the mode of financing to be
employed, corporate managers should seek the advice of experts in analysing their
firm’s financial needs and profitability situation also consider other factors that are
113
critical in determining the effect of financial performance on their capital structure
choice in Nigeria situation.
While at the policy level, it could be concluded that the volatility in the economic
environment and political environment in Nigeria has really made creditors be warier
of how, when and to whom funds are released to in the economy. This could be
attributed to the lack of stable and consistent regulations in the financial sectors that
have eroded the integrity of the sector. It is therefore recommended by this study that
the arms of government saddled with this responsibility should live up to expectation
so that rules and regulation to make the banking sector, capital market, the operators
and instruments function well in the financial intermediation process more enabling
are put in place. With this in place, corporate financiers will be willing to deal with
their debtors accordingly while the firms will have better, comparable and conducive
funding opportunities.
Finally, it has been observed that most investigations into the capital structure research
have been on its effect on firms' financial performance with little or no efforts at
exploring the possibility of a reverse causation between financial performance and
capital structure. Therefore, this study will further be an eye opener for the researchers
in the areas of corporate finance, related fields and the entire academic community to
delve more into the reverse causation issues in corporate finance literature so that more
and more contributions could make for a better understanding of this phenomenon.
5.5 Suggestions for Further Research
This study because of the characteristics of the financial sector in the use of leverage
in their capital structure were excluded, we suggest that this type of investigation
should be extended to them so that a more realistic conclusion can be made on the
effect of financial performance on capital structure in Nigeria are further validate or
invalidate the existence of the reverse causality hypothesis.
Another thing is that the earlier study carried out on Nigeria applied only to return on
equity as a measure of performance while leverage was represented by short long and

114
total capital whereas, our study employed as a proxy of profitability two accounting
ratios (return on assets and return on capital employed ratios) and two market ratios
(earnings per share and market-to-book value of equity) while the ratio of total debt to
total assets, debt-equity ratio and long-term were to measure leverage in Nigerian
context. However, in some other studies, profit efficiency that was arrived at using the
Data Envelopment Analysis was used to proxy profitability while others proxy it by
technical efficiency, dual X efficiency and firm efficiency. It is my belief that these
proxies can still be employed in the study of firm performance and its effect on the
capital structure by interested researchers in the field of corporate finance.
Finally, it will be recalled that this study applied the dynamic estimation technique in
its analysis, this study is encouraging intending researchers to further explore other
estimation techniques so that we will have more insight and a better understanding of
the problem at hand in the Nigerian situation.
115
REFERENCES
Abata, M. A, & Migiro, S. O. (2016). Capital structure and firm performance in
Nigerian-listed companies. Journal of Economics and Behavioral Studies
8(3), 54-74.
Abdul, M. (2015). Investigating capital structure decisions and its effect on the
Nigerian capital market. Second 21st Century Academic Forum Conference
Proceedings 5(1), Boston, USA at Harvard.
Abdulkadir, A. T. A & Ozlem, S (2015). Capital Structure and firm
performance: An analysis of manufacturing firms in Turkey. Eurasian
Journal of Business and Management, 3(4), 13-22.
Abor, J. (1999). The effect of capital structure on profitability: an empirical analysis
of listed firms in Ghana. Journal of Risk Finance, 6(5), 438-447.
Abor, J. (2007). Debt policy and performance of SMEs: evidence from Ghanaian and
South Africa firms. Journal of Risk Finance, 8(4), 364-379.
Abor, J. (2008). Determinants of the Capital Structure of Ghanaian Firms. Research
Paper No. 176. African Economic Research Consortium, Nairobi. Retrieved
from: http//dspace.cigilibrary.org/jspui/bitstream/123456789/32100/1/RP176. pdf
Aburub, N. (2012). Capital Structure and Firm Performance: Evidence from
Palestine stock exchange. Journal of Money, Investment and Banking, 23,
109-117.
Adeusi, S.O., Sulaiman, L.A. & Azeez, B. A. (2013). Impact of capital market
development on the Nigerian economy: A post-SAP analysis. Journal of
Economics and Behavioral Studies 5(1), 1-7.
Aguinis, H. E., Edwards, J. R. & Bradley, K. J., (2016). Improving our understanding
of moderation and mediation in strategic management research.
116
Organizational Research Methods 1-21. Retrieved from:
http//www.hermanaguinis.com/ORMinpress.pdf 29/8/2017
Aiken, L. A., & West, S. G. (1991). Multiple regression: Testing and interpreting
interactions. Newbury Park, CA: Sage.
Akerlof, G.A. (1970). The market for "lemons": Quality uncertainty and the market
mechanism. The Quarterly Journal of Economics. 84(3), 488-500.
Akintoye, I. R. (2008). Sensitivity of performance to capital structure. European
Journal of Social Science, 7(1), 23-31.
Akintoye, I.R. (2008). Effect of capital structure on firms’ performance: the Nigerian
experience. European J. Economics, Finance and Administrative Sciences,
10(1), 233-43.
Al-Taani, K. (2013). The relationship between capital structure and firm
performance: Evidence from Jordan. Journal of Finance and Accounting.
1(3), 41-45. doi: 10.11648/j.jfa.20130103.11.
Anafo, S. A., Amponteng, E. &Yin, L. (2015). The Impact of Capital Structure on
Profitability of Banks Listed on the Ghana Stock Exchange. Research
Journal of Finance and Accounting, 6(16), 26-34.
Andersen, T.J. (2005). Risk management, capital structure, and performance.
Global Business & Economics Anthology 10(3), 37-52.
Antoniou, A., Guney, Y., & Paudyal, K. (2002). The determinants of corporate
capital structure: evidence from European countries: Working paper,
University of Durham.
Antoniou, A., Guney, Y., & Paudyal, K. (2008). The determinants of capital
structure: capital market-oriented versus bank-oriented institutions. Journal
of Financial and Quantitative analysis, 43(1), 59-92

117
Anyanwu, J. C. (1993). Monetary Economics Theory, Policy and Institutions, Lagos,
Hybrid Publishers Ltd.
Arellano M. & Bond S. (1991) “Some tests of specification for panel data, Monte
Carlo evidence and an application to employment equations”, RES 58, 277–
297.
Arnold, G. (2008). Corporate Financial Management. (4th ed.). Harlow: Prentice-
Hall.
Assad, N. N. (2016). Effect of capital structure on firm profitability (An empirical
evidence from London, UK), Global Journal of Management and Business
Research 16 (4), 8 -20.
Auerbach, A.S. (1985). Real determinants of corporate leverage. In: Friedman,
B.M.(Ed.). Corporate Capital Structures in the United States. Chicago:
University-of-Chicago-Press.
Ayuki, N. S. (2015). Profit efficiency and capital structure of banks in Ghana: A
DEA approach. Unpublished MPhil Thesis, Legon., University of Ghana.
Babatunde, A. A. (2016). Empirical evidence on capital structure determinants in
Nigeria. Journal of Economics and International Finance, 8(6), 79-84.
Baker, M.P. & Wurgler, J. (2002). Market timing and capital structure. Journal of
Finance 57, 1–32.
Baloch, Q. B, Ihsan, A., Kakakhel, S. J & Sethi S. (2015). Impact of firm size, asset
tangibility and retained earnings on financial leverage: Evidence from auto
sector, Pakistan. Abasyn Journal of Social Sciences. 8 (1), 143-155
Baltagi B. H. (2002) Econometric Analysis of Panel Data, (3rd
ed). John Wiley and
Sons.
118
Baltagi, B.H., Bresson G. & Etienne, J. M. (2015) Hedonic housing prices in Paris: an
unbalanced spatial lag pseudo-panel model with nested random effects.
Journal of Applied Econometrics, 30, 509–528.
Barclay, M. J., Smith, C. W., & Watts, R. L. (1995). The determinants of corporate
leverage and dividend policies. Journal of applied corporate finance, 7(4), 4-
19.
Baum, C. F., Schaffer M. E. & Stillman, S. (2003.) Instrumental variables and GMM:
Estimation and testing. The Stata Journal, 3(1), 1–31.
Baumol, W.J. (1965). The stock market and economic efficiency. New York:
Fordham University-Press.
Bayrakdaroglu, A., Ege, I., & Yazici, N. (2013). A panel data analysis of capital
structure determinants: Empirical results from Turkish capital market.
International Journal of Economics and Finance, 5(4), 131-140.
Berger A. N. & Bonaccorsi di Patti, E. (2002). Capital structure and firm
performance: A new approach to testing agency theory and an
application to the banking industry being a paper presentation at
JFI/FRBNY/NYU Symposium on “Corporate Governance in the Banking and
Financial Services Industries,” October
Berger, A. N. & Bonaccorsi di Patti, E. (2006). Capital structure and firm
performance: A new approach to testing agency theory and an application to
the banking industry. Journal of Banking & Finance, 30(4), 1065-1102.
Bhaduri, S. N. (2002). Determinants of capital structure choice: a study of the Indian
corporate sector. Applied Financial Economics, 12(9), 655-665.
Bond, S. (2002) “Dynamic panel data models: A guide to micro data methods and
practice”. The Institute for Fiscal Studies, WP 9/-02.

119
Booth, L., Aivazian, V., Demirguc¸-Kunt, A. & Maksimovic, V. (2001). “Capital
Structures in Developing Countries”, Journal of Finance, 56, 87–130.
Boyd, B. K., Bergh, D. D., Ireland, R. D., & Ketchen, D. J. (2013). Constructs in
strategic management. Organizational Research Methods, 16(1), 3-14.
Bradley, M., Gregg, J.A. & Kim, E.H. (1984). On the existence of an optimal
capital structure: Theory and evidence. The Journal of Finance. 39(3),
1421-1460.
Brealey, R.A., Myers, S. C. & Allen, F. (2011). Principles of corporate finance
(10th ed.). New York: McGraw Hill/Irwin.
Brigham, E. F., & Michael C. E. (2011). Financial management: Theory and
Practice (13th ed.). Ohio: South-Western Cengage Learning.
Brooks, C. (2008). Introductory econometrics for finance. (3rd ed.). New York:
Cambridge University Press
Bryman, A., & Bell, E. (2007). Business research methods (2nd ed.). New York:
Oxford University Press Inc.
Burns, N., & Groove, S. K. (2005). The practice of nursing research: Conduct, critique
& utilization. (5th ed.). Philadelphia: W. B. Saunders Company.
Chakravarthy, B. S. (1986). Measuring strategic performance. Strategic Management
Journal, 7(5), 437-458. doi: 10.1002/smj.4250070505
Champion, D. (1999). Finance: the joy of leverage. Harvard Business Review, 77(4),
19-22.
Chandrasekharan C. V. (2012). Determinants of capital structure in the Nigerian
listed firms. International Journal of Advanced Research in Management
and Social Sciences 1(2), 108-133.
120
Caselli, F., Esquivel, G., & Lefort, F. (1996). Reopening the convergence debate: A
new look at cross-country growth empirics. Journal of Economic Growth, 1(3),
363-389. doi:10.1007/BF00141044.
Chen Long & Xinlei Zhao (2005). Understanding the roles of the market-to-book
ratio and profitability in corporate financing decisions. Retrieve on March 23rd,
2017
dfs.semanticscholar.org/23f6/9b7e1b3ab12b553eea5008d629147d2f4f83.pdf
Chen, L. & Xinlei Z. (2006). On the relation between the market-to-book ratio,
growth opportunity, and leverage ratio. Finance Research Letters, 3(4), 253-
266.
Chen, J. (2004). Determinants of capital structure of Chinese listed companies.
Journal of Business Research, 57, 1341 – 1351.
Cheng, M & Tzeng, Z. (2011). Does Leverage and Efficiency Affect Each Other.
Journal of Accounting, Finance and Economics 1(1), 77-95
Cho, H., & Pucik, V. (2005). Relationship between innovativeness, quality, growth,
profitability, and market value. Strategic Management Journal, 26(6), 555-
575. doi: 10.1002/smj.461.
Creswell, J. W. (2003). Research design: Qualitative, quantitative, and mixed
method approaches (2nd) Uk: Sage Publishers Ltd.
Crossan, F. (2003). Research philosophy: towards an understanding. Nurse
researcher, 11(1), 46-55. 10.7748/nr2003.10.11.1.46.c5914.
Dare Funso, D. & Olorunfemi, S. (2010). Capital Structure and corporate
performance in Nigeria petroleum industry: Panel data analysis. Journal of
Mathematics and Statistics 6(2), 168-173.
Davidson, J. (2000). Econometric methods. New Jersey: Wiley
121
DeAngelo, H. & Masulis, R. W. (1980). Optimal capital structure under corporate
and personal taxation. Journal of financial economics, 8(1), 3-29.
Degryse, H., Goeij, P., & Kappert, P. (2010). The impact of firm and industry
characteristics on small firms’ capital structure. Small Business Economics,
38(4), 431-447.
Demsetz, H. & Villalonga, B. (2001). Ownership structure and corporate
performance. Journal of Corporate Finance 7(3), 209–233.
Demsetz, H. (1973). Industry structure, market rivalry and public policy. Journal of
Law and Economics, 16(1), 1–9.
Dennis, C. R. (2011). Prediction in Abundant High –Dimensional Linear Regression.
Electronic Journal of Statistic, 1(1), 3029-3059.
Dollar, D., & Kraay, A. (2003). Institutions, trade, and growth. Journal of Monetary
Economics, 50(1), 133-162.
Drury, C. (2004). Management and cost accounting: Student's manual. (6th ed.).
London: Thomson Learning.
Duffie, D., Saita, L. & Wang, K. (2005). The survival of American firms. Working
paper, Stanford Graduate School of Business.
Ebaid, I. E. (2009). The impact of capital structure choice on firm performance:
empirical evidence from Egypt. Journal of Risk Finance, 10(5), 477-487.
Ebrahim, M. A., Abdullah, K. A., Faudziah, H. B. F. & Othman, Y. A. (2014). The
measurements of firm performance’s dimensions. Asian Journal of Finance
& Accounting, 6(1), 24-49.
122
Efobi, U & Uremadu, S O (2009). The effect of capital structure on corporate
profitability: An empirical analysis of listed companies in Nigeria. i-Manager's
Journal on Management; Nagercoil, 3(4), 55-61.
Eilon, S. (1992). Key ratios for corporate performance. Omega, 20(3), 337-343.
Esosa, B. O. (2007). Capital markets – African & global. Lagos: The Book House
Company.
Ezeoha, A. E. (2008), Firm size and corporate financial-leverage choice in a
developing economy, The Journal of Risk Finance, 9(4). 351 – 364.
Fabozzi, F.J. & Drake, P. P. (2009). Finance: capital markets, financial
management, and investment management, New Jersey: John Wiley and
Sons.
Fama, E. F., & French, K. R. (2002). Testing trade-off and pecking order predictions
about dividends and debt. The review of financial studies, 15(1), 1-33.
Fazle, R., Tahir, A., Ahmad, Z. & Mohammed A. T. (2016). Capital structure and
firm efficiency: Case of Pakistan. Indian Journal of Finance, 10(2), 50-66.
Federico, J. S. (2016). Advances in the research on young business growth:
persistence, impact on profits and the moderating role of firm age. An
unpublished PhD Thesis, Barcelona, UAB..
Fosberg, R. H., & Ghosh, A. (2006). Profitability And capital structure of AMEX
and NYSE firms. Journal of Business & Economics Research, 11, 57-64.
Fosu, S. (2013). Capital structure, product market competition and firm performance:
Evidence from South Africa. The Quarterly Review of Economics and
Finance, 53(2), 140–151.
123
Frank, M. Z., & Goyal, V. K. (2008). Testing the pecking order theory of capital
structure. Journal of financial economics, 67(2), 217-248.
Frank, M. Z., & Goyal, V. K. (2009). Capital structure decisions: which factors are
reliably important? Financial Management, 38(1), 1-37.
Frazier, P. A., Tix, A. P., & Baron, K. E. (2004). Testing moderator and mediator
effects in counselling psychology. Journal of Counselling Psychology, 51(1),
115–134.
Friedlob, G. T., & Franklin, J. P. (1996). Understanding Return on Investment.
Chicago: Wiley.
Garson, D. G. (2012). Testing Statistical Assumptions. Asheboro: Statistical
Associates Publishing Blue Book Series
Gill, A. & Mathur, N. (2011). Factors that influence financial leverage of Canadian
firms, Journal of Applied Finance & Banking, 1 (2), 19-37.
Glick, W. H., Washburn, N. T., & Miller, C. C. (2005). The myth of firm
performance. Proceedings of the Annual Meeting of American Academy of
Management. Honolulu, Hawaii.
Gorton, G., & Rosen, R. (1995). Corporate control, portfolio choice, and the decline
of banking. Journal of Finance, 50(5), 1377-1420.
Goyal, A.M. (2013). Impact of capital structure on performance of listed public
sector banks in India. International Journal of Business and Management
Invention, 2(10), 35-43.
Granger, C. W. J. (1969). "Investigating causal relations by econometric models and
cross-spectral methods". Econometrica. 37 (3), 424–438.
doi:10.2307/1912791. JSTOR 1912791.

124
Grossman, S.J. & Hart, O.D. (1982). Corporate financial structure and managerial
incentives. In: J. J. McCall, (Ed.). The economics of information and
uncertainty. Chicago: University of Chicago Press, 107-140.
Gujarati, D. N. (2013). Basic econometrics, (5th ed.). New York: The McGraw-Hill
Companies.
Gwatidzo T. (2009). Determinants of capital structure in Africa. Unpublished PhD
thesis, South Africa. University of Witwaterstrand.
Handoo, A. & Sharma, K. (2014). A study on determinants of capital structure in
India, IIMB Management Review, 26(3), 170-182.
Harris, M. & Raviv A. (1991). The Theory of capital structure. The Journal of
Finance. 46(1), 297-355.
Harvey, C. R., Lins, K. V., & Roper, A. H. (2004). The effect of capital structure
when expected agency costs are extreme. Journal of Financial Economics,
74(1), 3–30.
Harwell, M. R. (2011). Research design in qualitative/quantitative/mixed methods:
Handbook for research in education. (2nd ed.). Los Angeles, CA: Sage.
He, T. (2013). The Comparison of impact capital structure to corporate performance
between Chinese and European listed firms. Master Thesis, Jonkoping
International Business School.
Hovakimian, A., Hovakimian, G., & Tehranian, H. (2004). Determinants of target
capital structure: The case of dual debt and equity issues. Journal of
Financial Economics, 71(3), 517-540.
Hovakimian, A., Opler, T., & Titman, S. (2001). The debt-equity choice. Journal of
Financial and Quantitative analysis, 36(1), 1-24.

125
Huang, G., & Song, F.S. (2006). The Determinants of capital structure: Evidence
from China. China Economic Review, 17, 14-36.
Hutchinson, R.W. & Hunter, R.L. (1995). Determinants of capital structure in the
retailing sector in the UK., The International Review of Retail, Distribution
and Consumer Research, 5(1), 63-78.
Jensen, M. C, & Meckling, W. H. (1976). Theory of the firm: Managerial behaviour,
agency costs and capital structure. Journal of Financial Economics, 3(4), 305–
360.
Jensen, M. C. (1986). The agency costs of free cash flows, corporate finance,
and takeovers. American Economic Review, 76(2), 323-329.
Jensen, M. C., & Meckling, W. H. (1979). Rights and production functions: An
application to labour-managed firms and codetermination. Journal of
Business, 52(4), 469-506.
Johnson, R.B. & Onwuegbuzie, A. J. (2004). Mixed methods research: A research
paradigm whose time has come, American Educational Research Association,
33(7), 14-26. doi.org/10.3102/0013189X033007014
Kalpana, V. (2014). A Study on leverage analyses and its impact on profitability of
select steel companies traded in BSE (From 2003 To 2012). Indian Journal of
Applied Research, 4(10), 276 - 280.
Karadeniz, E., Kandır, S. Y. & Iskenderoğlu, Ö. (2011). Firm size and capital
structure decisions: evidence from Turkish lodging companies, International
Journal of Economics and Financial Issues, 1(1), 1-11.
Kayhan, A., & Titman, S. (2003). Firms’ histories and their capital structure. NBER
Working Paper (10526).

126
Kendall, M. G & Buckland, R. W (1971). A dictionary of statistical terms. New York:
Hafner Publishing Company.
Khan A.G. (2012). The relationship of capital structure decision with firm
performance: A study of the engineering sector of Pakistan, International
Journal of Accounting and Financial Reporting, 2(1), 305-360.
Kodongo, O., Mokoaleli-Mokoteli, T. & Maina, L. K. (2014). Capital structure,
profitability and firm value: Panel evidence of listed firms in Kenya. MPRA
Paper No. 57116, Retrieved from: http//mpra.ub.uni-
muenchen.de/57116/.
Kothari, C. (2014). Research methodology, methods and techniques. (3rd ed.). New
Delhi: New Age International.
Kraemer, H. C., Wilson, G T., Fairburn, C. G., & Agras, W. S. (2002). Mediators and
moderators of treatment effects in randomized clinical trials. Archives of
General Psychiatry, 59(10), 877–883.
Krasauskitie, E. (2011). Capital structure of SMEs: Does size matter? Empirical
investigation of Baltic countries. Unpublished Master’s thesis. Aarhus
University, Business and social sciences.
Kraus, A. & Litzenberger, R.H. (1973). A state preference model of optimal financial
leverage. Journal of Finance, 28(4), 911–922.
Kumar, K.B., Rajan, R.G. & Zingales, L. (2001). What determines firms size.
Working Paper Series No. 496, University of South California (USC) Finance
and Business Economics.
Kumar, N.S. (2015). Capital structure and its impact on profitability. International
Journal of Science, Technology & Management, 4(2), 24-30.
127
Kyereboah-Coleman, A. (2007). The impact of capital structure on the performance
of microfinance institutions. The Journal of Risk Finance, 8(1), 56–71.
Lang, L. E., Ofek, E., & Stulz, R. (1996). Leverage, Investment and Firm Growth.
Journal of Financial Economics, 40(1), 3-29.
Lawal, A. B., Terer, E., Kiyanjui, M. W. & Kayode, A. M. (2014). Effects of capital
structure on firm’s performance: Empirical study of manufacturing
companies in Nigeria. Journal of Finance and Investment Analysis, 3(4), 39-
57.
Leary, M. T., & Roberts, R. M. (2004). Do firms rebalance their capital structure.
Working paper, Duke University. Durham
Ledyaeva S. & Linden, M. (2006) “Testing for FDI gravity model in Russian
regions”, Dept. of Business and Economics/University of Joensuu, WP-32.
Lindblom, T., Sandahl, G., & Sjogren, S. (2011). Capital structure choices.
International Journal of Banking, Accounting, and Finance, 3(1), 4-30.
Mahfuzah, S. & Raj, Y. (2012). “Capital Structure and Firm Performance: Evidence
from Malaysian listed companies”, International Congress on
Interdisciplinary Business and Social Science: Procedia Social and Behavioral
Sciences 65, 156 – 166.
Marangu, K. & Jagongo, A. (2014). Price to book value ratio and financial
statement variables: An empirical study of companies quoted at Nairobi
securities exchange, Kenya. G.J.C.M.P., 3(6), 50-56.
Margaritis, D., & Psillaki, M. (2007). Capital structure and firm efficiency. Journal
of Business Finance and Accounting, 34(9-10), 1447-1469.
Margaritis, D., & Psillaki, M. (2010). Capital structure, equity ownership and firm
performance. Journal of Banking and Finance, 34(3), 621-632.
128
Marsh, P. (1982). The choice between equity and debt: An empirical study. The
Journal of Finance, 37(1), 121-144.
McClelland, D. (2004). The achieving society (4th ed.). Princeton, N.J.: Van Nostrand.
McClure, B. (2017). Spotting profitability with ROCE. Retrieve August 15, 2017, from
http://www.investopedia.com/articles/stocks/05/010305.asp.
Mesquita, J. M. C., & Lara J. E. (2003). Capital structure and profitability: The
Porazilian Case. Federal University of the State of Minas Gerais.
Milad, E., Abbasali, P., Naser, A. Y. T., Milad, H. & Ali, A. A. S. (2013). The effects
of performance evaluation market ratios on the stock return: Evidence from
the Tehran stock exchange. International Research Journal of Applied and
Basic Sciences, 4 (3), 696-703.
Miller, M. H. (1977). Debt and taxes. Journal of Finance, 32(2), 261–275.
Mireku, K., Mensah, S. & Ogoe, E. (2014). The relationship between capital
structure measures and financial performance: Evidence from Ghana.
International Journal of Business and Management, 9(6), 151-160.
Mkansi, M & Acheampong, E, A. (2012). Research philosophy debates and
classifications: Students’ dilemma”. The Electronic Journal of Business
Research Methods, 10(2), pp 132- 140.
Modigliani, F. & Miller, H. (1958). The cost of capital, corporate finance and the
theory of investment. The American Economic Review, 48 (3), 261-297.
Modigliani, F. & Miller, M. H. (1963). Corporate income taxes and the cost of
capital: A correction. American Economic Review, 53(3), 433-443.
Modugu, K. P. (2013). Capital structure decision: An overview. Journal of
Finance and Bank Management, 1(1), 14-27.

129
Mohamed, A., & Inunjariya. (2015). Effect of capital structure on profitability of food
and beverage sectors in Srilanka. Epra International Journal of Economic and
Business Review, 3(11), 57-63.
Mostafa, H. T. & Shivaraj, B. (2014). Relationship between market-to-book equity
ratio and firm’s leverage: a case study of firms listed on national stock
exchange of India. Asian Journal of Research in Business Economics and
Management. 4(9), 114-120.
Mramor, D., & Crnigoj, M. (2009). Determinants of capital structure in emerging
European economies: Evidence from Slovenian firms. Emerging Markets
Finance and Trade, 47(1), 72-89.
Mugenda, M.O. (2010). Research methods: Quantitative and qualitative approaches.
Nairobi: Laba Graphics Services.
Mujahid, M. & Akhtar, K. (2014). Impact of capital structure on firms financial
performance and shareholders wealth: Textile sector of Pakistan.
International Journal of Learning & Development, 4(2), 27-33.
Mule, R. K., Mukras, M. S. & Nzioka, O. M. (2015). Corporate size, profitability and
market value: an econometric panel analysis of listed firms in Kenya European
Scientific Journal, 11(13,) 1857 – 7881.
Muritala, T. A. (2012). An empirical analysis of capital structure on firms’
performance in Nigeria. International Journal of Advances in Management
and Economics, 1(5), 116-124.
Mwangi, M. & Birundu, E. M. (2015). The effect of capital structure on the financial
performance of small and medium enterprises in Thika Sub-County, Kenya.
International Journal of Humanities and Social Science, 5(1), 151-156.
Mwangi, L. W., Muathe, S. M. & Kosimbei, G. (2014). Relationship between capital
structure and performance of non-financial companies listed in the Nairobi

130
Securities Exchange, Kenya. Global Journal of Contemporary Research in
Accounting, Auditing and Business Ethics, 1(2), 72-90.
Myers, S. C. & Majluf, N. (1984). “Corporate Financing and investment decisions
when firms have information that investors do not have”. Journal of
Financial Economics, 13(2), 187-221.
Myers, S. C. (1977). Determinants of corporate borrowing. Journal of Financial
Economics, 5(2), 147-175.
Myers, S.C. (1984). Finance Theory and financial strategy. Interfaces, 14(1), 126-137.
Myers, S.C. (2001). “Capital structure”. Journal of Economic Perspectives,
15(2), 81-102.
Nasimi, R. N. (2016). Determinants of Capital Structure (An Empirical evidence,
US). Global Journal of Management and Business Research, 16(4), 29-41.
Nassar, S. (2016). The impact of capital structure on Financial performance of the
firms: Evidence from Borsa Istanbul. Journal of Business and Financial Affairs
5:173. doi:10.4172/2167-0234.1000173.
Neuman, W. L. (2000). Social research methods: Qualitative and quantitative
approaches. Boston: Allyn and Bacon Publishers.
Neus, W. & Walter, A. (2008). Lines of research in fifty years of corporate financial
theory. Zeitschrift für Betriebswirtschaft, 78 (6), 1-37.
Newing, H. (2011). Conducting research in conservation: social science methods
and practice. New York: Routledge.
Nirajini, A. & Priya, K. B. (2013). Impact of capital structure on financial
performance of the listed trading companies in Sri Lanka. International
Journal of Scientific and Research Publications, 3(5), 1-9.
131
Niresh, A. (2012). Capital structure and profitability in Srilankan Banks. Global
Journal of Management and Business Research. 12(13), 67-74.
Nweze, A. U. (2011). Profit planning: A quantitative approach (3rd ed.). Enugu:
M’Cal Communications International.
Nyor, T & Yunusa, A. (2016). capital structure and operating performance of listed
conglomerate firms in Nigeria. International Journal of Finance and
Accounting, 5(2): 126-133, DOI: 10.5923/j.ijfa.20160502.06.
O’Brien, J. P. (2003). The capital structure implications of pursuing a strategy of
innovation. Strategic Management Journal, 24(5), 415-431.
O’Brien, T., & Vanderheiden, P. (1987). Empirical measurement of operating
leverage for growing firms. Financial Management, 16(2), 45-53.
Ogebe, J. O., Ogebe, P. O. & Alewi, K. (2013). The Impact of capital structure on
firms’ performance in Nigeria. MPRA Paper No. 46173. Retrieve March 27,
2017, from http://mpra.ub.uni-muenchen.de/46173.
Ogujiuba, K. & Obiechina, M. E. (2011). Financial sector reforms in Nigeria: Issues
and challenges. International Journal of Business and Management, 6(6), 222-
233.
Oino, I. & Ukaegbu, B. (2015). ‘The impact of profitability on capital structure and
speed of adjustment: An empirical examination of selected firms in Nigerian
stock exchange’, Research in International Business and Finance, 35, 111 -
121.
Oke, M. O. & Obalade, A. A. (2015). Testing the validity of optimal capital structure
theory in Nigerian listed oil firms. International Journal of Economics,
Commerce and Management 3(3), 1-15.

132
Oladeji, T., Ikpefan, A. O & Olokoyo, F. O. (2015). An Empirical analysis of
capital structure on performance of firms in the petroleum industry in
Nigeria. Journal of Accounting and Auditing: Research & Practice.
2015(2015) Article ID 675930, DOI: 10.5171/2015.675930.
Olakunle, A. O & Jones, P.L. (2014). Assessing the impact of size on the capital
structure choice for listed Nigeria firms. International Journal of Academic
Research in Business and Social Sciences, 4(7), 184-202.
Olaogun J. A (2010), Research Methodology. Lagos, Nigeria: Boly Bay Publishers.
Olokoyo F.O (2012). Capital structure and corporate performance of Nigerian
quoted firms. Unpublished PhD thesis submitted to the school of postgraduate
studies of Covenant University, Ota, Ogun State, Nigeria.
Olowe, O., Matthew, O., & Fasina, F. (2011). Nigerian stock exchange and
economic development Knowledge Management, Information Management,
Learning Management, 14. 14-38.
Onaolapo, A. A., & Kajola, S. O. (2010). Capital structure and firm performance:
evidence from Nigeria. European Journal of Economics, Finance and
Administrative Sciences, 25, 70-82.
Onaolapo, A. A., Kajola, S. O & Nwidobie, M. B. (2015). Determinants of capital
structure: A study of Nigerian quoted companies. European Journal of
Business and Management 7(23), 170-183.
Onofrei, M., Tudose, M. B., Durdureanu, C., & Anton, S. G. (2015). Determinant
factors of firm leverage: An empirical analysis at Iasi county level, Procedia
Economics and Finance 20, 460-466.
Osuji, C.C. & Odita, A. (2012). Impact of capital structure on the financial
performance of Nigerian Firms. Arabic Journal of Business and
Management Review. 1(12), 43-52.

133
Otieno, O. L. (2015). The Relationship between capital structure, performance and
replacement of CEO in firms listed on the Nairobi Securities Exchange.
Unpublished PhD Thesis, Pretoria: University of South Africa.
Otieno, O. L. & Ngwenya, S. (2015). Bi-directional relationship between capital
structure and financial performance of firms listed on the Nairobi Securities
Exchange. Corporate Ownership and Control, 12(4), 103 - 116.
Oyefusi, S. A. & Mogbolu, R. O. (2003). Nigeria and the Structural Adjustment
Programme, in: Iyoha M. A. & Itsede C. O. (Eds.): Nigeria economy
structure, growth and development. Benin City: Mindex Publishing, 387-
402.
Ozkan, A. (2001). Determinants of capital structure and adjustment to long run
target: Evidence from UK company panel data. Journal of Business Finance
& Accounting, 28, 175–198.
Park, H. M. (2009). Linear regression models for panel data using SAS, Stata,
LIMDEP, and SPSS. Working Paper. Indiana University. Retrieve June 30,
2017, from http://www.indiana.edu/~statmath/stat/all/panel.
Pedace, R. (2013). Econometrics for dummies. Hoboken, New Jersey: John Wiley &
Sons, Inc.,
Polit, D., & Beck, C. (2003). Nursing Research: Principles & Methods, (7th ed.).
Philadelphia: Lippincott, Williams & Wilkins.
Punch, K. F. (2005). Introduction to social research: Quantitative and qualitative
approaches. London: Sage Publications Ltd.
Rahul, S. (2016). Capital structure analysis and its impact on earnings per share: A
study on top ten it companies In India. GE-International Journal of
Management Research, 4(4), 60-72.
134
Rajan, R. G., & Zingales, L. (1995). What do we know about capital structure?
Some evidence from international data. The Journal of Finance, 50(5),
1421-1460.
Rodrigues, J.F., Traina, A.J.M. & Traina Jnr., C. (2003). Frequency plot and relevance
plot to enhance visual data exploration. In: Brazilian Symposium of Computer
Graphic and Image Processing. p. 117–24.
Ross, S. (1977). The determination of financial structure: the incentive-signalling
approach. The Bell Journal of Economics, 8(1), 23–40.
Rutherford, B.A. (2002). Design and implementation of return on capital employed
performance indicators within a trading regime: The case of executive
agencies. Financial Accountability & Management, 18(1), 73-101.
Santos, J. B. & Brito, L. A. L. (2012). Toward a Subjective Measurement Model for
Firm Performance, BAR, Rio de Janeiro, 9(6), 95-117.
Saunders, M., Lewis, P., & Thornhill, A. (2009). Research methods for business
students (5th ed.). Harlow: Pearson Professional Ltd.
Scott, J. (1976). A theory of optimal capital structure. The Bell Journal of
Economics and Management Science, 33-54.
Sen, M., & Oruc, E. (2008). Testing of pecking order theory in ISE (Istanbul stock
exchange market). International Research Journal of Finance Economics, 21,
19-26.
Shumway, T. G. (2001). Forecasting bankruptcy more accurately: A simple hazard
model. Journal of Business, 74, 101–124.
Shyam-Sunder, L., & C Myers, S. (1999). Testing static tradeoff against pecking
order models of capital structure. Journal of financial economics, 51(2), 219-
244.
135
Singh, P. G. (2013). Interrelationship between capital structure and profitability with
special reference to manufacturing industry in India. International Journal of
Management and Social Sciences Research, 2(8), 55-61.
Sivathaasan, N. & Rathika, S. (2013). Capital structure and EPS: a study on selected
financial institutions listed on Colombo stock exchange (CSE) in Sri Lanka.
European Journal of Business and Management, 5(14), 69-73.
Skinner, R.C. (1990). The role of profitability in divisional decision making and
performance. Accounting and Business Research, 20(79), 135-141.
Skopljak, V. (2012). “Capital Structure and firm performance in financial sector:
evidence from Australia,” Asian Journal of Finance and Accounting, 4(1),
278 -298.
Smith, C. W. Jr. & Watts, R. L. (1992). Investment opportunity set and corporate
financing, dividend, and compensation policies. Journal of Financial
Economics, 32(3), 263-292. http://dx.doi.org/10.1016/0304-405X(92)90029-
W.
Solomon A. A., Amponteng, E. & Luu Yin (2015). The impact of capital structure
on profitability of banks listed on the Ghana stock exchange. Research
Journal of Finance and Accounting 6(16), 26-34.
Song, H. (2005). Capital Structure Determinants an Empirical Study of Swedish
Companies. Doctoral dissertation. Stockholm: The Royal Institute of
Technology.
Srivastava, N. (2014). Determinants of leverage of Indian companies: An empirical
analysis (A study of cement industry in India). Merit Research Journal of Art,
Social Science and Humanities. 2(2), 21-24.
136
Stern, D. I. (2011). From correlation to granger causality. Crawford School
Research Paper No 13. Electronic copy available at:
http://ssrn.com/abstract=1959624.
Stewart, G.B. (1990). The quest for value. New York: Harper Business.
Studenmund, A. H. (2017). Using econometrics: A practical guide (7th ed). Boston:
Pearson
Stulz, R. (1990). “Managerial discretion and optimal financing policies,” Journal of
Financial Economics, 26, 3-27.
Swain, K. R. & Das, P.C. (2017). Impact of capital structure on financial performance
and its determinants. International Journal of Informative & Futuristic
Research, 4(11), 8404-8413. retrieve August 8, 2017, from-
http://www.ijifr.com/searchjournal.aspx.
Titman, S. & Wessels, R. (1988). The determinants of capital structure choice. The
Journal of Finance, 43(1), 1-19.
Trochim, W. (2006). The research methods knowledge base, (2nd ed.). Cincinnati, OH:
Atomic Dog Publishing.
Twisk, J. W. R. (2013). Applied longitudinal data analysis for epidemiology: A
practical guide. (2nd Ed.). New York: Cambridge University Press.
Ubesie, M. C. (2016). The effect of capital structure on the financial
performance of Nigerian quoted conglomerates. European Journal of
Accounting, Auditing and Finance Research, 4(6), 61-69.
137
Venkatraman, N. & Ramanujam, V. (1986). Measurement of business performance
in strategy research: A comparison of approaches. Academy of Management
Review, 1(4), 801-814. doi: 10.2307/258398
Wahome, M. N., Memba, F. & Muturi, W. (2015). The effects of firm size and risk
on capital structure decisions of insurance industry in Kenya. International
Journal of Scientific and Research Publications, 5(8), 1-12.
Wald, J. K. (1999). How firm characteristics affect capital structure: An
international comparison. Journal of Financial Research, 22(2), 161-187.
Whetten, D. A. (1987). Organizational growth and decline process. Annual Review of
Sociology, 13(1), 335-358. doi: 10.1146/annurev.so.13.080187.002003.
White, H. (1980). A heteroskedasticity-consistent covariance matrix estimator and a
direct test of heteroskedasticity. Econometrica. 48, 817 – 838.
Wu, A. & Zumbo, B. (2008). Understanding and using mediators and moderators.
Social Indicators Research: An International and Interdisciplinary Journal for
Quality-of-Life Measurement, 87(3), 367-392.
Yadav, C. S. (2014). Determinants of the capital structure and financial leverage:
Evidence of selected Indian companies. Asia Pacific Journal of Research,
1(12), 121-130.
Yeh, H. H. & Roca, E. (2010). Macroeconomic conditions and capital structure:
Evidence from Taiwan. Griffith Business School, Discussion papers:
Finance, (2010-14).
Yeh, T. L. (2010). Bank loan loss provision decisions: Empirical analysis of
Taiwanese banks. Journal of Financial Services Marketing, 14(4), 278-289.
Yeh, T. L. (2011). Capital structure and cost efficiency in the Taiwanese banking
industry. The Service Industries Journal, 31(2), 237-249.

138
Yinusa, O. G. (2015). Dynamic analysis of the impact of capital structure on firm
performance. Unpublished PhD Thesis, Faculty of Business and Law, De
Montfort University. Leicester, England.
Yinusa, O. G., Russell, O., Somoye, C., Alimi, O. Y. & Ilo, B. M. (2016). Firm
performance and capital structure choice of firms: Evidence from Nigeria
Journal of Knowledge Globalization, 9(1), 1-16.

139
APPENDICES
Appendix A: Study Population
S/N Companies Sector
1 Ellah Lakes Plc Agriculture
2 FTN Cocoa Processors Plc ,,
3 Livestock Feeds Plc ,,
4 Okomu Oil Palm Plc ,,
5 Presco Plc ,,
6 A. G. Leventis Nigeria Plc Conglomerate
7 Chellarams Plc ,,
8 John Holt Plc ,,
9 SCOA Nig Plc ,,
10 Transnational Corporation of Nig. Plc ,,
11 UACN Plc ,,
12 Arbico PLC
Construction / Real
Estate
13 Costain (WA) Plc ,,
14 G CAPPA PLC ,,
15 Julius Berger Nig. Plc ,,
16 Roads Nig. Plc ,,
17 Skye Shelter Fund Plc ,,
18 Smart Products Nig. Plc ,,
19 UACN Property Development Co. Ltd ,,
20 Union Homes Real Estate Investment Trust ,,
21 7-Up Bottling Comp. Plc Consumer Goods
22 Cadbury Nig. Plc ,,
23 Champion Brew. Plc ,,
24 Dangote Sugar Refinery Plc ,,
25 DN Trye & Rubber Plc ,,

140
26 Flour Mills Nig. Plc ,,
27 Golden Guinea Brew. Plc ,,
28 Guinness Nig Plc ,,
29 Honeywell Flour Mill Plc ,,
30 International Breweries Plc ,,
31 Jos Int. Breweries ,,
32 MCNichols Plc ,,
33 Multi-Trex Integrated Foods Plc ,,
34 Nothern Nig. Flour Mills Plc ,,
35 Nascon Allied Industries Plc ,,
36 Nestles Nigeria Plc ,,
37 Nigerian Brew. Plc ,,
38 Nigerian Enamelware Plc ,,
39 P S Mandrides & Co Plc ,,
40 P Z Cussons Nig Plc ,,
41 Premier Breweries Plc ,,
42 Rokana Industries Plc ,,
43 U T C Nig. Plc ,,
44 Unilever Nig. Plc ,,
45 Union Dicon Salt Plc ,,
46 Vitafoam Nig. Plc ,,
47 Vono Products Plc ,,
48 Afrik Pharmaceuticals Plc Healthcare
49 EkoCorp Plc ,,
50 Evans Medical Plc ,,
51 Fidson Healthcare Plc ,,
52 Glaxo Smithkline Consumer Nig Plc ,,
53 May & Baker Nigeria Plc ,,
54 Morison Industries Plc ,,
55 Pharmaceuticals Plc ,,
56 Nigeria-German Chemicals Plc ,,

141
57 Pharma-Deko Plc ,,
58 Union Diagnostic & Clinical Services Plc ,,
59 Chams Plc ICT
60 Computer Warehouse Group Plc ,,
61 Courteville Business Solution Plc ,,
62 E-Tranzact International Plc ,,
63 Mass Telecommunication Innovations Nig. Plc ,,
64 MTech Communications Plc ,,
65 NCR (Nigeria) Plc ,,
66 Omatek Ventures Plc ,,
67 Tripple Gee and Company Plc ,,
68 Adswith Plc Industrial Goods
69 African Paints (Nigeria) Plc ,,
70 Ashaka Cem Plc ,,
71 Austin Laz & Company Plc ,,
72 Avon Crowncaps & Containers ,,
73 Berger Paints Plc ,,
74 Beta Glass Co Plc ,,
75 CAP Plc ,,
76 Cement Co. of North Nig. Plc ,,
77 CUTIX Plc ,,
78 Dangote Cement Plc ,,
79 DN Meyer Plc ,,
80 First Aluminium Nig. Plc ,,
81 Greif Nig. Plc ,,
82 IPWA Plc ,,
83 Lafarge African Plc ,,
84 Nigerian Ropes Plc ,,
85 Paints and Coatings Manufactures Plc ,,
86 Portland Paints & Products Nig. Plc ,,
87 Premier Paints Plc ,,

142
88 W A Glass Ind. Plc ,,
89 Aluminium Extrusion Ind. Plc Natural Resources
90 Aluminium Manufacturing Plc ,,
91 B.O.C. Gases Plc ,,
92 Multiverse Mining and Exploration Plc ,,
93 Thomas Wyatt Nig. Plc ,,
94 Anion International Plc ,,
95 BECO Petroleum Product Plc Oil and Gas
96 Capital Oil Plc ,,
97 Conoil Plc ,,
98 Eterna Plc ,,
99 Forte Oil Plc ,,
100 Japaul Oil &Maritime Service Plc ,,
101 Mobil Oil Nig Plc ,,
102 MRS Oil Nig Plc ,,
103 Navitus Energy Plc ,,
104 Oando Plc ,,
105 Rak Unity Pet. Comp. Plc ,,
106 Seplat Petroleum Development Company Ltd ,,
107 Total Nig. Plc ,,
108 Academy Press Plc Service
109 Afromedia Plc ,,
110 Airline Service & Logistics Plc ,,
111 Associated Bus Company Plc ,,
112 C & I Leasing Plc ,,
113 Capital Hotel Plc ,,
114 Caverton Offshore Support GRP ,,
115 DAAR Communications Plc ,,
116 Ikeja Hotel Plc ,,
117 Interlinked Technologies Plc ,,
118 Juli Plc ,,
143
119 Learn Africa Plc ,,
120 Lennards (Nig.) Plc ,,
121 Nigerian Aviation Handling Plc ,,
122 R T Briscoe Plc ,,
123 Red Star Express Plc ,,
124 Secure Electronic Technology Plc ,,
125 Studio Press (Nig.) Plc ,,
126 Tantalizers Plc ,,
127 Tourist Company of Nig. Plc ,,
128 Trans-Nationwide Express Plc ,,
129 Transcorp Hotels Plc ,,
130 University Press Plc ,,

144
Appendix B Secondary Data Collection Template
Company Name YEAR TDR DER LTD ATO EPS MBV ROA ROCE SIZE