effect of humidity on the creep response of cellulose
TRANSCRIPT

Purdue UniversityPurdue e-Pubs
Open Access Theses Theses and Dissertations
4-2016
Effect of humidity on the creep response ofcellulose nanocrystals filmsMarianne C. ValonePurdue University
Follow this and additional works at: https://docs.lib.purdue.edu/open_access_theses
Part of the Materials Science and Engineering Commons
This document has been made available through Purdue e-Pubs, a service of the Purdue University Libraries. Please contact [email protected] foradditional information.
Recommended CitationValone, Marianne C., "Effect of humidity on the creep response of cellulose nanocrystals films" (2016). Open Access Theses. 822.https://docs.lib.purdue.edu/open_access_theses/822
Graduate School Form 30 Updated ����������
PURDUE UNIVERSITY GRADUATE SCHOOL
Thesis/Dissertation Acceptance
This is to certify that the thesis/dissertation prepared
By
Entitled
For the degree of
Is approved by the final examining committee:
To the best of my knowledge and as understood by the student in the Thesis/Dissertation Agreement, Publication Delay, and Certification Disclaimer (Graduate School Form 32), this thesis/dissertation adheres to the provisions of Purdue University’s “Policy of Integrity in Research” and the use of copyright material.
Approved by Major Professor(s):
Approved by: Head of the Departmental Graduate Program Date
Marianne Catherine Valone
EFFECT OF HUMIDITY ON THE CREEP RESPONSE OF CELLULOSE NANOCRYSTALS FILMS
Master of Science in Materials Science Engineering
Jeffrey YoungbloodChair
John Howarter
Carlos Martinez
Jeffrey Youngblood
David Bahr 04/18/2016


i
i
EFFECT OF HUMIDITY ON THE CREEP RESPONSE OF CELLULOSE
NANOCRYSTALS FILMS
A Thesis
Submitted to the Faculty
of
Purdue University
by
Marianne C Valone
In Partial Fulfillment of the
Requirements for the Degree
of
Master of Science in Materials Science and Engineering
May 2016
Purdue University
West Lafayette, Indiana

! ii!
ACKNOWLEDGEMENTS
I would like to thank Professor Jeffrey P. Youngblood for his guidance and
support during the past two years. I would also like to thank Professors Carlos Martinez
and John Howarter for serving on my advisory committee. To Professor Carol
Handwerker for guiding my studies in sustainability. To my parents for always believing
in and supporting me in everything I do.
The work I have done would not have been possible without Shikha Shrestha,
Shane Peng, Reaz Chowdhury, Nelyan Lopez-Perez, Logan Kearney, Youngman Yoo,
Francisco Montes, Gamini Mendis, Kai Gao, and all my friends and colleagues I have
made at Purdue.
I also want to thank the Forest Products Laboratory for providing the Cellulose
Nanocrystals used for this work and providing the funding. And finally to Purdue
University for providing the Knox Fellowship during my first year of my degree.

! ! ! iii!
TABLE OF CONTENTS
Page
LIST OF TABLES .............................................................................................................. v LIST OF FIGURES ........................................................................................................... vi ABSTRACT ...................................................................................................................... vii CHAPTER 1. INTRODUCTION ....................................................................................... 1
1.1 Cellulose Nanocrystals ................................................................................ 1 1.1.1 Cellulose Nanocrystals Films ......................................................... 3
1.2 Creep ........................................................................................................... 4 1.2.1 Maxwell Model ............................................................................... 5 1.2.2 Kelvin-Voigt Model ........................................................................ 6 1.2.3 Burgers Model ................................................................................ 7
1.3 Dynamic Mechanical Analysis ................................................................... 8 1.4 Creep of Cellulose Nanocrystals ................................................................. 9 1.5 Humidity Effect on Polymer Films ........................................................... 10
CHAPTER 2. EXPERIMENTAL PROCEDURES .......................................................... 11 2.1 Materials ................................................................................................... 11 2.2 CNC Film Preparation .............................................................................. 12 2.2.1 Self Organized Films .................................................................... 13 2.2.1.1 Variations of Self Organized Films .................................. 14 2.2.2 Sheared Films ................................................................................ 14 2.3 Laser Cutter ............................................................................................... 15 2.4 Dynamic Mechanical Analysis ................................................................. 15 2.4.1 DMA Method ................................................................................ 16 2.4.2 Variations of DMA Method .......................................................... 17 2.5 Optical Microscopy ................................................................................... 18 CHAPTER 3. REULTS AND DISCUSSION .................................................................. 19 3.1 DMA Results of 3.5 wt.% Films ............................................................... 19 3.2 DMA Results of 9.1 wt.% Films ............................................................... 22 3.3 Comparison of 3.5 wt.% and 9.1 wt.% Films ........................................... 25 3.4 Optical Microscopy Images of 3.5 wt.% films ......................................... 28

! ! ! iv!
Page
3.5 Optical Microscopy Images of 9.1 wt.% films ......................................... 32 3.6 Comparison of 3.5 wt.% and 9.1 wt.% films Optical
Microscopy Images ................................................................................... 36
CHAPTER 4. CONCLUSIONS AND FUTURE WORK ................................................ 37 LIST OF REFERENCES .................................................................................................. 39

! v!
LIST OF TABLES
Table Page Table 1. Approximate weight of CNCs used to make 3.5 wt.% and 9.1 wt.% films ..... 12
Table 2. Slope changes for 3.5 wt.% films at 30°C and 50°C ....................................... 19 Table 3. Slope changes for 9.1 wt.% films at 30°C and 50°C ....................................... 22 Table 4. Average maximum strain and the time it took to reach this maximum
at 50°C for 3.5 wt.% and 9.1 wt.% films ......................................................... 25
Table 5. Average maximum strain and the time it took to reach this maximum at 30°C for 3.5 wt.% and 9.1 wt.% films ......................................................... 26

! vi!
LIST OF FIGURES
Figure Page Figure 1. Maxwell Model for creep ................................................................................ 5
Figure 2. Kelvin-Voigt Model for creep ......................................................................... 6
Figure 3. Burgers Model for creep .................................................................................. 7
Figure 4. TEM Image coupled with Image J of Forest Products Laboratory Cellulose Nanocrystals ................................................................................. 11
Figure 5. Representation of CNCs + water solution being poured into a petri dish ..... 13
Figure 6. Graphs of the strain response of 3.5 wt.% films at 30°C (a) and 50°C (b) ... 21 Figure 7. Graphs of the strain response of 9.1 wt.% films at 30°C (a) and 50°C (b) ... 24 Figure 8. Micrographs of 3.5 wt.% films before (a) and after (b) humidity
using non-polarized light .............................................................................. 30
Figure 9. Micrographs of 3.5 wt.% films before (a) and after (b) humidity using polarized light ...................................................................................... 31
Figure 10. Micrographs of 9.1 wt.% films before (a) and after (b) humidity using non-polarized light ............................................................................. 34
Figure 11. Micrographs of 9.1 wt.% films before (a) and after (b) humidity using polarized light ...................................................................................... 35

! vii!
ABSTRACT
Valone, Marianne C. M.S.M.S.E., Purdue University, May 2016. Effect of Humidity on the Creep Response of Cellulose Nanocrystal Films. Major Professor: Jeffrey P. Youngblood. Cellulose nanocrystals (CNCs) are a derivative of cellulose, the Earth’s most abundant
source of a sustainable polymer. There are many applications for CNCs such as batteries,
antimicrobial films, flexible displays and drug delivery. This research is focused on
CNCs films and the mechanical properties once humidity was introduced.
The creation of self-aligned CNCs films was utilized to perform dynamic mechanical
analysis (DMA) testing. The Forest Products Lab (FPL) in Madison, Wisconsin provided
the CNCs used. Both 3.5 wt.% and 9.1 wt.% films were made and tested. A DMA
method was created to test the creep response of the CNCs films at humidity levels of
80%, 40% and 0%. This method was performed at both 30°C and 50°C. Before and
after the films were tested in the DMA, optical microscopy images were taken to analyze
the structure of the films. It was found that the films experienced a higher strain rate at
30°C, but regardless of temperature the trend of strain was non-linear, with the highest
strain reached at 80% humidity. There was full creep recovery at 40% humidity and
shrinkage of the films once the humidity level reached 0%.
!1
CHAPTER 1. INTRODUCTION
1.1 Cellulose Nanocrystals
Cellulose is the most abundant renewable natural organic compound on Earth comprising
about 33 percent of all vegetable matter. It can be found in a multitude of sources
including plants, algae, tunicates, and certain species of bacteria. Cellulose nanocrystals
(CNCs) are the primary structural unit extracted from the mentioned sources. The
methods of extraction can either be chemical or mechanical to separate the crystalline
phase from the bulk cellulose [1]. These techniques include acid hydrolysis [2],
TEMPO-mediated oxidation [3], [4] and homogenization and grinding [5], [6]. The
CNCs provided from the Forest Products Laboratory (FPL) for this research were
extracted from bulk cellulose by acid hydrolysis.
CNCs have a rod-like shape with the dimensions varying depending on source i.e., 3-20
nm wide by 100-2000 nm long [7]. Although difficult to measure individual CNCs,
when together they offer many advantages opposed to just being renewable and
sustainable. CNCs have high tensile strength, 7.5 GPa and high elastic modulus, 110-220
GPa in the axial direction and 10-50 GPa in the transverse direction [8]. They also have
low coefficient of thermal expansion [9], easy orientability under shear [9], [10],
refractive index on par with most polymers [11] and uniform prismatic dimensions [12]–
[14]. Since the cost of cellulose nanocrystals is lower than other nanomaterials, such as
carbon nanotubes [15], they are desirable fillers for polymer matrix composites (PMCs).
However, there are still some problems with using CNCs as fillers due to their
hydrophilic nature and large interfacial attraction [1].

!2
Cellulose nanomaterials are renewable and offer high mechanical properties, hence they
are able to offer an alternative to traditional petroleum-based plastics in different fields of
study. The applications include batteries, antimicrobial films, flexible displays and drug
delivery [12]. These applications depend on the alignment of the CNCs, which will
change the optical, mechanical and thermal properties. Many mechanical properties have
already been discovered, however the effect of humidity on the creep of these CNCs has
not. The following research will describe the creep response when humidity is
introduced to CNC films.
!3
1.1.1 Cellulose Nanocrystals Films
Cellulose Nanocrystals are used to create films for many types of applications that will be
explained in this section. One of the applications involves creating recyclable organic
solar cells on cellulose nanocrystals substrates. One advantage of creating solar cells on
CNC substrates is the sustainability and recyclability. The film and substrate are able to
swell and once the water evaporates away, the CNC is left for recovery. Then the
components of the solar cell are allowed to separate. Although these solar cells are not
fully optimized yet, the research is promising as the power conversion efficiency reaches
to 2.7%. This is encouraging for the technology, which is headed towards sustainability
[16].
CNCs are low in toxicity and ecotoxicological risk, which has led to recent developments
for tissue engineering. In tissue engineering, dense films are relevant in skin tissue
engineering as well as preventing tissue adhesions in surgeries involving soft tissue and
regenerative medicine [17]. Although neat CNC films are not useful by themselves for
tissue engineering, adding CNCs for reinforcement to collagen-based composite films is
an alternative. This increased the mechanical properties and the stability, which led to an
increase in swelling capacity, a desirable characteristic for tissue engineering [18].
Polymer films are also used for food packaging applications. However, drawbacks of
using non-synthetic polymers include the lack of degradability, recyclability and the high
carbon footprint. There are multiple synthetic biodegradable polymers, such as
polyhydroxybutyrate (PHB) that have been developed that could be used for the food
packaging industry [19]. However, PHB is highly brittle, with poor mechanical and gas
barrier properties. These properties are critical for food storage [20]. Combining PHB
with cellulose will improve the gas barrier properties of the polymer and lead to further
food-packaging applications [21]. These are the variety of applications CNCs films
possess. Further mechanical testing, such as creep response, need to be analyzed to
expand the applications and uses of these films.

!4
1.2 Creep
When testing for mechanical properties of polymers, there are two types of testing: static
and transient. With regards to transient testing, there are two distinct measurements that
can be used: stress relaxation and creep. These measurements help to characterize the
material that is being tested. Stress relaxation measures the stress required to hold a
specimen at a fixed elongation with constant temperature. Stress and the stress relaxation
modulus are both functions of time. However, the research that will be explained in the
following chapters looked at the creep response to humidity while experiments were run
in the DMA. Creep test results are good for selecting a polymer or material that must
sustain loads for long time periods. A typical creep test is one in which the stress is held
constant and the strain is time dependent. During the creep test three different responses
may be observed: ideal elastic, ideal viscous and viscoelastic. Viscoelastic materials
have both viscous and elastic characteristics. These types of materials are able to have
full recovery due to the elastic property. However, the recovery is delayed because of the
viscous influence. Typically, a dashpot is used as the viscous element while an ideal
spring is used as the Hookean, or elastic, element for mechanical models. The spring
measures the elastic modulus of the material while the dashpot measures the viscosity.
There are multiple different creep models available to analyze viscoelastic materials,
which include Maxwell, Kelvin-Voigt, and Burgers Models [22]. In the following
sections, these three models will be explained in detail.

!5
1.2.1 Maxwell Model
The Maxwell Model is where the spring and dashpot are in series together as seen in
Figure 1.
Figure 1. Maxwell Model for creep.
Since the two elements are in series with one another, the total strain is actually the strain
of each individual element added together. The equation to determine strain rate using a
Maxwell is seen in Equation 1.
Equation 1
!"!" != !
1!
!"!" +
!!
However, as stated previously, creep has a constant stress, which is applied
instantaneously. This means the creep compliance, D(t) can be written as follows in
Equation 2 [22].
Equation 2
! ! = ! !(!)!!!= ! !! +
!!!!!= ! !! + !!

!6
1.2.2 Kelvin-Voigt Model
Unlike the Maxwell Model, the Kelvin-Voigt Model is where the spring and dashpot are
in parallel as seen in Figure 2.
Figure 2. Kelvin-Voigt Model for creep.
For this model, the strain on the two elements must be the same, but now the stresses are
combined. Thus the following equation shows the fundamental relation for this model.
Equation 3
! = !" + !! !"!"
As for determining the creep deformation, Equation 4 is used.
Equation 4
! ! = !
!7
These two models only give results for one transition opposed to multiple transitions.
Due to this, there are creep models used for multi-element materials [22].
1.2.3 Burgers Model
One multi-element model is the Burgers Model. This model combines the previous two
explained models together in series as seen in Figure 3 [23].
Figure 3. Burgers Model for creep.
This model separates the strain into three types of deformation: instantaneous, elastic and
plastic. Together the equation to determine the strain can be seen in Equation 5 [24].
Equation 5
! ! = ! !!!+ ! !!!"
1− exp − !!!"!!"+ !!!"
!
These different models of creep can be analyzed through different methods using the
dynamic mechanical analysis (DMA).

!8
1.3 Dynamic Mechanical Analysis
Dynamic mechanical analysis (DMA) is one of the basic tools used to measure the
viscoelastic properties of polymers. The viscoelastic properties can be related to
temperature, time, frequency, or even humidity if the relative-humidity chamber is placed
on the equipment. Different transitions and bulk properties of polymers can also be
analyzed by the DMA. The responses of materials placed in the DMA are measured by
applying an oscillating force to the material. Stress, the measure of force applied to an
area, and strain, the deformation of a sample, are the two most important concepts of
DMA. By obtaining these different mechanical properties, the performance of materials
in different applications can be projected. Since DMA relies on stress and strain, both
creep-recovery and dynamic tests can be performed on materials [25].
Research has been done in the past on the creep response of different polymeric materials
using the DMA. Previously, the creep response of wood had been studied when exposed
to different temperatures and moisture content [26]–[28]. In one study, the temperature
range varied from 5°C to 105°C while the moisture content varied from 0% to over 30%.
As the temperature increased, the instantaneous compliance increased regardless of the
moisture content. Comparatively, the instantaneous compliance at the same temperature
also increased as the moisture content was increased. Moisture content and temperature
effect the mechanical properties of pieces of wood [26].
In another study, many different types of wood were tested at varying moisture contents
to determine the effect with regards to the viscoelasticity. The woods tested were then
divided into two groups after the testing. Birch-like woods showed a response that there
is an effect in viscoelasticity when there is a variation in moisture content. On the other
hand, spruce-like woods showed the change in moisture content and temperature does not
change the creep strain response [28].

!9
1.4 Creep of Cellulose Nanocrystals
There have not been many studies done on finding the creep response of individual
CNCs. However, there have been some studies on the creep response of PMCs with
CNCs added as fillers. One reason CNCs are added is to enhance the creep performance
of composite matrices. This is because fillers have tendency to add a more solid-like
response that leads to a reduced creep deformation compared to neat-composites [29]–
[34]. When CNCs were added to low-density polyethylene (LDPE) and polypropylene
(PP), there was a change of the creep deformation. Neat LDPE and PP both showed non-
linear deformation with time. Composites with both 5% and 10% CNCs were created
with LDPE and PP. After just 30 minutes, neat-LDPE showed 29% deformation, while
the composites with CNCs showed a deformation of 25% for 5% CNCs and 17% for 10%
CNCs. Neat-PP showed a creep deformation of 48% after 30 minutes, while the
composites with 5% CNCs showed 31% deformation and 27% deformation for 10%
CNCs. These results show that CNCs can improve the effective of the stress transfer
between the polymer and filler which enhances the creep performance of PMCs [1].
In another study, composite films created with CNCs and polyurethane (PU) were created
to test for shape memory properties. Typical shape memory polymers have a low
stiffness compared to metals and ceramics, which is why CNCs were added as fillers.
These PMCs did show a higher tensile modulus and strength than those without the
CNCs as fillers. Also there was an elongation seen at the break of the film. The creep
deformation decreased when the CNCs concentration increased. Although the modulus
and strength were increased with the CNCs, there was not a substantial effect on the
recovery of the shape memory as this behavior still is controlled primarily by the PU
properties [35].

!10
1.5 Humidity Effect on Polymer Films
The effect of humidity and other environmental conditions on polymer films have been
studied previously [36], [37]. In one study, it is seen that there is a non-linear
relationship between the environmental conditions and equilibrium moisture content.
This research was done on polyurethane lacquer, a synthetic polymer. The water
absorption acts as a plasticizer in PU lacquers. These films have a complex dependence
on different environmental conditions, such as UV irradiation and water absorption.
With regards to the water absorption, the films show an increase in maximum strain [36].
Another study shows the effect of humidity on nonelectrolyte polymer films versus
polyelectrolyte multilayer films (PEMs). The nonelectrolyte polymer films exhibit
minimal changes in mechanical properties when introduced to humidity. However,
PEMs show a substantial responsiveness with regards to humidity. The films swelled
when introduced to humidity. This study demonstrated the humidity-dependent changes
of thickness and Young’s modulus of PEMs, and how changing the environmental
conditions can change the mechanical properties [37].
Previous research has shown the impact of CNCs as fillers in PMCs and the creep
response of these matrices. However, the creep response of neat-CNC films has not been
studied. The following research will discuss neat-CNCs films creep response when
introduced to different humidity levels.

!11
CHAPTER 2. EXPERIMENTAL PROCEDURES
2.1 Materials
The University of Maine Process Development Center in collaboration with the Forest
Products Laboratory (FPL) in Madison, Wisconsin provided the cellulose nanocrystals
(CNCs) that were studied for this research. The solids in the batch were 11.8 wt.% CNC
in water. This was formed by acid hydrolysis of 1 wt.% sulfur on dry CNC sodium.
These CNCs have an aspect ratio of 9.5, with a length of 64 ± 5 nm and width of 7 ± 1
nm. Figure 4 shows the TEM image coupled with Image J of the CNCs.
!Figure 4. TEM Image coupled with Image J of Forest Products Laboratory Cellulose Nanocrystals.
The CNCs were combined with Nanopure water from the lab at different weight
percentages of 3.1 and 9.5, which will be explained in detail in Section 2.2.

!12
2.2 CNC Film Preparation
In a beaker, the amounts of CNC and Nanopure water were combined. The amount of
CNC is determined by the following equation with the remaining weight being the
amount of water needed.
Equation 6
!"#$ℎ!!!"!!"#$%!!"! = ! !"!#$!!"#$ℎ!!×!!"!!!"#$"%&!!"#$%"!11.8!!"%
After many failed attempts of making films, it was determined that to obtain the correct
thickness, the total weight must increase for lower percentages of CNCs. This was to
ensure that the thicknesses of the 3.5 wt.% and 9.1 wt.% films were the same. Shown in
Table 1 are the approximate amounts of CNC used to obtain a film that is approximately
100 micrometer (µm) thick. The thickness was measured using a micrometer in 5
different parts of the film and averaging the thicknesses together.
Table 1. Approximate weight of CNCs used to make 3.5 wt.% and 9.1 wt.% films.
After the amounts of CNC and water were combined in a beaker, the solution was
sonicated in the Branson Digital Sonifier. This was done at amplitude of 40% for three
minutes with the pulse on for one second and off for one second. These were the settings
that worked best for the 3.5wt% solutions. However, the 9.1wt% solutions had much
more solid than liquid as seen in Table 1. Due to this, the solution was placed in the
Sonifier for twice as long to ensure a total dispersion, or transparency of said mixture.
Weight Percent of
CNC
Total Weight Weight of CNC Thickness of
Film
3.5 wt.% 55 g 16.31 ± 0.05 g 100 ± 2 µm
9.1 wt.% 30 g 23.14 ± 0.05 g 100 ± 2 µm

!13
Once the ultrasonications were completed, two different types of films were attempted:
self-organized and sheared. The processes for making these types of films will be
discussed in the following sections.
2.2.1 Self-Organized Films
In order to make self-organized films, petri dishes made of glass and polystyrene (PS)
were used. This was done to compare the differences between the films. The previously
ultrasonicated solution was poured into a petri dish as seen in Figure 4. These filled petri
dishes were then left in a cabinet to dry at room temperature.
Figure 5. Representation of CNCs + water solution being poured into a petri dish.
They still had access to air flow by keeping the cabinet door slightly open at all times
during the drying process. The lower CNC weight percentages took longer to dry due to
the increase in the amount of water left to evaporate. The 9.1wt% CNC films took
around three to four days to dry, while the 3.5wt% CNC films took around seven to nine
days to dry [9], [10].
The total amount of weight of the solution played an important role in determining the
outcome of the drying process. If there were too much solution in the petri dish, the films
would tend to crack in the middle. However, if there were not enough solution, the films
would be too thin to remove from either the glass or plastic dish. Hence, a higher total
volume for lower weight percentages and a lower total volume for higher weight
percentages of CNCs. The films prepared in glass petri dishes were much easier to
!

!14
remove without cracking rather than the films prepared in PS petri dishes. Moving
forward, only the films made in glass petri dishes were used for mechanical testing.
These films are considered self-organized because during the drying process, the
cellulose nanocrystals self-align randomly. This will be further analyzed in Sections 3.5-
3.7 where the microstructures are examined from optical images.
2.2.1.1 Variations of Self-Organized Films
Other experiments were attempted to create films to discover if there were any variations.
The ultrasonicated solution was placed into the refrigerator for 24 hours before being
poured into the petri dish. This experiment proved to not have an impact on the types of
films that were made post-drying. Thus, it was not used to carry on the process of
making films.
Another variation was using different weight percentages of CNCs to create films. Films
with a lower weight percentage of CNC, around 1.6, did not form films that could be
tested in the DMA as the films were either too brittle, too thin, or unable to be removed
from the petri dish. The other attempt made was to make the films with higher weight
percentage than 9.1 wt.%, but it did not work and hence it was determined that 9.1 wt.%
was the maximum limitation.
2.2.2 Sheared Films
As previously stated, sheared films were attempted for testing. After the sonication
process was complete, the solution would be placed on both glass and polyethylene
terephthalate (PET) substrates. It was determined that the films were best made on the
PET substrate because the solution would not stay in the designated area on the glass
substrate due to the hydrophobicity of the glass being used. Small amounts of solution
were placed on the substrate at a time and then sheared down a designated area with a
!15
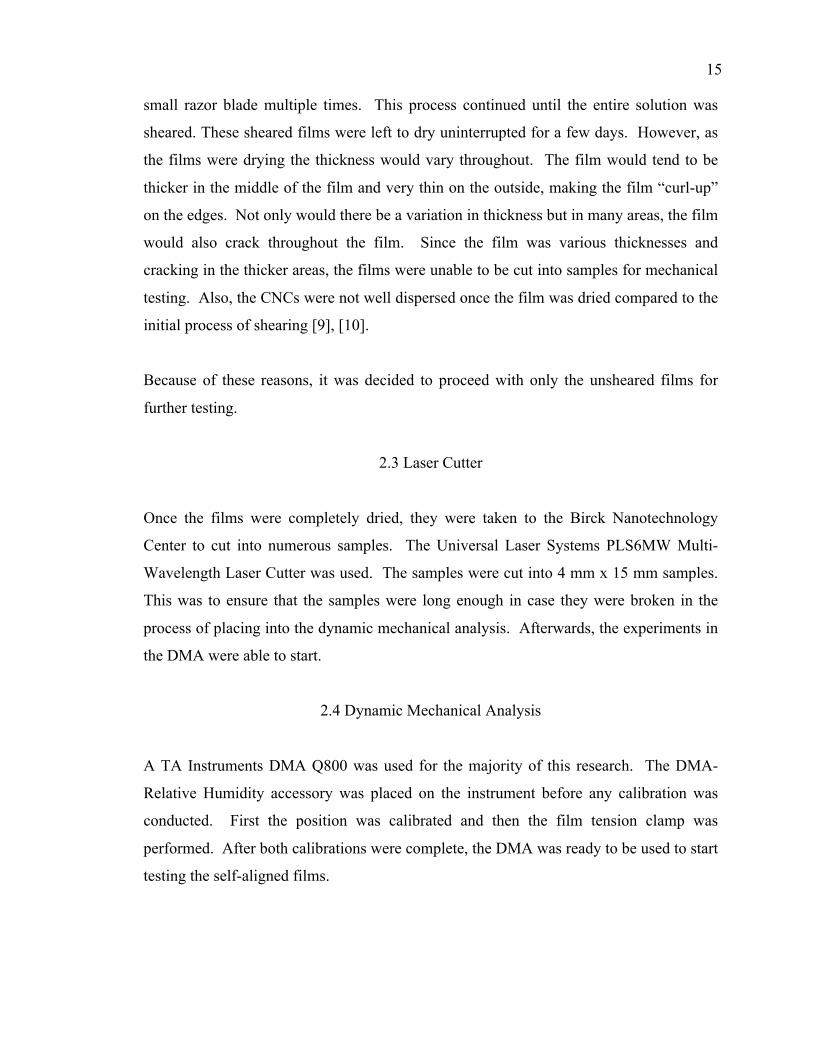
small razor blade multiple times. This process continued until the entire solution was
sheared. These sheared films were left to dry uninterrupted for a few days. However, as
the films were drying the thickness would vary throughout. The film would tend to be
thicker in the middle of the film and very thin on the outside, making the film “curl-up”
on the edges. Not only would there be a variation in thickness but in many areas, the film
would also crack throughout the film. Since the film was various thicknesses and
cracking in the thicker areas, the films were unable to be cut into samples for mechanical
testing. Also, the CNCs were not well dispersed once the film was dried compared to the
initial process of shearing [9], [10].
Because of these reasons, it was decided to proceed with only the unsheared films for
further testing.
2.3 Laser Cutter
Once the films were completely dried, they were taken to the Birck Nanotechnology
Center to cut into numerous samples. The Universal Laser Systems PLS6MW Multi-
Wavelength Laser Cutter was used. The samples were cut into 4 mm x 15 mm samples.
This was to ensure that the samples were long enough in case they were broken in the
process of placing into the dynamic mechanical analysis. Afterwards, the experiments in
the DMA were able to start.
2.4 Dynamic Mechanical Analysis
A TA Instruments DMA Q800 was used for the majority of this research. The DMA-
Relative Humidity accessory was placed on the instrument before any calibration was
conducted. First the position was calibrated and then the film tension clamp was
performed. After both calibrations were complete, the DMA was ready to be used to start
testing the self-aligned films.
!16
2.4.1 DMA Method
The main method of this research was done under a controlled force using the film
tension clamp. The process started by applying an initial force of 0.001 N exerted onto
the film. The samples were ran at the temperatures 30°C and 50°C, and at relative
humidity levels 80%, 40% and 0%. The method is as follows:
1. Data Storage On
2. Equilibrate at 30/50°C
3. Relative Humidity 80%
4. Isothermal 50 minutes
5. Ramp Stress 0.5 MPA/min to 1 MPA
6. Isothermal 180 min
7. Force Ramped to 0.4 N
8. Isothermal 180 min
9. Humidity 40%
10. Isothermal 25 min
11. Repeat Steps 5-8
12. Humidity 0%
13. Isothermal 25 min
14. Repeat Steps 5-8
This method was approximately 20 hours per run, indicating that each sample was in the
DMA for around 40 hours. Some films did not make it through the entire run which
could be due to either human error, not tightening the clamp enough to make sure the
film did not slip during the run, or failure in the film, the film was too brittle to withstand
!17
the amount of humidity and stress placed on the film. During these runs it was found that
most of the films tested using this method did not fail during the 30°C or 50°C run. The
isothermal times were chosen due to the increase or decrease amount of humidity level.
At the beginning of the experiment, the humidity is increased from 0% to 80%, thus 50
minutes was chosen. When the humidity levels were decreased to 40% and then to 0%,
only 25 minutes was chosen, as the decrease was half the amount from the initial increase
of humidity. It took longer for the humidity chamber to increase to 80% than it did to
decrease to 40% and then 0% levels.
2.4.2 Variations of DMA Method
Before the success of this particular method, other methods were first run that did not
work well with the thin, brittle films. One of the first methods attempted was starting at
0% humidity and working up to 80% humidity. However when this method was used,
most samples seemed to break well before the 30°C experiment was complete. This may
have been due to the brittleness of the films. Since the films used were just 100 µm
thick, the intensity and length of the method may have been too much. This is why the
method chosen begins with increasing the humidity directly to 80% at the beginning of
the experiment after the temperature was set.
Once this was determined to work better for the unsheared CNC films, the next thing that
needed to be done was to determine how long each part of the method should run. Since
this research is to discover if humidity has an effect on the creep of CNC films, the
method needed to be long enough at the different humidity levels to make sure there was
not a change as the different humidity levels were stabilized. This is particularly seen in
steps 6 and 8 of the method used. These steps are isothermal for 180 minutes. Three
hours was chosen because this would be long enough to see any change that may occur as
the film is at 80, 40 and 0 percent humidity. This meant that the film would be under
each humidity level for approximately 6 hours after the certain humidity was stabilized.
Before 180 minutes was determined, 60 minutes and 120 minutes were used for both

!18
steps 6 and 8. Sixty minutes for steps 6 and 8 proved to not be long enough to see if any
real change would occur. 120 minutes also seemed to be just shy of the minimum
amount of time needed for each step. Thus, 180 minutes was finally determined to be the
best to see the creep response.
2.5 Optical Microscopy
Before and after the films were tested in the DMA at 30°C and 50°C, optical images were
taken by using optical microscope, Carl Zeiss with Canon EOS Rebel T5i camera. The
optical images of the microstructure were taken using both non-polarized and polarized
light. In Sections 3.5-3.7, the micrographs before and after humidity effect will be
compared, as well as the 3.5wt% versus the 9.1wt%.

!19
CHAPTER 3. RESULTS AND DISCUSSION
3.1 DMA Results of 3.5wt% Films
The data from the DMA for 3.5wt% films are shown in Figure 5, at temperatures (a)
30°C and (b) 50°C. Five samples were used to determine an average strain. One of the
first differences observed between the two graphs is the strain rate as the humidity is
ramped to 80% at the beginning of the experiment. At 30°C, the strain is not able to
increase at a steady rate or normalize once the force begins to rise. However at 50°C, the
strain does appear to increase at a steady rate when the humidity is increased to 80% and
levels out as the force is held at 0.4 N. Table 2 displays the differences between the
slopes at the two temperatures when humidity is changed. At 50°C, the strain increases
at a much faster rate than at 30°C.
Table 2. Slope changes for 3.5 wt.% films at 30°C and 50°C.
The first zoomed in section at 30°C shows that the strain actually increases as the force is
brought back to 0 N from 0.4 N. It was expected that the strain would always decrease at
this part of the system at 80%, 40% and 0% humidity levels. This is shown in the
zoomed in section at 50°C in Figure 5b. Here the strain decreases at a constant rate that
is actually seen at all three humidity sections when the force is ramped back to 0 N.
Humidity Change Slope for 30°C Slope for 50°C
0% to 80% 0.018 ± 0.002 0.026 ± 0.001
80% to 40% -0.022 ± 0.001 -0.042 ± 0.002
40% to 0% -0.010 ± 0.001 -0.013 ± 0.002
!20
Although the strain has a more difficult time increasing at 30°C than at 50°C, during the
30°C run the samples go to a higher strain percentage just at a slower rate. At 30°C the
highest strain achieved is 2.16% at 414.73 minutes, whereas at 50°C the highest strain
reached is 1.53% at 257.26 minutes. This show that the films response to creep at 80%
humidity are higher, but slower at 30°C and faster and lower at 50°C.
In the second zoomed in section Figure 5a at 30°C where the humidity is changed from
80% to 40%, the strain is decreasing at a rate that ends halfway through the force
stabilized at 0.4 N. When compared to the results at 50°C, the strain decreases slower at
30°C. In the 50°C graph 5b, the strain decreases almost at the same rate (Table 2) as the
humidity is decreasing and is more stabilized as the force is ramped. However in both
graphs, there is almost a full creep recovery for both samples as the strain is close to 0%
at this point. The reason that it could take longer to see the strain level out as the force is
stabilized is due to the higher strain achieved initially when under 30°C.
Finally, the third zoomed in picture in Figure 5a shows the change of strain right before
the force is decreased at 0% humidity. Although this is closer to the trend that was
expected, it does not exactly match up to the trend at 50°C. Although during both
conditions, the strain decreases at a slower rate than from 80% to 40%, 50°C decreases its
strain at a bit faster of a rate. In this section the films go from complete creep recovery
response to shrinkage. The films under 30°C shrink more than the films at 50°C.

!21
Figure 6. Graphs of the strain response of 3.5 wt.% films at 30°C (a) and 50°C (b). (a)
shows zoomed in regions when the force is brought back to 0 N at 80%, 40% and 0%
humidity levels. (b) shows a zoomed in region when the force is brought back to 0 N at
80% humidity to depict the change that occurs at all 3 humidity levels.
a
b 0 200 400 600 800 1000 1200
0.0
0.1
0.2
0.3
0.4
1005 1006 1007 1008 1009 1010 1011 1012 1013
0.0
0.1
0.2
0.3
0.4
-1.20
-1.15
-1.10
-1.05
-1.00
0
20
40
60
80
480 482 484 486 488 490 492 494 496 498 500
0.0
0.1
0.2
0.3
0.4
0.0
0.2
0.4
0.6
0.8
1.0
0
20
40
60
80
250 251 252 253 254 255
0.0
0.1
0.2
0.3
0.4
1.942
1.944
1.946
1.948
1.950
0
20
40
60
80
Stati
c For
ce (N
)
Static Force (N) Strain (%)
Relative Humidity (%)
Time (min)
-1
0
1
2
Stra
in (%
)
0
20
40
60
80
Relat
ive H
umidi
ty (%
)
0 200 400 600 800 1000 1200 1400
0.0
0.1
0.2
0.3
0.4
256 257 258 259 260
0.0
0.1
0.2
0.3
0.4
1.520
1.525
1.530
1.535
0
20
40
60
80
Stati
c For
ce (N
)
Static Force (N) Strain (%)
Relative Humidity (%)
Time (m in)
-1.0
-0.5
0.0
0.5
1.0
1.5
Stra
in (%
)
0
20
40
60
80
Relat
ive H
umidi
ty (%
)

!22
3.2 DMA Results of 9.1 wt.% Films
The data from the DMA for 9.1 wt.% films are portrayed in Figure 6, at temperatures (a)
30°C run and (b) 50°C. Just as said for the 3.5 wt.% films, there were multiple samples
were used to calculate an average strain. Once again, the 30°C samples seem to have a
difficult time reaching the highest strain at 80% humidity at a steady rate. There is also
the issue of the strain not stabilizing as the force is increased to 0.4 N as it does in 6b.
During the runs with this weight percentage of film, the strain reaches its maximum strain
at 2.79% at 361.32 min for 30°C and 1.43% at 245.10 for 50°C. Displayed in Table 3, it
again took longer at the lower temperature to increase to its maximum strain compared to
the rate at 50°C. Even though it took longer to reach the maximum strain for 30°C, the
films responses to creep at 80% humidity are higher than those experienced at 50°C.
Table 3. Slope changes for 9.1 wt.% films at 30°C and 50°C.
The first zoomed in section in Figure 6a shows the strain is increasing as the force is
ramped back down to 0 N. Again, it was anticipated that the strain would always
decrease with the force decreasing. This trend is shown at the zoomed in section at 50°C
in Figure 6b. The strain is decreasing at a constant rate at all three humidity levels for
this temperature.
In the second zoomed in section at 30°C, the humidity is at 40%. Here, the strain
actually decreases halfway through the stabilization of the force at 0.4 N. It is interesting
to observe this as the initial decrease in strain went at about the same rate as in the 50°C
run. However there was not full creep recovery at 30°C until the end, whereas there was
almost total creep recovery as the humidity was ramped down. Yet again, it may have
Humidity Change Slope for 30°C Slope for 50°C
0% to 80% 0.013 ± 0.001 0.026 ± 0.001
80% to 40% -0.026 ± 0.002 -0.028 ± 0.001
40% to 0% -0.006 ± 0.002 -0.014 ± 0.001
!23
taken longer to reach total creep recovery at the lower temperature as it had initially
reached a higher strain percentage at 80% humidity.
Finally, the third zoomed in picture at 30°C Figure 6a shows the decrease in strain
starting before the force is decreased at 0% humidity. This is the closest to the trend that
was expected and seen at 50°C. For both temperatures, the strain decreases at a much
slower rate than previously. When the humidity is decreased to 0% and normalized for
the duration of the experiment, the films go from complete creep recovery to shrinkage.
The films under 30°C shrink more than the films at 50°C, just like it was observed for
3.5wt% films.

!24
Figure 7. Graphs of the strain response of 9.1 wt.% films at 30°C (a) and 50°C (b). (a)
shows zoomed in regions when the force is brought back to 0 N at 80%, 40% and 0%
humidity levels. (b) shows a zoomed in region when the force is brought back to 0 N at
80% humidity to depict the change that occurs at all 3 humidity levels.
0 200 400 600 800 1000 1200
0.0
0.1
0.2
0.3
0.4
537 538 539 540 541 542 543 544 545 546
0.0
0.1
0.2
0.3
0.4
0.8
0.9
1.0
1.1
1.2
0
20
40
60
80
1009 1010 1011 1012 1013 1014 1015
0.0
0.1
0.2
0.3
0.4
-1.00
-0.98
-0.96
-0.94
0
20
40
60
80
249 250 251 252 253 254 255
0.0
0.1
0.2
0.3
0.4
2.54
2.56
2.58
0
20
40
60
80
Stat
ic Fo
rce
(N)
Static Force (N)
Strain (%)
Relative Humidity (%)
Time (min)
-1
0
1
2
3
Stra
in (%
)
0
20
40
60
80
Relat
ive H
umid
ity (%
)
a
b
0 200 400 600 800 1000 1200 1400
0.0
0.1
0.2
0.3
0.4
256 257 258 259 260
0.0
0.1
0.2
0.3
0.4
1 .42 0
1 .42 5
1 .43 0
1 .43 5
1 .44 0
0
2 0
4 0
6 0
8 0
Stat
ic Fo
rce (
N)
StaticForce (N) Strain (%)
RelativeHumidity (%)
Time (min)
-1.0
-0.5
0.0
0.5
1.0
1.5
Stra
in (%
)
0
20
40
60
80Re
lative
Hum
idity
(%)

!25
3.3 Comparison of 3.5 wt.% and 9.1 wt.% Films
In the previous sections the DMA data was compared solely between the weight
percentages of films individually. Here, the differences between 3.5 wt.% and 9.1 wt.%
films will be analyzed.
The trends are the same regardless of the weight percentage of CNC at 50°C. The main
differences at this temperature are the strain rate when the humidity is decreased to 40%
from 80% and the maximum strain experienced during the runs. The trends are suspected
to be the same because the humidity effect during the 30°C run erased the drying and
thermal histories of the films. This means that now the films are basically equivalent
regardless of the weight percentage of cellulose nanocrystals. They are acting the same
and as a typical polymer film. The results are shown below in Table 4.
Table 4. Average maximum strain and the time it took to reach this maximum at 50°C for 3.5 wt.% and 9.1 wt.% films.
Film Concentration Average Maximum Strain Time
3.5 wt.% 1.53% ± 0.16 257.26 min
9.1 wt.% 1.43% ± 0.13 245.10 min
As for the other major difference at 50°C, the strain rate for the 9.1 wt.% films was
slower as the humidity decreased from 80% to 40%. These values can be compared in
Table 4. It is possible that having a higher concentration of CNC in a film makes the
creep recovery response a bit slower as there is more CNCs in the film than those of the
3.5 wt.% films. One way to test this theory would be by performing further experiments
using different weight percentages that are lower and higher than 3.5 wt.% and see if the
trend stays the same.
Although the 3.5 wt.% films had a slightly higher maximum strain at 50°C, the 9.1 wt.%
films had a higher maximum strain at 30°C. This can be seen in Table 5. The higher

!26
weight percentage of CNCs films not only experienced a higher maximum strain, but also
at a faster time than the lower weight percent. The 9.1 wt.% films experienced the
maximum strain almost an hour before the 3.5 wt.% films experienced the lower
maximum percentage. Since the 9.1 wt.% films dried rather quickly, the cellulose
nanocrystals did not have a lot of time to self assemble in a thermodynamically favorable
way. Because of this, there was a high amount of residual stress in these films. With
higher residual stress comes a higher strain as the initial force is admitted to the film.
The 3.5 wt.% films took much longer to dry, thus there was time for the CNCs to self
assemble in a thermodynamically favorable way. There was less residual stress in the
films, leading to a lower maximum strain than the 9.1 wt.% films.
Table 5. Average maximum strain and the time it took to reach this maximum at 30°C for 3.5 wt.% and 9.1 wt.% films.
Film Concentration AverageMaximum Strain Time
3.5 wt.% 2.16% ± 0.12 414.73 min
9.1 wt.% 2.79% ± 0.13 361.32 min
Unlike at 50°C, the strain rates were very similar during the humidity changes for the
30°C runs at each weight percentage. Still, the 30°C results are not the best and in the
future, experiments at higher temperatures need to be ran to compare the results for
different weight percentages of CNC films.
Regardless of the temperature or weight percent of film used, one trend remained the
same throughout every run. The largest strain experienced happened at 80% humidity,
however the trend is non-linear when reducing in temperature. As the humidity was
ramped up at a fast rate, the strain did as well. This is also seen in Niinivaara, et al. study
of water uptake on CNCs films through quartz crystal microbalance with dissipation
monitoring (QCM-D) experiment. In their experiment, ultrathin CNCs films were
prepared using a spin coater. Different masses of CNCs were used to determine if there
were a difference in the change of thickness (Δt) as the humidity was increased to 100%
!27
and then brought back to 0%. In this, the trend is also non-linear. There is an increase in
Δt as the humidity was increased [38]. This can be related to the increase in strain of the
CNC films used for the experiments done in the DMA.
In Niinivaara, et al. study, the change of Δt from 80% to 40% humidity versus 40% to 0%
humidity is comparable to the results found in Figures 5 and 6 from the DMA. From
80% to 40% humidity, there is a larger change in percent of strain or Δt than the change
between 40% and 0% humidity. Just as stated previously about the films experimented
on in the DMA, the films have experienced an increase with full recovery and in the end
some skringage by the end of the experiment. Although the QCM-D and DMA do not
report exactly the same data, the two experiments are complementary to the response of
creep when humidity is introduced to CNCs films.

!28
3.4 Optical Microscopy Images of 3.5 wt.% Films
Micrographs of 3.5 wt.% films were taken before and after the DMA experiments were
conducted. Both non-polarized (Figure 7) and polarized (Figure 8) light were used to
determine what changes happened to the films once exposed to humidity, stress and
strain. Figures 7a and 8a show the film before humidity exposure while Figures 7b and
8b show the film after humidity is introduced to the film at both 30°C and 50°C. The
non-polarized micrographs do not see much differences when compared.
Contrasting to the non-polarized images, the polarized micrographs show a difference in
the vibrancy of the colors that appear. Before the films are exposed to the humidity, the
colors are very distinct and vibrant, with more shades of blue appearing. After humidity,
the colors are duller with more shades of yellow and red emerging. This could be due to
the pitch length of the CNCs. CNC dispersions typically form in a chiral nematic
structure. The characteristic repeat distance between the rod-like chains twisting around
is described as the pitch-length [39]. This ordering of CNCs chains leads to the vibrant
colors seen in polarized optical images of thin CNCs films.
CNC dispersions also exhibit lyotropic chiral nematic behavior at lower concentrations as
they have lower viscosities and form in a shorter amount of time. Security features and
the cosmetics industry have been attracted to these thin CNC films and their vivid
iridescence. These colors can be tailored in many different ways: adding salt to increase
the ionic strength to lead to a blue shift [40], ultrasonicating the dispersion to lead to a red
shift [41], and by changing the temperatures the films are exposed to as higher
temperatures also lead to a blue shift [42]. Different research groups, such as Kelly and
collaborators at the University of British Columbia have started studying the
development of these films and changing the birefringes of the CNC films. This group in
particular studied mesoporous materiasl that incorporated CNCs. However, the humidity
and creep effect of neat-CNC films birefringence have not previously been studied and
will be analyzed in the coming sections.

!29
A typical structure of CNCs exhibit a long pitch-length, however referring back to
Section 2.2, the CNC and water solutions were ultrasonicated. Ultrasonication changes
the chiralty of the polymer chains by changing the pitch length. When this is done, the
critical concentration needed for phase separation is increased. At higher weight
percentages of CNCs, the pitch length may in fact increase as seen in Beck’s study of
CNC films. However, at the lower concentrations of CNCs, the chains are broken up
which lead to a blue shift in the non-polarized films. As the films dried, the CNCs had
the ability to self-organize freely as the pitch length was shorter. However, once the
films were placed in an atmosphere with humidity and temperature, the CNCs pitch
length may have possibly changed again. This could explain the differences in the two
polarized images. When the films are under humidity, the CNC chains may start to
overlap and stack on top of each other so the color is not as vibrant. Also, as the films are
placed in higher temperatures the pitch length also increases. An increasing pitch length
leads to a more red shades of colors. There have been previous studies that show the
influence of temperature on the chiral nematic structure of cellulose [43]–[45]. Although
most of these studies involve the temperature during the drying of the CNC films [42],
the results show there is a change when the films are introduced to different temperatures
in the DMA.

!30
Figure 8. Micrographs of 3.5 wt.% films before (a) and after (b) humidity using non-polarized light.

!31
Figure 9. Micrographs of 3.5 wt.% films before (a) and after (b) humidity using polarized light.

!32
3.5 Optical Microscopy Images of 9.1 wt.% Films
Micrographs of 9.1 wt.% films were also taken before and after the DMA experiments
were conducted. Both non-polarized (Figure 9) and polarized (Figure 10) light were used
to determine what changes happened to the films once exposed to humidity. Figures 9a
and 10a show the film before humidity exposure while Figures 9b and 10b show the film
after humidity is introduced to the film at both 30°C and 50°C.
The non-polarized images show some differences. The micrograph prior to humidty does
not experience much color and is closer to a brown-red shade. Although the 9.1 wt.%
solution was ultrasonicated, it may have not been long enough to decrease the pitch
length enough to freely space the CNC chains. With a higher concentration, the more
likely the chains are to stack together. After humidity, the non-polarized film still shows
mostly a brown color, but now there are more tints of blue shown throughout which
would mean the pitch length decreased somewhat, and the chains reorganized during the
runs.
The polarized micrographs also show differences when it comes to the vibrancy of the
colors that appear. Before the film was exposed to humidity in the DMA, the colors are
very dark, with more shades of orange and red appearing. After humidity, the films are
brighter with shades of red and orange on the outside of the micrograph, but shades of
blue throughout the middle.
The pitch length plays an important role in having these features of the micrographs.
Although these films were ultrasonicated, the concentration of solid to liquid is very high
which makes it harder to orient freely. The pitch length was still affected by the
ultrasonication, but having a higher concentration did not allow the CNC chains to align
next to each other, but on top of each other initially. This is why the polarized image
prior to humidity affect shows darker shades closer to red shades than blue. Afer the
humidity is introduced to the 9.1 wt.% films, the chains align differently on the core of

!33
the films. Closer to the middle of the films, the chains are more freely oriented and
adjacent to each other, but continue to position on top of one another on the edges. The
temperature effect may also play a vital role in the alignment and pitch length of the CNC
chains.

!34
Figure 10. Micrographs of 9.1 wt.% films before (a) and after (b) humidity using non-polarized light.

!35
Figure 11. Micrographs of 9.1 wt.% films before (a) and after (b) humidity using polarized light.

!36
3.6 Comparison of 3.5 wt.% and 9.1 wt.% Films Optical Microscopy Images
Sections 3.4 and 3.5 discussed the differences between the non-polarized and polarized
images of 3.5 wt.% and 9.1 wt.% films. In this section, the differences observed in the
two weight percentages of CNCs will be discussed. As explained, lower concentrations
are able to move more freely while drying. This explains the differences in the non-
polarized and polarized images before humidity at 3.5 wt.% and 9.1 wt.%. For the first
set of films, the chains were able to move freely with a lower pitch length and settle next
to each other. This led to a micrograph with more blue colors than the 9.1 wt.%
micrograph both with and without polarized light.
Both weight percentages showed changes in the polarized micrographs after the films
were introduced to humidity. It can be assumed that the humidity effect plays a role in
the pitch length of CNCs and the final structure of the film.

!37
CHAPTER 4. CONCLUSIONS AND FUTURE WORK
The mechanical and optical properties of CNCs can be affected by a variety of
parameters. This research shows that the creep response of ultrathin neat-CNC films
changes when humidity is introduced. As the humidity is increased to 80% at both 30°C
and 50°C, the strain increases. However, as the humidity is decreased to 40%, there is
full creep recovery. Finally, there is shrinkage of the film when the humidity is
decreased back to 0%. Further research needs to be performed to determine whether this
shrinkage of the films is due to the humidity effect or the force effect. The data collected
shows that there is a response to the changing humidity effect throughout the experiment.
The structural changes of the films are seen in the optical micrographs.
There is also an effect on the optical properties of CNC films due to humidity. First, as
reported by other groups, one can see the pitch length is affected by the concentration and
ultrasonication of the solutions. However, there is still further shift in color as the films
are introduced to humidity. Many more tests can be run to determine this trend.
In the future, films can be made using a multitude of procedures to look at the difference
in mechanical and optical properties. Films of the same weight percentages can be
placed in an oven to dry within a few hours and then tested using the same DMA method.
Optical images can also be taken of these films to see if the polarized images prior to
humidity look different than the films that are left to dry at room temperature. It was
observed that there were no real differences between the films where the solution was left
in the refrigerator after ultrasonication versus the solution being poured directly into the
petri dishes. However, there could be a difference in the mechanical and optical
!38
properties. These films can be tested in the future to determine if there are any
differences in creep or optical colors.
A method where the humidity is increased at a slower rate could also be run on the films
already made and the new ones made to see if the trend is the same. This new method
could run the current method backwards, starting at 0% humidity and increasing to 40%
and then 80%. Also, higher temperatures, i.e. 70°C and 90°C, could be held while the
method runs to determine the changes in creep response.
Finally, additional new testing can be done on the current and future CNC films to further
predict certain properties of the neat-CNC films. The optical properties can be looked at
by using x-ray diffraction (XRD), scanning electron microscopy (SEM) and circular
dichroism (CD) to analyze the pitch lengths of the films prior to and after humidity
interaction. Hopefully, these claims would back up the claims made from this research
and complement the previous research done on neat-CNC films.

!!!!
LIST OF REFERENCES

!!!!
39
LIST OF REFERENCES
[1] K. A. Iyer, G. T. Schueneman, and J. M. Torkelson, “Cellulose
nanocrystal/polyolefin biocomposites prepared by solid-state shear pulverization: Superior dispersion leading to synergistic property enhancements,” Polym. (United Kingdom), vol. 56, pp. 464–475, 2015.
[2] D. Bondeson, A. Mathew, and K. Oksman, “Optimization of the isolation of
nanocrystals from microcrystalline cellulose by acid hydrolysis,” Cellulose, vol. 13, no. 2, pp. 171–180, 2006.
[3] T. Saito, S. Kimura, Y. Nishiyama, and A. Isogai, “Cellulose nanofibers prepared
by TEMPO-mediated oxidation of native cellulose,” Biomacromolecules, vol. 8, no. 8, pp. 2485–2491, 2007.
[4] T. Saito and A. Isogai, “TEMPO-mediated oxidation of native cellulose. The effect
of oxidation conditions on chemical and crystal structures of the water-insoluble fractions,” Biomacromolecules, vol. 5, no. 5, pp. 1983–1989, 2004.
[5] N. Lavoine, I. Desloges, A. Dufresne, and J. Bras, “Microfibrillated cellulose - Its
barrier properties and applications in cellulosic materials: A review,” Carbohydr. Polym., vol. 90, no. 2, pp. 735–764, 2012.
[6] L. Brinchi, F. Cotana, E. Fortunati, and J. M. Kenny, “Production of
nanocrystalline cellulose from lignocellulosic biomass: Technology and applications,” Carbohydr. Polym., vol. 94, no. 1, pp. 154–169, 2013.
[7] Y. Habibi, L. A. Lucia, and O. J. Rojas, “Cellulose nanocrystals: Chemistry, self-
assembly, and applications,” Chem. Rev., vol. 110, no. 6, pp. 3479–3500, 2010. [8] J. Yang, C. R. Han, J. F. Duan, M. G. Ma, X. M. Zhang, F. Xu, and R. C. Sun,
“Synthesis and characterization of mechanically flexible and tough cellulose nanocrystals-polyacrylamide nanocomposite hydrogels,” Cellulose, vol. 20, no. 1, pp. 227–237, 2013.
[9] J. A. Diaz, X. Wu, A. Martini, J. P. Youngblood, and R. J. Moon, “Thermal
expansion of self-organized and shear-oriented cellulose nanocrystal films,” Biomacromolecules, vol. 14, no. 8, pp. 2900–2908, 2013.
!!!!
40
[10] A. B. Reising, R. J. Moon, and J. P. Youngblood, “Development, Processing and Characterization of Cellulose Nanocrystal Neat Films,” J. Sci. Technol. For. Prod. Process., 2013.
[11] V. Landry, A. Alemdar, and P. Blanchet, “Nanocrystalline Cellulose#:
Morphological , Physical , and Mechanical Properties,” vol. 61, no. 10, pp. 104–112, 2011.
[12] R. J. Moon, A. Martini, J. Nairn, J. Simonsen, and J. Youngblood, Cellulose
nanomaterials review: structure, properties and nanocomposites, vol. 40, no. 7. 2011.
[13] Y. Habibi, L. a Lucia, and O. J. Rojas, “Cellulose Nanocrystals#: Chemistry , Self-
Assembly , and Applications,” Chem. Rev., vol. 110, pp. 3479–3500, 2009. [14] M. Mariano, N. El Kissi, and A. Dufresne, “Cellulose nanocrystals and related
nanocomposites: Review of some properties and challenges,” J. Polym. Sci. Part B Polym. Phys., vol. 52, no. 12, pp. 791–806, 2014.
[15] V. Favier, H. Chanzy, and J. Y. Cavaille, “Nanocomposite materials from latex
and cellulose whiskers,” Polym. Advamced Technol., vol. Volume 6, pp. 365–367, 1996.
[16] Y. Zhou, C. Fuentes-Hernandez, T. M. Khan, J.-C. Liu, J. Hsu, J. W. Shim, A.
Dindar, J. P. Youngblood, R. J. Moon, and B. Kippelen, “Recyclable organic solar cells on cellulose nanocrystal substrates.,” Sci. Rep., vol. 3, p. 1536, 2013.
[17] R. M. A. Domingues, M. E. Gomes, and R. L. Reis, “The potential of cellulose
nanocrystals in tissue engineering strategies,” Biomacromolecules, vol. 15, no. 7. pp. 2327–2346, 2014.
[18] W. Li, R. Guo, Y. Lan, Y. Zhang, W. Xue, and Y. Zhang, “Preparation and
properties of cellulose nanocrystals reinforced collagen composite films,” J. Biomed. Mater. Res. - Part A, vol. 102, no. 4, pp. 1131–1139, 2014.
[19] P. Dhar, U. Bhardwaj, A. Kumar, and V. Katiyar, “Poly (3-
hydroxybutyrate)/Cellulose Nanocrystal Films for Food Packaging Applications: Barrier and Migration Studies,” Polym. Eng. Sci., vol. 55, pp. 2388–2395, 2015.
[20] T. S. Yoshiharu Doi, Youko Kanesawa, Masao Kunioka, “Biodegradation of
microbial copolyesters: poly(3-hydroxybutyrate-co-3-hydroxyvalerate) and poly(3-hydroxybutyrate-co-4-hydroxybutyrate,” Macromolecules, vol. 23, no. 1, pp. 26–31, 1990.
!!!!
41
[21] D. Wu, L. Wu, L. Wu, and M. Zhang, “Rheology and thermal stability of polylactide/clay nanocomposites,” Polym. Degrad. Stab., vol. 91, no. 12, pp. 3149–3155, 2006.
[22] J. R. Fried, Polymer Science and Technology, 2nd ed. Upper Saddle River, NJ:
Prentice Hall Professional Technical Reference, 2003. [23] F. Mainardi and G. Spada, “Creep, relaxation and viscosity properties for basic
fractional models in rheology,” Eur. Phys. J. Spec. Top., vol. 193, no. 1, pp. 133–160, 2011.
[24] S. Qi, M. Yu, J. Fu, P. D. Li, and M. Zhu, “Creep and recovery behaviors of
magnetorheological elastomer based on polyurethane / epoxy resin IPNs matrix,” Smart Mater. Struct., vol. 25, pp. 1–10, 2016.
[25] J. Zhao and A. R. Barron, Dynamic mechanical analysis, vol. 9. 2014. [26] F. Jin, Z. Jiang, and Q. Wu, “Creep Behavior of Wood Plasticized by Moisture and
Temperature,” BioResources, vol. 11, no. 1, pp. 827–838, 2016. [27] P. Navi, V. Pittet, and C. J. G. Plummer, “Transient moisture effects on wood
creep,” Wood Sci. Technol., vol. 36, no. 6, pp. 447–462, 2002. [28] A. Ranta-Maunus, “The viscoelasticity of wood at varying moisture content,”
Wood Sci. Technol., vol. 9, no. 3, pp. 189–205, 1975. [29] S. Spoljaric, A. Genovese, and R. A. Shanks, “Polypropylene-microcrystalline
cellulose composites with enhanced compatibility and properties,” Compos. Part A Appl. Sci. Manuf., vol. 40, no. 6–7, pp. 791–799, 2009.
[30] A. Ashori, “Wood-plastic composites as promising green-composites for
automotive industries!,” Bioresour. Technol., vol. 99, no. 11, pp. 4661–4667, 2008.
[31] M. Bengtsson, P. Gatenholm, and K. Oksman, “The effect of crosslinking on the
properties of polyethylene/wood flour composites,” Compos. Sci. Technol., vol. 65, no. 10, pp. 1468–1479, 2005.
[32] S. Y. Lee, H. S. Yang, H. J. Kim, C. S. Jeong, B. S. Lim, and J. N. Lee, “Creep
behavior and manufacturing parameters of wood flour filled polypropylene composites,” Compos. Struct., vol. 65, no. 3–4, pp. 459–469, 2004.
!!!!
42
[33] A. K. Bledzki and O. Faruk, “Creep and impact properties of wood fibre-polypropylene composites: Influence of temperature and moisture content,” Compos. Sci. Technol., vol. 64, no. 5, pp. 693–700, 2004.
[34] L. Sobczak, R. W. Lang, and A. Haider, “Polypropylene composites with natural
fibers and wood - General mechanical property profiles,” Compos. Sci. Technol., vol. 72, no. 5, pp. 550–557, 2012.
[35] M. L. Auad, V. S. Contos, S. Nutt, M. I. Aranguren, and N. E. Marcovich,
“Characterization of nanocellulose-reinforced shape memory polyurethanes,” Polymer International, vol. 57, no. 10. pp. 651–659, 2008.
[36] X. Liu, R. D. Wildman, and I. A. Ashcroft, “Experimental investigation and
numerical modelling of the effect of the environment on the mechanical properties of polyurethane lacquer films,” J. Mater. Sci., vol. 47, no. 13, pp. 5222–5231, 2012.
[37] A. J. Nolte, N. D. Treat, R. E. Cohen, and M. F. Rubner, “Effect of relative
humidity on the Young’s modulus of polyelectrolyte multilayer films and related nonionic polymers,” Macromolecules, vol. 41, no. 15, pp. 5793–5798, 2008.
[38] E. Niinivaara, M. Faustini, T. Tammelin, and E. Kontturi, “Water vapor uptake of
ultrathin films of biologically derived nanocrystals: Quantitative assessment with quartz crystal microbalance and spectroscopic ellipsometry,” Langmuir, vol. 31, no. 44, pp. 12170–12176, 2015.
[39] J. A. Kelly, M. Giese, K. E. Shopsowitz, W. Y. Hamad, and M. J. MacLachlan,
“The development of chiral nematic mesoporous materials,” Acc. Chem. Res., vol. 47, no. 4, pp. 1088–1096, 2014.
[40] X. M. Dong and D. G. Gray, “Effect of Counterions on Ordered Phase Formation
in Suspensions of Charged Rodlike Cellulose Crystallites,” Langmuir, vol. 13, no. 8, pp. 2404–2409, 1997.
[41] S. Beck, J. Bouchard, and R. Berry, “Controlling the reflection wavelength of
iridescent solid films of nanocrystalline cellulose,” Biomacromolecules, vol. 12, no. 1, pp. 167–172, 2011.
[42] J. Pan, W. Hamad, and S. K. Straus, “Parameters affecting the chiral nematic phase
of nanocrystalline cellulose films,” Macromolecules, vol. 43, no. 8, pp. 3851–3858, 2010.
!!!!
43
[43] A. M. Ritcey, G. Charlet, and D. G. Gray, “Effect of residual linear orientation on the optical properties of cholesteric films,” Can. J. Chem., vol. 66, pp. 2229–2233, 1988.
[44] A. M. Ritcey and D. G. Gray, “Circular reflectivity from the cholesteric liquid
crystalline phase of (2-ethoxypropyl)cellulose,” Macromolecules, vol. 21, no. 5, pp. 1251–1255, 1988.
[45] G. Jian-Xin and G. Derek G., “Chiroptical Behavior of (Acetyl) (ethy1)cellulose
Liquid Crystalline Solutions in Chloroform,” Macromolecules, vol. 22, pp. 2086–2090, 1989.