effect of macroeconomic factors on residential...
TRANSCRIPT

LAÜ Sosyal Bilimler Dergisi (VIII-II): 133-149
LAÜ Sosyal Bilimler Dergisi (VIII-II) EUL Journal of Social Sciences
Aralık 2017 December
EFFECT OF MACROECONOMIC FACTORS ON
RESIDENTIAL PROPERTY RETURNS IN ABUJA, NIGERIA
MAKROEKONOMİK FAKTÖRLERİN ABUJA KONUT GETİRİLERİNE
ETKİSİ, NİJERYA
M.B. WAHAB A.S. ADEOGUN
Federal University of Technology University of Ilorin
G.B. MORENIKEJI M. MAMMAH
Federal University of Technology Federal Polytechnic Kaduna
S.O. ABDULKAREEM
Federal Polytechnic Kaduna
Received 12 April 2017- Accepted 31 July 2017
Gönderim 12 Nisan 2017- Kabul 31 Temmuz 2017
Abstract: Performance of property market is a measure of total returns, and the totality of returns
within the country property market is influenced by the state of the economy. The backward and
forward relationship between property market and the economy has influenced a rise and fall in
future of property returns in Abuja market. The study utilized both primary (returns) and secondary
data (macro-economic variables), and the time-series data on annual macroeconomic indices and
total returns index spanning between 2001-2015 were employed for the study. The result of
Augmented Dicker Fuller (ADF) test showed that all the variables were stationary after first and
second differencing order. The result of cointegration test further suggests the existence of long
run relationship between macroeconomic factors and residential property returns. The result of
further cointegration regression suggests that between 18.2%-83.6% and 16.2%-79% variation in
3B/R and 4B/R property returns respectively across the seven out of twelve residential markets were
significantly influenced by macroeconomic indicators. The study concludes that positive economic
policies are meant to improve the property market, vice versa. The study therefore recommends that
policy-maker should painstakingly study the future implication of any macroeconomic policy as
such could adversely affect the property market, and this could also conversely affect the
contribution of real estate sector to the national economy development, vise-versa.
Keywords: Property returns, macroeconomic factors, cointegration regression analysis.
Öz: Emlak piyasasının performansı toplam getirilerin bir ölçüsü olarak kabul edilmektedir. Emlak
piyasasındaki getiriler toplamı, ülkenin içinde bulunduğu ekonomik durumdan etkilenmektedir.
Gayrimenkul piyasası ve ekonomi arasındaki geriye ve ileriye yönelik ilişki, Abuja pazarındaki
gayrimenkul getirilerinin yükselişini ve düşüşünü etkilemiştir. Çalışma, hem birincil (getiriler) hem
de ikincil verilerden (makro ekonomik değişkenler) yararlanarak 2001-2015 yılları arasındaki yıllık
makroekonomik endeksler ve toplam getiri endeksine ilişkin zaman serisi verilerini kullanıldı.
Augmented Dicker Fuller (ADF) testinin sonucunda, tüm değişkenlerin birinci ve ikinci fark
sıralamasından sonra sabit kaldığı görülmüştür. Eşbütünleşme testi sonucunda, makroekonomik
faktörler ile emlak dönüşleri arasındaki uzun dönemli ilişkinin varlığı da öne çıkmaktadır.
Eşbütünleşme testi sonucunda, oniki konut piyasasından yedisinde sırasıyla 3B/R ve 4B/R emlak
getirilerinde 18.2%, -83.6% ve 16.2% -79% arasında değişmelerin makroekonomik göstergelerden
önemli ölçüde etkilendiğini düşündürmektedir. Bu çalışmada, olumlu ekonomik politikaların emlak

LAÜ Sosyal Bilimler Dergisi (VIII-II): 133-149
LAÜ Sosyal Bilimler Dergisi (VIII-II) EUL Journal of Social Sciences
Aralık 2017 December
piyasasını iyileştirmek olduğu sonucuna varıldı. Bu nedenle çalışma, politika yapıcılarının,
gayrimenkul piyasasını olumsuz yönde etkileyebilecek herhangi bir makroekonomik politikanın
gelecekteki etkisini özenle incelemesi gerektiğini ve gayrimenkul sektörünün ulusal ekonomi
gelişimine olan katkısını da tersine çevirebileceğini önermektedir.
Anahtar Kelimeler: Gayrimenkul getirileri, makroekonomik faktörler, eşbütünleşme regresyon
analizi.
INTRODUCTION
Results from empirical studies linking macroeconomic factors with property
investment market all over the world have shown that macroeconomic factors
influence property return, in Europe (Lizieri & Satchell,1997; Brooks &
Tsolacos,1999; Giussani et al., 1992; Sinbad & Mhlanga, 2009), in America
(Abraham & Hendershott,1996; Ling & Naranjo, 1997; Eldelstein & Tsang, 2007), in
Asian (Peng & Hudsin-wilson, 2002; Peng et al., 2005; Joshi 2006) and in Africa as
developing continent (Clark & Daniel 2006;Kwangware, 2010; Bouchouicha & Ftiti,
2012; Ojetunde et al., 2011; Ojetunde, 2013; Udoekanem et al. 2014; Udoekanem et
al., 2015) have researched and tried to establish both short and long run relationships
between macroeconomic factors and property return, and the influence of these
economic factors on property return. The interaction between macro economy and
residential property market indicated that GDP, inflation, interest and exchange rates
are the major macroeconomic factors that influence property returns, and the
existence of long run relationship between macroeconomic factors and property
market has always been found (Eldelstein & Tsang, 2007; Sinbad & Mhlang, 2009;
Kwangware, 2010; Gutpa et al., 2010; Ojetunde, 2013). Therefore since real property
market is an aspect of global investment market, global macroeconomic determinants
have become a focal point of study. Real property investment as an aspect of
investment portfolio has expressed interdependency with the economy, and
inseparable in making global investment decisions (Giussani et al., 1992). Property
returns as a measure of property investment performance is a key in property market
(Hoesli & MacGregor, 2000; Kalu, 2001). Property investment cycles are related to
the periods of excess demand and excess supply in real estate market, which are
described as tight and soft markets respectively within the property market, and they
are primarily affected by macroeconomic policy of national, regional and local
economy (Born & Pyhrr, 1994; Apergis, 2003). Therefore, Property investment
market and the national economy are interrelated such that economy majorly
influences the property market which in turn affects the contribution of real estate
sector to national economic development. This interdependent relationship has led to
forward and backward relationship between the economy and the property market,
and this has therefore created a rise and fall in the future of property returns in Abuja
property market. The aftermath of rise and fall in property return has therefore been
the major source of worry or contention among real estate investors. This study
aimed at measuring the influence of macroeconomic factors on residential property
returns in Abuja, Nigeria. This study is justified on the ground that, over the years,
residential property investment performance has been anchored on non-economic
factors such as locational, neighborhood and physical factors (Yusof & Ismail, 2012;
Samy, 2015; Wilhelinsson, 2000) with little or no attention on economic factors. But
the growing need of institutional investors, companies, banks to relate property
investment market as part of country’s economic market has therefore underscored

M.B. Wahab, A.S. Adeogun, G.B. Morenikeji, M. Mammah, S.O. Abdulkareem | 135
LAÜ Sosyal Bilimler Dergisi (VIII-II) EUL Journal of Social Sciences
Aralık 2017 December
the need to study economic factors and how they affect residential property
investment. Also the pressing need for improvement in property investment
performance has required more than non-economic factors.
1. PROPERTY MARKET AND THE NATIONAL ECONOMY: THE
CONCEPTUAL FRAMEWORK
Property market and macro economy are interlinked and intertwined. They are
positively related to each other and they are interrelated in both short and long run
and also influence each other. Belo and Agbatekwe (2002) submitted that the quality
and quantities of the country’s housing stock is a measure of the country’s economic
growth and prosperity. Also real estate sector has also become a focal point of
government fiscal and monetary policies and used as yardstick for realizing low level
inflation, high level of employment, low level of unemployment and balanced
economic growth (Apergi, 2003). Fraser (1993) has related property market as an
integral part of nation’s economy; therefore there is reverse implication on one
another. This indicates there is a reverse linkage between property market and the
macro economy, which implies that, whatever affects the property market also affect
the economy, vice versa. In the period of economy instability or macroeconomic
fluctuation, disequilibrium in the property market is as a result of exogenous factors
originated from government structural and deregulations in the country’s economy
(Dehesh & Pugh, 1998). Property market cycles is affected by shocks of
macroeconomic factors and resulted into either tight or soft market, in that, in the
period of economic stability and growth, the property market cycles is expected to
exhibit excess supply, vice versa (Born & Pyhrr 1994). Therefore property market is
linked to macro economy, such that macro-economic factors such as GDP, money
supply, inflation, interest influence the performance of property market, such that,
inflation acts as disincentives to real estate purchaser but acts as incentive to real
estate investors, because increase in the property price reduces the demand, and
increase in level of employment increases inflation and thus property price, therefore,
macro economy parameters significantly influence the investor decisions and also
determine property returns (Giussani et al., 1992).
2. LITERATURE REVIEW
Sequel to the findings from the existing studies linking macro-economic factors
to property market from different localities, it has been established that
macroeconomic factors influenced property market; therefore different
macroeconomic indicators have been identified to have major explanatory influence
on property return. Brooks and Tsolacos (1999) adopted multi-equation regression
analysis in examining the impact of economic and financial factors on property
return in UK using quarterly data between 1985 and 1998, the result showed that
lagged effect of unexpected inflation on property return with a noticeable negative
influence and negative shock of short term interest rates negatively impact on
property return. Brooks and Tsolacos (2001) used multi-equation regression method,
the result showed interest spread is not feasible over a short period and the

M.B. Wahab, A.S. Adeogun, G.B. Morenikeji, M. Mammah, S.O. Abdulkareem | 136
LAÜ Sosyal Bilimler Dergisi (VIII-II) EUL Journal of Social Sciences
Aralık 2017 December
magnitude of influence is not proportional over a long run to establish the linkage in
UK market. Apergis (2003) objectively analyzed the dynamic effect of
macroeconomics on real estate pricing in Greece 1981-1999, and adopting multi-
equation regression model. The result variance decomposition showed that mortgage
rate has explanatory power and positive influence of employment and inflation rates
increase property returns. Joshi (2006) adopted multi-equation regression to model
the impact of monetary shocks on residential property market in India using quarterly
data between 2001 and 2005. The resulting multi-equation regression analysis
showed that the major variation in residential housing market is described by
innovation in interest rate and the shock of interest rate permanently influence the
return from residential housing market. This result is consistent with Brook and
Tsolacos (1999). Eldelstine and Tsang (2007) studied the influence of macro-
economic factors on housing market in U.S using quarterly data between 1988 and
2003. The result showed that employment and interest rate have strong positive
significant influence on property market. This finding is consistent with that of
Apergi (2003). Sari et al., (2007) studied the relationship between macroeconomics
and housing market in Turkey between 1961 and 2000. The study adopted multi-
equation regression and the result indicated that interest rate has a relatively more
substantial effect on housing investment market than employment rate; this finding is
consistent with previous studies (Apergi, 2003; Eldelstine &Tsang, 2007). Schalck
and Antipa (2009) empirically studied the impact of fiscal policy on property returns
in France, using multi-equation regression analysis, the result showed interest rate
positively influence property investment. It is therefore concluded that interest rate
subsidy is the most efficient measure of influence; the finding is consistent with that
of previous studies (Eldelstine & Tsang, 2007; Sari et al., 2007). Ge (2009) has
empirically adopted multiple regressions to examine the determinants of property
price returns in New Zealand (1980-2007), and having employed time series
quarterly data and concluded that unemployment and mortgage rate majorly
explained the variation in property price return, the finding on the explanatory
influence of mortgage rate on property returns is consistent with Apergis (2003).
Feng et al.,(2010) analyzed the relationship between macro-economic factors and
property price return in Hong Kong. The result of multi-equation regression showed
the existence of significant stable long run relationship; the research, therefore, found
out that error correction mechanism can affect the deviation house price return long
run through slow adjustment. Ojetunde et al., (2011) examined the interaction
between macro-economy and residential property market using annual data between
1984 and 2009. The result revealed that influence of real GDP and exchange rate
explained 28% variation in rent. Wei and Morley (2012) empirically examined the
interaction between macro economy and property return U.S, the study utilized
multi-equation regression analysis to model the bi-causal relationships between the
variables, the result showed interest rate explained the major variation in property
return, and thereby the shock of interest has contemporaneous effect on house price.
These findings are consistent with that of previous studies (Apergi, 2003; Eldelstine
& Tsang, 2007; Schalck and Antipa 2009). Siband and Mhlanga (2013) having
empirically examined the interaction between property return and the macro
economy in UK, and the multi-equation regression model was applied on quarterly
data between 1994-2011 to establish to the interaction, the result showed the shock
of inflation positively impact on property return after six quarters and negative shock

M.B. Wahab, A.S. Adeogun, G.B. Morenikeji, M. Mammah, S.O. Abdulkareem | 137
LAÜ Sosyal Bilimler Dergisi (VIII-II) EUL Journal of Social Sciences
Aralık 2017 December
of short term interest negatively impact on property return, vice versa. This finding is
consistent with that of Brooks and Tsolacos (1999). Ojetunde (2013) adopted multi-
equation regression to examine the existence of long run relationship and influence
of macro economy on residential rental performance in Nigeria using annual data
from 1984 to 2011.The result showed that real GDP and exchange rate forecasted
31.4% of variation and positively influenced residential market and at the same time
have positive shock influence on residential rent. This study is consistent with that of
Ojetunde et al., (2011). Udoekanem et al., (2014) studied the determinants of
commercial property rental growth in Minna, Nigeria between 2001 and 2012. The
study adopted both granger causality test and single equation regression to establish
both causal linkage and the influence of the determinants on rent, the result revealed
that real GDP and vacancy rate account for 83% in variation. The study showed an
explanatory influence of GDP on property rents, and this is consistent with that of
previous studies (Ojetunde et al., 2011; Ojetunde, 2013). Miregi and Obere (2014)
studied the effect of market fundamental variables on property price in Kenya
between 2001 and 2014; the result of multi-equation regression employed revealed
that inflation and interest rates had significant lagged positive and negative influence
on property price. Udoekanem et al., (2015) examined the determinants of
commercial property rental value in Wuse commercial district of Abuja, Nigeria
between 2001 and 2012. Single equation regression was adopted; the result revealed
that real GDP and vacancy rate respectively account 74% and 83% of variation in
office rent, therefore the study concludes that real GDP and vacancy rate are the
major drivers of rental change in Wuse market.This finding is consistent with that of
previous studies in Nigeria (Ojetunde et al., 2011; Ojetunde, 2013; Udoekanem et
al., 2014). Most of the existing studies carried out outside Nigeria have succeeded in
establishing the influence of macro economy on property returns and price without
the use nominal rent as commonly used in most Nigerian studies. Therefore the
existing studies in Nigeria have not been able to establish the influence of
macroeconomic factors on residential investment return but have only succeeded in
examining the influence of macroeconomic factors on rental value. The pressing
need for institutional investors to measure the influence of macro economy on the
performance of real investment has therefore created the vacuum or gap which the
study intends to fill.
3. STUDY AREA
Abuja is a capital city of Nigeria. Abuja is selected for study on the basis of the
existence of heavy property market transaction and due to presence of high level housing infrastructural services provision and development which cannot be
compared with any city within the country. Abuja, the Federal Capital Territory
(FCT) is on the longitude 60 44’ to 70 37’ E and latitude 80 23’ to 90 28’ N. Federal capital city (FCC) is the Abuja Municipal Area Council (AMAC) having four phases
of development. The map of Nigeria (see figure 1) showing federal capital territory
(FCT) in figure 2 and the FCT map showing federal capital city (FCT)are presented in figure 3 as shown.

M.B. Wahab, A.S. Adeogun, G.B. Morenikeji, M. Mammah, S.O. Abdulkareem | 138
LAÜ Sosyal Bilimler Dergisi (VIII-II) EUL Journal of Social Sciences
Aralık 2017 December
Fig1: Ma
Of Nigeria
Showing FCT
Fig3: Map of
FCC, Abuja
4. METHODOLOGY
The study employed both primary and secondary data. The primary data for the
study comprised rent and actual sale data from registered estate surveying and
valuation firms in Abuja between 2001 and 2015 which were collected through the
structured questionnaires. The secondary data comprised of macroeconomic indices
from Central Bank of Nigeria (CBN) and National Bureau of Statistics (NBS)
between 2001 and 2015. The macroeconomic indices employed for the study were
identified from the literature which includes real gross domestic product (RGDP),
inflation rate, interest rate, exchange rate, employment and unemployment rates. The
sample size adopted for each of residential areas of the city was quantitatively
determined using the model developed by Frankfort-Nachmias (1996). The model
used purposely when the population is too large. The model is therefore used to
sample residential transactions and the number of sales and lettings were presented in
table 1. The equation 2 is adopted to determine total returns from residential
investment. This model for sample size determination is described in equation 1.
Z2𝑝𝑞𝑁 𝑛 = 𝑒𝑞𝑢𝑎𝑡𝑖𝑜𝑛 1
e2(N − 1) + Z2pq
Where N = population size
n = sample size
p = 95% confidence level of the target population
q = 1- p

M.B. Wahab, A.S. Adeogun, G.B. Morenikeji, M. Mammah, S.O. Abdulkareem | 139
LAÜ Sosyal Bilimler Dergisi (VIII-II) EUL Journal of Social Sciences
Aralık 2017 December
e = Acceptable error Z = 1.96(the standard normal deviation at 95% confidence
level)
Also various residential property zones, the number of residential transaction and the
sampled properties is presented in table 1.
Table 1: Residential Markets, total number of residential transactions and Residential
Properties’ Sampled Abuja
Residential
Markets
No. of Residential
Letting
Transactions
No of
Residential
Lettings
Sampled
No of
Residential
Sale
Transactions
No. of Residential
Sales Sampled
Maitama (3B/R) 87 40 50 30
Maitama (4B/R) 109 44 50 30
Wuse II (3B/R) 63 34 42 27
Wuse II (4B/R) 453 63 42 27
Gwarinpa (3B/R) 157 50 50 30
Gwarinpa (4B/R) 66 35 40 26
Utako (3B/R) 47 29 25 19
Utako (4B/R) 45 28 27 20
Area1 (3B/R) 63 34 24 18
Area1 (4B/R) 47 29 27 20
Area 10 (3B/R) 47 29 27 20
Area 10 (4B/R) 29 21 25 19
Total 1,213 436 429 286
The study utilizes both descriptive and inferential method of data analysis.
Descriptive analysis involves determination of annual return index of residential
property investment upon which the influence of macroeconomic factors is
established. To determine the total return, holding period of total return model is
employed as described as follows:
𝑇𝑜𝑡𝑎𝑙𝑅𝑒𝑡𝑢𝑟𝑛 = (𝐶𝑉𝑡– 𝐶𝑉𝑡−1) + 𝑁𝐼
𝐶𝑉𝑡−1
𝑒𝑞𝑢𝑎𝑡𝑖𝑜𝑛 2
Where CVt is capital value at end of the year, CVt-1 is the capital value beginning of the year and NI represents net income or rental value.
The inferential method required the use of stationarity test using Augmented Dicker
fuller (ADF), Feager Granger conintegration test and conintegration regression
analysis. The model for Augmented Dicker fuller is described as follows:
𝑘
∆ 𝑌𝑡 = 𝛽0 + 𝛽1𝑌𝑡−1 + ∑ πi∆Yt−1 + Ut
𝑖=1
𝑒𝑞𝑢𝑎𝑡𝑖𝑜𝑛 3

LAÜ Sosyal Bilimler Dergisi (VIII-II) EUL Journal of Social Sciences
Aralık 2017 December
M.B. Wahab, A.S. Adeogun, G.B. Morenikeji, M. Mammah, S.O. Abdulkareem | 141
Where Yt represents vector of time series, t represent time, Ut represents the error
terms and π represents the coefficient matrix of the variables, Δrepresents
differences in variables.
5. RESULT AND DISCUSSION
Augmented Disker Fuller (ADF) unit root test is carried out on all the time series
data to examine the extent of their stationarity. The test requires time series data to
be stationary over the period before it can be considered appropriate for further
analysis and to also avoid spurious regression result. Cointegration test is used to
establish the long-term (run) relationship among the time series data. The result of
ADF unit root test presented in table 2 shows that real GDP, inflation rate, interest
rate and unemployment rate are stationary at first-order difference, only exchange
rate is stationary at second-order difference, employment rate is stationary at level
and while property returns from different markets are stationary at level. The
implication of this test is that the time series data employed for this study is suitable
and appropriate for further analysis.
Table 2: Stationary or Unit Root Test
Variables
Computed t-
statistic
ADF Critical @0.05
Prob.*
Order of integration
Δ Real GPD -5.003512 -3.144920 0.0025 I(1)
Δ Inflation Rate -4.296966 -3.144920 0.0075 I(1)
Δ Interest Rate -7.446427 -3.144920 0.0001 I(1)
Δ Unemployment Rate -4.444466 -3.144920 0.0059 I(1)
ΔΔ Exchange Rate -3.604032 -3.175352 0.0255 I(2)
ΔEmployment Rate -6.405753 -3.119910 0.0002 I(1)
Maitama 3B/R(Rt) -3.483968 -3.119910 0.0066 I(0)
Maitama 4B/R(Rt) -3.866170 -3.119910 0.0139 I(0)
Wuse 3B/R(Rt) -3.872870 -3.175352 0.0167 I(0)
Wuse 4B/R(Rt) -3.993629 -3.175352 0.0138 I(0)
Gwarinpa 3B/R(Rt) -4.299031 -3.119910 0.0066 I(0)
Gwarinpa 4B/R(Rt) -3.919592 -3.119910 0.0127 I(0)
Utako 3B/R(Rt) -7.402952 -3.144920 0.0001 I(0)
Utako 4B/R(Rt) -3.692435 -3.212696 0.0244 I(0)
Area 1 3B/R(Rt) -4.907100 -3.144920 0.0029 I(0)
Area 1 4B/R(Rt) -4.208528 -3.175352 0.0099 I(0)
Area 10 3B/R(Rt) -5.667033 -3.144920 0.0009 I(0)
Area 10 4B/R(Rt) -4.578586 -3.144920 0.0048 I(0)
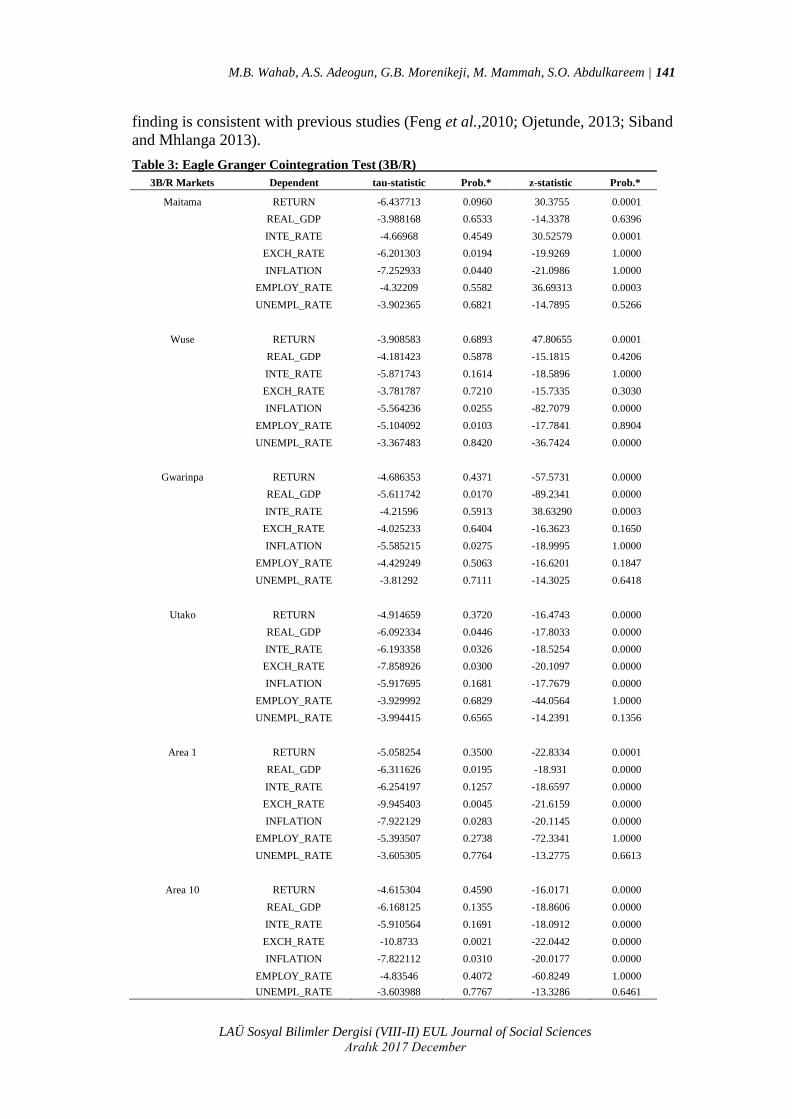
In order to establish long run relationship between the variables, Feagle Granger
cointegration test is employed in table 3 and 4. The test reveals the at least two or
more cointegrating equations, suggesting that macroeconomic variables come
together to have a significant long run relationship with property returns. This
LAÜ Sosyal Bilimler Dergisi (VIII-II) EUL Journal of Social Sciences
Aralık 2017 December
M.B. Wahab, A.S. Adeogun, G.B. Morenikeji, M. Mammah, S.O. Abdulkareem | 141
finding is consistent with previous studies (Feng et al.,2010; Ojetunde, 2013; Siband
and Mhlanga 2013).
Table 3: Eagle Granger Cointegration Test (3B/R)
3B/R Markets Dependent tau-statistic Prob.* z-statistic Prob.*
Maitama RETURN -6.437713 0.0960 30.3755 0.0001
REAL_GDP -3.988168 0.6533 -14.3378 0.6396
INTE_RATE -4.66968 0.4549 30.52579 0.0001
EXCH_RATE -6.201303 0.0194 -19.9269 1.0000
INFLATION -7.252933 0.0440 -21.0986 1.0000
EMPLOY_RATE -4.32209 0.5582 36.69313 0.0003
UNEMPL_RATE -3.902365 0.6821 -14.7895 0.5266
Wuse
RETURN
-3.908583
0.6893
47.80655
0.0001
REAL_GDP -4.181423 0.5878 -15.1815 0.4206
INTE_RATE -5.871743 0.1614 -18.5896 1.0000
EXCH_RATE -3.781787 0.7210 -15.7335 0.3030
INFLATION -5.564236 0.0255 -82.7079 0.0000
EMPLOY_RATE -5.104092 0.0103 -17.7841 0.8904
UNEMPL_RATE -3.367483 0.8420 -36.7424 0.0000
Gwarinpa
RETURN
-4.686353
0.4371
-57.5731
0.0000
REAL_GDP -5.611742 0.0170 -89.2341 0.0000
INTE_RATE -4.21596 0.5913 38.63290 0.0003
EXCH_RATE -4.025233 0.6404 -16.3623 0.1650
INFLATION -5.585215 0.0275 -18.9995 1.0000
EMPLOY_RATE -4.429249 0.5063 -16.6201 0.1847
UNEMPL_RATE -3.81292 0.7111 -14.3025 0.6418
Utako
RETURN
-4.914659
0.3720
-16.4743
0.0000
REAL_GDP -6.092334 0.0446 -17.8033 0.0000
INTE_RATE -6.193358 0.0326 -18.5254 0.0000
EXCH_RATE -7.858926 0.0300 -20.1097 0.0000
INFLATION -5.917695 0.1681 -17.7679 0.0000
EMPLOY_RATE -3.929992 0.6829 -44.0564 1.0000
UNEMPL_RATE -3.994415 0.6565 -14.2391 0.1356
Area 1
RETURN
-5.058254
0.3500
-22.8334
0.0001
REAL_GDP -6.311626 0.0195 -18.931 0.0000
INTE_RATE -6.254197 0.1257 -18.6597 0.0000
EXCH_RATE -9.945403 0.0045 -21.6159 0.0000
INFLATION -7.922129 0.0283 -20.1145 0.0000
EMPLOY_RATE -5.393507 0.2738 -72.3341 1.0000
UNEMPL_RATE -3.605305 0.7764 -13.2775 0.6613
Area 10
RETURN
-4.615304
0.4590
-16.0171
0.0000
REAL_GDP -6.168125 0.1355 -18.8606 0.0000
INTE_RATE -5.910564 0.1691 -18.0912 0.0000
EXCH_RATE -10.8733 0.0021 -22.0442 0.0000
INFLATION -7.822112 0.0310 -20.0177 0.0000
EMPLOY_RATE -4.83546 0.4072 -60.8249 1.0000
UNEMPL_RATE -3.603988 0.7767 -13.3286 0.6461

LAÜ Sosyal Bilimler Dergisi (VIII-II) EUL Journal of Social Sciences
Aralık 2017 December
M.B. Wahab, A.S. Adeogun, G.B. Morenikeji, M. Mammah, S.O. Abdulkareem | 142
Table 4: Eagle Granger Cointegration Test (4B/R)
4B/RMarkets Dependent tau-statistic Prob.* z-statistic Prob.*
Maitama RETURN -6.437713 0.0160 -20.3755 1.0000
REAL_GDP -3.988168 0.6533 -14.3378 0.6396
INTE_RATE -4.66968 0.4549 30.52579 0.0001
EXCH_RATE -6.201303 0.0294 -19.9269 1.0000
INFLATION -7.252933 0.0440 -21.0986 1.0000
EMPLOY_RATE -4.32209 0.5582 36.69313 0.0003
UNEMPL_RATE -3.902365 0.6821 -14.7895 0.5266
Wuse
RETURN
-4.376681
0.0320
-15.3136
0.0000
REAL_GDP -4.206898 0.5944 -44.2089 1.0000
INTE_RATE -4.334939 0.5454 -15.0484 0.0000
EXCH_RATE -4.191168 0.5993 -40.8457 1.0000
INFLATION -4.007046 0.6579 -39.0844 1.0000
EMPLOY_RATE -5.866694 0.0004 -81.3304 1.0000
UNEMPL_RATE -3.291448 0.8595 -34.1767 1.0000
Gwarinpa
RETURN
-6.437713
0.0260
-20.3755
0.0000
REAL_GDP -3.988168 0.6533 -14.3378 0.6396
INTE_RATE -4.66968 0.4549 30.52579 0.0001
EXCH_RATE -6.201303 0.0094 -19.9269 1.0000
INFLATION -7.252933 0.0440 -21.0986 1.0000
EMPLOY_RATE -4.32209 0.5582 36.69313 0.0003
UNEMPL_RATE -3.902365 0.6821 -14.7895 0.5266
Utako
RETURN
-5.244473
0.2909
-17.5884
0.0000
REAL_GDP -4.460399 0.5061 -16.7172 0.0000
INTE_RATE -4.919841 0.3706 -16.4079 0.0000
EXCH_RATE -5.591198 0.0205 -18.327 0.0000
INFLATION -7.685843 0.0349 -20.2082 0.0000
EMPLOY_RATE -4.727987 0.4378 -54.2095 1.0000
UNEMPL_RATE -3.16206 0.8890 -12.2005 0.8417
Area 1
RETURN
-4.615304
0.4590
-16.0171
0.0000
REAL_GDP -6.168125 0.0355 -18.8606 0.0000
INTE_RATE -5.910564 0.1691 -18.0912 0.0000
EXCH_RATE -10.8733 0.0021 -22.0442 0.0000
INFLATION -7.822112 0.0310 -20.0177 0.0000
EMPLOY_RATE -4.83546 0.4072 -60.8249 1.0000
UNEMPL_RATE -3.603988 0.7767 -13.3286 0.6461
Area 10
RETURN
-5.344813
0.2685
-18.748
0.0000
REAL_GDP -5.97323 0.1602 -19.3703 0.0000
INTE_RATE -6.510188 0.1007 -18.7289 0.0000
EXCH_RATE -9.288929 0.0082 -21.573 0.0000
INFLATION -7.258737 0.0314 -19.5454 0.0000
EMPLOY_RATE -4.68071 0.4517 -59.5589 1.0000
UNEMPL_RATE -3.848966 0.7035 -13.8934 0.3828

LAÜ Sosyal Bilimler Dergisi (VIII-II) EUL Journal of Social Sciences
Aralık 2017 December
M.B. Wahab, A.S. Adeogun, G.B. Morenikeji, M. Mammah, S.O. Abdulkareem | 143
Table 5 and 6 presented the result of cointegration regression analysis. Co-
integrating regression is considered appropriate, in that, macroeconomic variables are
not stationary (at level) in the linear relationship specified in chapter three, until first
and second differencing, only the property return index is stationary (at level).
therefore macroeconomic variables are said to be co-integrated. It is simply the unit
root test applied to the residual of ordinary least square estimation. The test of
autocorrelation was carried out through Durbin Watson (DW) statistics presented in
Table 5 and Table 6 to ensure non-spurious, R2<DW is necessary condition to
suggest no autocorrelation in the residual. Durbin-Watson statistic suggests no
autocorrelation in the regression as presented in aforementioned Tables. The finding
shows the result of regression is non-spurious and the outcome regression is
therefore appropriate.
The result of cointegration regression in Table 5 shows that 53.5%, 83.6%,
55.2% and 47.4% variation in 3B/R property return is significantly influenced by
macroeconomic variables in Maitama, Wuse, Gwarinpa and Utako markets
respectively. This further implies that four markets out of six residential markets for
3B/R were significantly influenced by macroeconomic indicators, and the
significance of cointegration regression model is presented in table 7. While 38.5%
and 18.2% variation in property return in Area 1 and Area 10 respectively, are
insignificantly influenced by macroeconomic variables. Table 6 shows that 60.9%,
78.6%, and 79.9% variation in 4B/R property return is significantly influenced by
macroeconomic variables in Maitama, Wuse and Utako markets respectively. Also
14.3%, 16.2% and 26.2% variation in property return in Gwarinpa, Area 1 and
Area10 respectively, are insignificantly influenced by macroeconomic variables.
This further implies that three markets out of six residential markets for 4B/R were
significantly influenced by macroeconomic indicators, and the significance of
cointegration regression model is presented in table 8. This finding is consistent with
(Apergis, 2003; Joshi, 2006; Eldelstine&Tsang, 2007; Kwangware, 2010).
Table 5: Results of Co-integrating Regression Analysis (3B/R Market)
Markets Variables Coefficients Std. Error t-statistic Prob R DW
Maitama REAL_GDP 0.2509 0.2597 0.9664 0.3782 0.535 2.02
EXCH_RATE 0.0856 0.0228 3.7478 0.0133
INTE_RATE 0.4609 0.2279 2.0229 0.099
INFLATION 0.1425 0.0505 2.8218 0.037
EMPLOY_RATE 0.0781 0.0253 3.0899 0.0272
UNEMPL_RATE -0.0500 0.0489 -1.0229 0.3532
C 19.728 9.0664 2.1759 0.0815
Wuse REAL_GDP 0.9434 0.2128 4.4334 0.0068 0.836 2.12
EXCH_RATE 0.0674 0.0187 3.6015 0.0155
INTE_RATE 0.7535 0.1867 4.0354 0.01
INFLATION 0.1627 0.0414 3.9319 0.011
EMPLOY_RATE 0.1372 0.0207 6.6269 0.0012
UNEMPL_RATE -0.1359 0.0401 -3.3912 0.0194
C -32.6039 7.4294 -4.3885 0.0071
Gwarinpa REAL_GDP 0.1936 0.889 4.5919 0.002 0.552 2.01
EXCH_RATE 0.3394 0.4695 1.383 0.043
INTE_RATE 0.271 0.326 1.2029 0.224
INFLATION 0.4473 0.5521 0.81 0.423

LAÜ Sosyal Bilimler Dergisi (VIII-II) EUL Journal of Social Sciences
Aralık 2017 December
M.B. Wahab, A.S. Adeogun, G.B. Morenikeji, M. Mammah, S.O. Abdulkareem | 144
EMPLOY_RATE 0.2806 0.2194 1.28 0.21
UNEMPL_RATE -0.5437 0.3709 -1.4658 0.041
C -15.434 5.472 -2.82 0.008
Utako REAL_GDP 0.8743 0.2679 3.2642 0.0223 0.474 1.78
EXCH_RATE 0.0171 0.0235 0.7254 0.5007
INTE_RATE 0.6062 0.2351 2.5790 0.0495
INFLATION 0.1629 0.0521 3.1291 0.026
EMPLOY_RATE 0.0391 0.0261 1.5008 0.1937
UNEMPL_RATE 0.1189 0.0504 2.3573 0.065
C -15.4537 9.3522 -1.6524 0.1594
Area 1 REAL_GDP 0.1655 0.1532 1.0802 0.3294 0.385 2.01
EXCH_RATE 0.0081 0.0135 0.5969 0.5765
INTE_RATE 0.0267 0.1344 0.1987 0.8503
INFLATION 0.0368 0.0298 1.2345 0.2719
EMPLOY_RATE 0.0547 0.0149 3.6688 0.0145
UNEMPL_RATE 0.0051 0.0288 0.1753 0.8677
C -3.6832 5.3480 -0.689 0.5217
Area 10 REAL_GDP 0.1010 0.2114 0.4778 0.653 0.182 1.77
EXCH_RATE -0.0089 0.0186 -0.4808 0.651
INTE_RATE 0.1514 0.1855 0.8159 0.4516
INFLATION -0.0233 0.0411 -0.5671 0.5952
EMPLOY_RATE 0.0063 0.0206 0.3079 0.7706
UNEMPL_RATE 0.0737 0.0398 1.8515 0.1233
C -3.3106 7.3824 -0.4485 0.6726
Fully Modified Least Squares (FMOLS)
Table 6: Results of Co-integrating Regression Analysis (4B/R Market)
Markets Variable Coefficients Std. Error t-statistic Prob R DW
Maitama REAL_GDP 0.1967 0.2702 0.7279 0.4993 0.6096 1.82
EXCH_RATE 0.0705 0.0238 2.9667 0.0313
INTE_RATE 0.6248 0.2371 2.6346 0.0463
INFLATION 0.2165 0.0525 4.1214 0.0092
EMPLOY_RATE 0.1203 0.0263 4.5734 0.006
UNEMPL_RATE -0.0869 0.0509 -1.7093 0.1481
C 20.4129 9.4349 2.1635 0.0828
Wuse
REAL_GDP
0.1150
0.02504
4.5952
0.0025
0.7866
1.95
EXCH_RATE 0.1026 0.0220 4.6613 0.0055
INTE_RATE 0.1325 0.02197 6.0342 0.0018
INFLATION 0.3144 0.0487 6.4579 0.0013
EMPLOY_RATE 0.0852 0.0244 3.4953 0.0174
UNEMPL_RATE -0.1512 0.0472 -3.2064 0.0238
C -50.3989 8.7432 -5.7644 0.0022
Gwarinpa
REAL_GDP
0.2535
0.1563
1.6217
0.156
0.1434
2.04
EXCH_RATE 0.0109 0.0126 0.8638 0.4209
INTE_RATE 0.1122 0.0899 1.2469 0.2589
INFLATION -0.018 0.0169 -1.0560 0.3316
EMPLOY_RATE 0.0464 0.0316 1.4697 0.192
UNEMPL_RATE -6.7036 4.3732 -1.5329 0.1762

LAÜ Sosyal Bilimler Dergisi (VIII-II) EUL Journal of Social Sciences
Aralık 2017 December
M.B. Wahab, A.S. Adeogun, G.B. Morenikeji, M. Mammah, S.O. Abdulkareem | 145
C -6.7036 4.3732 -1.5328 0.1762
Utako
REAL_GDP
0.1572
0.02397
6.5595
0.0012
0.7996
1.71
EXCH_RATE 0.1293 0.0211 6.1347 0.0017
INTE_RATE 0.3451 0.0211 6.3938 0.0014
INFLATION 0.2379 0.0466 5.1055 0.0038
EMPLOY_RATE 0.1219 0.0233 5.2274 0.0034
UNEMPL_RATE -0.2101 0.0451 -4.6539 0.0056
C -58.8432 8.3703 -7.0300 0.0009
Area 1
REAL_GDP
0.1588
0.2298
0.6911
0.5203
0.1623
2.12
EXCH_RATE 0.029 0.0202 1.4428 0.2087
INTE_RATE 0.038 0.2017 0.1905 0.8564
INFLATION 0.0007 0.0447 0.0158 0.988
EMPLOY_RATE 0.0296 0.0224 1.3244 0.2427
UNEMPL_RATE -0.0059 0.0433 -0.1368 0.8965
C 4.3938 8.0256 0.5475 0.6076
Area 10
REAL_GDP
0.2626
0.3422
0.7675
0.4774
0.2625
1.98
EXCH_RATE 0.0319 0.0301 1.0612 0.3371
INTE_RATE 0.3989 0.3003 1.3286 0.2414
INFLATION 0.1518 0.0665 2.2817 0.0074
EMPLOY_RATE 0.0176 0.0333 0.5281 0.6201
UNEMPL_RATE -0.0482 0.0644 -0.7475 0.4884
C 11.2214 11.9472 0.9392 0.3907
Fully Modified Least Squares (FMOLS)
The result of significant test of co-integration regression presented in Table 7 and
Table 8 revealed that the overall market model for both Area 1 and Area 10 in Table
7 were jointly insignificant, and in Table 8, the overall market model for Gwarinpa,
Area 1 and Area 10 were jointly insignificant. Furthermore, Maitama, Wuse,
Gwarinpa and Utako in table 7 and Maitama, Wuse and Utako in Table 8 had their
overall market model to be statistically significant, in other words. All variables
included in the market models were jointly significant. Therefore, the models can be
used for the purpose of predicting of returns in the markets.
Table 7: Wald Test of Significance of the Co-integrating Regression Model
3B/R Markets T statistic Value DF Prob
Maitama F-statistic 5.516434 (8, 5) 0.0391
Wuse F-statistic 15.10564 (8, 5) 0.0043
Gwarinpa F-statistic 5.915467 (8, 5) 0.0331
Utako F-statistic 5.806467 (8, 5) 0.0352
Area1 F-statistic 3.688136 (8, 5) 0.0849
Area 10 F-statistic 0.849408 (8, 5) 0.5935

LAÜ Sosyal Bilimler Dergisi (VIII-II) EUL Journal of Social Sciences
Aralık 2017 December
M.B. Wahab, A.S. Adeogun, G.B. Morenikeji, M. Mammah, S.O. Abdulkareem | 146
Table 8: Wald Test of Significance of the Co-integrating Regression Model
4B/R Markets T statistic Value DF Prob
Maitama F-statistic 5.970942 (8, 5) 0.0333
Wuse F-statistic 9.047895 (8, 5) 0.0138
Gwarinpa F-statistic 1.108410 (8, 6) 0.4581
Utako F-statistic 12.61281 (8, 5) 0.0066
Area 1 F-statistic 1.185575 (8, 5) 0.4407
Area 10 F-statistic 1.612272 (8, 5) 0.3096
CONCLUSION AND RECOMMENDATION
The influence of macroeconomic variables in Abuja residential market property
market showed that the real GDP, exchange rate, inflation, interest rate and
employment rate have been found to have a significant influence on property return
across the nine markets. Therefore the implication of this outcome is that property
investors tends to have an increase in property returns whenever positive
macroeconomic policy is made to secure the economy by improving GDP base,
increasing exchange rate to encourage local demand, the increase in employment rate
increases the purchasing power in housing market, increase in interest and inflation
rates increase the housing rent and prices thereby positively influence the investor’s
return, property returns are negatively influenced by negative policy-action that
meant to increase unemployment in the economy, therefore any development in
economy must be continuously monitored to determine how such development affect
property returns. It is on this basis that the study recommends that the policy-makers
should painstakingly study the past and present economic policy before the
implementation as such could adversely affect the property market which conversely
affects the contribution of real estate sector into national economy development.

LAÜ Sosyal Bilimler Dergisi (VIII-II) EUL Journal of Social Sciences
Aralık 2017 December
M.B. Wahab, A.S. Adeogun, G.B. Morenikeji, M. Mammah, S.O. Abdulkareem | 147
REFERENCES
Abraham, J. and Hendershott, P. (1996), “Bubbles in Metropolitan Housing
Markets”, Journal of Housing Research, 7(2): 191-207.
Apergis N. (2003), “Housing Price and Macroeconomic Factor: Prospect within the
European Monetary Union”, International Real Estate Review, 6(1): 63-74.
Belo M. and Abgatekwe A. (2002), “Project Management in Property Development:
the Nigeria experience”, Ibadan: University Press PLC.
Born, W. and Pyhrr, S. (1994), “Real Estate Valuation: The Effect of Market and
Property Cycles”, Journal of Real Estate Research, 4(3): 455-485.
Brook and Tsolacos (2001), “Linkages between Property Return and Interest Rate.
Evidence for the UK”, Journal of Applied Economics, 33(6): 711-719.
Brooks, C. and Tsolacos, S. (1999), “The Impact of Economic and Financial Factors
on UK Property Performance”, Journal of Property Research, 16(2): 139-152.
Clark, A. and Daniel, T. (2006), “Forecasting south Africa house price”, Journal of
Investment Analysts, 64:27-33.
Dehesh, A. and Pugh, C. (1998), “Property Cycles in a Global Economy”, Urban
studies, Journal of Real Estate Research, 37(13): 2581-2602.
Edelstein, R. and Tsang D. (2007), “Dynamics of residential housing cycles
analysis”, Journal of Real Estate Finance, 35: 295-313.
Feng L., Lu W., Hu W. and Liu K. (2010), “Macroeconomic Factors and Housing
Market Cycle: an Empirical Analysis Using National City Level Data in China”, The
Conference on Web-Based Business Management, Scientific Research.
Frankfort-Nachmias, C. and Nachmias, D. (1996), “Research Methods in the Social
Sciences”, Fifth Edition, Arnold, London.
Fraser, W.D. (1993), “Principles of Property Investment and Pricing”, London: The
Macmilland Press Ltd.
Ge, X.J. (2009), “Determinant of House Price in New Zealand”, University of
Technology Sydney. Pacific Rim Property Research Journal, 5(1): 90-121.
Giussani. B, Hsai M. and Tsolacos S. (1992), “A Comparative Analysis of the Major
Determinants of Office Property Value”, Journal of Property Valuation and
Investment, 11: 157-173.
Gutpa R., Jurglas M. and Kabundi A. (2010), “Effect of Monetary Policy on Real
House Price Growth in South Africa. A factor-Augmented Vector Autoregressive
Approach”, Economic Modelling, 27: 315-323.
Hoesli, M. and Macgregor B. (2000), “Property Investment: Principles and Practice
of Portfolio Management”, Longman Essex.
Joshi, H. (2006), “Identifying the asset price bubble in the housing market in India:
Research bank of India”, 27(2): 73-88.
Kalu, I. U. (2001), “Property Valuation and Appraisal”, Owerri: Bon Publications.

LAÜ Sosyal Bilimler Dergisi (VIII-II) EUL Journal of Social Sciences
Aralık 2017 December
M.B. Wahab, A.S. Adeogun, G.B. Morenikeji, M. Mammah, S.O. Abdulkareem | 148
Kwangware, B. (2010), “The Impact of Macroeconomic and Financial Factor On
The Performance of the Housing Property Market In South Africa. Department of
Economics and Economic History”: Rhodes University Conference, Grahamstorm.
Ling, D. and Naranjo, A. (1997), “Economic Risk Factor and Commercial Real
Estate Returns”, Journal of Real Estate Finance and Economics, 14(3): 283-30.
Lizieri, C. and Satchell, S. (1997), “Property Company Performance and Real
Interest Rate: a Regime Switching Approach”, Journal of Property Research,
14(1):85-97.
Miregi, M. O. and Obere, A. (2014), “Effect Of Market Fundamental Variable On
Property Prices In Kenya- A Case of Nairobi Residential Property Market”. Journal
of Economics and Finance, 5(5): 101-113.
Ojetunde, I. (2013), “Revisiting Interaction between the Nigeria Residential Property
Market and the Macro Economy. International Federation of Surveyor”, Journal of
Geography, Environment and Planning, 7(2): 256-278.
Ojetunde I., Popoola N. and Kemiki O. (2011), “On the Interaction between the
Residential Property Market and the Macro Economy”, Journal of Geography,
Environment and Planning, 7(2), https://papers.ssrn.com/sol3/papers.cfm?abstract
_id= 2105998, Retreived: 10.05.2017.
Peng, R. and Hudson-Wilson S. (2002), “Testing Real Estate Price Bubble: An
Application to Tokyo Office Market”, Proceedings of 7th conference in Seoul.
Peng W., Tan B. and Yiu M. (2005), “The Property Market and the Macro Economy
of the Mainland: A Cross Region Study Hong Kong”, Institute for Monetary
Research China.
Samy, L. (2015), “Indices of House Price and Rent Prices of Residential Property in
London 1835-1939”, Discussion Paper in Economics and Social History Number
134.
Sarı, R., Ewing B. T. and Aydın, B. (2007), “Macroeconomic variables and housing
market in Turkey”, Emerging markets finance and trade, 43(5): 5-19.
Schalck, C. and Antipa, P. (2009), “Impact of fiscal policy on residential investment
in France”, Journal of Urban Economics, 37(2): 1-33.
Sinbad, M. and Mhlanga, R. (2013), “The Interaction Between Property Return and
The Macro Economy”, International Journal of Business and Social Research, 3(4):
146-152.
Udoekanem, N. B., Ighalo J. I. and Nuhu, M.B (2014), “Determinants of Commercial
Property Rental Growth in Minna, Nigeria”, EUL Journal of Social Science, 5(1):
60-75.
Udoekanem, N.B., Ighalo J. I., Sanusi, Y. A. and Nuhu M. B. (2015), “Office Rental
Determinants in Wuse Commercial District of Abuja, Nigeria”, University of
Mauritius Research Journal, 21:1-26.
Wei, Q. and Morley, B. (2012), “The Interaction between the Macro Economy and
House Price Retur”, Journal of Property Return, 17(8): 1-17.
LAÜ Sosyal Bilimler Dergisi (VIII-II) EUL Journal of Social Sciences
Aralık 2017 December
M.B. Wahab, A.S. Adeogun, G.B. Morenikeji, M. Mammah, S.O. Abdulkareem | 149
Wilhelinsson, M. (2000), “The Impact of Traffic Noise on the Value of Single-
Family Houses”, Journal of Environmental Planning and Management, 43(6):
799- 815.
Yusof, M. A. and Ismail, S. (2012), “Multiple Regression in Analyzing House
Price Variation”, IBIMA Publishing, Article ID 38310 :19-18.
Muktar Babatunde Wahab is a real estate Practitioner and Research Assistant
at Federal University of Technology, Minna Nigeria. He holds a Bachelor of
Technology (B.Tech) in Estate Management and Master of Technology
(M.Tech) in Estate Management and Valuation at Federal University of
Technology Minna, Nigeria. His research interest is property investment market
analysis and economic dynamics in Property Market.
Muktar Babatunde Wahab, Federal Teknoloji Üniversitesi, Minna Nijerya'da
gayrimenkul Uygulayıcısı ve Araştırma Asistanı olarak görev almaktadır.
Federal Teknoloji Üniversitesi'nde Gayrimenkul Yönetimi lisansını tamamlamış
ve yine Federal Teknoloji Üniversitesi'nde Gayrimenkul Yönetimi ve Değerleme
yüksek lisans programından (M.Tech) mezun olmuştur. Araştırma ilgi alanları,
gayrimenkul piyasasında gayrimenkul yatırım piyasa analizi ve ekonomik
dinamikler üzerine yoğunlaşmaktır.