effect of molecular weight on secondary newtonian …
TRANSCRIPT

EFFECT OF MOLECULAR WEIGHT ON SECONDARY NEWTONIAN
PLATEAU AT HIGH SHEAR RATES FOR LINEAR ISOTACTIC MELT
BLOWN POLYPROPYLENES
Jiri Drabek1, Martin Zatloukal1,* and Mike Martyn2
1Polymer Centre, Faculty of Technology, Tomas Bata University in Zlín,
Vavrečkova 275, 760 01 Zlín, Czech Republic
2IRC in Polymer Engineering, School of Engineering, Design & Technology,
University of Bradford, Bradford BD7 1DP, UK
Keywords: High shear rate rheology, secondary Newtonian viscosity, polymer melt,
melt blown, isotactic polypropylene, rheological models.
*Corresponding author: [email protected]

ABSTRACT
In this work, three melt blown grades of isotactic linear polypropylenes, with weight
average molecular weights between 56 250 - 75 850 g/mol, have been characterized at
230 oC over a very wide shear rate range (10-107 1/s) by using conventional rotational and
twin bore capillary rheometry equipped with novel orifice die design, and by an
instrumented capillary nozzle on an injection molding machine. A low shear rate primary
Newtonian plateau, a pseudoplastic region and a well developed secondary Newtonian
plateau (occurring between 66 107102 1/s) were identified for all the polypropylene
melts. Considering the typical value of pressure sensitivity coefficient for polypropylene
melt, β = 20.00 GPa-1, and measured flow activation energy at the secondary Newtonian
plateau, E = 25.204 kJ/mol, it was found that the effect of viscous dissipation and
pressure is mutually cancelled, i.e. that the measured viscosity data can be considered as
the true material property within the whole applied shear rate range. For the first time, it
has been revealed that the secondary Newtonian viscosity, , depends linearly on the
weight average molecular weight, Mw, in log-log scale as 084.161019.1 wM
. The
observed slope close to 1 between and Mw suggests that polymer chains in the melt are
disentangled at the secondary Newtonian plateau region. This conclusion is supported by
the experimental observation that the high shear rate flow activation energy E for given
PP melts is comparable with the flow activation energy of PP like oligomer (squalane,
C30H62; 2,6,10,15,19,23-hexamethyltetracosane). The measured flow data were fitted by
six different viscosity models, from which two, namely Modified Carreau and Quemada
models, were suggested here for the first time. It has been found that the accuracy of
utilized models to describe the measured data is the highest for the newly suggested
models and decreases in the following order: Modified Quemada model, Modified Carreau

model, Carreau-Yasuda model, Cross model, Generalized Quemada model and Carreau
model.
INTRODUCTION
Melt blowing is a fabrication process typically used in the production of nonwoven
polymer micro-fibers. Low viscosity polymers are extruded through a spinnerette die
containing several hundred holes. At the end of the die, an air manifold is located to provide
hot and compressed high velocity air, which stretches the melt creating fibers when it leaves
the spinnerette (see Figure 1). It has been reported that polymeric nanofibers can also be
produced by melt blown technology through, firstly, changing of processing conditions [1],
secondly, by the polymer modification [2-3], and finally, by utilizing a special die where
orifice diameters, D, are very small (0.064 mm-0.125 mm) and length-to-diameter ratio, L/D,
is very large (20/1-1000/1) [4-6]. Thus, it is possible to produce nanofibers at reasonable
rates, and provide melt blown fibers of the same size range as those previously exclusive to
the domain of electrospinning technology [3, 6-8].
Polypropylene is the most widely used polymer in the melt blown technology due to its
low cost, ease of processing, good mechanical properties, and chemical inertness [9-12]. In
order to understand the formation of nanofibers and process stability, it is necessary to know
rheological behavior of these polymers. Probably the first researcher to perform a detailed
rheological characterization of melt blown PPs was Yizhong Wang [13]. Wang characterized
two ExxonMobil Escorene melt blown PPs (MFI of 400 and 1200 g/10min) at 185-240 oC
using an Advanced Rheometric Expansion System (ARES, frequency range 0.1-100 rad/s)
and advanced capillary extrusion rheometer covering shear rates in the range 1 to 105 1/s.
Later, Rajkishore Nayak [14] investigated the rheological behaviour of four melt blown PPs
(MFI of 100, 300, 1000 and 2000 g/10min with Mw of 100 875, 77 590, 60 238 and 55 509

g/mol) between 180-210 oC utilizing an ARES in dynamic mode and low frequency range
(0.1-100 rad/s). Both authors showed that conventional rheological tools can be used for
rheological characterization of very low viscosity melt blown PPs but, such tools are limited
in being unable to cover extreme deformation rate range typical for melt blown technology,
i.e. 106-107 1/s [1, 15], which significantly limits optimization of this process.
There are only a few papers reporting shear viscosity measurements for polymer melts at
such high shear rate range utilizing specially designed rheological equipment such as
hydraulically powered capillary rheometer [16] or an instrumented injection molding
machine [17, 18-20]. With respect to polyolefins (such as polypropylene, PP, high-density
polyethylene, HDPE, and ultra-high-molecular-weight polyethylene, UHMWPE), the
following key conclusions have been found.
Firstly, HDPE and UHMWPE exhibit a Newtonian behaviour between about 6103 -
6105 1/s [16] whereas at higher shear rates, the second shear thinning region was observed.
In this flow regime, shear viscosity decreases with the shear rate mainly due to polymer chain
scission, which was confirmed via monitoring of weight average molecular weight, Mw, of
extruded HDPE at high shear rates. Secondly, a well-developed secondary Newtonian plateau
was found for four different polypropylenes between approximately 6101 -
6108 1/s [16-
20]. In this case, no second shear thinning or thickening region was detected within whole
applied high shear rate range. On the other hand, it was found that the secondary Newtonian
plateau for specific PP grade can be followed by the shear thickening behaviour occurring at
the highest shear rates if the effect of pressure prevails over the effect of viscous dissipation
[17].
Finaly, Takahashi et al. [16] compared flow curves, containing secondary Newtonian
plateau, for HDPE and UHMWPE samples (having about an order of magnitude different
Mw) and concluded that the viscosity dependence on Mw is small at high shear rates. Kelly et

al. [17] provided similar comparison for two PPs with different Mw (192 000 and 283 000)
with the suggestion that ‘…molecular size or structure may influence the observed high strain
plateau’.
With the aim to understand flow behaviour of melt blown polymers in more detail,
three linear isotactic PP samples with melt flow rate between 450-1200 g/10min were
characterized over a very wide deformation rate range (10-107 1/s) by using rotational and
capillary rheometry as well as by the instrumented injection molding machine equipped with
interchangeable dies. In the second part of this work, the fitting capability of different simple
shear viscosity models were evaluated for all tested polymer samples.
EXPERIMENTAL
In this work, linear isotactic PP Borflow HL504FB (76k), HL508FB (64k) and HL512FB
(56k) produced by Borealis Polyolefine have been used. Basic characteristics of their pellets
are summarized in Table 1.
Low shear rate viscosity data were measured on an Advanced Rheometric Expansion
System (ARES 2000 model, Rheometrics Scientific, USA) at 190, 210 and 230 oC in parallel
plate mode. The aluminium bottom plate with the overflow channel was used to prevent
polymer melt leakage flow out of the geometry. A Rosand RH7-2 twin bore capillary
rheometer, together with Bagley and Rabinowitsch corrections, has been utilized for the
determination of shear viscosities at medium shear rates by using a novel patented orifice die
[21-22]. The main advantage of the utilized orifice die is the open downstream region design
which eliminates any possibility for artificial pressure increase due to polymer melt touching
the downstream wall. In this work, three long dies (length to diameter ratio, L/D, equal to 16,
D1=0.15 mm, D2=0.5 mm, D3=1 mm) and three orifice dies with the same diameters were
used. Close fitting piston tips of the instrument were made from polyether ether ketone

(PEEK). The PEEK piston tips are used in order to prevent any possible polymer melt
leakage flow between the piston tips and the barrel due to very low shear viscosity of the melt
blown samples. Furthermore, it was found necessary to use polytetrafluoroethylene tape to
prevent polymer melt leakage flow between the die holder and capillary rheometer barrel as it
is shown in Figure 2.
The measurements were performed in a constant piston speed mode at the shear rate range
of (30-640000) s-1 and 230 oC. In our measurements we used pressure transducers (Dynisco,
USA) in ranges of (10000) PSI (68.9476 MPa), (1500) PSI (10.3421 MPa), (500) PSI (3.4473
MPa). To improve accuracy of measured data at low shear rates range the highly sensitive
pressure transducer (250) PSI (1.7237 MPa) calibrated to its resolution limit was used for
recording pressure at the entrance to the orifice capillary die. The compressed air based
device, CCS 20 from AMV Messgeräte GmbH, was used to calibrate this pressure
transducers by using 69 calibration points.
For high strain rate rheometry at 190, 210 and 230 oC, a high accuracy Fanuc Roboshot S-
2000i electric high-speed injection molding machine was used, with screw diameter 22 mm
and a maximum barrel pressure rating of 240 MPa. The machine was operated in air-shot
mode using an instrumented rheometric capillary die nozzle (see Figure 3). Melt pressure was
measured at the capillary die entrance at a frequency of 100 Hz using a Kistler 4021A
pressure transducer. Injection screw position and velocity were also monitored at the same
frequency. Polymer was injected over a velocity range of 2.6 mm/s to 220 mm/s firstly
through a capillary die of 8 mm length and diameter 0.5 mm, and then tests were repeated
with an orifice die of the same diameter enabling Bagley and Rabinowitsch corrections.
Polymer was plasticized in the screw of the molding machine at a screw rotation speed of
2.83 revolutions per second with the back pressure of 0.1 MPa. Injection was initiated
following a dwell time of 30 s. Process data were collected using a LabView SC2345 data

acquisition unit triggered by a 24 V signal from the injection molding machine at the start of
injection. More details about this instrument and its accuracy are provided in [17].
SHEAR VISCOSITY MODELS
In this work, the following simple shear viscosity models with capability to describe the
primary and the secondary Newtonian plateau via η0 and η∞ parameter, respectively, were
utilized.
4-parametric Cross model [23]
a
1
0 (1)
where η0, η∞, λ and a are model parameters.
4-parametric Carreau model [24]
n2
0
1
(2)
where η0, η∞, λ and n are model parameters.
4-parametric Generalized Quemada model [25, 26]
a
ac
a
t
1
1
0 1
111
(3)
where η0, η∞, a and tc are model parameters.
5-parametric Carreau-Yasuda model [27]
a
na
1
0
1
(4)
where η0, η∞, λ, a and n are model parameters.
Suggested 5-parametric Modified Quemada
1
1
1
1
0 1
111
n
ac
n
t
(5)
where η0, η∞, a, n and tc are model parameters.
Suggested 5-parametric Modified Carreau model
ff
1 (6)
110
0
a
tanh
tanhf
(7)
where is given by Eq.2, and η0, η∞, λ, a and n are model parameters.
It is important to note that in all above equations represents the shear rate and Eqs. 6-7 can
be used to modify any viscosity function defined via .
RESULTS AND DISCUSSION
In order to keep the relationship between the measured rheological data and molecular
structure clear, MWDs and basic molecular weight averages were measured by high
temperature gel permeation chromatography for PP extrudates processed (i.e. rheologically
evaluated) at high shear rates (see Figure 4 and Table 2). Processed samples exposed to a

residence time at the processing temperature for about 1 hour were also used for low as well
as medium shear rate measurements.
Measured shear viscosity data plotted as a function of shear rate at 230oC are provided in
Figure 5 for all melt blown polymer samples. The ARES 2000 torque transducer 2K FRTN1
with a 2μNm low resolution limit allowed measurements of no scattered data only above
about 10 1/s. Pressure measurements at very high shear rates, performed on the injection
molding machine, were repeated at each given velocity three times, averaged, and then the
pressure transducer was calibrated by the help of an additional measurement at the reference
injection velocity. This procedure was repeated for all utilized injection velocities and both
dies. Gross errors in pressure measurements caused by unwanted recalibration of pressure
transducers were excluded from the analysis. Low strain rate primary as well as high strain
rate secondary Newtonian plateaus can clearly be identified (summarization is provided in
Table 3). Standard deviations for each viscosity point at the secondary Newtonian plateau
were found to be typically 0.004, 0.006 and 0.007 Pa.s for 76k, 64k and 56k samples,
respectively, which indicates very good reproducibility of performed viscosity measurements.
Interestingly, the secondary Newtonian plateau starts at a shear rate of approximately 6102
1/s and it is well developed up to 6107 1/s with no additional second shear thinning region.
The fact that there is no additional second shear thinning region indicates no chain scission
occurs with the given melt blown PPs at these rates. This finding is similar to the
experimental work of Takahashi et al. [16] who report that ‘… very little change in molecular
weight was observed for HDPE with a weak molecular interaction, even under high shear
rates of the second Newtonian region’. ‘In the high shear rate above 6107 s-1, where the
second non-Newtonian region appears …, the molecular weight of HDPE seems to gradually
decrease’. On the other hand, the occurrence of very well developed secondary Newtonian
plateau for PP at 230oC between 6102 1/s and 6107 1/s is in good correspondence with the

comparable experimental work for conventional low melt flow index polypropylenes [16, 18,
19] obtained at the same temperature, i.e. at the 230 oC. In more detail, Takahashi et al. [16],
utilizing a hydraulically powered capillary rheometer for polypropylene having MFI = 5.8
g/10min (PP K1016 from Chisso), reported well developed secondary Newtonian plateaus at
shear rates of about 61081 . and 6106 1/s. Similar secondary Newtonian plateaus were
reported for a polypropylene with a MFI of 12 g/10min (PP 3120MN1 from Appryl) by
Haddout and Villoutreix [18] and Benhadou et al. [19], between 61031 . 1/s and 6108 1/s
utilizing an instrumented injection molding machine equipped with a cylindrical instrumented
nozzle with variable diameter. This suggests the onset of a secondary Newtonian region is
insensitive (or weakly sensitive) to the melt flow index (i.e. on the molecular weight) of
polypropylenes at a given temperature. On the other hand, the viscosity at the secondary
Newtonian plateau, , reported in this work for low molecular weight PPs is almost one
order of magnitude lower in comparison with conventional high molecular weight PPs
reported in [16, 18, 19] at the same temperature 230 oC. This can be understood by
considering a lower friction between highly oriented macromolecules. At very high shear
rates, where entanglements between the chains do not longer exist, intermolecular resistance
is much reduced for lower molecular weight PPs in comparison with high molecular weight
PPs.
Reynolds number, defined below, was used to determine the character of the flow at the
highest shear rate range where a secondary Newtonian plateau occurs. The results of the three
tested PP samples are summarized in Table 4.
vDRe (8)
where ρ is the melt density, v is average velocity, D is the capillary diameter and is the
melt viscosity at the secondary Newtonian plateau. Data in Table 4 shows Reynolds number

for the shear rates between 6102 and 6102.6 1/s varies between 195 and 835. We can
deduce that the flow is laminar.
Flow activation energy:
Measured values of 0 and at three applied temperatures (190, 210 and 230oC) allows
determination of flow activation energy at low (E0) as well as at high (E) shear rates via
Arrhenius plot depicted in Figure 6. E0 was found to be 56.558 kJ/mol for 76k, 56.520 kJ/mol
for 64k and 56.691 kJ/mol for 56k. These are practically identical for all tested polypropylene
melts (average value is 090.0590.56 kJ/mol). These values of E0 are in very good
agreement with values reported for low molecular weight melt blown isotactic
polypropylenes such as ExxonMobil Escorene PP3546G (E0 = 62 kJ/mol, MFI=1200 g/10
min at 230oC/2.16kg) or PP3505G (E0 = 46.8 kJ/mol, MFI=400 g/10 min at 230oC/2.16kg)
[13]. On the other hand, E was found to be much smaller, 23.395 kJ/mol for 76k, 26.916
kJ/mol for 64k and 25.301 kJ/mol for 56k (average value is 763.1204.25 kJ/mol). Relating
average values of E and E0 yields the following relationship:
044540 E.E (9)
In order to discuss the physical meaning of the significant change between E0 and E in
more detail let us compare E with flow activation energy of the PP like oligomer called
squalane (C30H62; 2,6,10,15,19,23-hexamethyltetracosane, see Figure 7) having molecular
weight equal to 442.8 g/mol. Viscosity data for squalane have recently been measured over a
wide range of temperatures (up to 200oC) and pressures (up to 200MPa) [28]. These data
(taken from Table 7 in [28]) together with Arrhenius equation were utilized here to determine
average flow activation energy of squalene, Esqualane= 633.1804.19 kJ/mol (see Figure 8).
Comparable values of Esqualane and E for isotactic PP strongly supports the conclusion that

polymer chains of our tested PPs become disentangled at the secondary Newtonian plateau
region. The significant change in the flow activation energy of the PPs can thus be attributed
to change from entangled to disentangled state of PP chains due to strong shear flow, at
which polymer chains become less close packed. This leads to a decrease in monomeric
friction coefficient and increased free volume due to coalescence of shaped/aligned i.e.
anisometric, free volume cavities. Such void shape spatial change increases the availability of
sufficiently large free volume cavities making the flow easier. More detailed discussion on
free volume concept of polymer viscosity is provided in [29]. As recognized by Fox and
Flory [30], increase in the free volume diminishes flow activation energy for disentangled
polymer melts by decreasing number average molecular weight below a critical molecular
weight, which is ~13800 g/mol for isotactic PP considering molecular weight between chain
entanglement points Me = 6900 g/mol [31] (see also [32]).
Effect of viscous dissipation and pressure:
At very high shear rates, there is simultaneous effect of viscous dissipation and
compressibility, both having significant effect on the polymer melt viscosity [17, 20].
Viscous dissipation is an irreversible transformation of mechanical energy (the work done
by the melt during the shear flow) into heat energy due to internal friction of adjacent
polymer chains. Considering the Arrhenius relationship between viscosity and temperature
[33, 34] as well as the temperature rise due to viscous dissipation, the shear viscosity at the
secondary Newtonian region , can be expressed as;
rTTR
E
r eTT
11
(10)
where, T is the actual experimental temperature including effect of viscous dissipation, Tr is
the reference temperature, R is the universal gas constant (8.314 J/K/mol) and E is the flow
activation energy at high shear rates.
Another factor influencing shear viscosity in the secondary Newtonian plateau region is
pressure. The Barus equation [35] handles the relationship between shear viscosity and
pressure and leads to the following expression for :
p
r epp (11)
where p is the experimentally measured average pressure (Δp/2 in this work), pr is the
reference (ambient) pressure and β is the pressure sensitivity coefficient.
The role of viscous dissipation and pressure for the experimental data reported in this
work (i.e. where Tr = 503.15 K and Δp is the long capillary pressure drop) can be evaluated
by combining Eqs. 10-11 leading to Eq. (12).
2
11 p
TTR
E
rrrep,Tp,T
(12)
The existence of a well-developed secondary Newtonian region for all three tested melts
suggests that the effect of viscous dissipation and pressure are mutually cancelled. In order to
test this hypothesis high shear rate experiments in the secondary Newtonian region were
followed via FEM simulations performed by solving mass, momentum and energy
conservation equations. A commercial software, Compuplast VEL 6.8, was used with Eq.12
as the constitutive equation and applying realistic boundary conditions (wall temperature was
imposed to 230oC instead of adiabatic, i.e. insulated wall). The pressure sensitivity coefficient
β was determined through matching calculated and measured pressure drop in given capillary
flow for all three materials. In particular, β was adjusted to make the increase in apparent
shear viscosity due to pressure equal the decrease in viscosity due to shear heating. Simulated
flow domain together with utilized structured triangular mesh is provided in Figure 9. The
flow was modeled as an axi-symmetric with the grid consisting of 8 300 triangle elements,
which was sufficient to accurately describe the flow field. In the flow simulation, the
following basic polypropylene melt characteristics at 230oC were used ρ=712.33 kg/m3 [36],
Cp=2705.16 J/kg/K [37], κ=0.2092 W/m/K [38]. The average pressure sensitivity parameter
β was calculated to be 920020 .. GPa-1 for the given material parameters and processing
conditions. This value is in excellent agreement with the pressure sensitivity coefficient
140321 .. GPa-1 reported in [39] for polypropylene melt supporting the considered
hypothesis.
It should be noted that β taken from the literature [39] was determined by
superposition (i.e. shear rate and pressure influencing viscosity were taken into account by a
single shift factor), which is shear-rate independent, thus providing a shear rate-independent
value of β. It has been shown in [40, 41, 42], that the pressure sensitivity parameter in the
power-law regime, * , can be lower than β according to following equation
n* (13)
where n is the power-law exponent. Thus, utilization of the shear rate-independent β for flow
modelling of the secondary Newtonian plateau regime, where n=1, can be considered
reasonable.
Finally, it has been found that thermal conductivity can increase with shear rate for
pseudoplastic polymer solutions. This is attributed to the altered structural state of the liquid
(the chains are more aligned) and molecular entanglements (formation of rotating units of
entangled clusters) [43]. However, more recently, it has been shown via positron annihilation
lifetime spectroscopy measurements that the thermal conductivity decreases with increased
free volume, which enhances phonon scattering (hence decreasing the thermal conductivity)
[44]. Thus, we consider the utilization of a constant thermal conductivity for the flow
modeling in the secondary Newtonian plateau (at which the free volume is increased
considerably due to chain disentanglement) as reasonable assuming that the effect of shear
rate and free volume on thermal conductivity is mutually cancelled in this flow regime.
Effect of weight average molecular weight on 0 and :
Zero shear viscosity, 0, and the secondary Newtonian viscosity, , are plotted as a
function of average molecular weight in log-log-scale in Figure 10. The following power-law
equations can be used to fit the experimental data.
622.317
0 1073.4 wM (14)
084.161019.1 wM
(15)
If the molecular weight of polymers exceeds the critical molecular weight Mc, which is
about 2-3 times molecular weight between chain entanglement points (i.e. eM 6900 g/mol
for isotactic PP [31]), the exponent is about 3.4-3.6, whereas bellow Mc it is about 1 [45, 46].
Wasserman and Graessley [45, 47, 48] reported the following relationship for linear isotactic
polypropylene:
60317
0 10325.
wM.s.Pa (190 oC) (16)
As it can be seen, parameters of Equation (16) agree well with the experimentally
determined relationship given by Eq.14, confirming the existence of entanglements between
the chains at very low shear rates. It also supports the validity of the zero shear viscosities
and average molecular weights reported in this work for the low molecular weight
polypropylenes. In the case of the secondary Newtonian viscosity, , the proportionality
constant is about 10 orders of magnitudes higher than in the case of zero shear rate viscosity
and the exponent on Mw is close to 1. According to Rouse-Bueche molecular theory [45, 49],
the viscosity of molten polymers with no entangled molecules is proportional to molecular
weight. This suggests there are no entanglements between the chains at the secondary
Newtonian region and the resistance against the flow is given here only by the friction
between the highly oriented macromolecular chains (depending predominantly on their size,
packing level and conformational state).

If Eqs.14-15 are combined the secondary Newtonian viscosity, , can be expressed via
the zero shear viscosity, 0, and weight average molecular weight, Mw, as follows:
538.2
w0
11 M102516.0
(17)
Additionally, it has been proved experimentally by Takahashi et.al. [16], there is no wall
slip at very high shear rates for PP at 230oC (i.e. for the same polymer and flow conditions
utilized in our work). In their experiments, the authors have used two kinds of the capillaries
with same L/D ratio (20) but different diameters (0.5 mm, 1 mm). Their findings support the
validity of high strain rate rheological measurements performed in this work as well as the
conclusion that the polymers chains are fully disentangled at high shear rates.
Rheological modeling:
In this section we investigate the fitting capabilities of conventional (Eqs. 1-4) as well as
modified (Eqs. 5-7) rheological models, suggested here for the first time, to describe
measured rheological data. Model parameters characterizing the primary and the secondary
Newtonian plateau (i.e. η0, and η∞) were fixed whereas the remaining parameters were varied
to minimize least squares between the experimental data and model predictions. Comparison
between the measured data and model fitting curves is provided in Figs. 11-13. Fitting errors
for each model and given polymer melt were evaluated via the Root Mean Squared Error
(RMSE) defined as
1
21
i
ii )ˆlog()log(RMSE (18)
where δ is the number of measured points, ηi and i represent measured and predicted
shear viscosity points at given shear rate (see Tables 5-7). All model parameters are
summarized in Tables 8-10.

Based on the Tables 5-7 and Figs. 11-13, the following conclusions can be formulated:
5-parametric viscosity models provide a closer fit to describing the measured data
than 4-parametric models, as expected.
The capability of utilized models to describe the measured data decreases in the
following order: Modified Quemada model, Modified Carreau model, Carreau-
Yasuda model, Cross model, Generalized Quemada model and Carreau model. Note
that the Total RMSE, provided in Table 11 for each model, represents the sum of
Root mean squared error determined for all three polypropylene samples (Total
RMSE).
Modified Quemada model and Cross models more accurately describe the measured
shear viscosity data from all utilized 5-parametric and 4-parametric models,
respectively.
One may consider under what circumstances are proposed modified 5 parameter models more
desirable than the conventional models? One of the key reasons for going to 5 parameters
models are their improved flexibility do describe experimental data, especially at the high
shear rate range. For example, the 4-parametric Cross model over predicts shear viscosity by
12% (average) - 26% (maximum deviation) at shear rates between 5102.1 1/s and
61073.6
1/s for given PPs at T=230oC. Consequently, when trying to predict the pressure drop in
capillary flows for the given materials and processing conditions utilizing the Cross model,
the error in the predicted pressure drop can reach 26%, which is unacceptable considering
that the experimental pressure drops can be in order of tens or hundreds MPa at such high
shear rates.

CONCLUSION
In this work, three linear melt blown isotactic polypropylenes, with weight average molecular
weights between 56250-75850 g/mol, have been characterized at 230 oC over a very wide
shear strain rate range (10 - 107 1/s) by using; rotational and twin bore capillary rheometer
equipped with a novel inert orifice die design as well as by an instrumented rheometric
nozzle on an injection molding machine. Flow activation energy at low (E0) and high (E)
shear rates was found to be 090.0590.56 kJ/mol and 763.1204.25 kJ/mol, respectively.
A primary Newtonian plateau, pseudoplastic region and well developed secondary
Newtonian plateau (occurring between 66 107102 1/s) were identified for all
polypropylene melts. Based on the estimated pressure sensitivity coefficient, β = 20.00 GPa-1,
which is typical value for polypropylene melts [39], it was deduced that the effect of viscous
dissipation and pressure is mutually cancelled, i.e. that the measured viscosity data can be
considered as the true material property within whole applied shear rate range. For the first
time, it has been revealed that the secondary Newtonian viscosity, , depends linearly on the
weight average molecular weight, Mw, in log-log scale as 084.1
61019.1 wM
. The
observed slope close to 1 between and Mw suggests that polymer chains in the melt are
disentangled at the secondary Newtonian plateau region. This conclusion is supported by the
experimental observation that the high shear rate flow activation energy E for given PP
melts is comparable with the flow activation energy of PP like oligomer (squalane, C30H62;
2,6,10,15,19,23-hexamethyltetracosane).
The measured flow curves were fitted by six different viscosity models. Two
modified models, namely a modified Carreau and a Quemada model were developed. It has
been found the shear flow data could be more accurately described over the wide strain rate
range by the newly suggested models. The accuracy of curve fitting decreases in the

following order: Modified Quemada model, Modified Carreau model, Carreau-Yasuda
model, Cross model, Generalized Quemada model and Carreau model.
Acknowledgments
The authors wish to acknowledge Grant Agency of the Czech Republic (Grant
registration No. 16-05886S, Title: Investigation the effect of polymer melt shear and
elongational rheology on production stability of meltblown nanofibers and films) for the
financial support. The author also wishes to acknowledge Joachim Fiebig (Borealis
Polyolefine) for donation of the polypropylene melt blown samples and help with the GPC
measurements and analysis.

REFFERENCES
1. C.J. Ellison, A. Phatak, D.W. Giles, C.W. Macosko, F.S. Bates, Melt blown nanofibers:
Fiber diameter distributions and onset of fiber breakup, Polymer 48 (2007) 3306-3316.
2. R. Nayak, I.L. Kyratzis, Y.B. Truong, R. Padhye, L. Arnold, G. Peeters, M. O’Shea, L.
Nichols, Fabrication and characterization of polypropylene nanofibres by meltblowing
process using different fluids, J. Mat. Sci. 48 (2013) 273-281.
3. F. Zuo, D.H. Tan, Z. Wang, S. Jeung, C.W. Macosko, F.S. Bates, Nanofibers from melt
blown fiber-in-fiber polymer blends, ACS Mac. Letters 2 (2013) 301-305.
4. G.F. Ward, Meltblown nanofibres for nonwoven filtration applications, Filtr. and Separ.
38 (2001) 42-43.
5. J.E. Brang, A. Wilkie, J.S. Haggard, Method and apparatus for production of meltblown
nanofibers, US patent US20080023888 A1 (2008).
6. R. Nayak, R. Padhye, I.L. Kyratzis, Y.B. Truong, L. Arnold, Recent advances in
nanofibre fabrication techniques, Tex. Res. J. 82 (2012) 129-147.
7. R.A. Chapman, Applications of nonwovens in technical textiles, Elsevier, 2010.
8. A. Wilkie, J. Haggard, Nanofiber melt blown nonwovens-A new low, Inter. Fib. J. 22
(2007) 48-49.
9. J. Drabek, M. Zatloukal, Rheological evaluation of melt blown polymer melt, AIP Con.
Pro. 1526 (2013) 237-247.
10. A. Eckstein, C. Friedrich, A. Lobbrecht, R. Spitz, Comparison of the viscoelastic
properties of syndio – and isotactic polypropylenes, Acta Polymerica 48 (1997) 41-46.
11. M. Gahleitner, Melt rheology of polyolefins, Prog. in Pol. Sci. (Oxford) 26 (2001) 895-
944.

12. J.H. Lin, Y.J. Pan, C.F. Liu, C.L. Huang, C.T. Hsieh, C.K. Chen, Z.I. Lin, C.W. Lou,
Preparation and compatibility evaluation of polypropylene/high density polyethylene
polyblends, Materials 8 (2015) 8850-8859.
13. Y. Wang, Application of Polymer Rheology in Melt Blowing Process and Online
Rheological Sensor, University of Tennessee-Knoxville, Ph.D. Thesis (2004).
14. R. Nayak, Fabrication and characterization of polypropylene nanofibres by melt
electrospinning and meltblowing. RMIT University, Ph.D. Thesis (2012)
15. D.H. Tan, C. Zhou, C.J. Ellison, S. Kumar, C.W. Macosko, F.S. Bates, Meltblown fibers:
Influence of viscosity and elasticity on diameter distribution, J. Non-New. Flu. Mech.
165 (2010) 892-900.
16. H. Takahashi, T. Matsuoka, T. Kurauchi, Rheology of polymer melts in high shear rate,
J. App. Pol. Sci. 30 (1985) 4669-4684.
17. A.L. Kelly, A.T. Gough, B.R. Whiteside, P.D. Coates, High shear strain rate rheometry
of polymer melts, J. App. Pol. Sci. 114 (2009) 864-873.
18. A. Haddout, G. Villoutreix, Polymer melt rheology at high shear rates, Int. Pol. Proc. 15
(2000) 291-296.
19. M. Benhadou, A. Haddout, G. Villoutreix, Injection of polypropylene reinforced with
short glass fibers: Rheological behavior, J. Reinf. Plast. Comp. 26 (2007) 1357-1366.
20. M. Rides, A.L. Kelly, C.R.G. Allen, An investigation of high rate capillary extrusion
rheometry of thermoplastics, Pol. Testing 30 (2011) 916-924.
21. M. Zatloukal, J. Musil, Analysis of entrance pressure drop techniques for extensional
viscosity determination, Pol. Testing 28 (2009) 843-853.
22. M. Zatloukal, Measurements and modeling of temperature-strain rate dependent uniaxial
and planar extensional viscosities for branched LDPE polymer melt, Polymer 104
(2016) 258-267.
23. M.M. Cross, Rheology of non-Newtonian fluids: A new flow equation for pseudoplastic
systems, J. Coll. Sci. 20 (1965) 417-437.
24. P.J. Carreau, Rheological equations from molecular network theories, Trans. Soc. Rheol.
16 (1972) 99-127.
25. D. Quemada, P. Flaud, P.H. Jezequel, Rheological properties and flow of concentrated
disperse media I – modelling of steady and unsteady behavior, Chem. Eng. Commun. 32
(1985) 61-83.
26. T. Fang, H. Zhang, T.T. Hsieh, C. Tiu, Rheological behavior of cocoa dispersion with
cocoa butter replacers, J. Text. Stud. 28 (1997) 11-26.
27. K. Yasuda, R.C. Armstrong, R.E. Cohen, Shear flow properties of concentrated solutions
of linear and star branched polystyrenes, Rheo. Acta 20 (1981) 163-178.
28. K.A.G. Schmidt, D. Pagnutti, M.D. Curran, A. Singh, J.P.M. Trusler, G.C. Maitland, M.
McBride-Wright, New experimental data and reference models for the viscosity and
density of squalane, J. of Chem. And Eng. Data 60 (2015) 137-150.
29. L.A. Utracki, T. Sedlacek, Free volume dependence of polymer viscosity, Rheo. Acta 46
(2007) 479-494.
30. T.G. Fox Jr., P.J. Flory, Second-order temperature and related properties of polystyrene.
I. Influence of molecular weight, J. of App. Physics 21 (1950) 581-591.
31. A. Eckstein, J. Suhm, C. Friedrich, R.-D. Maier, J. Sassmannshausen, M. Bochmann, R.
Mülhaupt, Determination of plateau moduli and entanglement molecular weights of
isotactic, syndiotactic, and atactic polypropylenes synthesized with metallocene
catalysts, Macromolecules 31 (1998) 1335-1340.
32. J.D. Ferry, Viscoelastic properties of polymers, 3rd edition, John Wiley & Sons, 1980.
33. J. M. Dealy, K.F. Wissbrun, Melt Rheology and Its Role in Plastics Processing,
Chapman & Hall, 1995.

34. R.B. Bird, R.C. Armstrong, O. Hassager, Dynamics of Polymeric Liquids, Volume 1:
Fluid Mechanics, 2nd Edition, Wiley, 1987.
35. C. Barus, Isothermals, isopiestics and isometrics relative to viscosity, Am. J. Sci. 45
(1893) 87-96.
36. Y.G. Li, C.B. Park, Materials and Interfaces: Effects of branching on the pressure-
volume-temperature behaviors of PP/CO2 solutions, Ind. Eng. Chem. Res. 48 (2009)
6633-6640.
37. D.W. Van Krevelen, K. te Nijenhuis, Properties of Polymers, Their Correlation with
Chemical Structure; their Numerical Estimation and Prediction from Additive Group
Contributions, 4th Edition, Elsevier Science, 2009.
38. T.R. Fuller, A.L. Fricker, Thermal conductivity of polymer melts, J. App. Pol. Sci. 15
(1971) 1729-1736.
39. T. Sedlacek, M. Zatloukal, P. Filip, A. Boldizar, P. Saha, On the effect of pressure on the
shear and elongational viscosities of polymer melts, Pol. Eng. Sci. 44 (2004) 1328-1337.
40. D.M. Binding, M.A. Couch, K. Walters, The pressure dependence of the shear and
elongational properties of polymer melts, J. of Non-New. Fl. Mech. 79 (1998) 137-155.
41. M.A. Couch, D.M. Binding, High pressure capillary rheometry of polymeric fluids,
Polymer 41 (2000) 6323-6334.
42. R. Cardinaels, P. Van Puyvelde, P. Moldenaers, Evaluation and comparison of routes to
obtain pressure coefficients from high-pressure capillary rheometry data, Rheo. Acta 46
(2007) 495-505.
43. D.R. Lee, Shear rate dependence of thermal conductivity and its effect on heat transfer in
a non-Newtonian flow system, Kor. J. of Chem. Eng. 15 (1998) 252-261.
44. G. Xue, J. Zhong, S. Gao, B. Wang, Correlation between the free volume and thermal
conductivity of porous poly(vinyl alcohol)/reduced graphene oxide composites studied
by positron spectroscopy, Carbon 96 (2016) 871-878.
45. J.M. Dealy, R.G. Larson, Structure and rheology of molten polymers: from structure to
flow behavior and back again, Hanser Publishers, 2006.
46. D. Auhl, F.J. Stadler, H. Münstedt, Comparison of molecular structure and rheological
properties of electron-beam- and gamma-irradiated polypropylene, Macromolecules 45
(2012) 2057-2065.
47. S.H. Wasserman, W.W. Graessley, Prediction of linear viscoelastic response for
entangled polyolefin melts from molecular weight distribution, Pol. Eng. Sci. 36 (1996)
852-861.
48. G.R. Zeichner, P.D. Patel, A comprehensive evaluation of polypropylene melt rheology,
Proc. 2nd world congress of chem. Eng. 6.9 Montreal, 1981.
49. F. Bueche, Viscosity, self-diffusion, and allied effects in solid polymers, J. Chem. Phys.
20 (1952) 1959-1964.

TABLE 1. Basic characteristics of utilized melt blown polypropylenes (pellets).
Sample
Name
Melt flow index
at 2.16 kg and
230°C
(g.10min-1)
DSC peak
melting point
(°C)
Mn
(g.mol-1)
Mw
(g.mol-1)
Mz
(g.mol-1)
Mz+1
(g.mol-1)
Mw/Mn
(-)
HL504FB 450 161-165 20100 112500 284500 510500 5.60
HL508FB 800 156-160 17050 104500 282000 533000 6.13
HL512FB 1200 156-160 16950 90950 220500 384500 5.37
TABLE 2. Molecular characteristics of utilized melt blown polypropylene melts (processed
samples, i.e. high shear rate extrudates).
Sample
Name
Mn
(g.mol-1)
Mw
(g.mol-1)
Mz
(g.mol-1)
Mz+1
(g.mol-1)
Mw/Mn
(-)
HL504FB (76k) 17200 75850 165500 278000 4.41
HL508FB (64k) 14650 63750 138000 235500 4.35
HL512FB (56k) 14250 56250 114500 187500 3.95
TABLE 3. Summary of experimentally determined values for zero shear viscosity, 0, and
secondary Newtonian viscosity, , at 230 oC.
Sample
name
η0
(Pa.s)
Standard deviation for η0
(Pa.s) η
(Pa.s)
Standard deviation for η
(Pa.s)
76k 22.80 1.149 0.229 0.0025
64k 11.27 0.671 0.199 0.0018
56k 7.79 0.312 0.165 0.0005
TABLE 4. Calculated Reynolds numbers at the secondary Newtonian region for all three
tested polymer melts, T= 230 oC.
Shear rate
(1/s)
Re, 56k
(-)
Re, 64k
(-)
Re, 76k
(-)
2 010 342 271 225 195
3 184 333 429 357 309
5 049 088 681 566 490
6 195 200 835 694 601

TABLE 5. Fitting error (Root mean squared error – RMSE) for each utilized model sorted
from the best to the worst for linear PP Borflow 76k, T=230 °C.
Model name RMSE
Modified Quemada model 0.018276236
Modified Carreau model 0.029749727
Carreau-Yasuda model 0.040775109
Cross model 0.047118675
Generalized Quemada model 0.049006845
Carreau model 0.065738895
TABLE 6. Fitting error (Root mean squared error – RMSE) for each utilized model sorted
from the best to the worst for linear PP Borflow 64k, T=230 °C.
Model name RMSE
Modified Quemada model 0.025431753
Modified Carreau model 0.027975200
Carreau-Yasuda model 0.035497268
Cross model 0.047207561
Generalized Quemada model 0.048729021
Carreau model 0.067596955
TABLE 7. Fitting error (Root mean squared error – RMSE) for each utilized model sorted
from the best to the worst for linear PP Borflow 56k, T=230 °C.
Model name RMSE
Modified Quemada model 0.022267806
Modified Carreau model 0.028009255
Carreau-Yasuda model 0.038134394
Cross model 0.047852717
Generalized Quemada model 0.049003044
Carreau model 0.066374374
TABLE 8. Fitting parameters for each utilized model for 76k, T=230 °C.
Model name η0
(Pa.s)
λ
(s)
a
(-)
n
(-)
η∞
(Pa.s)
tc
(s)
Cross model 22.80 0.000356 0.916622 - 0.229 -
Carreau model 22.80 0.000548 - 0.434384 0.229 -
Carreau-Yasuda model 22.80 0.000222 0.714663 1×10-12 0.229 -
Generalized Quemada model 22.80 - 1.085421 - 0.229 0.00000297400
Modified Quemada model 22.80 - 0.192343 0.888196 0.229 0.00148998839
Modified Carreau model 22.80 0.002294 6.141027 0.238632 0.229 -

TABLE 9. Fitting parameters for each utilized model for 64k, T=230 °C.
Model name η0
(Pa.s)
λ
(s)
a
(-)
n
(-)
η∞
(Pa.s)
tc
(s)
Cross model 11.27 0.000203 0.889544 - 0.199 -
Carreau model 11.27 0.000282 - 0.442027 0.199 -
Carreau-Yasuda model 11.27 0.000101 0.644103 1×10-12 0.199 -
Generalized Quemada model 11.27 - 1.141995 - 0.199 0.00000278757
Modified Quemada model 11.27 - 0.152248 0.920448 0.199 0.00098232952
Modified Carreau model 11.27 0.003327 15.29982 0.154333 0.199 -
TABLE 10. Fitting parameters for each utilized model for 56k, T=230 °C.
Model name η0
(Pa.s)
λ
(s)
a
(-)
n
(-)
η∞
(Pa.s)
tc
(s)
Cross model 7.79 0.000128 0.909926 - 0.165 -
Carreau model 7.79 0.000191 - 0.442092 0.165 -
Carreau-Yasuda model 7.79 0.000070 0.666422 1×10-12 0.165 -
Generalized Quemada model 7.79 - 1.100310 - 0.165 0.00000228669
Modified Quemada model 7.79 - 0.078774 0.959896 0.165 0.00065601827
Modified Carreau model 7.79 0.006015 60.95602 0.092772 0.165 -
TABLE 11. Sum of fitting errors (Root mean squared error – RMSE) for each utilized
model sorted from the best to the worst for all three linear PP Borflow samples, T=230 °C.
Model name Total RMSE
Modified Quemada model 0.065975795
Modified Carreau model 0.085734182
Carreau-Yasuda model 0.114406771
Cross model 0.142178953
Generalized Quemada model 0.146738910
Carreau model 0.199710224
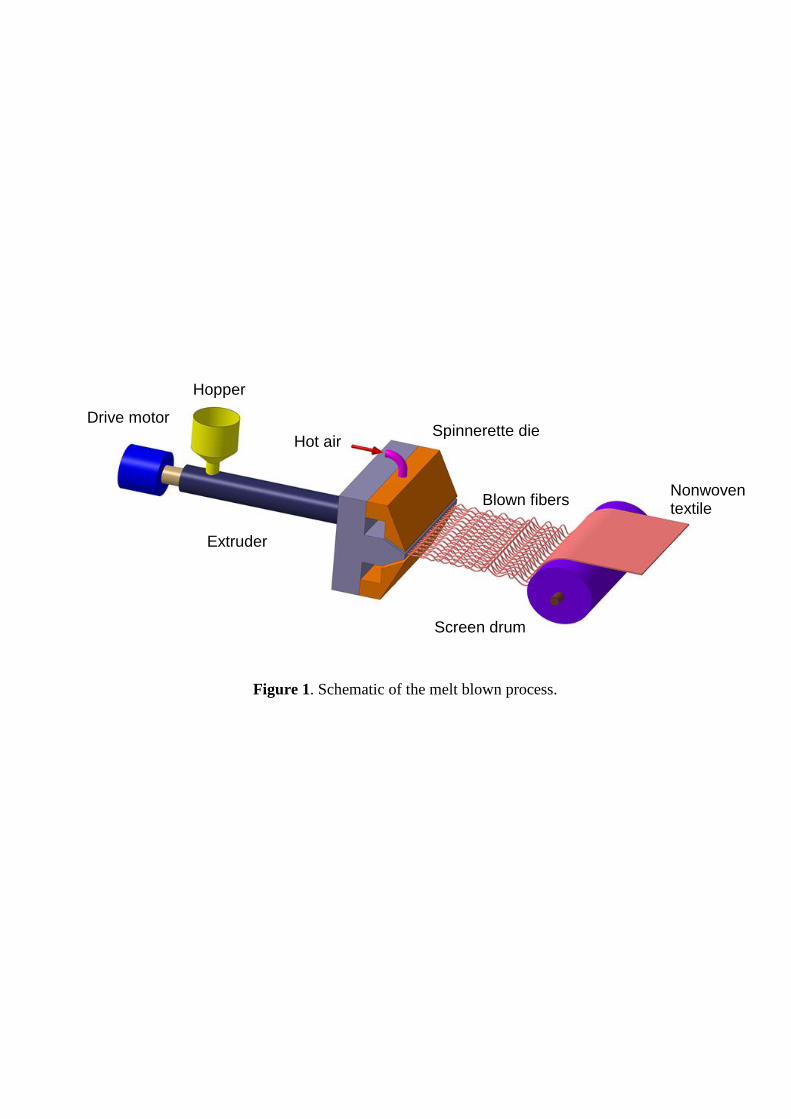
Figure 1. Schematic of the melt blown process.
Drive motor
Extruder
Hopper
Hot air Spinnerette die
Blown fibers
Screen drum
Nonwoven textile

Figure 2. Visualization of die holder and bottom view of the die holder with the capillary die
connected to barrel of the capillary during rheological measurements without (2a-2b) and
with the polytetrafluoroethylene tape (2c-2d).
2a) 2b)
2c) 2d)

Figure 3. Schematic cross-section of assembled parts for the instrumented capillary nozzle
fitted to the injection molding machine.
Nozzle adapter
Heated belt
Pressure transducer
Orifice capillary die Washer Holder
Temperature
sensor

Figure 4. Molecular weight distribution (MWD) curves for all investigated linear isotactic
melt blown polypropylenes (processed samples, i.e. high shear rate extrudates).

Figure 5. Deformation rate dependent shear viscosity data for linear isotactic PP Borflow 76k
(top), 64k (middle) and 56k (bottom) samples at 230 oC.

Figure 6. Arrhenius plot for 76k, 64k and 56k polypropylene melts considering 0 (top) and
(bottom).
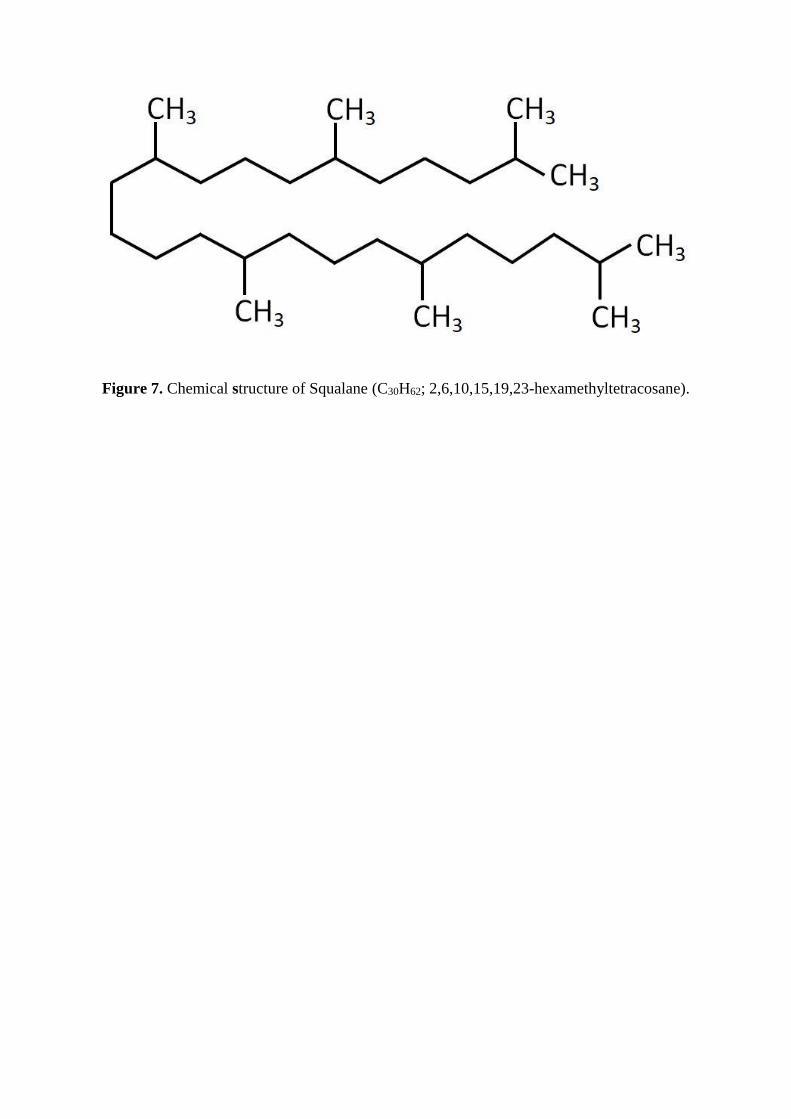
Figure 7. Chemical structure of Squalane (C30H62; 2,6,10,15,19,23-hexamethyltetracosane).

Figure 8. Arrhenius plot for Squalane (experimental data are taken from [28]).

Figure 9. Geometrical sketch of simulated capillary die (left) and detail view of utilized
triangular mesh at the entrance region (right).

Figure 10. Effect of weight average molecular weight, Mw, on zero shear viscosity, 0 (top),
and secondary Newtonian viscosity, (bottom) for polypropylene melts at 230 oC.

Figure 11. Comparison between experimentally determined shear viscosity data and model
predictions for linear isotactic PP Borflow 76k sample at 230 oC and fixed 0 and
parameters.

Figure 12. Comparison between experimentally determined shear viscosity data and model
predictions for linear isotactic PP Borflow 64k sample at 230 oC and fixed 0 and
parameters.

Figure 13. Comparison between experimentally determined shear viscosity data and model
predictions for linear isotactic PP Borflow 56k sample at 230 oC and fixed 0 and
parameters.