effect of neutral earthing in lv distribution system
TRANSCRIPT

EFFECT OF NEUTRAL EARTHING IN LV DISTRIBUTION
SYSTEM
Busi Cynthia Green
Student number 991241049
In partial fulfillment of the MSc Eng. Electrical Engineering Degree
College of Agriculture, Engineering and Science
University of KwaZulu-Natal
22 February 2019
Academic Supervisor: Dr AK Saha Student Signature: ………………
Supervisor’s Signature: ………………
EXAMINER’S COPY

i
COLLEGE OF AGRICULTURE, ENGINEERING AND SCIENCE
DECLARATION 1 - PLAGIARISM
I, Busi Green (991241049)…………………………….………………………., declare that
1. The research reported in this thesis, except where otherwise indicated, and is my original research.
2. This thesis has not been submitted for any degree or examination at any other university.
3. This thesis does not contain other persons’ data, pictures, graphs or other information, unless
specifically acknowledged as being sourced from other persons.
4. This thesis does not contain other persons' writing, unless specifically acknowledged as being sourced
from other researchers. Where other written sources have been quoted, then:
a. Their words have been re-written but the general information attributed to them has been referenced
b. Where their exact words have been used, then their writing has been placed in italics and inside
quotation marks, and referenced.
5. This thesis does not contain text, graphics or tables copied and pasted from the Internet, unless
specifically acknowledged, and the source being detailed in the thesis and in the References sections.
Signed by Student:
…………………………………………………
Form EX1-5

ii
Acknowledgements
Glory be to the almighty for all the strength and courage he gave me throughout the execution of this work.
Special thanks go to my family especially my daughter Musa Green for all the love and the support they
offered me throughout this period.
I am really grateful to the Eskom Management for providing me with all the resources for conducting this
research, especially my direct line manager Mr. Phera Rakeketsi for all the support offered throughout this
research.
A special acknowledgement to the following colleagues:
Dr Hendri Geldenhuys
Andreas Beutel
Vonani Mathebula
Thabo Mazibuko
Thabo Modisane
Gcina Dlamini
Zesizwe Ncane
MJ Mothapo
Matankiso Mohlokoana
Riyaz Gangat
Abel Ernest
Johan Beukes
Jacques Wattel
Males Tomlinson
Phetheni Khumalo
Elizabeth Thekkekottaram
Last but not least I would like to thank my Academic Supervisor Dr AK Saha who took me through this
journey in the most courageous and diligent manner.

iii
Abstract
In any power system, a neutral point is a common point between the three single phase voltages used to close
the circuit and it is a current return path to the transformer point. This neutral point may or may not be
accessible, distributed and earthed. During the investigation, it was learnt that an unearthed system leads to
dangerous touch and step voltages and unstable voltages in the interconnected installation. However, the
values of the fault current touch voltage and overvoltage and the extent of damage is associated to the kind
of neutral earthing employed in that particular network. The earthing system in low voltage is more
concerned about the combination of earthing at the source side and also at the installation
(consumer/customer’ premises). This research focuses on the detailed comparative study of the following
neutral earthing in low voltage power systems namely: earthing where the source and load are earthed
independently, earthing where the supply is not earthed or is earthed through the impedance and the load is
independently earthed), earthing that is further broken down into earthing where the source is earthed and
the neutral is combined with earth to form protective earth neutral conductor and earthing that starts from
the source (such as a utility company) with a combined protective earth neutral conductor until the customer
installation service entry point, e.g. a residential unit, is reached, where the neutral and earth conductors are
split throughout. The research was conducted by a simulation method of single phase and three phases to
ground fault whereupon the behavior of various earthing methods was studied. The focus was on following
aspects including but not limited to the detailed study of the various types of neutral earthing, the study of
the unearthed system comparative to study between the neutral earthing systems. The study went about
simulating the behavior of the unearthed system as a base case and the other other neutral earthing system in
order to determine the effect of earthing the neutral. It was learnt that the selection criteria for the best neutral
earthing method depends on the governing requirements, the supply continuity, operating condition and the
typical system loading. The main hazard that was identified in the study was that of the challenges associated
with the loss or detection of the neutral, protective earth (PE) and protective earth neutral (PEN) and these
pose a serious risk on all these low voltage networks in a form of damage to equipment and endangering the
lives of the people.

iv
List of Abbreviations
IEC –International Electrotechnical Commission
IMD- Insulation Monitoring Device
IT –Isolate Terre
LV-Low Voltage
MV –Medium Voltage
PE –Protective Earth
PEN – Protective Earth Neutral
RCD –Residual Current Device
SANS- South African National Standard
TN-Terre Neutral
TN-C –Terre-Neutral-Combined
TT –Terre Terre
TN-C-S- Terre Neutral-Combined Separate

v
Table of Contents
Abstract ..................................................................................................................................... iii
List of Abbreviations ................................................................................................................ iv
List of Figures .......................................................................................................................... vii
List of Tables ............................................................................................................................. x
Chapter 1 : Introduction ............................................................................................................. 1
1.1. Introduction ............................................................................................................................. 1
1.2. Research motivation ................................................................................................................ 3
1.3. Hypothesis............................................................................................................................... 3
1.4. Research problem statement ................................................................................................... 3
1.5. Research questions .................................................................................................................. 3
1.6. Research objectives ................................................................................................................. 4
1.7. Outline of chapters .................................................................................................................. 4
Chapter 2 : Literature Review .................................................................................................... 5
2.1. Introduction ............................................................................................................................. 5
2.2. Earthing system designs and characteristics ........................................................................... 5
2.2.1 IT system (Unearthed source neutral) ............................................................................. 7
2.2.2 TT system ........................................................................................................................ 8
2.2.3 TN system ....................................................................................................................... 9
2.3. Fault behaviour of the earthing systems................................................................................ 10
2.3.1 Fault behaviour of the IT system (First fault) ............................................................... 10
2.3.2 Fault behaviour of the IT system (Second fault) ........................................................... 11
2.3.3 Fault Behavior of the TT system ................................................................................... 12
2.3.4 Fault Behavior of the TN system .................................................................................. 12
2.4. Power System Protection Aspects ......................................................................................... 13
2.5. Comparison of the Earthing Methods ................................................................................... 15
2.6. Chapter Conclusion ............................................................................................................... 20
Chapter 3 : Research Methodology .......................................................................................... 21

vi
3.1 Introduction .............................................................................................................................. 21
3.2 Power System Model ............................................................................................................... 21
3.3 Simulink Model ....................................................................................................................... 23
3.2.1 IT Simulink Model ........................................................................................................ 24
3.2.2 TT Simulink Model ....................................................................................................... 24
3.2.3 TN-C Simulink Model .................................................................................................. 25
3.4 Simulation Scenarios ............................................................................................................... 25
3.5 Chapter Conclusion .................................................................................................................. 26
Chapter 4 : Preliminary Research Results and Analysis .......................................................... 27
4.1 Introduction .............................................................................................................................. 27
4.2 No load Condition .................................................................................................................... 27
4.3 Single Phase Normal Balanced Load Condition ...................................................................... 29
4.4 Single Phase Unbalanced Load Condition ............................................................................... 31
4.5 Three Phase Normal Load Condition ...................................................................................... 34
4.6 Chapter Conclusion .................................................................................................................. 38
Chapter 5 : Main Simulation Results and Analysis ................................................................. 39
5.1 Introduction .............................................................................................................................. 39
5.2 Behaviour of the unearthed system (IT System) ...................................................................... 40
5.2.1 Balanced single phase system results ............................................................................ 40
5.2.2 Unbalanced single phase system ................................................................................... 49
5.2.3 Three phase system ....................................................................................................... 52
5.3 Comparison of the earthing systems ........................................................................................ 60
5.3.1 Balanced Single Phase Results (Customer Fault) ......................................................... 60
5.3.2 Balanced single phase results (Utility fault) ................................................................. 62
5.3.3 Balanced single phase loss of neutral (Customer Fault) ............................................... 63
5.3.4 Balanced single phase loss of neutral (Utility fault) ..................................................... 65
5.3.5 Unbalanced Single Phase Results (Customer Fault) ..................................................... 66
5.3.6 Unbalanced single phase results (Utility fault) ............................................................. 67
5.3.7 Unbalanced single phase loss of neutral (Customer fault) ............................................ 68
5.3.8 Unbalanced single phase loss of neutral (Utility fault) ................................................ 69
5.3.9 Three phase results (Customer fault) ............................................................................ 70
5.3.10 Three phase results (Utility fault) ................................................................................. 72

vii
5.3.11 Three phase loss of neutral (Customer fault) ................................................................ 74
5.3.12 Three phase loss of neutral (Utility fault) ..................................................................... 75
5.4 Advantages and disadvantages of the earthing systems ........................................................... 77
5.5 Chapter Conclusion .................................................................................................................. 78
Chapter 6 : Conclusion and Recommendation ......................................................................... 79
6.1 Conclusion ............................................................................................................................... 79
6.2 Recommendations .................................................................................................................... 81
References ................................................................................................................................ 82
List of Figures
Figure 2-1: IT earthing system [2] .......................................................................................................... 7
Figure 2-2: TT earthing system [2] ......................................................................................................... 8
Figure 2-3: TN Earthing System [2] ....................................................................................................... 9
Figure 2-4: First insulation fault current in the IT system (a) [6] .......................................................... 11
Figure 2-5: Second fault insulation fault current in the IT system (b) [6] ............................................ 12
Figure 2-6: Fault behavior in the TT earthing system [4] ..................................................................... 12
Figure 2-7: Fault behavior in the TN-S earthing system [4] ................................................................. 13
Figure 3-1: Typical 400 V distribution system single line diagram ...................................................... 22
Figure 3-2: Simulink simulation model block diagram ........................................................................ 23
Figure 4-1: Transformer primary voltage during no-load condition ..................................................... 27
Figure 4-2: Transformer primary current during no-load condition ..................................................... 28
Figure 4-3: Transformer secondary voltage during no-load condition ................................................. 28
Figure 4-4: Transformer secondary current during no-load condition .................................................. 29
Figure 4-5: Transformer primary voltage during normal load condition .............................................. 29
Figure 4-6: Transformer primary current during normal load condition .............................................. 30
Figure 4-7: Transformer secondary voltage during normal load condition .......................................... 30
Figure 4-8: Transformer secondary current during normal load condition ........................................... 31
Figure 4-9: Current drawn by each load during normal load condition ................................................ 31
Figure 4-10: Transformer primary voltage during the un-balanced condition ...................................... 32
Figure 4-11: Transformer primary current during the un-balanced condition ...................................... 32
Figure 4-12: Transformer secondary voltage during the un-balanced condition ................................. 33
Figure 4-13: Transformer secondary current during the un-balanced condition ................................. 33
Figure 4-14: Current drawn by each load during an un-balanced load condition ................................ 33
Figure 4-15: Transformer primary voltage during normal load condition ............................................ 34
Figure 4-16: Transformer primary current during normal load condition ............................................ 34
Figure 4-17: Transformer secondary voltage during normal load condition ........................................ 35
Figure 4-18: Transformer secondary current during normal load condition ........................................ 35

viii
Figure 4-19: Load 1 Voltage during normal load condition .................................................................. 35
Figure 4-20: Load 1 Current during normal load condition .................................................................. 36
Figure 4-21: Load 2 Voltage during normal load condition .................................................................. 36
Figure 4-22: Load 2 Current during normal load condition .................................................................. 36
Figure 4-23: Load 3 Voltage during normal load condition ................................................................. 36
Figure 4-24: Load 3 Current during normal load condition .................................................................. 37
Figure 5-1: IT transformer primary voltage .......................................................................................... 41
Figure 5-2: IT transformer primary current .......................................................................................... 41
Figure 5-3: IT transformer secondary voltage ...................................................................................... 42
Figure 5-4: IT transformer secondary current ....................................................................................... 42
Figure 5-5: IT customer load voltages .................................................................................................. 43
Figure 5-6: IT customer load currents ................................................................................................... 43
Figure 5-7: IT transformer primary voltage .......................................................................................... 44
Figure 5-8: IT transformer primary current .......................................................................................... 44
Figure 5-9: IT transformer secondary voltage ...................................................................................... 45
Figure 5-10: IT transformer secondary current ..................................................................................... 45
Figure 5-11 IT customer load voltages ................................................................................................. 46
Figure 5-12: IT customer load currents ................................................................................................. 46
Figure 5-13: IT transformer primary voltage ........................................................................................ 47
Figure 5-14: IT transformer primary current ........................................................................................ 47
Figure 5-15: IT utility transformer secondary voltage .......................................................................... 47
Figure 5-16: IT utility transformer secondary current .......................................................................... 48
Figure 5-17: IT customer load voltages ................................................................................................ 48
Figure 5-18: IT customer load currents ................................................................................................. 48
Figure 5-19: IT transformer primary voltage ........................................................................................ 50
Figure 5-20: IT transformer primary current ........................................................................................ 50
Figure 5-21: IT Transformer secondary voltage ................................................................................... 51
Figure 5-22: IT secondary current ........................................................................................................ 51
Figure 5-23: IT load voltages ................................................................................................................ 52
Figure 5-24: IT load currents ................................................................................................................ 52
Figure 5-25: IT three phase system primary voltage ............................................................................ 53
Figure 5-26: IT three phase system primary current ............................................................................. 53
Figure 5-27: IT three phase system secondary voltage ......................................................................... 54
Figure 5-28: IT three phase system secondary current ......................................................................... 54
Figure 5-29: IT three phase system load 1 voltage ............................................................................... 55
Figure 5-30: IT three phase system load 1 current ................................................................................ 55
Figure 5-31: IT three phase system load 2 voltages .............................................................................. 55
Figure 5-32: IT three phase system load 2 current ................................................................................ 56
Figure 5-33: IT three phase system load 3 voltages .............................................................................. 56
Figure 5-34: IT three phase system load 3 current ............................................................................... 56
Figure 5-35: IT three phase system primary voltage ............................................................................ 57
Figure 5-36: IT three phase system primary current ............................................................................. 57
Figure 5-37: IT Three phase system secondary voltage........................................................................ 57
ix
Figure 5-38: IT three phase system secondary current ......................................................................... 58
Figure 5-39: IT three phase system load 1 voltage ............................................................................... 58
Figure 5-40: IT three phase system load 1 current ................................................................................ 59
Figure 5-41: IT three phase system load 2 voltages .............................................................................. 59
Figure 5-42: IT three phase system load 2 current ................................................................................ 59
Figure 5-43: IT three phase system load 3 voltages .............................................................................. 59
Figure 5-44: IT three phase system load 3 current ................................................................................ 60
Figure 5-45: Comparison of the primary parameters comparison during the customer fault ............... 61
Figure 5-46: Comparison of the secondary parameters during the customer fault ............................... 61
Figure 5-47: Comparison of the load parameters during the customer fault ........................................ 62
Figure 5-48: Comparison of the primary parameters during a utility fault ........................................... 62
Figure 5-49: Comparison of the secondary parameters during a utility fault ....................................... 63
Figure 5-50: Comparison of the load parameters during a utility fault ................................................. 63
Figure 5-51: Comparison of primary parameters during a customer fault and a loss of neutral ........... 64
Figure 5-52: Comparison of secondary parameters during a customer fault and a loss of neutral ....... 64
Figure 5-53: Comparison of the load parameters during a customer fault and a loss of neutral ........ 64
Figure 5-54: Comparison of the primary parameters during a utility fault and a loss of neutral .......... 65
Figure 5-55: Comparison of the secondary parameters during a utility fault and a loss of neutral ...... 65
Figure 5-56: Comparison of the load parameters during a utility fault and a loss of neutral ............... 66
Figure 5-57 Comparison of the primary parameters during a customer fault ....................................... 66
Figure 5-58: Comparison of the secondary parameters during a customer fault .................................. 66
Figure 5-59: Comparison of the load parameters during a customer fault............................................ 67
Figure 5-60: Comparison of the primary parameters during a utility fault ........................................... 67
Figure 5-61: Comparison of the secondary parameters during a utility fault ....................................... 67
Figure 5-62: Comparison of the load parameters during a utility fault ................................................. 68
Figure 5-63: Comparison of the primary parameters during a customer fault and the loss of neutral .. 68
Figure 5-64: Comparison of the secondary parameters during a customer fault and the loss of neutral
.............................................................................................................................................................. 69
Figure 5-65: Comparison of the load parameters during a customer fault and the loss of neutral ..... 69
Figure 5-66: Comparison of the primary parameters during a utility fault and the loss of neutral ....... 69
Figure 5-67: Comparison of the secondary parameters during a utility fault and the loss of neutral ... 70
Figure 5-68: Comparison of the load parameters during a utility fault and the loss of neutral ............ 70
Figure 5-69: Comparison of the primary parameters during a customer fault ...................................... 70
Figure 5-70: Comparison of the secondary parameters during a customer fault .................................. 71
Figure 5-71: Comparison of the load 1 parameters during a customer fault......................................... 71
Figure 5-72: Comparison of the load 2 parameters during a customer fault......................................... 72
Figure 5-73: Comparison of the load 3 parameters during a customer fault......................................... 72
Figure 5-74: Comparison of the primary parameters during a utility fault ........................................... 72
Figure 5-75 Comparison of the secondary parameters during a utility fault ........................................ 73
Figure 5-76: Comparison of the load 1 parameters during a customer fault......................................... 73
Figure 5-77: Comparison of the load 2 parameters during a customer fault......................................... 73
Figure 5-78: Comparison of the load 3 parameters during a customer fault......................................... 74
Figure 5-79: Comparison of the primary parameters during a customer fault and the loss of neutral .. 74

x
Figure 5-80: Comparison of the secondary parameters during a customer fault and the loss of neutral
.............................................................................................................................................................. 74
Figure 5-81: Comparison of Load 1 parameters during a customer fault and the loss of neutral ......... 75
Figure 5-82: Comparison of Load 2 parameters during a customer fault and the loss of neutral ......... 75
Figure 5-83: Comparison of Load 3 parameters during a customer fault and the loss of neutral ......... 75
Figure 5-84: Comparison of primary parameters during a utility fault and the loss of neutral............. 76
Figure 5-85: Comparison of secondary parameters during a utility fault and the loss of neutral ......... 76
Figure 5-86: Comparison of load 1 parameters during a utility fault and the loss of neutral ............... 76
Figure 5-87: Comparison of load 2 parameters during a utility fault and the loss of neutral ............... 77
Figure 5-88: Comparison of load 3 parameters during a utility fault and the loss of neutral .............. 77
List of Tables
Table 1-1: Public Distribution of earthing systems worldwide [2] [26] ................................................. 2
Table 2-1: The maximum disconnection times as recommended by IEC 60364 .................................. 13
Table 2-2: Effect of current in a human body [9] ................................................................................. 14
Table 2-3: Comparison of all the earthing system in terms of the electrical characteristics [7]: .......... 16
Table 2-4: Installation and operating rules comparison [7]: ................................................................. 17
Table 2-5 Comparison of the earthing types in terms of network and loads [7] ................................... 18
Table 3-1 Source cable data (185mm2) ................................................................................................ 22
Table 3-2 Feeder Cable Data (70mm2) ................................................................................................. 22
Table 3-3: The Cable unit parameters ................................................................................................... 23
Table 4-1 Preliminary Results .............................................................................................................. 37
Table 5-1 : Advantages and Disadvantages of the earthing systems .................................................... 77

1
Chapter 1 : Introduction
1.1. Introduction
The low voltage distribution network is a system that is powered via the step-down transformer from
either the 11 kV or 22 kV medium voltage (MV) to 400 V systems which feeds the customers either
from the underground cables or over-headlines. Distribution networks are considered as either earthed
or unearthed, although there are disadvantages and advantages of each type of earthing but it is still
almost difficult to say which earthing method is the most effective [1].The necessity for good grounding
highly depends on what the distribution engineer is trying to accomplish and the type of earthing
employed in any system has a direct influence on the protection philosophy that may be applied which
can lead to a safer network [1]
During the investigation, it was learnt that an unearthed system leads to dangerous touch and step
voltages, unreliable voltage stability and hazards in the interconnected installation [2]. Fatalities occur
each year on the rural low voltage networks of South Africa due to these safety hazards being present
in the network. These often remain in a dormant state for a prolonged period of time without detection
[3]. Studies have been conducted that looked into the possibility of using smart meters to measure the
voltage and current at the transformer in order to detect and identify any potential hazards using various
measurement methods [3].
The earthing systems start to differ when exposed to the insulation fault which result in fault currents,
dangerous touch voltage and overvoltage which can damage the equipment and have the risk of shock
to humans. The values of these parameters and the extent of damage are heavily dependent on the kind
of neutral earthing employed on that particular network [4].
The earthing system in the low voltage network is more concerned about the combination of earthing
arrangement at the source side and also at the installation (premises of the customer).According to
IEC60364 the low voltage network may be defined according to its earthing methods and these are
defined using five letters, T (direct connection to earth), N (neutral), C (combined), S (Separate) and I
(isolated) [4]. These systems are defined by the grouping of these letters where the first letter denotes
how the transformer neutral (supply source) is earthed, the second letter denotes how the metal work of
the installation (frame) is earthed [4], and the third and fourth letters indicate the functions of the neutral
and protective conductors respectively [4].

2
There are three earthing arrangements namely [2]:
IT system - transformer neutral not earthed or earthed through a high impedance
TT system - transformer neutral earthed through an earth electrode and conductive parts earthed
TN system – subdivided into TN-C ,TNS and TN-CS (discussed in the subsections)
The earthing practices are different for every country as there are variations regarding the designs,
materials allowed for earth electrodes and conductor cross sectional areas [2]. For example in Germany,
every building must have a foundation earth electrode [2].While in Netherlands a single interruption in
the earthing arrangement may not result in an excessive touch voltage in the installation [2]. In the
United Kingdom, a consumer is not allowed to combine the neutral and protective functions in a single
conductor, whereas in Czech Republic, the use of PEN conductors in parts of installations are not
permitted of earthing methods worldwide [2].
In terms of worldwide application the IT system is most commonly used in hospitals (medical centres)
and mines where the continuity of supply is critical and where connection to the earth is difficult [2].The
most commonly used systems globally are the TT and the TN-C-S, the table below is a summary [2]:
Table 1-1: Public Distribution of earthing systems worldwide [2] [26]
Country Voltage system LV Earthing
Germany 230/400V TT and TN-C
Belgium 230/400V TT
Spain 230/400 V TT
France 230/400V TT
Great Britain 240/415V TT and TN-C
Italy 230/400 TT
Japan 100/200 TT
Norway 230/400 IT
Portugal 230/400 TT
USA 120/240 TN-C
South Africa 230/400 TN-C-S and TN-S
In the research, the earthing methods listed in Table 1 are studied and compared in detail in order to
determine their behaviour under various fault conditions so as to learn which methods is best suitable
for the ever changing distribution technology. It is learnt that the most commonly used earthing systems
in the LV network globally are the TN-C-S and TT methods [2].
Although South Africa is geologically a diverse country with often low soil resistivity that differs
greatly by region and season that is governed by SANS 10292 which advocates the use of TN-S and
TN-C-S [2], it is worthwhile to study and explore the other earthing methods being used effectively in

3
other countries for possible use in South Africa. These come from the TN family of the earthing system
where in TN-C-S system is the neutral and protective earth conductors are a combined for part of the
system while in TN-S has the separate throughout [2].
In the IT system the source not earth or earthed through a high impedance and the load is earthed
independently while in the TT system both the source and the load are earthed solidly [2].These earthing
methods are applied on the LV distribution networks either underground or over-head. There are
incidents that are happening already that are concerned with the TN-S and the TN-C-S that impact on
public safety which indicate the need to study other earthing methods for possible use in South Africa
[5].
1.2. Research motivation
The electrical installations are evolving; electronics is everywhere thus leading to designers having to
look afresh into the earthing designs being used in the low voltage networks [6]. Technology being used
for the detection of hazards and protection of personnel and equipment on the other hand is also
evolving, hence it is a necessity to be abreast with all these changes so as to design earthing systems
well and coordinate them well with the power system protection.
1.3. Hypothesis
An earthed system leads to dangerous touch and step voltages, unreliable voltage stability and hazards
in the interconnected installation. At times it is hard for the earth fault protection device to detect and
clear these earth faults, this is dependent upon the earthing arrangement employed at any given point.
1.4. Research problem statement
The research focuses on the effect of neutral earthing where all the earthing methods in the low voltage
distribution network were compared through simulations in order to establish their respective behaviour
under fault conditions.
1.5. Research questions
The key research questions that are addressed by this research are as follows:

4
What effect does the neutral grounding have on LV networks?
What are the advantages and disadvantages of each earthing system?
What is the best neutral earthing method for the ever-changing low voltage distribution
technology?
1.6. Research objectives
The objective of the research is to determine which earthing system is the best for the low voltage
networks of which the findings from this research will be an input to the reviewing of the current and
future designs, standards and philosophies of the earthing and earth fault protection in the distribution
network. The selection criterion of the earthing systems has also changed hence it is necessary that one
learns the various selection criterion used so as to choose the best suitable method effectively [6].
The electricity companies supply various of consumers by a transformer therefore, it is possible to have
earthing faults at two different consumers without the fuses blowing and this causes a risk of indirect
contact and fire, hence it is important to study the impact of each earthing system on the power system
protection [6].The research discusses the impact of the medium voltage phase fault which may present
a huge risk if the faults have migrated to the low voltage network.
1.7. Outline of chapters
This research document outline is broken down according to the following chapters:
Chapter 1 – Introduction that gives an overview of what the research topic is all about.
Chapter 2 - Literature review that discusses the theoretical background of the various earthing methods
in the low voltage distribution network and also the findings on the previous works that were done by
other authors previously.
Chapter 3 -Research methodology used presents how the research was conducted in order to prove the
hypothesis and address the research question.
Chapter 4- Preliminary research results and analysis that discusses the no load condition and the effect
of loading on the typical model to be used for the comparative study.
Chapter 5 – Main simulation results and analysis that detail the base case and the comparison on the
three earthing systems under the various fault condition
Chapter 6 - Conclusion that summarizes the research results and the proposed future recommendations.

5
Chapter 2 : Literature Review
2.1. Introduction
In a distribution network various loads are supplied from the step down transformer that is connected
on the medium or high voltage network with normally a delta/star vector group. The secondary winding
of this transformer may be earthed or unearthed which bears the consequences that if it is unearthed,
the single line to ground fault will not result in high fault currents that can cause the discontinuity of
supply which is also a may also be dangerous because this type of fault may be difficult to detect [1].
While it is good practice to have good earthing, sometimes good earthing may not be necessary and
may even be detrimental [1]. All this knowledge brought about the interest of this research to study the
effect of neutral earthing in the LV network by studying comparatively the three different configurations
of the LV earthing methods. The research involves studying their main principles and characteristics,
their applications and their advantages and disadvantages. More importantly, the research is to study
what critical aspects need to be looked out for in choosing earthing for the low voltage networks.
According to SANS 10292, the earthing of the neutral of the low voltage system provides the following
functions [8]:
A return path back to the source for the phase to ground fault and leakage current.
Maintaining the neutral of the LV system to a zero potential.
Ensuring that the medium-voltage protection operates in the event of the incident fault between
the medium/high-voltage and low voltage winding of the transformer and
Reducing the prospective touch voltages as much as reasonably practical.
While most countries apply recommendations from the International Electrotechnical Commission,
each country also apply its home regulations as far as neutral earthing is concerned and these regulations
vary from country to country. These choices of earthing govern the measure necessary for safeguarding
the people from direct and indirect contact potential dangers [7].
In order to prevent these problems, the low voltage networks are equipped with protection devices like
fuses and circuit breakers to operate when the short circuit fault occurs and provision of the residual
current protection devices that isolate the system upon detection of leakage current in the system [10].
2.2. Earthing system designs and characteristics
In recent times, the low voltage system standards are well developed and they address all major aspects
for safe installation. The standard developers focus more on the measures to be applied in order to

6
ensure to the protection of personnel and property [5]. This has led to the standardization of three
earthing systems discussed below which deals with the distribution network connections made in terms
of the neutral, protective earth and the conductive parts of the LV network with the following functions:
Earth - conductive mass whose potential is conventionally zero [11].
Neutral conductor - used for the purpose of providing the return path [11].
Protective earth conductor – provided for purpose electric shock safety, it functions to safely
drain the ground fault current to the source [11] [21].
Enclosures - intended to prevent humans from intentionally or accidentally touching live parts
without the aid of tools [11].
PEN conductor – comes from the combination of PE and Neutral [11].
Exposed conductive parts- forming part of an installation that can be accessible [14] [21].
It has been discovered during the research that the integrity of these elements is quite crucial since the
failure of the above system components could lead to public safety hazards that may or may not be
detected by the protection devices [12].
The following are typical hazards that are reported from various incidents in the distribution system
[12]:
Phase conductor and transformer tank short circuited.
Medium voltage earth and low voltage earth conductors short circuited.
Low voltage earth electrode conductor high impedance failure.
PEN conductor high impedance failure.
PEN conductor short circuited with phase conductor without line protection.
Phase conductor exposed and reachable from earth.
Phase conductor and PEN conductor exposed and reachable.
Earth leakage protection not operational.
Medium voltage earth and low voltage short circuit.
These hazards are some of the reasons why any network designer needs to understand the principle of
designing and the need to choose the earthing methods carefully so as to ensure that the above items
are provided for in the system either by the earthing system or by electrical protection associated with
it.

7
2.2.1 IT system (Unearthed source neutral)
In this earthing system, the supply source is either connected to earth through a deliberate connection
of high earthing impedance (Impedance earthed IT system) or by isolating it from earth as shown in
Figure 2-1 with all the conductive parts of the installation connected to an earth electrode as shown in
figure 2(b) [2].
Figure 2-1: IT earthing system [2]
The main characteristics of an IT earthing system can be summarized as follows:
Solution that offer the best continuity of service during operation generally used by private
MV/LV or LV/LV transformers as it has the lowest fault current that is less harmfull and does
not necessitate system shut down[7].
Indication of the first insulation fault followed by fault-detection and clearing ensures
systematic prevention of outages as the application is mostly for critical condition like in
hospitals and industrial supplies where productivity surpasses safety and yet monitoring is
still important [7].
Requires presence of personnel for monitoring and operation [7].
The check for effective tripping for two simultaneous faults needs to be carried out during the
design stage and followed by the mandatory measurement during commissioning, this is done
to ensure that the protection is adequate for the worst case scenario [7]. During commissioning

8
the faults are simulated to create a condition where the overvoltage and overcurrent condition
is adequately protected [7].
2.2.2 TT system
In this earthing system, the supply source has a direct connection to earth and all the conductive parts
of an installation are connected to an earth electrode that is electrically independent of the source earth
as shown in Figure 1 [2].
Figure 2-2: TT earthing system [2]
The main characteristics of a TT earthing system can be summarized as follows:
Faults on the low voltage and the medium grid do not migrate to other customers in the low
voltage grid [4].
Good security as the potential rise of the grounded conductive part must be limited to 50 V for
faults [4].
No influence of extending the network inside the installation and 0V for faults on the network
[4].
Each customer needs to install and maintain its own earth ground electrode [4].
High overvoltage which may damage the equipment may occur between live parts and between
live parts and the PE conductor which may damage [4].
Simplest earthing solution to design and install used in installation directly supplied by the
public LV distribution network [7].
Protection is ensured by special devices called Residual Current Devices (RCD) that are

9
preventing the risk of fire [7].
Does not require continuous monitoring during operation (periodic checks on RCD may be
necessary) [7].
2.2.3 TN system
In this earthing system, the supply source is directly connected to earth and all the conductive parts of
an installation are connected to a neutral conductor. This system is subdivided into three configurations
as shown in Figure 2-3[2],broken as follows: Figure 2-3(a) shows a TN-C system where the neutral
and the protective functions are combined in a single conductor throughout the system (combined
conductor called PEN referred to as Protective Earth Neutral), Figure 2-3(b) shows the TN-S system
where the neutral and the protective are separate conductors throughout the system and Figure 2-3(c)
showing the TN-C-S system where the neutral and the protective functions are combined in a single
conductor in a part of the TN-C-S then in the downstream use of TN-C and TN-S is implemented [2].
Figure 2-3: TN Earthing System [2]
The main characteristics of a TN earthing system can be summarized as follows:
Could work well with overcurrent protection devices [4].
Faults on the high voltage network may be transferred into the LV grid grounding causing
touch voltages [4] [38].
Affected badly by the loss or deterioration of neutral [4] [40].
Requires installation of the earth electrode at regular intervals throughout the installation this
ensures distributed grounding and reduces the risk of customer not having a safe ground [7].

10
May result in greater damage to the windings of the rotating machines during insulation faults
[7].
Dangerous in premises with risk of fire due to high faults [7].
During the insulation fault the touch voltages are smaller than the in the TT systems [7].
No over voltages stress on equipment [7].
2.3. Fault behaviour of the earthing systems
It has been gathered from literature that the behaviour of all the earthing methods is the same under
normal operating conditions, if all the rules and regulations are followed correctly. However these
systems behave differently under the abnormal (fault) condition. An insulation fault presents a hazard
to human and equipment, hence it is important to understand the behavior of each system under these
faults so that appropriate protection of humans and equipment can be designed and configured to work
well for each earthing system. The fault currents and voltage differ from one earthing system to the
other as also demonstrated in chapter 4 and 5. The behaviour of faults is summarized for single phase
to ground which are the most common faults in the consumer premises [4].
2.3.1 Fault behaviour of the IT system (First fault)
During the occurrence of the first fault is an IT system which is the fault where fault voltage is low and
not dangerous to an extent of necessitating the disconnection of the installation [4]. It is worthwhile to
know that if there is a fault, proper means must be followed to clear it all, hence the need to install the
insulating monitoring device (IMD) as shown in Figure 2-4 [4]. Fault current flow as shown in Figure
2- 4.

11
Figure 2-4: First insulation fault current in the IT system (a) [6]
The exposed-conductive part shall be earthed to satisfy the equation (1) [4] [22] [25]:
𝑅𝑏 × 𝐼𝑑 ≤ 50 𝑉 (1)
Where: -Rb is the resistance of the electrode for exposed conductive parts
-Id is the fault current which takes into account leakage currents and the total impedance of the
electrical installation.
-The voltage of 50 V is the safety limit for the touch voltage that a human can experience
without experiencing the cardiac arrest [4].
2.3.2 Fault behaviour of the IT system (Second fault)
During the occurrence of the second fault, a fault that occurs subsequent to the first 1st fault where the
fault voltages are high and requires disconnection of the system. The maximum disconnection times are
recommended in IEC 60364 tables 41B and 48A [4] as summarized in table 2-1 Section 2.3.4.Fault
current flow as shown in Figure 2-5.

12
Figure 2-5: Second fault insulation fault current in the IT system (b) [6]
2.3.3 Fault Behavior of the TT system
When an insulation fault occurs in a TT system, the fault current is limited by the earth resistances (Ra
and Rb) and the fault current flows as shown in Figure 2- 6 [4]. In order to increase the availability of
power supply, it is recommended that an RCD (Residual Current Device) be installed at the source side
of the installation. This also improves the current discrimination on tripping [4] [27].
Figure 2-6: Fault behavior in the TT earthing system [4]
2.3.4 Fault Behavior of the TN system
During the occurrence of an insulation fault in TN system the fault current is limited by the impedance
of the loop cables and flows as shown in Figure 2-7 [4][27].Short circuit protection devices (fuses and

13
breakers) provide protection against insulation fault with automatic tripping specified according to
tripping times. Typical breaking times for Phase to neutral voltage is stipulated in IEC 60364 [4].
Figure 2-7: Fault behavior in the TN-S earthing system [4]
Table 2-1: The maximum disconnection times as recommended by IEC 60364
(taken from tables 41 and 48)
U0(Volts)
Phase /neutral voltage
Braking Time (seconds)
UL =50 Volt
Braking Time (seconds)
UL =25 Volt
127 0.8 0.35
230 0.4 0.2
400 02 0.05
>400 0.1 0.02
2.4. Power System Protection Aspects
As stated earlier the type of earthing system employed in any installation has an impact on the protection
of that system both from the side of the utility and the side of the customer. Hence it is important that
protection schemes are designed in relation to the type of earthing system used in a particular LV
network. The whole objective of protection is to protect the humans and property against the indirect
contact with faulty parts of the power system [22] [23] [34].
The greater concern about the proper selection of earthing system is to ensure proper protection of the
14
system during the insulation faults that may occur as a result of the non-insulation of the conductive
parts of the installation. The cause of the insulation failure varies from but not limited to lightning
strikes, poor maintenance, mechanical deterioration of cable insulation and environmental effects [9].
These insulation faults are associate with three major risks namely: risk of shock (in a form of direct
contact where a human forms part of circuit that would be expected to be live or indirect contact where
contact is made with something that has become alive as a results of fault), risk of fire and the risk of
unavailability of plant [9] [22] [36]. All these have serious effects of danger, hence proper design need
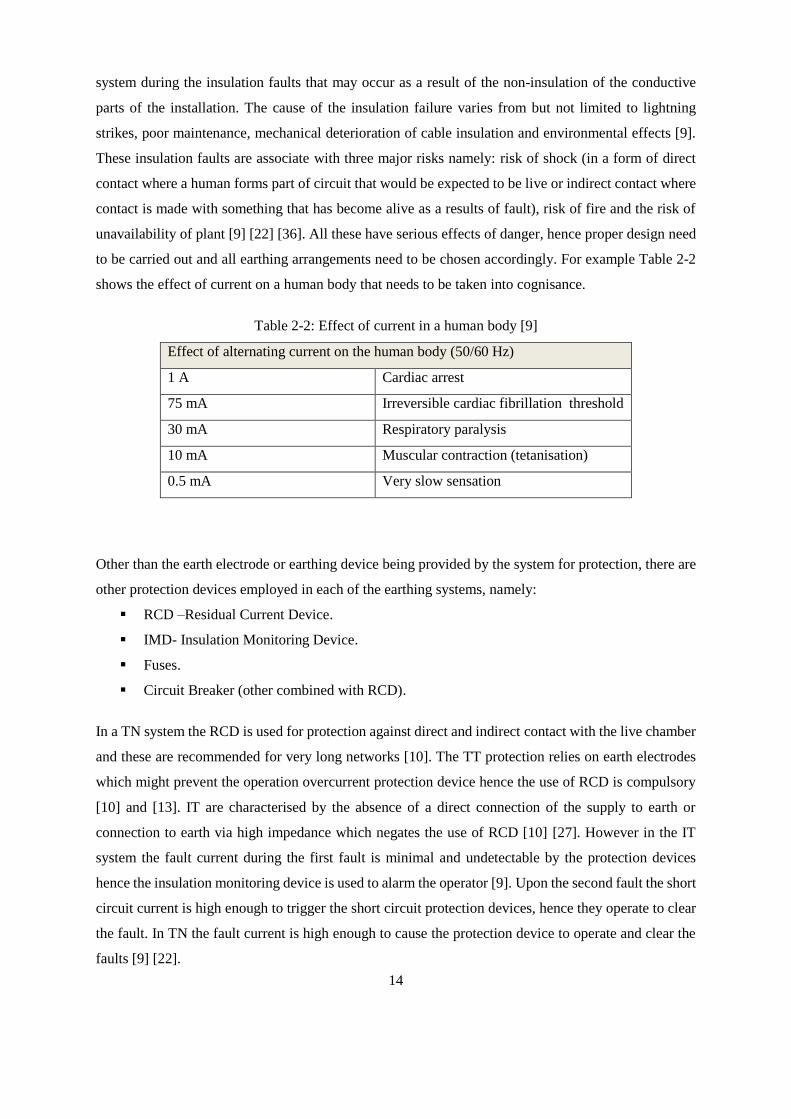
to be carried out and all earthing arrangements need to be chosen accordingly. For example Table 2-2
shows the effect of current on a human body that needs to be taken into cognisance.
Table 2-2: Effect of current in a human body [9]
Effect of alternating current on the human body (50/60 Hz)
1 A Cardiac arrest
75 mA Irreversible cardiac fibrillation threshold
30 mA Respiratory paralysis
10 mA Muscular contraction (tetanisation)
0.5 mA Very slow sensation
Other than the earth electrode or earthing device being provided by the system for protection, there are
other protection devices employed in each of the earthing systems, namely:
RCD –Residual Current Device.
IMD- Insulation Monitoring Device.
Fuses.
Circuit Breaker (other combined with RCD).
In a TN system the RCD is used for protection against direct and indirect contact with the live chamber
and these are recommended for very long networks [10]. The TT protection relies on earth electrodes
which might prevent the operation overcurrent protection device hence the use of RCD is compulsory
[10] and [13]. IT are characterised by the absence of a direct connection of the supply to earth or
connection to earth via high impedance which negates the use of RCD [10] [27]. However in the IT
system the fault current during the first fault is minimal and undetectable by the protection devices
hence the insulation monitoring device is used to alarm the operator [9]. Upon the second fault the short
circuit current is high enough to trigger the short circuit protection devices, hence they operate to clear
the fault. In TN the fault current is high enough to cause the protection device to operate and clear the
faults [9] [22].
15
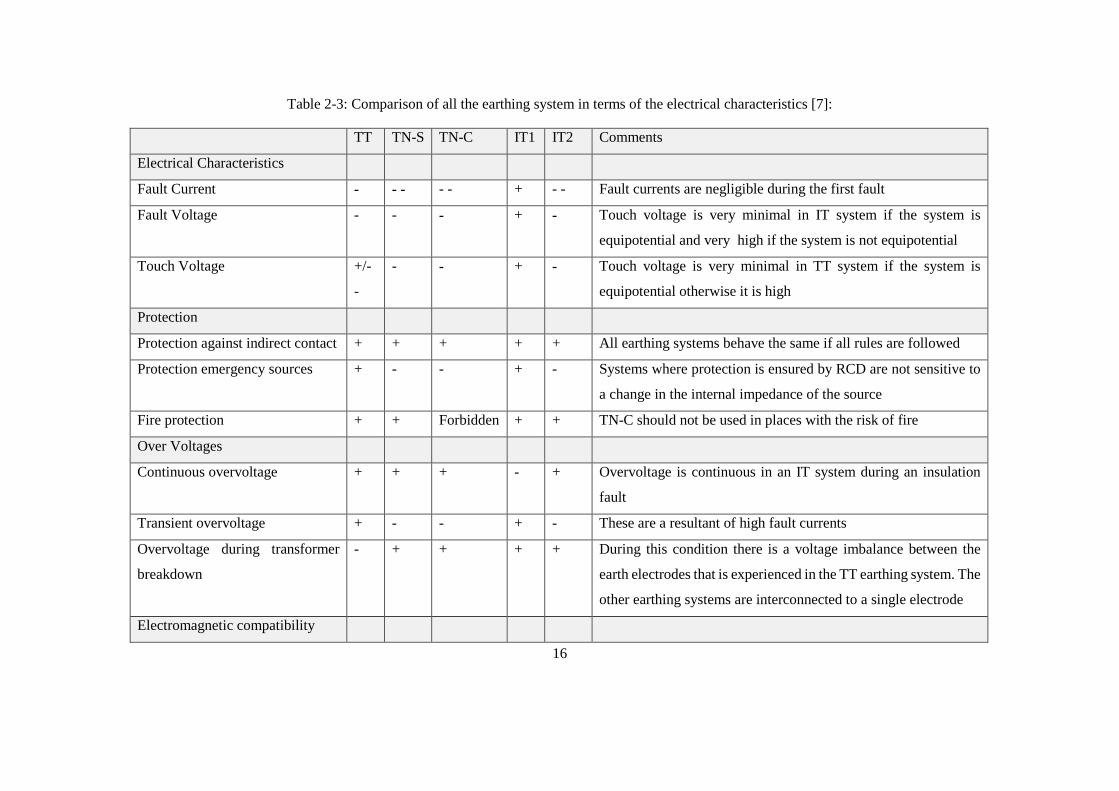
2.5. Comparison of the Earthing Methods
From various literature, the three earthing methods are studied comparatively, it was therefore learnt
that the three earthing methods are similar in terms of protection of persons if all the installation rules
are followed [7] [29] [33]. Therefore, the selection criterion for which earthing system is used in low
voltage network depends on the combination of the following factors [7] [33]:
Regulatory requirements
Required service continuity
Operating Conditions
Type of the affected loads and the limitation of the level of disturbance applied to sensitive
equipment
These are as indicated in Tables 2-3, 2-4, 2-5:
16
Table 2-3: Comparison of all the earthing system in terms of the electrical characteristics [7]:
TT TN-S TN-C IT1 IT2 Comments
Electrical Characteristics
Fault Current - - - - - + - - Fault currents are negligible during the first fault
Fault Voltage - - - + - Touch voltage is very minimal in IT system if the system is
equipotential and very high if the system is not equipotential
Touch Voltage +/-
-
- - + - Touch voltage is very minimal in TT system if the system is
equipotential otherwise it is high
Protection
Protection against indirect contact + + + + + All earthing systems behave the same if all rules are followed
Protection emergency sources + - - + - Systems where protection is ensured by RCD are not sensitive to
a change in the internal impedance of the source
Fire protection + + Forbidden + + TN-C should not be used in places with the risk of fire
Over Voltages
Continuous overvoltage + + + - + Overvoltage is continuous in an IT system during an insulation
fault
Transient overvoltage + - - + - These are a resultant of high fault currents
Overvoltage during transformer
breakdown
- + + + + During this condition there is a voltage imbalance between the
earth electrodes that is experienced in the TT earthing system. The
other earthing systems are interconnected to a single electrode
Electromagnetic compatibility

17
Immunity to nearby lighting
strikes
- + + + + TT system is affected by the lightning strikes
Immunity to lighting strikes on
MV lines
- - - - - All earthed systems behave the same when a MV line takes a
direct lightning
Continuous emission of an
electromagnetic field
+ + - + + TN-C is affected
Transient non-equipontentiality of
the PE
+ - - + - The Protective Earth is no longer behaving the same during the
fault
Table 2-4: Installation and operating rules comparison [7]:
Earthing Method TT TN-S TN-C IT1 IT2 Comments
Continuity of Service
Supply discontinuity
during the first fault
- - - + + Only the IT system avoids discontinuation of supply during
insulation fault
Voltage depression
during insulation fault
+ - - + - IT (1st Fault ) and TT generate low fault currents which do not
lead to voltage dips
Installation
Protection devices - + + - - TT work well with RCDs , IT works well with IMDs and TN
works well with fuses and circuit breakers
Earth electrode quantity - + + -/+ -/+ TT system uses 2 distinct earth electrodes while IT offers a
18
preference between one or two earth electrodes
Cables quantity _ _ + _ _ Only the TN-C system offers in certain cases a minimal number
of cables
Preservation
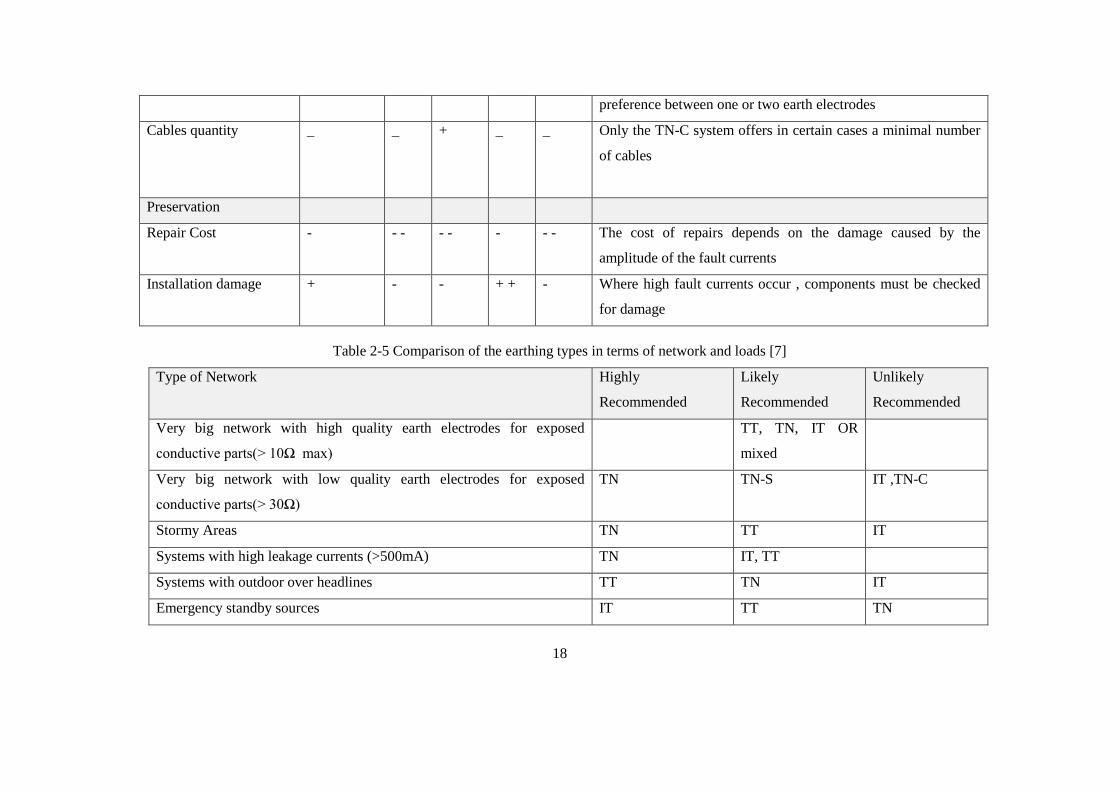
Repair Cost - - - - - - - - The cost of repairs depends on the damage caused by the
amplitude of the fault currents
Installation damage + - - + + - Where high fault currents occur , components must be checked
for damage
Table 2-5 Comparison of the earthing types in terms of network and loads [7]
Type of Network Highly
Recommended
Likely
Recommended
Unlikely
Recommended
Very big network with high quality earth electrodes for exposed
conductive parts(> 10Ω max)
TT, TN, IT OR
mixed
Very big network with low quality earth electrodes for exposed
conductive parts(> 30Ω)
TN TN-S IT ,TN-C
Stormy Areas TN TT IT
Systems with high leakage currents (>500mA) TN IT, TT
Systems with outdoor over headlines TT TN IT
Emergency standby sources IT TT TN

19
Type of Loads
Loads immune to high fault currents IT TT TN
Low insulation level loads TN TT IT
Numerous single phase loads TT , TN-S IT , TN-C
Loads with sizeable risks TN TT IT
Numerous auxiliaries TN-S TN-C , IT TT
20
2.6. Chapter Conclusion
It was learnt during the research literature study that the choice of an earthing system does not only
depend on which legislation is the country complying to but also on the characteristics of the earthing
system , the behavior during the fault occurrence , the ability to communicate with the protection
equipment and the type of load supplied with power. The designers also need to take into consideration
the importance of the integrity of the earthing elements and the sizing thereof in order to protect the
system and the lives of people.

21
Chapter 3 : Research Methodology
3.1 Introduction
The research was conducted as a desktop study by simulation of the typical low voltage network on the
Matlab simulink package. The purpose of the study was to use one network and configure in three
different earthing methods the IT, TT and the TN-C so as to study their behavior under different fault
conditions. This would aid in understanding the effect of earthing the neutral in the power system.
3.2 Power System Model
A comparative study was done using the typical LV network in Figure 3-1 below which was simulated
in Matlab Simulink. The system was connected to the medium voltage (MV) source of 11 kV that was
stepped down by the 11 kV/400 V transformer and then distributed into the various customers. During
the research, both the three phase loads and the single phase loads (both balance and unbalanced) were
configured according to the three earthing system namely: the IT, TT and TN system.
The main objective of this comparative study was to see how the different earthing systems would
behave when various system conditions were simulated and analysed. In line with the research topic,
the effect of neutral grounding on the LV distribution network, the study was conducted such that the
three earthing methods were compared with the reference IT earthing system, where the neutral was
either unearthed or earthed through high impedance. The primary objective was to see how the other
earthing methods would behave under various conditions as compared to the unearthed neutral system.
This was to ascertain the effect the neutral earthing have on the performance of the distribution network.

22
Figure 3-1: Typical 400 V distribution system single line diagram
In conducting this study it was ensured that the parameters were set correctly since the parameters of
the power cables also play major role in the protection of the system [35].The source and the loads were
as depicted in Figure 3-1 and the cable information is as detailed in Tables 3-1 and 3-2 and further
calculated in Table 3-3.
Table 3-1 Source cable data (185mm2)
Table 3-2 Feeder Cable Data (70mm2)
From the above reactance parameters the capacitance and inductance were calculated using the
following equations:
𝑋𝐿 = 𝐿 = 2𝜋𝑓𝐿 (2)
𝑋𝐶 =1
𝐶=
1
2𝜋𝑓𝐶 (3)
Where: f = 50Hz
Specification R(Ω/km) X(Ω/km) B(µ/Ω/km)
Positive Sequence 0.128 0.091 123.15
Zero Sequence 0.128 0.091 123.15
Neutral 0 0 0
Specification R(Ω/km) X(Ω/km) B(µ/Ω/km)
Positive Sequence 0.297 0 0
Zero Sequence 0.297 0 0
Neutral 0.297 0 0

23
Table 3-3: The Cable unit parameters
3.3 Simulink Model
The research was conducted using Matlab simulink package where the power system model in Figure
3-1 was built as shown in Figure 3-2. This figure shows a block diagram of the typical components that
were used for the purpose of the study and these were: the voltage source, transformer, cables and loads
(both the three phase and single loads) as depicted in the main typical circuit. As the aim was to study
the behaviour of the three earthing system, the fault application units were used to simulate faults on
the systems. The resistor circuits were used as measured to represent a human body that would be
affected by dangerous touch voltage and current if they were to be measured.
Figure 3-2: Simulink simulation model block diagram
One crucial aspect of the simulations was about the sizing of the earthing electrodes for both the
transformer neutral earthing for IT and TT and also for the earthing of the exposed conductive parts.
The limit of “Rb*Id ≤ 50 V “is used for the calculation of these electrodes [4], for the IT system an
RCD calculation was employed where the leakage current setting was used. For instance for South
Africa this value is 30 mA hence the loop impedance value was taken not more than 1666 Ω (summation
of neutral earth electrode and the conductive part electrode). It has been learnt through the simulations
that the variations of these resistance values impact on the system performance of the earthing system
and their ability to protect human life and equipment.
Cable Size R (Ω/km) L (H/km) C (F/km)
185 mm 2 0.128 2.89 X 10⁻⁴ 2.58 X 10⁻⁵
70 mm 2 0.97 1 X 10⁻⁴ 1 X 10⁻⁵

24
It was learnt from studied literature that the various ground resistance and the number of earthed points
along the neutral wire ,the voltage and current profiles , fault current and ground potential rise will
differ largely[19].Hence these are studied for the various earthing methods under different plant
conditions. During the research, it was learnt that design of the neutral differs widely from country to
country and even from utility to utility within the same country and this requires careful attention when
designing each earthing system [17] [28].For the purpose of simulation ,the South African
recommendations were employed to calculate the sizes of the electrodes [2] [28].
Sharmistha in [28] states that the required small value of the earth electrode at the customer’s premises
is becoming a determining factor for the implementation of TT system hence there are guidelines on
what values of earthing electrodes need to be used in order to achieve optimum results.
3.2.1 IT Simulink Model
In an IT system, the high impedance at the source could be made up of high resistive or high reactance
impedance. For the purpose of the study, the model in Figure 3-2 was used where the transformer neutral
was earthed through a high resistive impedance earth electrode. This was set at 1000 Ω in order to study
the behavior of the system [31]. At the customer’s premises, the earth electrode impedance was set low.
The parameters monitored were the primary voltage and current, secondary voltage and current, load
voltage and current. This model was used as a reference for comparison since the aim is to study how
the system would behave when the neutral was earthed and when it was unearthed.
The fault current in faulted phase must be made low enough to be regarded as an overload
condition.
The healthy phases must remain healthy to ensure continuity [4] [32].
The over-voltage on the healthy phase must rise up to approximately line voltage
(√3Vphase) [4].
Faults on utility side must not affect the low voltage network.
3.2.2 TT Simulink Model
In order to build the TT system, the above model was used, the transformer neutral was earthed through
an electrode and was varied in order to study the behavior of the system. At the customer’s premises,
the earth electrode impedance was used was also varied in order to study the behavior of the system.
The parameters of interest were the fault current touch voltages and neutral voltage and current.
The achieved results from the simulation are as follows:

25
The fault current in faulted phase was low enough to be regarded as just and overcurrent [26].
The healthy phases were kept healthy to ensure continuity.
The over-voltage on the healthy was approximately line voltage (√3Vphase) [4] [24] [36].
3.2.3 TN-C Simulink Model
In order to build the TN system, the above model was used; the transformer neutral was earthed through
an earth electrode that was combined with the neutral to form the PEN conductor. The size of this
electrode was varied in order to study the behavior of the system. The parameters of interest were the
fault current touch voltages and neutral voltage and current.
The fault current in faulted phase must be high enough to be regarded as a short circuit that can
be cleared by the short circuit protection device.
The overvoltage of approximately line voltage (√3Vphase) is expected should a loss of neutral
be discovered in the system [4] [24] [36].
Faults on utility side must not affect the low voltage network.
3.4 Simulation Scenarios
Simulation were conducted for various scenarios of the systems to study the behavior of the three
earthing methods with particular attention being paid to the system voltages and currents at both the
utility (transformer side) and the customer side. The main objective of these simulations was to conduct
various faults in the system and analyse how each system behave in an effort to satisfy the set
characteristics of each method and also to ascertain which earth method would behave better under
various fault conditions.
The evaluated fault conditions are as follows on both the three phases and the single phase (balanced
and unbalanced) systems:
Customer single phase fault behavior – This was carried out by applying a red phase to ground
fault on one of the loads using a fault block.
Utility single phase fault behavior - This was carried out by applying a red phase to ground
fault on primary side of the utility transformer using a fault block.
Loss of neutral when the fault is applied on the LV side - This was carried out by applying a
red phase to ground fault on one of the loads using a fault block while disconnecting the neutral
using a circuit breaker.
Loss of neutral when the fault is applied on MV side - This was carried out by applying a red
phase to ground fault on primary side of the utility transformer using a fault block.

26
These fault conditions were applied separately on the balanced single phase system, unbalanced single
phase and the three phase system. Each of the fault condition was set accordingly to study the response
as and when a particular scenario is simulated. All results were plotted in Matlab on RMS values using
the Matlab RMS signal block, in the report the graphs for the base case study of the un-earthed system
was documented and thereafter, the comparison was done by transferring the attained RMS results into
excel and plotting the three earthing systems on the bar-chart for the comparison to be done successfully.
3.5 Chapter Conclusion
In configuring the power system into the three earthing families it was discovered that it is of
paramount interest to understand the meaning of network parameters for the network that one is
simulating. The parameters that played a crucial role are those of the source, transformer and the
cables especially the cables when one had to try adjust the length so as to match the realistic values of
reactance parameters. The sizing of the earthing electrodes was also very critical as it differentiated
the earthing systems greatly as learnt from literature.

27
Chapter 4 : Preliminary Research Results and Analysis
4.1 Introduction
This section discusses the basic results that were achieved in the early stages of the research while the
scenarios were being set-up. The objective was to establish the basis of all system values by ensuring
that the realistic values of the system were simulated to represent the real system model. The following
were conditions that were set-up in both the single phase system and the three phase system. However
it was deduced that in the set conditions, all the earthing system systems behaved the same.
4.2 No load Condition
The main objective of this simulation was to ensure that the voltage measured both on the primary and
the secondary were equal to the rated voltage drawn from the source and the current flowing was zero
since there was no load drawing the current. In simulating this condition, the transformer was connected
to the 11kV source via a transmission line and the breaker after the transformer connecting the loads to
the transformer was left in an open state to ensure that no load was connected during the simulation.
The parameters of interest were the voltage and current on both the primary side and the secondary side
that would help in establishing the base of the study and ensure that the transformation ration was as
expected.
The results for primary voltage and current are depicted in Figure 4-1 and 4-2 respectively, Figure 4-1
shows the voltage of 11.16 kV which is 1.5 % of the rated voltage while Figure 4-2 shows the current
measured to be close to zero as the expected under no load behaviour.
Figure 4-1: Transformer primary voltage during no-load condition

28
Figure 4-2: Transformer primary current during no-load condition
Figure 4-3 and Figure 4-4 on the other hand show the values for the transformer secondary voltage and
current respectively, where Figure 4-3 depicts the value of the secondary voltage being 406 V that is
within ± 1.2 % of the expected value and the measured value of current in Figure 4-4 shows the current
to be 0.004 A which is as close as possible to zero as expected in a no load condition. However these
Figures also prove the transformer ration to be equal to the specified 11 kV to 400 V.
Figure 4-3: Transformer secondary voltage during no-load condition

29
Figure 4-4: Transformer secondary current during no-load condition
4.3 Single Phase Normal Balanced Load Condition
In this set-up the breaker to the loads was closed and three equal purely resistive loads were connected
in balanced manner where load 1 was connected to red phase , load 2 connected to white phase, load 3
to blue phase and load 4 was not connected at this stage. The primary objective of this was to observe
how the voltages and currents would behave as the system was loaded. The simulation is run for 0.2s
where the loads were added at 0.1s during the simulation.
Figure 4-5 shows a slight decline of 1.79% in voltage on the primary side as the loads are being added
which goes from 11.16 kV to 10.96 kV. Figure 4-6 depicts the current being drawn by the loads as they
are added at 0.1s interval drawing 2.188 A as opposed to the expected 2.16 A.
Figure 4-5: Transformer primary voltage during normal load condition

30
Figure 4-6: Transformer primary current during normal load condition
Figure 4-7 shows a decline in voltage of 4.5% in the secondary voltage as soon as the loads were added
at 0.1s interval where a voltage was originally higher than expected. Figure 4-8 shows the current drawn
by the loads at the secondary side of the transformer of 57.83 A instead of the expected calculated
current of 60 A with error of 3.61%.
Figure 4-7: Transformer secondary voltage during normal load condition

31
Figure 4-8: Transformer secondary current during normal load condition
Figure 4-9 shows the current drawn by load with load 4 drawing zero at this stage for a balanced system
simulation. The currents do correspond to the currents measured for each load at the transformer
secondary side.
Figure 4-9: Current drawn by each load during normal load condition
4.4 Single Phase Unbalanced Load Condition
At this stage the system is first simulated with the balanced load when all the three loads are switched
on at 0s then at 0.05s load 4 is introduced in the system which is also connected to red phase in order
to simulate the unbalanced condition. Figure 4-10 shows the decline in voltage after 0.05s and Figure
4-11 shows an increase in current on red phase as a result of adding load 4. This is because when load
4 is loaded it becomes a parallel connection with load 1 which reduces the resistance in red phase hence
an increase in current.

32
Figure 4-10: Transformer primary voltage during the un-balanced condition
Figure 4-11: Transformer primary current during the un-balanced condition
Figure 4-12 shows a significant decline in red phase voltage on the transformer secondary as load 4 was
being added in the system and Figure 4-13 also shows significant amount of an increased current in the
red phase as load 4 was being added.

33
Figure 4-12: Transformer secondary voltage during the un-balanced condition
Figure 4-13: Transformer secondary current during the un-balanced condition
Figure 4-14 show the current measured on each load before load 4 is added and after load 4 was added.
It shows load 4 drawing 0A at beginning and started to pick-up load at 0.05s where upon it is now equal
to load 1 current. There was also a slight increase in load 2 and 3 that was observed after 0.05s.
Figure 4-14: Current drawn by each load during an un-balanced load condition

34
4.5 Three Phase Normal Load Condition
In this condition all three phase loads were switched on from the beginning of the simulation by closing
their respective breakers in order to stablish the base for the three phase system. Figure 4-15 shows the
rated primary voltage and Figure 4-16 show the current being drawn by the loads on the primary side.
In Figure 4-15 the primary voltage dropped from 11.16 kV to 10.49 kV representing a voltage drop of
1.88% of the expected primary voltage. Figure 4-16 also show current of 6.8A which is also around the
3.9% of the expected value.
Figure 4-15: Transformer primary voltage during normal load condition
Figure 4-16: Transformer primary current during normal load condition
Figure 4-17 shows the secondary voltage of the transformer and Figure 4-18 shows the current being
drawn by loads. In Figure 4-17 it is shown that the voltage on the transformer secondary dropped from
405 V to about 380.8 V as soon as the loads were connected .This is an acceptable drop in voltage of
about 6.25% of the initial voltage.

35
Figure 4-17: Transformer secondary voltage during normal load condition
Figure 4-18: Transformer secondary current during normal load condition
As depicted by Figures 4-19, 4-21 and 4-23 the voltage across each phase of the load is 217 V which is
1.3% of the expected 220 V while on the other Figures 20, 22 and 24 show the current by each phase
of the load being 61.72 A to 61.91 which is about 2.8% more than the expected current of 60 A.
Figure 4-19: Load 1 Voltage during normal load condition
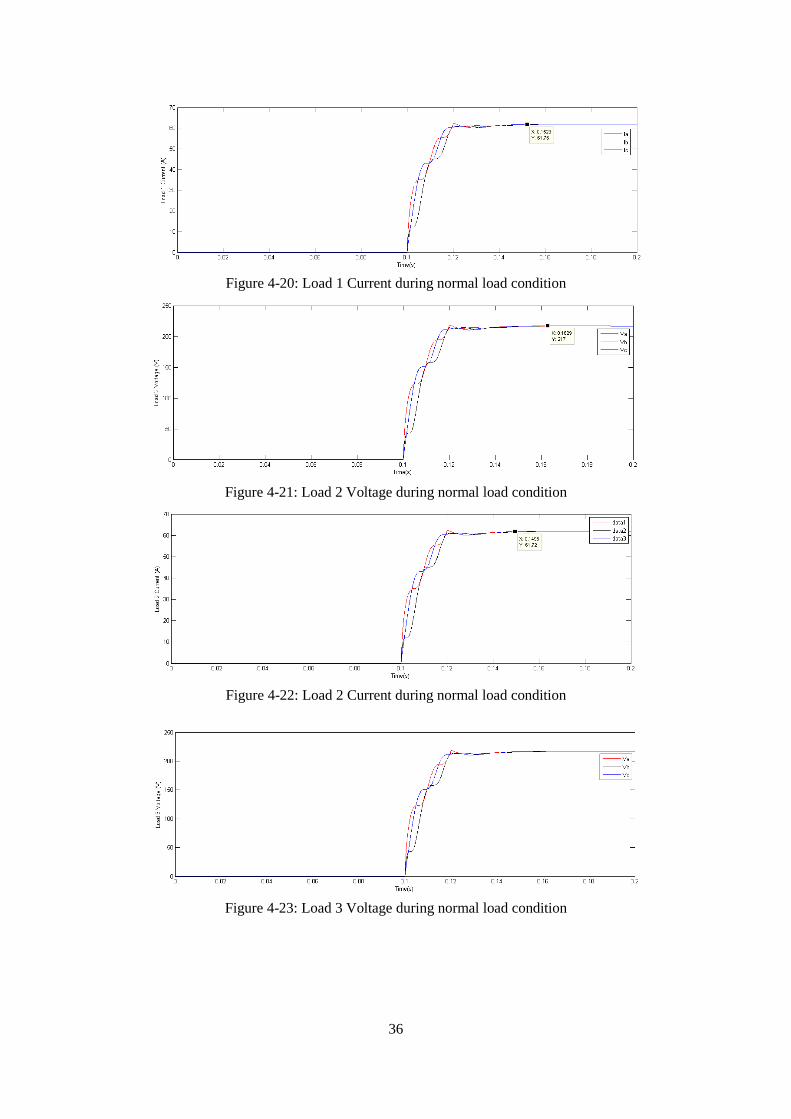
36
Figure 4-20: Load 1 Current during normal load condition
Figure 4-21: Load 2 Voltage during normal load condition
Figure 4-22: Load 2 Current during normal load condition
Figure 4-23: Load 3 Voltage during normal load condition

37
Figure 4-24: Load 3 Current during normal load condition
The graphical are summarized in tables that show voltage and current parameters on the primary and
the secondary of the transformer. The results show some phase to ground and phase to neutral on some
occasion; this was done to show that it works since the fault simulation that was intended were ingle
phase to ground faults.
Table 4-1 Preliminary Results
Parameter No Load
Condition
Balanced
Single phase
condition
Unbalanced Single
phase condition
Three Phase
condition
Vprim-r 11.16 kV 10.96 kV 10.85 kV 10.49 kV
Vprim-w 11.16 kV 10.96 kV 10.85 kV 10.49 kV
Vprim-b 11.16 kV 10.96 kV 10.85 kV 10.49 kV
Iprim-r 0.0833 A 2.188 A 2.88 A 6.8 A
Iprim-w 0.0833 A 2.188 A 2.88 A 6.8 A
Iprim-b 0.0833 A 2.188 A 2.88 A 6.8 A
Vsec-r 405 V 230.1 V 152 V 380.8 V
Vsec-w 405 V 230.1 V 252 V 380.8 V
Vsec-b 405 V 230.1 V 252 V 380.8 V
Isec-r 0 A 57.83 A 82.96 185.2 V
Isec-w 0 A 57.83 A 65 A 185.2 V
Isec-b 0 A 57.83 A 65 A 185.2 V

38
4.6 Chapter Conclusion
From all the preliminary results achieved so far, the values of the parameters were within the tolerable
error margin less than 6.5% which represents the typical plant values being expected from the
simulation. This was a great milestone achieved that lead to the next phase of the project where the
behavior of the three earthing systems under various scenarios were studied.

39
Chapter 5 : Main Simulation Results and Analysis
5.1 Introduction
This section of the research focusses on the comparative analysis of the three earthing systems so as to
understand the main concepts of how to select the best earthing methods. The results documented in
section 5.2 onwards demonstrate the behaviour of the three earthing systems configured according to
the three phase system and the single phase (balanced and unbalanced load systems) where different
faults are applied on the customer’s side and also on the source side of the transformer (transformer
primary). The aim of these tests was to understand the behavior of each earthing system under the
different scenarios with primary focus being on both the voltage and current parameters at different
points of the power system.
Prior to carrying out the comparative analysis, the IT system (un-earthed earthing system) was studied
in detailed for all the fault conditions. The primary aim was to first understand how the system would
behave if unearthed.
The following scenarios were studied and recorded for the comparative analysis of the three earthing
systems:
Customer Single Phase 1st Fault Behaviour .
Customer Single Phase 2nd Fault Behaviour (Applicable to IT).
Utility Single Phase Fault Behaviour .
Loss of Neutral and customer single phase fault Behaviour .
Loss of Neutral and utility voltage single phase fault Behaviour .
Double Fault Condition (only applicable to IT).
The behaviour of the three earthing systems (IT, TT and TN-C) were then observed when applying
various fault conditions and recorded on the bar-charts for the proper analysis of the various earthing
systems. The primary aim was to compare the unearthed neutral earthing system (IT) to the other two
earthed neutral earthing systems (TT and TN-C)
In order to understand the behaviour of each earthing system under different operating conditions the
following parameters were monitored and plotted graphically for each scenario:
Transformer primary voltage
Transformer primary current
Transformer secondary voltage
Transformer secondary current
Customer side currents

40
5.2 Behaviour of the unearthed system (IT System)
This earthing system was configured in balanced single phase, unbalanced single phase and three phase
system. Various simulation conditions were simulated in order to understand the behaviour of the IT-
System in order check alignment with literature. The primary objective of this section is to show how
results were achieved for various conditions so as to understand how the data was populated for the bar
chart analysis in section 5.2 where the three earthing systems are compared. The first sets of graphs
used for analysis are the various responses of the IT earthing system.
5.2.1 Balanced single phase system results
During this simulation, the breakers of load 1 connected between red phase and neutral, load 2
connected between white and neutral and load 3 connected between blue phase and neutral are switched
on at zero seconds in order to simulate the balanced three phase system where all the loads are of equal
magnitude. Load 4 connected to red phase and neutral was not switched on at this stage as it would
introduce an imbalance in the system. The simulation scenarios were then studied from the yielded
results.
5.2.1.1 IT Customer Single Phase Fault Behaviour (1st Fault)
In this scenario a fault was applied on load where the red phase was connected to ground, the aim of
the test was to see how the IT system would respond to this kind of fault. Single phase to ground fault
of particular interest as they are faults that are common in daily operations and domestic circuits [4].
During the simulation, the voltage and current parameters are monitored on the utility transformer
primary and secondary sides and also on all the loads so as to check the impact these faults would have
in the IT earthing system.
(i) Figure 5-1 depicts the behaviour of the voltage in an IT system during the single phase to ground
fault at customer load 1 that was connected on the red phase. The voltage in the red and blue phase
dropped from the 11.16 kV to 10.59 kV while the white phase was constant at 11.16 kV. This behaviour
was due to the delta connection on the primary windings of the transformer. It is evident that there is
slight voltage unbalance on the MV side of the transformer due to the fault.

41
Figure 5-1: IT transformer primary voltage
(ii) Figure 5-2 depicts the fault current response where both the red and white phase rises from
2.163 A to 4.72 A, that is about twice the nominal current of the system which could be easily mistaken
with the normal overload current. The current circulation between the red and the white phase is also
due to the delta connection of the primary winding. This current value does show that in an IT system
the fault current is insignificant to the extent that protection might not detect it. This also gives assurance
that faults happening on the customer do reflect on the utility’s side.
Figure 5-2: IT transformer primary current
(iii) Figure 5-3 depicts the voltage behaviour on the utility transformer secondary winding where
voltage on the faulty phase drops from 217 V to 45, 42 V .This is however in alignment with equation
1 where the safe voltage that can go through a human should be less than 50 V. The white phase and
blue phase voltage rise to 356, 1 V and 346, 7 V respectively as they compensate for voltage drop in
the red phase. This overvoltage is about 64.1% of the normal voltage. The overvoltage is an expected
response from literature in an IT earthing system. The expectation is that during this kind of fault the
voltage must rise to line voltage i.e. √3 .Vphase i.e. 400V which means there is an error margin of
10.83% and 13.34% for the white and blue phase respectively.

42
Figure 5-3: IT transformer secondary voltage
(iv) Figure 5-4 depicts the fault current response on the secondary of the utility transformer where
the faulted phase rises from normal current to 145.8 A which is about 2.43 times the normal current.
John Gardner and Joe Alanis in [26] stated that the fault current in IT systems that configured in IEC
are typically limited to low range of 200 A .The other two phases, white and the blue phases also rise
slightly to 89.84 A and 86.84 A respectively in order to compensate for the change in current in the red
phase.
Figure 5-4: IT transformer secondary current
(v) Figure 5-5 depicts the voltage response across the loads during this kind of a fault where the
voltage across load 1 connected on red phase drops to 0 V, voltage across load 2 rises slightly to 296.9
V, voltage across load 3 drops to 115, 7 V and the voltage across load 4 also connected to red phase but
not switched on during this simulation is always 0 V. The healthy phases behave like this due to the
fault condition.
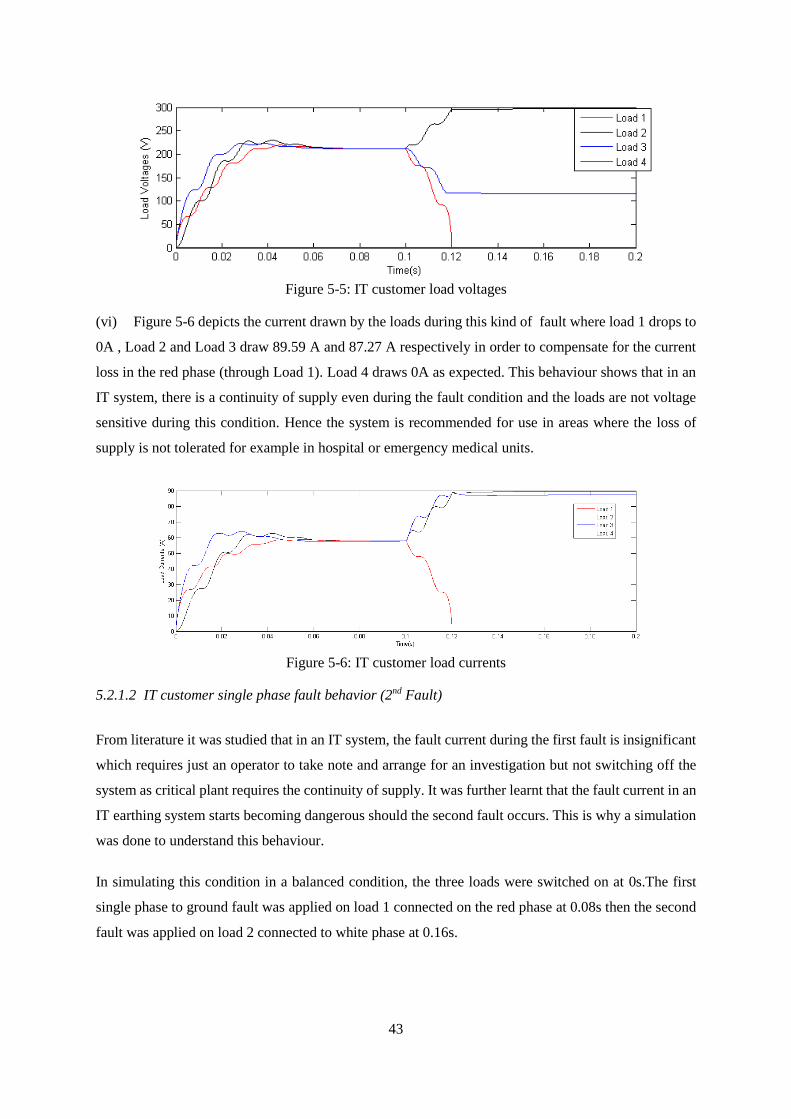
43
Figure 5-5: IT customer load voltages
(vi) Figure 5-6 depicts the current drawn by the loads during this kind of fault where load 1 drops to
0A , Load 2 and Load 3 draw 89.59 A and 87.27 A respectively in order to compensate for the current
loss in the red phase (through Load 1). Load 4 draws 0A as expected. This behaviour shows that in an
IT system, there is a continuity of supply even during the fault condition and the loads are not voltage
sensitive during this condition. Hence the system is recommended for use in areas where the loss of
supply is not tolerated for example in hospital or emergency medical units.
Figure 5-6: IT customer load currents
5.2.1.2 IT customer single phase fault behavior (2nd Fault)
From literature it was studied that in an IT system, the fault current during the first fault is insignificant
which requires just an operator to take note and arrange for an investigation but not switching off the
system as critical plant requires the continuity of supply. It was further learnt that the fault current in an
IT earthing system starts becoming dangerous should the second fault occurs. This is why a simulation
was done to understand this behaviour.
In simulating this condition in a balanced condition, the three loads were switched on at 0s.The first
single phase to ground fault was applied on load 1 connected on the red phase at 0.08s then the second
fault was applied on load 2 connected to white phase at 0.16s.

44
(i) Figure 5-7 illustrates the voltage response on the primary side of the utility transformer which
shows that the red and blue phases drop to 10.58 kV on the first fault. During the second fault, the red
phase drops further to 7.66 kV while and blue phases drop to 11.12 kV and 10.88 kV respectively.
Figure 5-7: IT transformer primary voltage
(ii) Figure 5-8 illustrates the behaviour of the current during these fault conditions where both the
red and white phase increase to 4.788 A while the blue phase maintains the normal current during the
first fault. During the second fault the faulted phase (white phase) jumps to the 21.82 A while the red
and blue phase increase slightly to 10.76 A and 11,69 A respectively. This proves the fact that an IT
system will start to show significant fault during the second fault and this can also be picked up on the
primary side of the utility transformer.
Figure 5-8: IT transformer primary current
(iii) Figure 5-9 depicts the response of the secondary voltage where the red phase drops to 45.44 V
and the white and blue phases increase to 356.1 V and 346.4 V respectively during the first fault. During
the second fault, the red and white phases converge at 164.2 V and the blue phase drops to 329.2 V.
This behaviour depicts that the white phase got affected by the fault which should be the case. This
could be attributed to the load type that was used.

45
Figure 5-9: IT transformer secondary voltage
(iv) Figure 5-10 illustrates the current behaviour of the IT system at the secondary side of the
transformer. During the first fault the red phase current increase to the fault current of 145.5 A and the
current in white and blue phase increase to 87.5 A. During the second fault both the red and white phase
increased to 526.8A which proved that in the IT system, the phase to ground fault current is quiet
significant during the second fault in the system. However the blue phase dropped slightly to 82.89 A,
indicating the third load was not adversely affected by the faulted loads connected on the red and white
phases.
Figure 5-10: IT transformer secondary current
(v) Figure 5-11 illustrates the voltages across each load during the simulated condition where all the
voltage across load 1 dropped to 0 V as soon as the first fault occurs and the voltage across load 2 and
load 3 increased to 328.6 V and 319.7 V respectively. During the second fault, the voltage across load
1 remains at 0V while the voltage across load 2 drops to 0V and the voltage across the load drop slightly

46
to 302.4 V.
Figure 5-11 IT customer load voltages
(vi) Figure 5-12 illustrates the behaviour of the load currents during this simulated condition
where the current through load 1 drops to zero during the first fault and through the second fault.
During this stage the current through load 2 and load 3 both increase to 89.61 A and 87.19 A
respectively and then the current through load 2 dropped to 0 A and the current in load 3 dropped
slightly to 82.82 A as soon as the second fault was introduced. It can be deduced that the faulted
phases do not affect the healthy customers even during the second fault.
Figure 5-12: IT customer load currents
5.2.1.3 Utility single phase fault behaviour
This condition was simulated in order to check how the fault occurring on the utility system ( be it high
voltage or medium voltage ) would affect the customer downstream in the IT system. From literature it
was learnt that in some earthing system these faults on the primary side of the utility transformer do
migrate to the low voltage side and to some extent affect the connected customers. Hence this condition
was simulated by applying the single phase to ground fault on the primary side of the utility transformer.
(i) Figure 5-13 depicts the effect of the single-phase-to-ground fault on the primary side of the
utility transformer where the both the voltage in the red and blue phases drop to 6.27 kV and 6.43 kV
respectively and the voltage on the white phase drops slightly to 10.96 kV.

47
Figure 5-13: IT transformer primary voltage
(ii) Figure 5-14 illustrates the response of the primary current to the applied single phase to ground
where the current through the red phase starts with a surge of 679.3 A then finally drops to 48.1 A and
the current in the white and blue phase are both 0 A. This surge may be detrimental to the equipment
and sensitive loads.
Figure 5-14: IT transformer primary current
(iii) Figure 5-15 illustrates the behaviour of the IT system on the secondary side of the utility
transformer where by the voltage in the red and the blue phase drop to 131.4 V and 134.8 V respectively
and the white phase maintains the 229.9 V throughout, responding to the utility single phase fault
applied on the primary side of the transformer. This undervoltage in the two phase means that the fault
on the utility side does indeed affect the customers that are connected on the red and the blue phases.
Figure 5-15: IT utility transformer secondary voltage

48
(iv) Figure 5-16 illustrates the behaviour of the IT system on the secondary side of the utility
transformer whereby the current in the red and the blue phase dropped to 33.09 A and 33.94 A
respectively and the white phase maintained the 57.86 A throughout, responding to the utility single
phase fault applied on the primary side of the transformer. This undercurrent in the two phase meant
that the fault on the utility side would affect the customers that are connected on the red and the blue
phases. However the white phase would not be affected by this fault, meaning load 2 operates normally.
Figure 5-16: IT utility transformer secondary current
(v) Figure 5-17 and 5-18 illustrates the voltage and current drawn by the loads respectively and
depicts that the behaviour of the load side was similar to the parameters measured on the secondary
side of the transformer. This in turn shows that their response will not be attributed to the fault that
occurred on the utility side but to the undervoltage and undercurrent that will be associated with the
fault.
Figure 5-17: IT customer load voltages
Figure 5-18: IT customer load currents

49
5.2.1.4 Loss of neutral
This condition was simulated where a circuit breaker was introduced between the high impedance
earthing connected on the transformer neutral and the solid earth. The achieved results were similar to
the results achieved ealier in Section 5.1 for both the normal and fault conditions which proved that the
IT earthing system is indeed not affected by the loss of neutral while this condition was proved to affect
other earthing systems. This condition was explored further in the report where the other earthing
system were studied and compared to the IT system. The results also proved what was stated in [49]
and [40] where the IT system was not affected by the loss of neutral as the behavior remain the same.
5.2.2 Unbalanced single phase system
This condition was simulated in order to study behavior of the IT system when the loads are not equally
balanced. This is done by first closing the load breakers of the three loads in a balanced system and then
closing the load breaker of load 4 at 0.05s which now rendered the system as an unbalanced system.
The unbalanced system proved to behave the same as the balanced system during the fault application.
The results demonstrated are only for a single phase fault. This indicates that the system responded to
the additional load that introduced the unbalanced but this unbalanced effect did not affect the fault
current value in the system. However all results are displayed in Section 5.2 in the form of bar charts
where all the earthing systems were compared.
To simulate this behavior of the customer fault, the fourth load connected to the red phase was switched
on at 0.05s in order to configure the system to be an unbalanced arrangement. The single phase to
ground fault was applied on the first customer connected to the red phase. The primary objective of this
test was to illustrate that the load would not affect the fault current for the earthing arrangement.
(a) Figure 5-19 illustrates the primary voltage response under this condition where voltage in the red
and blue phases drop to 10.85 kV and the voltage in the white phase drop slightly to 11.10 kV as soon
as the fourth load is introduced. After the fault was applied at 0.1s, the voltage in the red and blue phases
dropped further to 10.59 kV and the voltage in the white phase increased slightly to 11.17 kV. This is
a behaviour that was experienced on the balanced system as well as during the fault application. This
shows that the addition of the load in the system plays no significant role to the determination of the
response to a fault application.

50
Figure 5-19: IT transformer primary voltage
(b) Figure 5-20 illustrates the primary current response under this condition where current in the red
and white phases increase to 2.879 A and the current in the blue phase to 2.159 A as soon as the fourth
load was introduced. After the fault was applied at 0.1s, the current in the red and white phases increased
further to 4.727 A and 4.814 A respectively while the current in the blue phase remained at 2.159 A.
That was a behaviour experienced on the balanced system as well as during the fault application. This
shows that the addition of the load in the system plays no significant role the determination of the
response to a fault application. It is also evident that the effects on the white phase are due to a delta
connection on the primary side where the red phase is connected to the white phase.
Figure 5-20: IT transformer primary current
(c) Figure 5-21 illustrates the secondary voltage response under this condition where voltage in the red
phase dropped to 176.8 V and the voltage in the white and blue phases increased to 257.5 V as soon as
the fourth load was introduced. After the fault was applied at 0.1s the voltage in the red phase dropped
to 45.46 V and the voltage in the white and blue phases increased to 356.1 V and 346.8 V respectively.
This was a behaviour experienced on the balanced system during the fault application which shows that
the addition of the load in the system plays no significant role the determination of the response to a
fault application. However the voltage in the red phase dropped voltage also less than 50 V during the
fault condition.

51
Figure 5-21: IT Transformer secondary voltage
(d) Figure 5-22 illustrates the secondary current response under this condition where current in the red
phase was 82.75 A and the current in the white and blue phases is 64.78 A as soon as the fourth load
was introduced. After the fault was applied at 0.1s, the current in the red phase current increased to
145.8 A and current in the white and blue phases increased further to 89.6 A and 87.27 A respectively.
This was the behaviour experienced on the balanced system as well during the fault application which
shows that the addition of the load in the system plays no significant role the determination of the
response to a fault application. The circulation of current in the red and white phases was experienced
as result of the delta connection on the primary side of the transformer.
Figure 5-22: IT secondary current
(e) Figure 5-23 illustrates the load voltage response under this condition where the voltage across load
1 and load 4 dropped to 151.9 V and the voltage across load 2 and load 3 increased slightly to 237.6 V
as soon as the fourth load was introduced. After the fault is applied at 0.1s, the voltage across load 1
and load 4 drops to 0V and the voltage across load 2 increased to 297 V while voltage across load 3
dropped to 115.7 V. This behaviour is slightly different from what was experienced on the balanced
system as well as during the fault application. This shows that the addition of the load in the system
plays no significant role the determination of the response to a fault application.
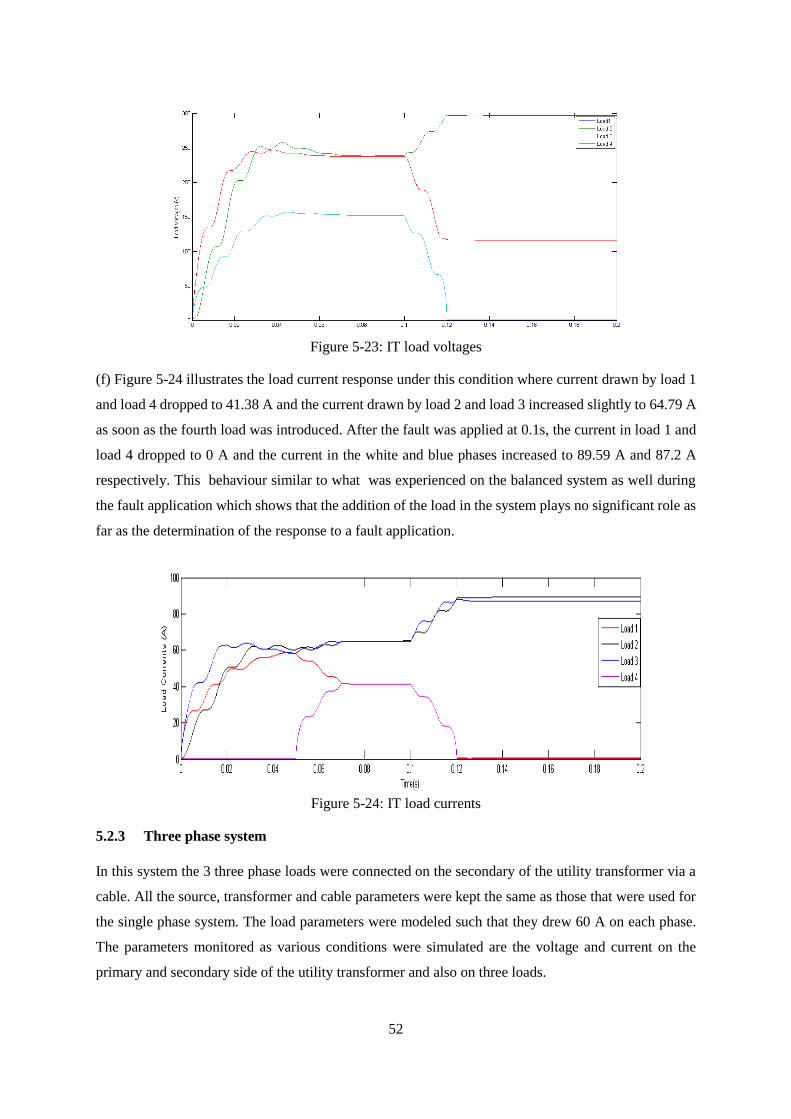
52
Figure 5-23: IT load voltages
(f) Figure 5-24 illustrates the load current response under this condition where current drawn by load 1
and load 4 dropped to 41.38 A and the current drawn by load 2 and load 3 increased slightly to 64.79 A
as soon as the fourth load was introduced. After the fault was applied at 0.1s, the current in load 1 and
load 4 dropped to 0 A and the current in the white and blue phases increased to 89.59 A and 87.2 A
respectively. This behaviour similar to what was experienced on the balanced system as well during
the fault application which shows that the addition of the load in the system plays no significant role as
far as the determination of the response to a fault application.
Figure 5-24: IT load currents
5.2.3 Three phase system
In this system the 3 three phase loads were connected on the secondary of the utility transformer via a
cable. All the source, transformer and cable parameters were kept the same as those that were used for
the single phase system. The load parameters were modeled such that they drew 60 A on each phase.
The parameters monitored as various conditions were simulated are the voltage and current on the
primary and secondary side of the utility transformer and also on three loads.

53
5.2.3.1 IT customer fault
(i) Figure 5-25 depicts the behaviour of the voltage in an IT system during the single phase to ground
fault at customer load 1 that was connected on the red phase on the three phase system. The voltage in
the red and blue phase dropped from the 10.48 kV to 9.57 kV while the white phase voltage increased
slightly to 10.91 kV. This behaviour is due to the heavy loading of the three phases and delta connection
on the primary winging of the transformer.
Figure 5-25: IT three phase system primary voltage
(ii) Figure 5-26 depicts the fault current response where the white phase rise from 6.85A to 13.46A,
the red phase rises from 6.85 A to 12.69 A and the blue phase remains constant at 6.85A.The current in
the red and white phases is about twice the nominal current of the system which can be easily mistaken
with the normal overload current. The current circulation between the red and the white phase is also
due to the delta connection of the primary winding. This current value does show that in an IT system
the fault current is insignificant in a way that protection might not even detect it. This also gives
assurance that faults happening on the customer do reflect on the utility’s side
Figure 5-26: IT three phase system primary current
(iii) Figure 5-27 depicts the voltage behaviour on the utility transformer secondary winding where all
the voltage in all phases dropped to 381 V as soon as the loads are introduced in the system. As soon as
the red phased to ground was introduced on one load, voltage on the red and white phases dropped from

54
381 V to 380.9 V and the voltage in the blue phase dropped from 381 V the to 334.6 V during the fault
condition.
Figure 5-27: IT three phase system secondary voltage
(iv) Figure 5-28 depicts the behaviour of the secondary current during the red-phase-to-ground
customer fault, whereby upon current in faulted phase increased from 185.4 A to 396.9 A and increased
slightly on the white and blue phase to 269.4 A and 241.6 A respectively in order to balance the rise in
the red phase. It is also evident that the current in the faulty phase almost doubled the nominal current
which was similar to the behaviour of the single phase system.
Figure 5-28: IT three phase system secondary current
(v) Figures 5-29, 5-31 and 5-33 depict the voltage behaviour of the load 1 during the customer fault
condition where the current in the red phase drops to 0V while the white and blue phase increased to
362,6 V and 327,3 V respectively , current on the white and blue phase increased to 89.89 A and 80.25
A respectively.

55
Figure 5-29: IT three phase system load 1 voltage
(vi) Figures 5-30, 5-32 and 5-34 depict the current behaviour of the loads during the customer fault
condition where the current in the red phase drops from 61.82 A to 16.82 A , current on the white and
blue phase increased to 89.89 A and 80.25 A respectively
Figure 5-30: IT three phase system load 1 current
Figure 5-31: IT three phase system load 2 voltages

56
Figure 5-32: IT three phase system load 2 current
Figure 5-33: IT three phase system load 3 voltages
Figure 5-34: IT three phase system load 3 current
5.1.1.1 IT utility fault behaviour
(i) Figure 5-35 depicts the voltage behaviour on the primary side of the transformer during the utility
fault whereby the voltage in the red and the blue phase dropped from 10.47 kV to 5.874 kV and 6.353
kV respectively while the voltage in the white phase was kept constant. The behaviour of the red and
blue phase was due to the delta connection on the primary windings.
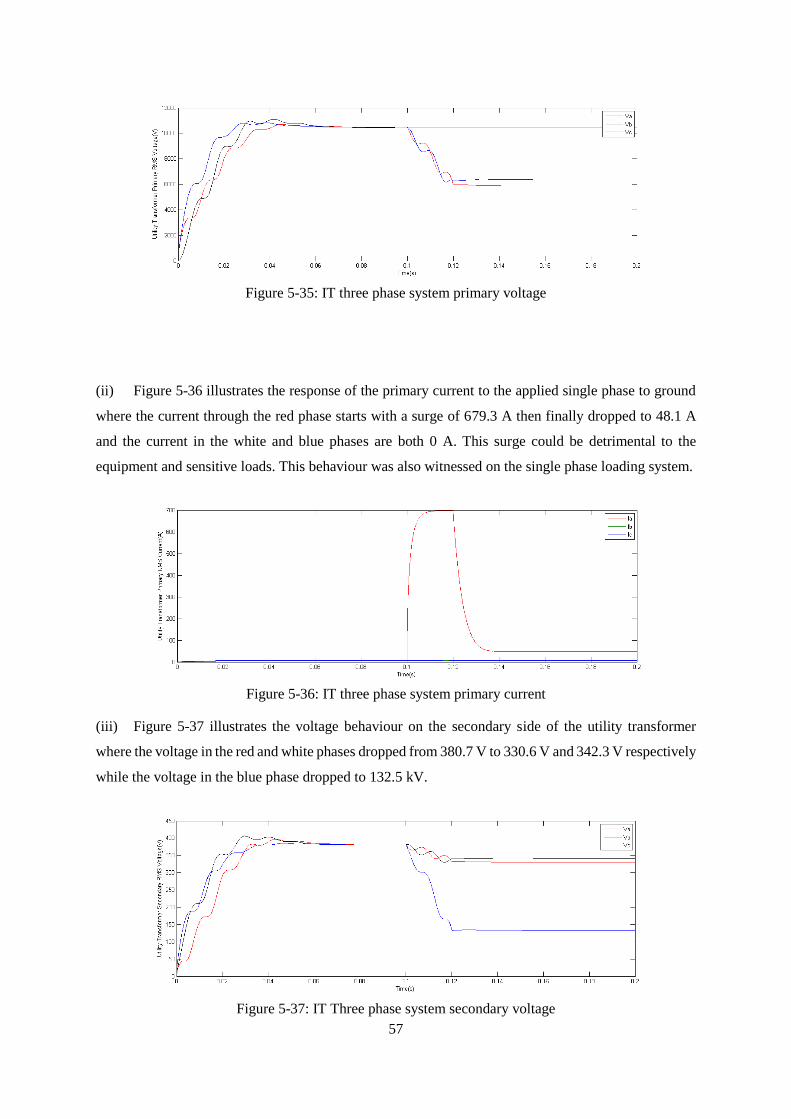
57
Figure 5-35: IT three phase system primary voltage
(ii) Figure 5-36 illustrates the response of the primary current to the applied single phase to ground
where the current through the red phase starts with a surge of 679.3 A then finally dropped to 48.1 A
and the current in the white and blue phases are both 0 A. This surge could be detrimental to the
equipment and sensitive loads. This behaviour was also witnessed on the single phase loading system.
Figure 5-36: IT three phase system primary current
(iii) Figure 5-37 illustrates the voltage behaviour on the secondary side of the utility transformer
where the voltage in the red and white phases dropped from 380.7 V to 330.6 V and 342.3 V respectively
while the voltage in the blue phase dropped to 132.5 kV.
Figure 5-37: IT Three phase system secondary voltage
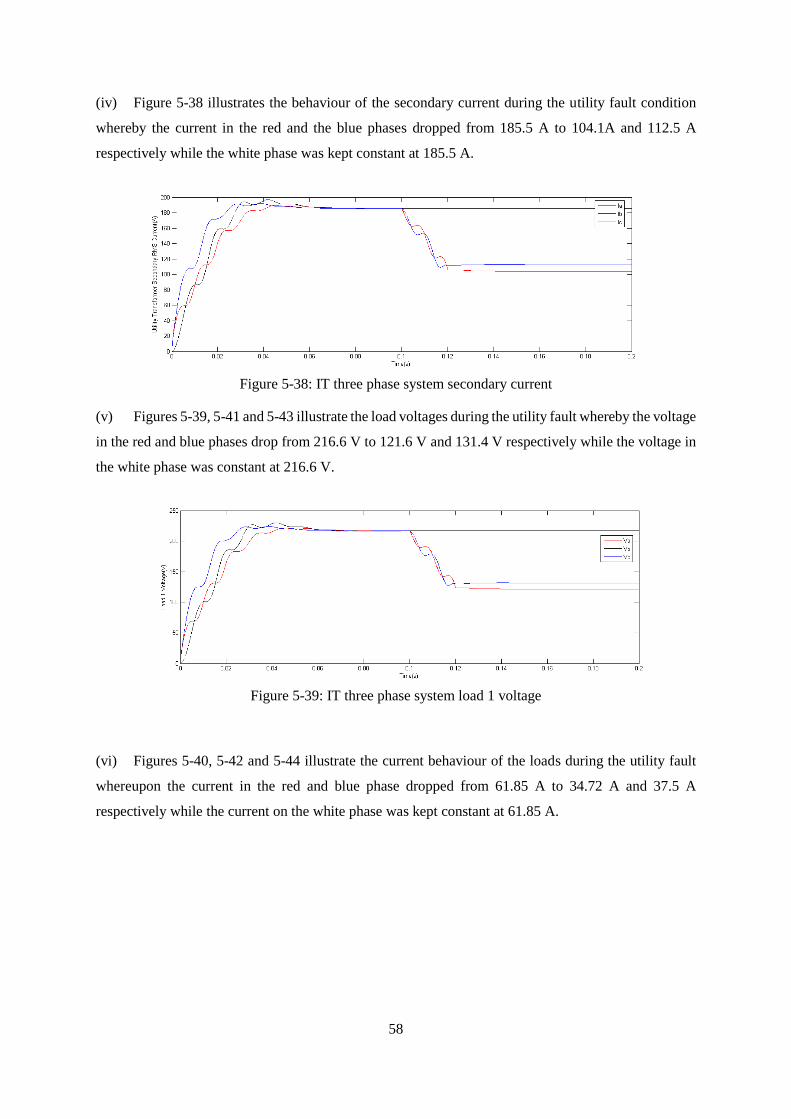
58
(iv) Figure 5-38 illustrates the behaviour of the secondary current during the utility fault condition
whereby the current in the red and the blue phases dropped from 185.5 A to 104.1A and 112.5 A
respectively while the white phase was kept constant at 185.5 A.
Figure 5-38: IT three phase system secondary current
(v) Figures 5-39, 5-41 and 5-43 illustrate the load voltages during the utility fault whereby the voltage
in the red and blue phases drop from 216.6 V to 121.6 V and 131.4 V respectively while the voltage in
the white phase was constant at 216.6 V.
Figure 5-39: IT three phase system load 1 voltage
(vi) Figures 5-40, 5-42 and 5-44 illustrate the current behaviour of the loads during the utility fault
whereupon the current in the red and blue phase dropped from 61.85 A to 34.72 A and 37.5 A
respectively while the current on the white phase was kept constant at 61.85 A.
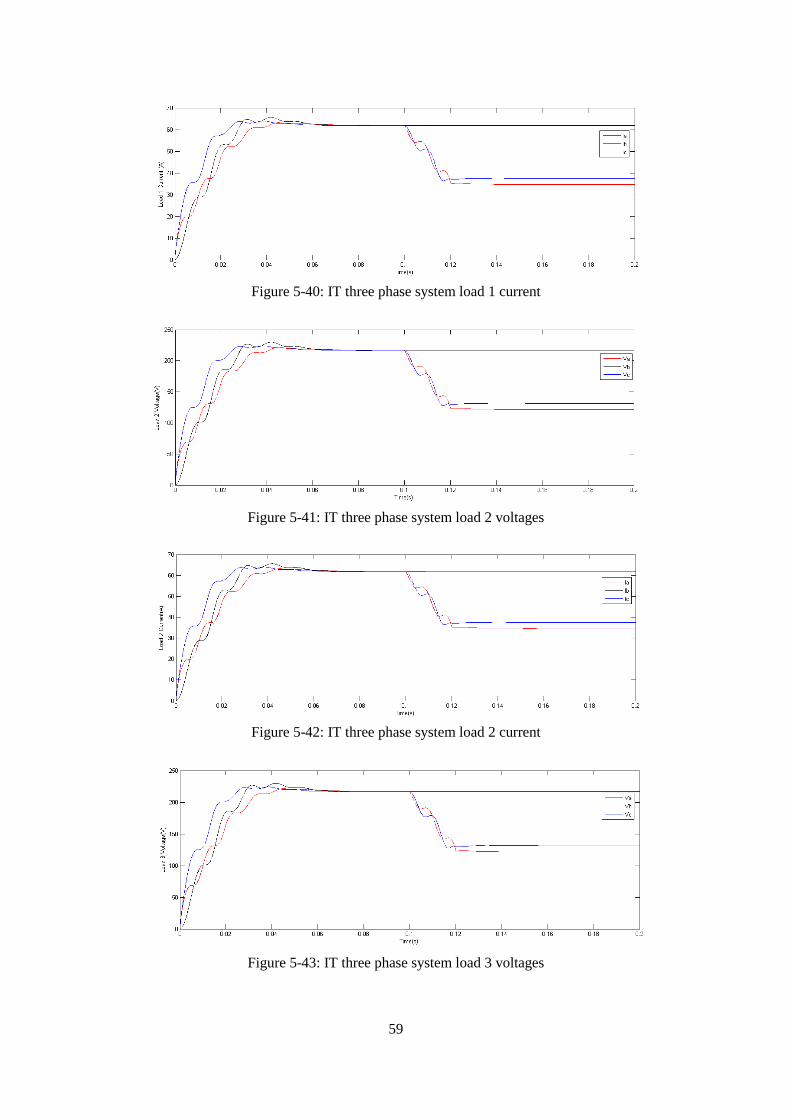
59
Figure 5-40: IT three phase system load 1 current
Figure 5-41: IT three phase system load 2 voltages
Figure 5-42: IT three phase system load 2 current
Figure 5-43: IT three phase system load 3 voltages

60
Figure 5-44: IT three phase system load 3 current
5.3 Comparison of the earthing systems
This section of the document discusses the comparison that was conducted among the three earthing
systems where the TT and TN-C (earthed systems) were compared against the IT (unearthed systems)
in order to study the effect of neutral earthing in the LV network. The models were configured in TT
and TN-C and single phase to ground faults were applied both on the customer side (load side) and the
utility side (primary of the secondary).The results were plotted in RMS values as previously done for
the IT system and populated into the bar-charts for comparison and analysis.
The comparison was done for the following scenarios:
Balanced single phase system
Unbalanced single phase system
Three phase system
5.3.1 Balanced Single Phase Results (Customer Fault)
(a) Figure 5-45 (a) illustrates the primary voltage and Figure 5-45 (b) the primary current for all the
earthing systems under a condition when a single phase fault on the red phase was applied on one of
the load side .Due to a delta connection, it was noticed in Figure 5-45 (a) the voltage decreased and was
significant for the TN-C system. However in terms of current in Figure 5-45(b) the TN-C system shows
high fault current in the red and white phase, due to the delta connection of the primary winding. The
fault current measured for the TN-C was almost 3 times of that measured for the IT and the TT.

61
Figure 5-45: Comparison of the primary parameters comparison during the customer fault
(b) Figure 5-46 (a) illustrates the secondary voltage during this kind of fault where the voltage
approached zero for the three earthing systems and where there was an over voltage experienced on the
healthy phases (white and blue) on the IT and TT which was almost equal √3 Vnominal. Figure 5-46
(b) illustrates the secondary current for all the earthing systems under a condition when a single phase
fault on the red phase was applied on one of the loads. In terms of current in figure the TN-C system
shows high fault current in the red and white phase this also due to the delta connection of the primary
winding. The fault current measured for the TN-C was almost 5 times of that measured for the IT and
the TT. For the IT and TT systems, the fault current measurement was slightly higher than the nominal
current of 60 A, this might not be picked up by the protection equipment.
Figure 5-46: Comparison of the secondary parameters during the customer fault
(c) Figure 5-47 (a) shows voltages measured across the loads which depicts no voltage for the faulted
phase where load 1 was connected and where load 4 was connected. Load 4 was not switched on at this
stage, hence there was no voltage measured. An overvoltage higher than the one measured for IT and
TN-C was measured in the TT system on load 2 and 3 connected in white and blue phases respectively.
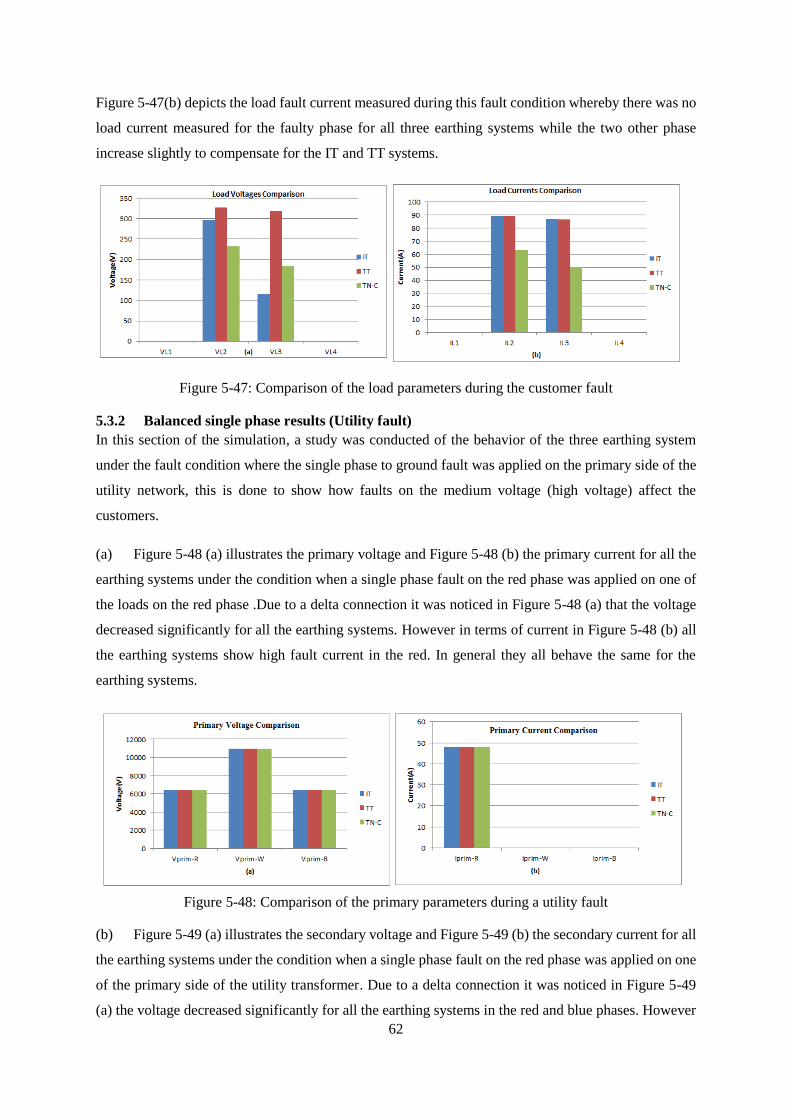
62
Figure 5-47(b) depicts the load fault current measured during this fault condition whereby there was no
load current measured for the faulty phase for all three earthing systems while the two other phase
increase slightly to compensate for the IT and TT systems.
Figure 5-47: Comparison of the load parameters during the customer fault
5.3.2 Balanced single phase results (Utility fault)
In this section of the simulation, a study was conducted of the behavior of the three earthing system
under the fault condition where the single phase to ground fault was applied on the primary side of the
utility network, this is done to show how faults on the medium voltage (high voltage) affect the
customers.
(a) Figure 5-48 (a) illustrates the primary voltage and Figure 5-48 (b) the primary current for all the
earthing systems under the condition when a single phase fault on the red phase was applied on one of
the loads on the red phase .Due to a delta connection it was noticed in Figure 5-48 (a) that the voltage
decreased significantly for all the earthing systems. However in terms of current in Figure 5-48 (b) all
the earthing systems show high fault current in the red. In general they all behave the same for the
earthing systems.
Figure 5-48: Comparison of the primary parameters during a utility fault
(b) Figure 5-49 (a) illustrates the secondary voltage and Figure 5-49 (b) the secondary current for all
the earthing systems under the condition when a single phase fault on the red phase was applied on one
of the primary side of the utility transformer. Due to a delta connection it was noticed in Figure 5-49
(a) the voltage decreased significantly for all the earthing systems in the red and blue phases. However

63
in terms of current in Figure 5-49 (b) all the earthing systems show a slight under current in the red and
blue phases as a result of the decrease in voltage. In general they all behave the same for the earthing
systems.
Figure 5-49: Comparison of the secondary parameters during a utility fault
(c) Figure 5-50 (a) depicts the voltage across the load during the utility fault with load 4 not yet
connected since it was a balanced condition scenario. Figure 5-50 (b) depicts the current behaviour of
the loads. The behaviour of the three earthing systems was similar for values measured on the load side
where under voltage and under current were experienced on the red and the blue phases.
Figure 5-50: Comparison of the load parameters during a utility fault
5.3.3 Balanced single phase loss of neutral (Customer Fault)
In this section, a loss of neutral condition was simulated for all the earthing system. This was done to
test which system would likely be affected by this condition as a loss of neutral happens from time to
time in the system due to various causes e.g. copper theft, load balance condition, a shift in the star
connection etc. The results shown by the following figures illustrate the voltage and current behavior
of the various earthing system when a loss of neutral and the fault at the customer’s side occurs.
(a) Figure 5-51 (a) illustrates that voltage on the primary is largely reduced in the TN-C system and
Figure 5-51 (b) showed a high fault current experienced in the TN-C on the red and white phases. Where
there is voltage decline in phases red and blue that is significant for the TN-C system. There was also a
high fault current experienced by the TN-C system on the red and white phases.

64
Figure 5-51: Comparison of primary parameters during a customer fault and a loss of neutral
(b) Figure 5-52 (a) depicts the secondary voltage behaviour of the three earthing systems during the
loss of neutral and the customer fault. The voltage decreases in the red phase and there was an over-
voltage in the white and blue phase close to √3 times the nominal voltage.
This was normal for the IT and TT system where there was an over-voltage during the fault occurrence
but abnormal for the TN-C as the TN-C does not experience any over-voltage during voltage but shows
significant fault current. This over-overvoltage in the TN-C occurred as a result of the loss of neutral,
this behaviour proved the statement alluded by V Cohen in [40].Another observation to note was in
Figure 5-52 (b) where the fault current measured in the red phase was similar for all three earthing
system. This implies that the loss of neutral also affects the fault detection of the TN-C system.
Figure 5-52: Comparison of secondary parameters during a customer fault and a loss of neutral
(c) Figure 5-53 also illustrates the overvoltage experienced by the loads even for the TN-C which is
unusual and the current being similar to the TT and IT systems. This is quite dangerous for the loads.
Figure 5-53: Comparison of the load parameters during a customer fault and a loss of neutral

65
5.3.4 Balanced single phase loss of neutral (Utility fault)
(a) Figure 5-54 (a) illustrates the voltage on the primary side of the utility transformer during the
single phase to ground fault on the utility side. It can be deduced that during the utility fault there was
an under voltage on the red and the blue phases that may cause power quality problems on the low
voltage side and that all the three earthing systems behave the same for this kind of fault. Figure 5-54
(b) depicts a high fault current experienced by all three earthing systems on the red phases.
Figure 5-54: Comparison of the primary parameters during a utility fault and a loss of neutral
(b) Figure 5-55 (a) illustrates the voltage on the secondary side of the utility transformer during the
single phase to ground fault on the utility side. It can be deduced that during the utility fault there was
an under voltage on the red and the blue phases that may cause power quality problems on the low
voltage side and that all the three earthing systems behave the same for this kind of the fault. Figure 5-
55 (b) depicts the under current experienced by the red and the blue phases on the secondary side of the
utility transformer as a result of the utility fault.
Figure 5-55: Comparison of the secondary parameters during a utility fault and a loss of neutral
(c) Figure 5-56 (a) illustrates the voltage measured across the loads during the single phase to ground
fault on the utility side. It can be deduced that during the utility fault there was an under voltage on the
red and the blue phases that may cause power quality problems on the low voltage side and that all three
earthing systems behave the same for this kind of the fault. This under voltage may also lead to
unavailability of sufficient power for operation of loads. Figure 5-56 (b) depicts a low current
experienced by all three earthing systems on the all phase that is almost half the normal rating.

66
Figure 5-56: Comparison of the load parameters during a utility fault and a loss of neutral
5.3.5 Unbalanced Single Phase Results (Customer Fault)
Figures 5-57, 5-58 and 5-59 illustrate the similar behaviour of the voltage and current of the three
earthing systems under the customer fault in the red phase where both load 1 and load 4 were connected.
In terms of voltage, the IT and TT experienced the overvoltage during the customer faults while in terms
of current the TN-C was able to detect fault current efficiently.
Figure 5-57 Comparison of the primary parameters during a customer fault
Figure 5-58: Comparison of the secondary parameters during a customer fault

67
Figure 5-59: Comparison of the load parameters during a customer fault
5.3.6 Unbalanced single phase results (Utility fault)
Figures 5-60, 5-61 and 5-62 illustrate the similar behaviour of the voltage and current of the three
earthing systems under the utility fault condition. In terms of voltage, the IT and TT experienced the
overvoltage during the customer faults while in terms of current the TN-C was able to detect fault
current efficiently.
Figure 5-60: Comparison of the primary parameters during a utility fault
Figure 5-61: Comparison of the secondary parameters during a utility fault

68
Figure 5-62: Comparison of the load parameters during a utility fault
5.3.7 Unbalanced single phase loss of neutral (Customer fault)
(a) Figure 5-63 (a) depicts the behaviour of the three earthing systems when there was loss of
neutral and the utility fault in the system whereby the primary voltage in (a) increased to an over voltage
on the white phase for all three earthing systems. In Figure 5-63 (b), the primary fault current was
almost double the nominal current in the red and white phase and was kept at nominal on the blue phase.
Figure 5-63: Comparison of the primary parameters during a customer fault and the loss of neutral
(b) Figure 5-64 (a) illustrates the secondary voltage under the loss of neutral and customer fault
condition. The voltage in the red phase (faulty phase) drops close to zero and there was an increase
close to √3 Vnominal in the white phase and blue phase for the three earthing systems. Figure 5-64 (b)
illustrates the behaviour of the secondary fault current which increased by almost double times.
However this also proves that the TN-C system was affected as it experienced the over-voltage and also
got affected by a significant fault current under an abnormal condition.

69
Figure 5-64: Comparison of the secondary parameters during a customer fault and the loss of neutral
(c) Figure 5-65 also depicts the load values where the three system behave similarly when there is
an over voltage experienced by the healthy loads on phases white and blue.
Figure 5-65: Comparison of the load parameters during a customer fault and the loss of neutral
5.3.8 Unbalanced single phase loss of neutral (Utility fault)
Figures 5-66, 5-67 and 5-68 depict voltage and current behaviour that was similar to the balanced system
where the three systems behaved the same for the loss of neutral and the utility fault condition.
Figure 5-66: Comparison of the primary parameters during a utility fault and the loss of neutral
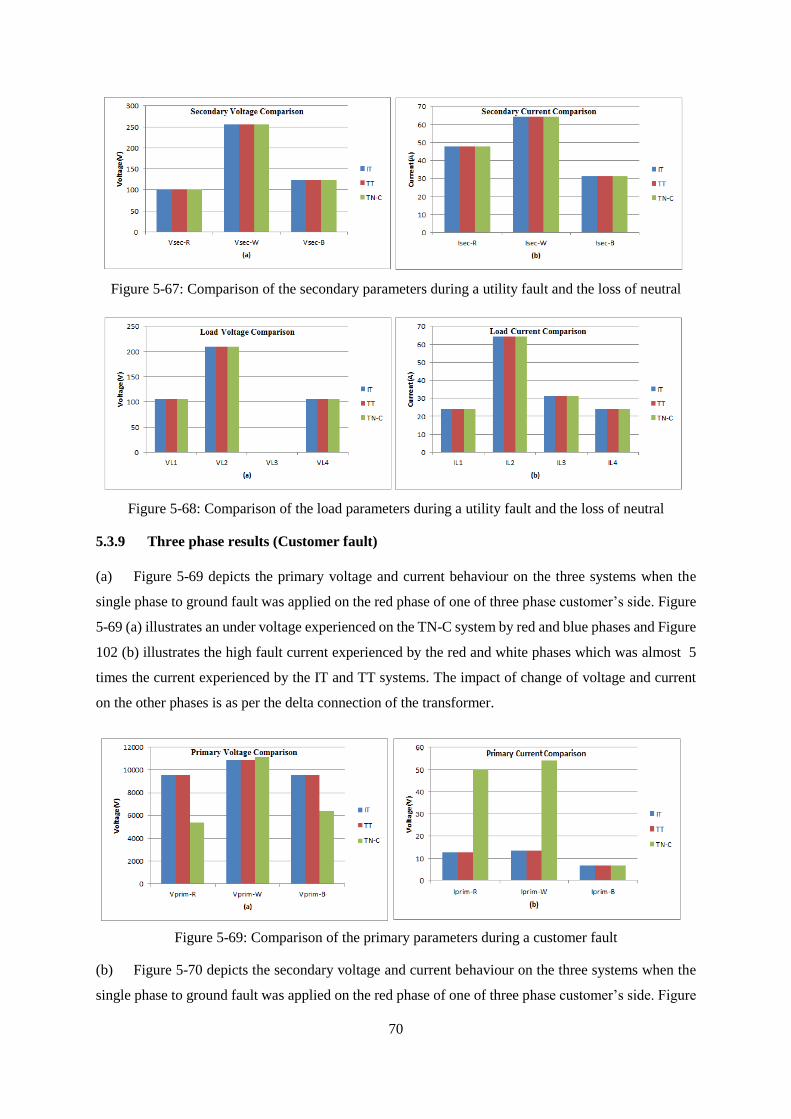
70
Figure 5-67: Comparison of the secondary parameters during a utility fault and the loss of neutral
Figure 5-68: Comparison of the load parameters during a utility fault and the loss of neutral
5.3.9 Three phase results (Customer fault)
(a) Figure 5-69 depicts the primary voltage and current behaviour on the three systems when the
single phase to ground fault was applied on the red phase of one of three phase customer’s side. Figure
5-69 (a) illustrates an under voltage experienced on the TN-C system by red and blue phases and Figure
102 (b) illustrates the high fault current experienced by the red and white phases which was almost 5
times the current experienced by the IT and TT systems. The impact of change of voltage and current
on the other phases is as per the delta connection of the transformer.
Figure 5-69: Comparison of the primary parameters during a customer fault
(b) Figure 5-70 depicts the secondary voltage and current behaviour on the three systems when the
single phase to ground fault was applied on the red phase of one of three phase customer’s side. Figure

71
5-70 (a) illustrates an under voltage experienced on the TN-C system by red and blue phases and Figure
5-70 (b) illustrates the high fault current experienced by the red and white phases that was almost 10
times the nominal current . The impact of change of voltage and current on the other phases is as per
the delta connection of the transformer. This behaviour was quite high as compared to the single phase
system results.
Figure 5-70: Comparison of the secondary parameters during a customer fault
(c) Figures 5-71, 5-72 and 5-73 illustrates that the voltage on the faulted phase was equal to zero as
measured across the loads. There was an overvoltage of almost √3 times Vnominal experienced in the
IT and TT systems .The current on the faulty phase was minimal for the IT and TT system and closed
to zero for the TN-C system. However the current slightly increased on the IT and TT to compensate
for the fault but it slightly decreased on the TN-C system.
Figure 5-71: Comparison of the load 1 parameters during a customer fault

72
Figure 5-72: Comparison of the load 2 parameters during a customer fault
Figure 5-73: Comparison of the load 3 parameters during a customer fault
5.3.10 Three phase results (Utility fault)
(a) Figure 5-74 depicts the primary voltage and current behaviour on the three systems when the
single phase to ground fault was applied on the red phase on the primary side of the utility transformer.
Figure 5-74 (a) illustrates an under voltage experienced in all earthing systems by red and blue phases
and Figure 5-74 (b) illustrates the high fault current experienced by the red phase. This was almost 10
times the nominal current experienced by the IT, TN-C and TT systems.
Figure 5-74: Comparison of the primary parameters during a utility fault
(b) Figure 5-75 depicts the secondary voltage and current behaviour on the three systems when the
single phase to ground fault was applied on the red phase on the primary side of the utility transformer.
Figure 5-75 (a) illustrates an over voltage almost equal to √3 Vnominal on the red and white phases and
an under voltage in the blue phase. This behaviour was experienced similarly in all three earthing
systems. Figure 5-75 (b) illustrates the under current experienced by the red phase and the blue phase
systems while the current in the white phase was kept at nominal current. This is also the case for all
three earthing systems the IT, TT and the TN-C.

73
Figure 5-75 Comparison of the secondary parameters during a utility fault
Figures 5-76, 5-77 and 5-78 also show the similar behaviour for all three systems for values measured
on the load side where there was the under voltage on the red and blue phases and the under current on
the red and blue phase for all three earthing systems.
Figure 5-76: Comparison of the load 1 parameters during a customer fault
Figure 5-77: Comparison of the load 2 parameters during a customer fault
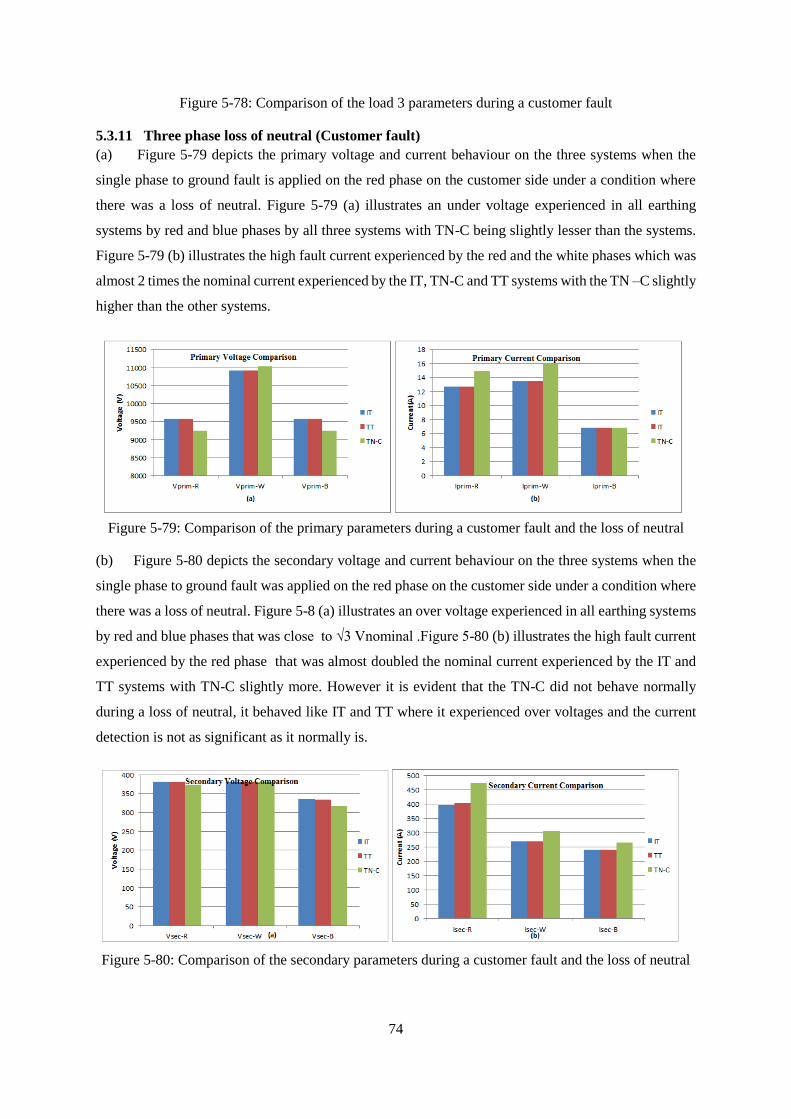
74
Figure 5-78: Comparison of the load 3 parameters during a customer fault
5.3.11 Three phase loss of neutral (Customer fault)
(a) Figure 5-79 depicts the primary voltage and current behaviour on the three systems when the
single phase to ground fault is applied on the red phase on the customer side under a condition where
there was a loss of neutral. Figure 5-79 (a) illustrates an under voltage experienced in all earthing
systems by red and blue phases by all three systems with TN-C being slightly lesser than the systems.
Figure 5-79 (b) illustrates the high fault current experienced by the red and the white phases which was
almost 2 times the nominal current experienced by the IT, TN-C and TT systems with the TN –C slightly
higher than the other systems.
Figure 5-79: Comparison of the primary parameters during a customer fault and the loss of neutral
(b) Figure 5-80 depicts the secondary voltage and current behaviour on the three systems when the
single phase to ground fault was applied on the red phase on the customer side under a condition where
there was a loss of neutral. Figure 5-8 (a) illustrates an over voltage experienced in all earthing systems
by red and blue phases that was close to √3 Vnominal .Figure 5-80 (b) illustrates the high fault current
experienced by the red phase that was almost doubled the nominal current experienced by the IT and
TT systems with TN-C slightly more. However it is evident that the TN-C did not behave normally
during a loss of neutral, it behaved like IT and TT where it experienced over voltages and the current
detection is not as significant as it normally is.
Figure 5-80: Comparison of the secondary parameters during a customer fault and the loss of neutral

75
Figures 5-81, 5-82 and 5-83 illustrate the three load values of voltage and current during this condition
where a fault was applied the red phase of one of the customers and there is a loss of neutral in the
system. The voltage disappeared on the red phase and there was an over voltage on the white and blue
phases. The current slightly increased on the white and blue phases to compensate for current loss in
red phase.
Figure 5-81: Comparison of Load 1 parameters during a customer fault and the loss of neutral
Figure 5-82: Comparison of Load 2 parameters during a customer fault and the loss of neutral
Figure 5-83: Comparison of Load 3 parameters during a customer fault and the loss of neutral
5.3.12 Three phase loss of neutral (Utility fault)
(a) Figure 5-84 depicts the primary voltage and current behaviour on the three systems when the
single phase to ground fault was applied on the red phase on the primary side of the utility transformer.
Figure 5-84 (a) illustrates an under voltage experienced in all earthing systems by red and blue phases
and Figure 5-84 (b) illustrates the high fault current experienced by the red phase that is almost 10
times the nominal current experienced by the IT, TN-C and TT systems.

76
Figure 5-84: Comparison of primary parameters during a utility fault and the loss of neutral
(b) Figure 5-85 depicts the secondary voltage and current behaviour on the three systems when the
single phase to ground fault was applied on the red phase on the primary side of the utility transformer.
Figure 118 (a) illustrates an over voltage almost equal to √3 Vnominal on the red and white phases and
an under voltage in the blue phase. This behaviour was experienced similarly in all three earthing
systems. Figure 118 (b) illustrates the under current experienced by the red phase and the blue phase
systems while the current in the white phase was kept at nominal current. This was also the case for all
three earthing systems the IT, TT and the TN-C.
Figure 5-85: Comparison of secondary parameters during a utility fault and the loss of neutral
Figures 5-86, 5-87 and 5-88 also shows the similar behaviour for all three systems for values measured
on the load side where there was an under voltage on the red and blue phases and the under current on
the red and blue phase for all three earthing systems.
Figure 5-86: Comparison of load 1 parameters during a utility fault and the loss of neutral

77
Figure 5-87: Comparison of load 2 parameters during a utility fault and the loss of neutral
Figure 5-88: Comparison of load 3 parameters during a utility fault and the loss of neutral
5.4 Advantages and disadvantages of the earthing systems
The following advantages and disadvantages were deduced from the simulations checking the various
impacts on the system and the connected loads.
Table 5-1 : Advantages and Disadvantages of the earthing systems
Earthing System Advantages Disadvantages
IT System
Good for service continuity Low fault detection that might
be missed by the circuit
protection
Not affected by the loss of
neutral
Overvoltage on healthy
equipment that may lead to
insulation breakdown
TT System
Faults on the MV and LV side
of the transformer do not
adversely affect the loads
Low fault detection that might
be missed by the circuit
protection
Not affected by the loss of
neutral
Overvoltage on healthy
equipment that may lead to
insulation breakdown
TN-C System
Detection of fault is good (high
fault currents) that will enable
the protection equipment to
clear faults successfully
Low fault detection due to a
loss of Neutral
No overvoltage on the healthy
phases
Experiences overvoltage due to
a loss of neutral

78
5.5 Chapter Conclusion
After studying the behaviour of the three earthing system it is evident that the IT and the TT system
behave similarly where the fault experienced is minimal and would be undetectable by the protection
devices whereas the TN-C earthing arrangement shows a significant amount of the short circuit that
would be detected by the protection devices. It was also learnt there IT and TT experience an
overvoltage during the fault condition whereas the TN-C does. Moreover the TN-C behaves quite like
IT and TT during the loss of neutral where the fault current is minimal and there is also an overvoltage.

79
Chapter 6 : Conclusion and Recommendation
6.1 Conclusion
In setting up the models for simulations and study it was learnt that the basic understanding of the
installation design and circuit parameters is crucial in order to achieve results that can improve the
study. The parameters of the system need to be understood and coordinated well in order for the network
to yield sensible results. These results were recorded in chapter four where preliminary results were
recorded in order to ensure the results make sense according to the calculations where the no load and
load conditions were simulated and all values were plotted in RMS format
At the beginning of the study, it was proved that three earthing systems behaved equivalently under
normal conditions as also stated by literature that so long as rules are followed the three systems will
behave well and protect the human life and equipment as stated in [7]. A comparative study was then
conducted where the three earthing systems were studied for various faults applied on number different
system configurations namely:
The balanced single phase system
The unbalance single phase system
The three phase system
The comparison looked at four different fault conditions namely:
Single phase to ground fault on the customer side
Single phase to ground fault on the utility side
Single phase to ground fault on the customer side with a loss of neutral
Single phase to ground fault on the utility side with a loss of neutral
During the single phase fault at the customer it was evident that in the IT system and the TT systems
behaved similarly whereupon the system experienced an over-voltage that was close to the √3 times the
nominal voltage on the healthy phases and the current increase slightly, almost twice the nominal
current which is a value that can be regarded as an overload of the system which cannot be detected by
the short circuit protection device. This behaviour was consistent throughout the three system
configurations namely the balanced, unbalanced and the three phase systems. From studying the
behaviour of the TN-C , it was evident that the TN-C system did not experienced any under voltages
and the fault current detection was clearer as it experiences high fault currents during the fault as
compared to the IT and TT.

80
The amount of fault current achieved is similar for both the balanced and the unbalance single phase
system but turned to be very high on the three phase system. However the IT system behaved like the
TT system during the first fault only but as soon as another fault occurred while the first fault was not
cleared, the behaviour was similar to that of the TN-C where the high fault current was detected.
For single phase faults applied on the primary side of the utility transformer the three earthing systems
behaved equivalently for all the configurations of the single phase balanced, single phase unbalanced
and the three phase system. Where there was an under voltage experienced by the system on the primary
side, on the secondary and across the loads which leads and the undercurrent experienced by the loads.
However this condition under current and undervoltage condition might affect the customers
detrimentally in the normal operations. This impact was experienced mainly by the red and blue phase,
meaning the loads connected on the white continued to work as normal.
During the simulation of the loss of neutral (while applying a single phase to ground fault), it was proven
that only the TN-C was affected in its behaviour as it experienced over voltages during this condition
and the fault current reduced to 87.2 A, the current that is relative to the one detected by the IT and TT
systems which means faults can be missed by the short circuit protection devices.
The three systems also behaved similarly for the loss of neutral condition where the TN-C system also
experiences some over voltage and a low fault current like the IT and TT system. This is evident for the
entire system configuration, the single phase balanced, single phase unbalanced and the three phase
system.
After studying the behaviour of the three earthing systems, it was found necessary for one to study and
understand the application prior to choosing which earthing system would best suited the particular
application. Based on the results achieved, the TN-C system seemed to be a best option to apply since
it behaved clear in terms of fault detection by measuring high fault currents. However the disadvantage
in it is when the system loses the neutral connection it will lead to dangerous voltages and low detection
of the fault current. Therefore, the system designer needs to ensure the integrity of the neutral
connection and this is another study on its own.
In general the application designers can select the appropriate earthing system that will match the needs
of the design for example since IT has proven continuity, therefore it can be suitable for use in
environments where the load is not voltage sensitive, where touch voltage are a threat to human life like
and where multiple points of earth can be achieved and the safety of people is paramount TT can be
employed.
81
6.2 Recommendations
The conclusion about which earthing method is best is more dependent on the type of installation,
parameters used, type of faults applied to their system and the rules and regulations governing the
country and the utilities. It is worthwhile to study in detail the sizing of the different earthing material
in order to design the earthing scheme effectively. From this research it was learnt that this topic has
been covered extensively in literature which will help the earthing designer to study how to choose the
earthing method effectively for a particular application and condition of the system.
However there are some challenges that are being experienced by engineers in designing these schemes
which involve the inability of protection to detect some of the faults in a particular earthing system as
a result of the low fault currents being detected by the system. The challenge becomes more in the case
of the loss of neutral where the faults cane is missed completely.
Future work could involve studying of the earthing behaviors under different loading conditions for
example industrial loading like motors as these impact on the current that flow through the neutral, as
for now the study focused more on the resistive type of loading in a normal electrification network.
Once the behavior of the earthing systems is understood well then the designer can approach the
development of protection devices in managing the detection of fault and unaccounted currents. Studies
have begun where smart technology is being explored in the use of detecting all the LV network hazards
and also staying abreast with the technology development.

82
References
[1] Jim Burke and Mike Marshall, “Distribution System Neutral Grounding”, Presented in the
Transmission and Distribution Conference and Exposition 2001 IEEE/PES (Volume: 1), 2001.
[2] Andreas Beutel, “High level scan into international LV protection and earthing practices” Eskom,
JHB , Rep N.RA15003.R.19_1, 2015.
[3] J. Wattel, et-al., “Enabling Low Voltage Network Visibility to Detect Hazards on Rural Distribution
Networks”, Presented in the SAUPEC Conference 2017.
[4] R.M Kamel, et-al., Comparison the Performances of Three Earthing Systems for Micro-Grid
Protection during Grid Connected Mode. SGRE2011,Environmental Energy Engineering, Department
of Electronics and Information Engineering , Tokyo University of Agriculture and Technology , Tokyo,
Japan .Available: https://www.SciRP.org/journal/sgre,2011.
[5] M. Mohlokoana, “Effects of LV earthing systems on protection and public safety” Eskom Protection
Workshop, Eskom Holdings SOC, 2013.
[6] Bernard Lacroix and Ronald Calvas, “Earthing Systems Worldwide and evolutions”, Schneider
Electric ECT 173 First Issue, September 1995.
[7] Schneider Electric Installation Guide: LV Distribution Chapter E, 2008. Available: www.electrical-
installation.org.
[8] SANS 1092: Earthing of low voltage network (LV) distribution systems, 2013.
[9] Schneider Electric Application note: How to choose the right system earthing arrangement, 2009
Available: www.electrical-installation.org
[10] ABB Technical guide on “Protection against earth faults with Residual Current Devices”, 2009.
[11] Massimo Mitolo, “Electrical safety of low voltage system”, Chicago San Francisco Lisbon London
Madrid Mexico City Milan New Delhi San Juan Seoul Singapore Sydney Toronto, 2009.
[12] J Beukes and Males Tomlinson, “Low Voltage Safety 2016” Eskom, JHB, S.A, A80004.R.18_1,
2016.
[13] ABB paper on “Distribution systems and protection against indirect contact and earth fault”
Technical Application paper No.3, April 2008.
[14] Dr Massimo Mitolo, “Understanding of NEC and IEC in the matter of bonding and grounding of
low voltage power systems”, Presented via Webinar series, 50th IAS IEEE Industry Application Society,
USA, June 2015.
[15] Low Voltage Supply Earthing Systems Committee established by Standards New Zealand, Report
on low voltage supply earthing systems, New Zealand.
[16] F. Jullien and I. Hertier, “The IT earthing System “, Schneider Electric ECT 178 First Issue, June
1999.

83
[17] Rade M. Ciric, et-al., “Investigating effects of neutral wire and grounding in distribution systems
with faults”, 39th International Universities Power Engineering Conference, 2004 UPEC, 2004.
[18] Abdallah R. et-al., Effect of neutral grounding methods on the earth fault characteristics. PIERs
Proceedings, Prague, Czech Republic. Available: https://piers.org, 2015.
[19] Tsai-Hsiang Chen and Wen-Chih Yang, “Analysis of multi-grounded four-wire distribution
systems considering the neutral grounding”, IEEE transactions on power delivery, (Volume: 16), No.4,
October 2001.
[20] Raymond M. Fish and Leslie A. Geddes “Conduction of Electrical Current to and Through the
Human Body”, Bioacoustics Research Lab & Department of Surgery, University of Illinois at Urbana-
Champaign and Weldon School of Biomedical Engineering, Purdue University, W Lafayette,Ind, 2009.
[21] Massimo Mitolo, Senior Member, IEEE, et-al., “Of international terminology and wiring methods
of low voltage power systems”, IEEE transactions on industry applications, Volume: 46, No.3,
May/June 2010.
[22] Guiseppe Parise, Member, IEEE “A Summary of the IEC Protection against electric shock” IEEE
transactions on industry applications, Volume: 34, No.5, September/October 2010.
[23] Velmurugan Mariappan, et-al “Earthing system analysis to improve protection system
performance in distribution networks” 12th IET International Conference on Developments in Power
System Protection (DPSP 2014), 2014
[24] J.S Peck, Member, “Earthed versus unearthed neutrals on alternating current systems” Paper
received 15th September 1912, read before The Institution 28thNovember, before Manchester Local
Section 19 November, before Birmngham Local Section 27th November and before the Newcastle
Section December 1912, Journal of the Electrical engineers 50, no 217: pgs. 150-161, 1913.
[25] Guiseppe Cafaro, et al.,” Influence of LV neutral grounding on global earthing systems” IEEE
transactions on industry applications, Volume: 53, No.1, January/February 2017.
[26] John Gardner, et-al., “A Comparison of International Wiring and grounding systems with North
American methods” Copyright Material IEEE Paper number PCIC, 2008.
[27] Guiseppe Parise, Fellow, IEEE “A Summary of the IEC protection against electric shock” IEEE
transactions on industry applications, Volume: 49, No.2, March/April 2013.
[28] Sharmistha Bhattacharyya ,Sjef Cobben “ Ensuring public safety through proper earthing in low-
voltage networks” 24th International Conference & Exhibition on Electricity Distribution (CIRED), 12-
15 June 2017.
[29] G.Parise, Fellow IEEE, et al., “Grounding of distributed low-voltage loads: Street lighting system”
Industrial and Commercial Power Systems Technical Conference (I&CPS), 2010 IEEE. IEEE 978-1-
4244-5602/09/$25.00 A IEEE 2010, 2010.
[30] F. Julien, no.178 “The IT earthing system (unearthed neutral) in LV” Schneider Electric, Cahier
technique, 1999
[31] Phil B.Zavadivker, PE Senior Member, IEEE “Neutral grounding –Nothing newtral about it” 0-
7803-4509-6/98/$10.00 IEEE, 1988.

84
[32] Gladston A.F. Bernardi , Jose Maria de Carvalho Filho , “ High resistance neutral grounding in
industrial system and the ground fault protection”, Power Electronics Conference (COBEP), 2013
Brazilian. IEEE 978-1-4799-0272-9/13/$31.00 IEEE, 2013.
[33] J.C. Gomez, et-al., National University of Rio Cuarto, Argentina, “Effect of the power system
grounding on Power Quality” ,2013.
[34] Truman C Surbrook, associate member IEEE, et-al,” Parameters affecting neutral-to-earth voltage
along primary distribution circuits” IEEE transactions on industry applications, Volume: 24, No.5,
September/October 1988.
[35] DJ Irving and CT Gaunt, “How safe is South African earthing practice?” 53rd AMEU Convention
Durban, September 1993.
[36] Seppo Hanninen, Matti Lehtonen, “Characteristics of earth faults in electrical distribution networks
with high impedance earthing” Electric Power Systems Research, 44(3), 155-161 , June 1998.
[37] Neils Nichols, Member IEEE and David D.Shipp member IEEE, “Designing to avoid hazardous
transferred earth potentials” IEEE transactions on industry applications, Volume: 1A-18, No.4,
July/August 1988.
[38] Kosjenka Capuder Bikic, et-al “Transferred voltage due to single phase earth fault on power
transformers”, 4th International Colloquium “Transformer research and asset management”.
[39] Mashangu Hudson Xivambu, “Impact of floating neutral in distribution systems” 19th International
Conference on Electricity Distribution, Vienna, 21-24 May 2007.
[40] Viv Cohen, “Loss of neutral in low voltage distribution systems: consequences and solutions”
Nov/Dec 2012.