effect of operating parameters on gas turbine · pdf fileeffect of operating parameters on gas...
TRANSCRIPT

296
Int. J. Mech. Eng. & Rob. Res. 2012 Sandeep Rathee et al., 2012
EFFECT OF OPERATING PARAMETERS ON GASTURBINE POWER PLANT PERFORMANCE
Sandeep Rathee1*, Nikhil Dev2 and Sandeep Kumar1
*Corresponding Author: Sandeep Rathee, rathee8 @gmail.com
A deterministic quantitative model based on graph theoretical methodology has been developedto compare various technical features of gas turbine power plants and is used to evaluate andrank the power plants in ascending or descending order in accordance with the value of theirefficiency index. The plant with rank one is the optimized selection for the customer’s/user’sdesires on the particular application under consideration. This efficiency index is the permanentvalue of the plant attribute matrix, which is a combination of attribute rating matrix and attributerelative importance matrix. The graph theoretic model developed is explained and illustratedwith an example problem.
Keywords: Graph theory approach, Gas turbine power plant, Digraph, Matrix, Permanentfunction
INTRODUCTIONThe selection of energy sources to generateelectricity can be considered as one of themost important aspects in the decisionprocess for the national power systemexpansion (IAEA, 1984; and AsianDevelopment Bank, 1988). Lou (1984) hasdiscussed economic feasibility of power plantstaking into consideration local conditions andresources. Guidelines were given for selectionof optimum location, size and type ofequipments for power plants. Wang and Min(2000) have developed an integrated
ISSN 2278 – 0149 www.ijmerr.comVol. 1, No. 3, October 2012
© 2012 IJMERR. All Rights Reserved
Int. J. Mech. Eng. & Rob. Res. 2012
1 University Institute of Engineering and Technology, MD University Rohtak, Haryana, India.2 YMCA University of Science & Technology, Faridabad, Haryana, India.
Research Paper
resource-planning model for utilities withoutage costs. Kordan (1984) presented amathematical model for reliability estimationof power plants. The literature also reveals thatthe effect of individual parameters likemeteorological factors, economic aspects ofmaintenance and operation, coal quality(Gupta et al., 1989; Jain et al., 1985; Kusiakand Wang, 1993; Matto, 1997; and Selot,1986), etc., have been discussed by differentresearchers but all such factors have not beenconsidered all together in a unified manner.So there is a need to develop a unified

297
Int. J. Mech. Eng. & Rob. Res. 2012 Sandeep Rathee et al., 2012
approach, which will enable power plantdevelopment team to consider all the attributesand their relative importance concurrently inan integrated manner for optimum selectionof a power plant. Some methods based onMultiple Attribute Decision-Making (MADM)and distance based approach (Chen andHwang, 1992; and Widiyanto et al., 2004) arealso available in the open literature. Thepresent methodology has an edge over thesemethods in respect of indeterminacy,sensitivity analysis and accuracy of thesuitability index, etc. The salient features of themethodology in comparison to alreadyavailable methods/approaches are discussedat the end in order to validate the methodology.
MATERIALS AND METHODSTurbine section is the area in which the energyof the hot pressurized gas produced bycompressor and combustion section isconverted into mechanical energy. Turbinesection comprised of turbine rotor assemblyand turbine stator assembly. In turbine section,there is turbine rotor shaft comprised of threewheel shaft. First and third stage turbine wheelshaft are with buckets and second stageturbine wheel is with spacer. The turbinebuckets increase in size from the first to thethird stage. It is due to the pressure reductionresulting from energy conversion in each stageand an increased annulus is required toaccommodate the gas flow. The tip of thesecond and third stage buckets are enclosedby a shroud interlock from bucket to bucket toprovide vibration damping. In the turbinesection there are three stages of stationarynozzles which direct the high velocity flow ofthe expanded hot gases causing the turbineto rotate. The primary function of the shroud is
to provide a cylindrical surface for minimizingbucket tip clearance linkage. Secondly itprovides high thermal resistance between thehot gas and outer cell which is at lowtemperature. After compression, high pressureand temperature air goes to combustionchamber. In combustion chamber chemicalenergy of fuel is converted into thermal energy.Combustion section includes combustionchambers, fuel nozzles, spark plug ignitionsystem, flame detectors, crossfire tubes,transition pieces and combustion liners. Thecombustion system used in gas turbine powerplant is generally of the reverse flow type withcombustion chambers arranged around theperiphery of the compressor dischargecasing. Fuel supply to each combustionchamber through a nozzle is designed todisperse and mix the fuel with the properamount of combustion air. Discharged air fromthe axial flow compressor, flows into eachcombustion flow sleeve from the combustionwrapper. The airflow upstream along theoutside of the combustion liner reaction zonethrough the nozzle swirl tip, through meteringholes in both the cap and liner and throughcombustion holes in the forward half on the liner.The hot combustion gases from the reactionzone pass through a thermal soaking zone andthen into dilution zone where additional air ismixed with the combustion gases. Meteringholes in the dilution zone allow the correctamount of air to enter and cool the gases tothe desired temperature. Along the length ofthe combustion liner and in the liner cap, thereare openings whose function is to provide afilm of air for cooling the wall of the liner andthe cap. Transition pieces direct the hot gasesfrom the liners to the turbine nozzles.Combustion is initiated by means of the
298
Int. J. Mech. Eng. & Rob. Res. 2012 Sandeep Rathee et al., 2012
discharge from low to high voltage, retractableelectrode spark plugs installed in adjustmentcombustion chambers. These spring injectedand pressure retractable plugs received theirenergy from ignition transformers. At the timeof firing, spark at one or both plugs ignites thegases in a chamber. The remaining chambersare ignited by crossfire through the tubes thatdoes interconnect the reaction zone of theremaining chambers. With increase in rotorspeed, chamber pressure causes the sparkplugs to retract and the electrode is removedfrom the combustion zone. Fuel injector nozzlesare of two types’ primary
Nozzle and secondary nozzle. In combustionsystem there are one secondary nozzle andprimary nozzles are more than one. During thestart up sequence, it is desired that a signal offlame or no flame has to be transmitted to thecontrol system. A flame monitoring system isused consisting of multiple sensors which areinstalled on different combustion chambers. An
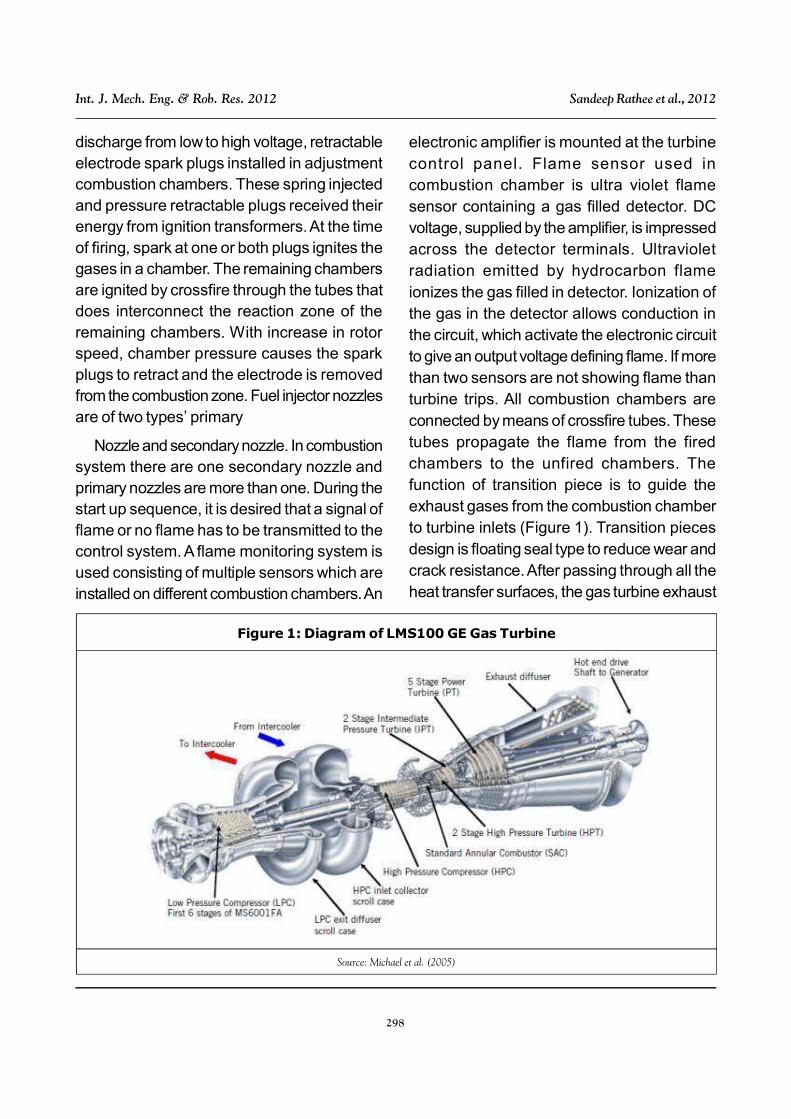
Figure 1: Diagram of LMS100 GE Gas Turbine
Source: Michael et al. (2005)
electronic amplifier is mounted at the turbinecontrol panel. Flame sensor used incombustion chamber is ultra violet flamesensor containing a gas filled detector. DCvoltage, supplied by the amplifier, is impressedacross the detector terminals. Ultravioletradiation emitted by hydrocarbon flameionizes the gas filled in detector. Ionization ofthe gas in the detector allows conduction inthe circuit, which activate the electronic circuitto give an output voltage defining flame. If morethan two sensors are not showing flame thanturbine trips. All combustion chambers areconnected by means of crossfire tubes. Thesetubes propagate the flame from the firedchambers to the unfired chambers. Thefunction of transition piece is to guide theexhaust gases from the combustion chamberto turbine inlets (Figure 1). Transition piecesdesign is floating seal type to reduce wear andcrack resistance. After passing through all theheat transfer surfaces, the gas turbine exhaust

299
Int. J. Mech. Eng. & Rob. Res. 2012 Sandeep Rathee et al., 2012
gases are discharged into steel chimney.Chimney height is generally 70 m.
Methodology Adopted
The graph theoretical methodology thatcombines various attributes relevant to athermal power plant into a single measure sothat a comprehensive ranking of the alternativeplants could be made, has been adopted forevaluation, ranking and selection of variousalternative power plants used for electricitygeneration. This methodology comprises oftwo phases. In the first phase, graphical modelof the system is developed using graph theorywhich is named as ‘attribute digraph’. Graphtheory (Deo, 1974) has been appliedextensively in various disciplines. Agrawal andRao (1987 and 1989) and Gandhi and Agrawal(1994) have used this theory to solve thedifferent types of real life problems. Theypresented models for these problems withmaking use of graph theory and later analyzedthem on a computer. In the second phase, thegraphical model is converted into matrix modelcalled as ‘attribute matrix’ and then this matrixis expressed in the form of a function calledVariable Permanent Function (VPF).
Attribute Digraph
A digraph is used to represent the elements(performance parameters) and theirinterdependencies in terms of nodes and edges.In an undirected graph, no direction is assignedto the edges in the graph, whereas directedgraphs or digraphs have directional edges. AGTPP performance parameter digraph isprepared to represent the parameters of GT interms of nodes and edges. It representsparameters (P
i’s) through its nodes and
dependence of parameters (pij’s) through its
edges. Pi indicates the inheritance of parametersand p
ij indicates the degree of dependence of jth
parameter on i-th parameter. In the present worksix parameters such as ambient temperature(P
1), compression ratio (P
2), turbine inlet
temperature (P3), isentropic compressor
efficiency (P4), isentropic turbine efficiency (P
5)
and air to fuel ratio (P6) effecting thermal
efficiency are schematically represented inFigure 2 and the corresponding performanceparameter digraph is presented in Figure 3. Theinterdependencies of performance parameterscan be summarized as:
• Ambient temperature (P1) affects the
pressure ratio (P2), turbine inlet temp (P
3),
isentropic compressor efficiency (P4) and
isentropic turbine efficiency (P5). Thus, there
is a directed edge from (P1) to (P
2), (P
1) to
(P3), (P
1) to (P
4) and (P
1) to (P
5).
• Pressure ratio (P2) affects the turbine inlet
temp (P3), isentropic compressor efficiency
(P4) and isentropic turbine efficiency (P
5).
Thus, there is a directed edge from (P2) to
(P3), (P
2) to (P
4), and (P
2) to (P
5).
• Turbine inlet temperature (P3) does not
affect the other performance parameter ofGTPP in this analysis; it affects only thermalefficiency of GTPP.
• Isentropic compressor efficiency (P4)
affects the compressor ratio (P2). Thus,
there is a directed edge from (P4) to (P
2).
• Isentropic turbine efficiency (P5) does not
affect the other performance parameters ofGTPP, it affects only thermal efficiency ofGTPP.
• Air fuel ratio (P6) affects the Turbine inlet
temperature (P3). Thus, there is a directed
edge from (P6) to (P
3) as shown in Figure 2.
300
Int. J. Mech. Eng. & Rob. Res. 2012 Sandeep Rathee et al., 2012
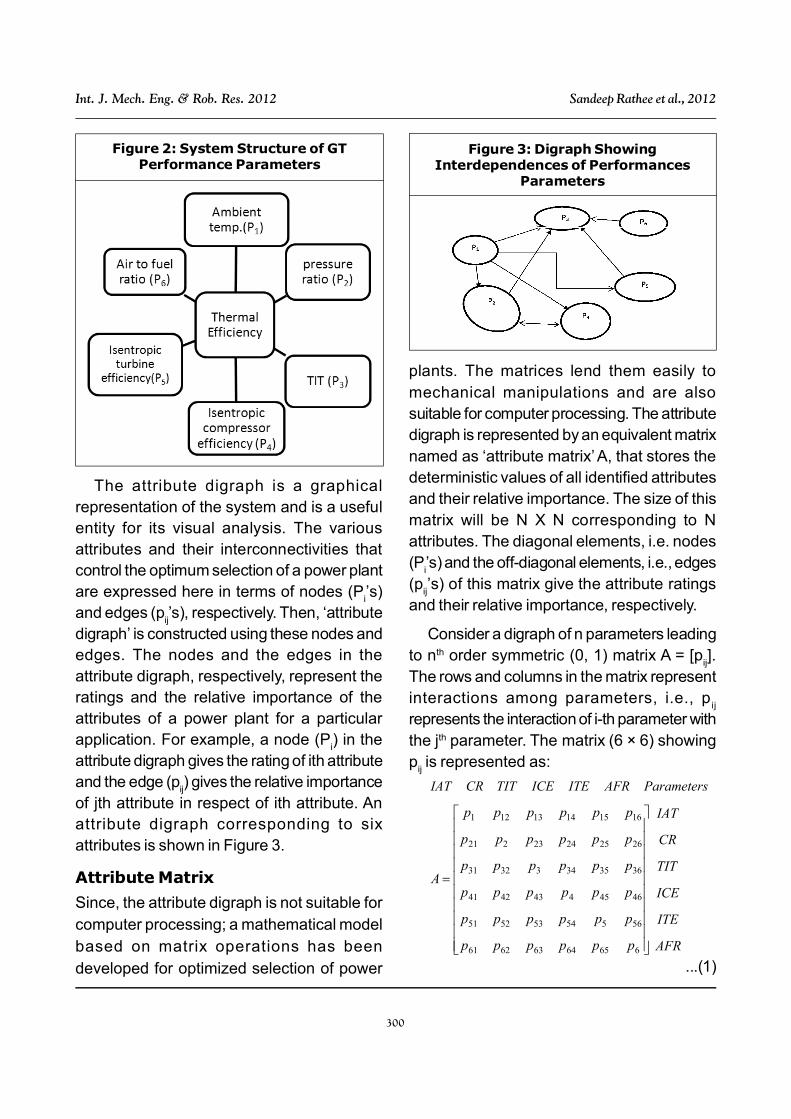
Figure 2: System Structure of GTPerformance Parameters
The attribute digraph is a graphicalrepresentation of the system and is a usefulentity for its visual analysis. The variousattributes and their interconnectivities thatcontrol the optimum selection of a power plantare expressed here in terms of nodes (P
i’s)
and edges (pij’s), respectively. Then, ‘attribute
digraph’ is constructed using these nodes andedges. The nodes and the edges in theattribute digraph, respectively, represent theratings and the relative importance of theattributes of a power plant for a particularapplication. For example, a node (P
i) in the
attribute digraph gives the rating of ith attributeand the edge (p
ij) gives the relative importance
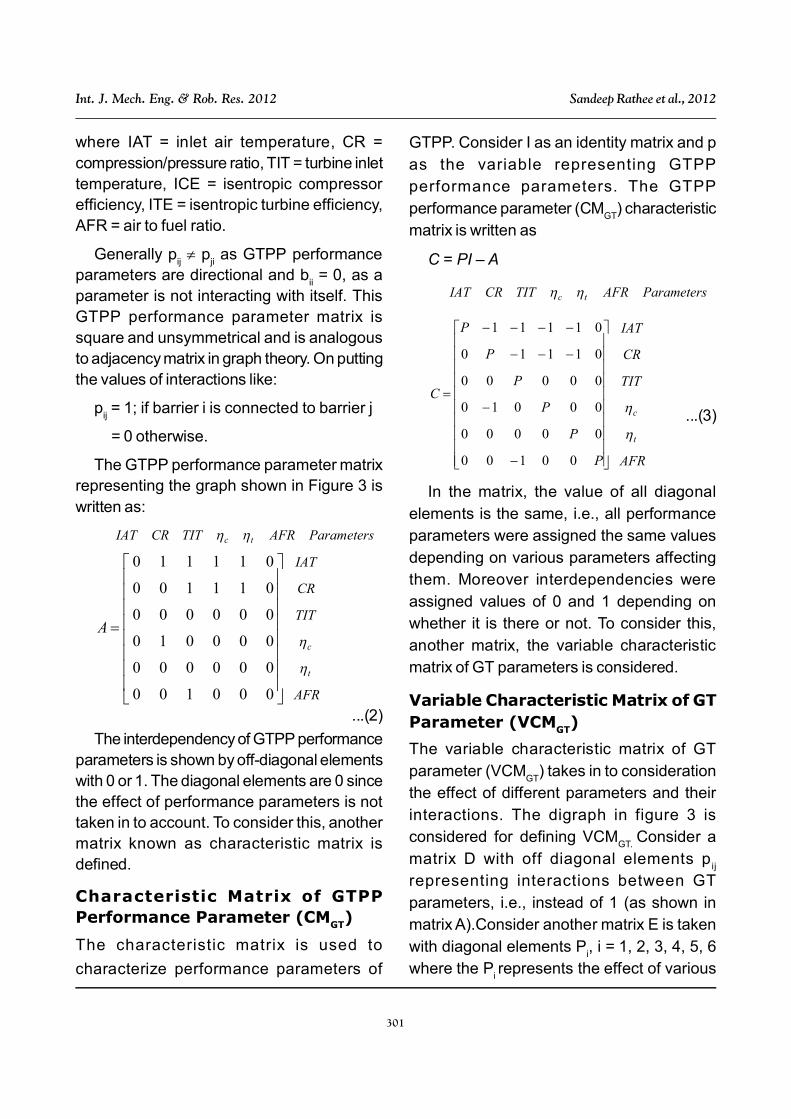
of jth attribute in respect of ith attribute. Anattribute digraph corresponding to sixattributes is shown in Figure 3.
Attribute Matrix
Since, the attribute digraph is not suitable forcomputer processing; a mathematical modelbased on matrix operations has beendeveloped for optimized selection of power
Figure 3: Digraph ShowingInterdependences of Performances
Parameters
plants. The matrices lend them easily tomechanical manipulations and are alsosuitable for computer processing. The attributedigraph is represented by an equivalent matrixnamed as ‘attribute matrix’ A, that stores thedeterministic values of all identified attributesand their relative importance. The size of thismatrix will be N X N corresponding to Nattributes. The diagonal elements, i.e. nodes(P
i’s) and the off-diagonal elements, i.e., edges
(pij’s) of this matrix give the attribute ratings
and their relative importance, respectively.
Consider a digraph of n parameters leadingto nth order symmetric (0, 1) matrix A = [p
ij].
The rows and columns in the matrix representinteractions among parameters, i.e., p
ij
represents the interaction of i-th parameter withthe jth parameter. The matrix (6 × 6) showingp
ij is represented as:
ParametersAFRITEICETITCRIAT
66564636261
56554535251
46454434241
36353433231
26252423221
16151413121
pppppp
pppppp
pppppp
pppppp
pppppp
pppppp
A
AFR
ITE
ICE
TIT
CR
IAT
...(1)
301
Int. J. Mech. Eng. & Rob. Res. 2012 Sandeep Rathee et al., 2012
where IAT = inlet air temperature, CR =compression/pressure ratio, TIT = turbine inlettemperature, ICE = isentropic compressorefficiency, ITE = isentropic turbine efficiency,AFR = air to fuel ratio.
Generally pij p
ji as GTPP performance
parameters are directional and bii = 0, as a
parameter is not interacting with itself. ThisGTPP performance parameter matrix issquare and unsymmetrical and is analogousto adjacency matrix in graph theory. On puttingthe values of interactions like:
pij = 1; if barrier i is connected to barrier j
= 0 otherwise.
The GTPP performance parameter matrixrepresenting the graph shown in Figure 3 iswritten as:
ParametersAFRTITCRIAT tc
000100
000000
000010
000000
011100
011110
A
AFR
TIT
CR
IAT
t
c
...(2)
The interdependency of GTPP performanceparameters is shown by off-diagonal elementswith 0 or 1. The diagonal elements are 0 sincethe effect of performance parameters is nottaken in to account. To consider this, anothermatrix known as characteristic matrix isdefined.
Characteristic Matrix of GTPPPerformance Parameter (CMGT)
The characteristic matrix is used to
characterize performance parameters of
GTPP. Consider I as an identity matrix and pas the variable representing GTPPperformance parameters. The GTPPperformance parameter (CM
GT) characteristic
matrix is written as
C = PI – A
ParametersAFRTITCRIAT tc
P
P
P
P
P
P
C
00100
00000
00010
00000
01110
01111
AFR
TIT
CR
IAT
t
c
...(3)
In the matrix, the value of all diagonalelements is the same, i.e., all performanceparameters were assigned the same valuesdepending on various parameters affectingthem. Moreover interdependencies wereassigned values of 0 and 1 depending onwhether it is there or not. To consider this,another matrix, the variable characteristicmatrix of GT parameters is considered.
Variable Characteristic Matrix of GTParameter (VCMGT)
The variable characteristic matrix of GTparameter (VCM
GT) takes in to consideration
the effect of different parameters and theirinteractions. The digraph in figure 3 isconsidered for defining VCM
GT. Consider a
matrix D with off diagonal elements pij
representing interactions between GTparameters, i.e., instead of 1 (as shown inmatrix A).Consider another matrix E is takenwith diagonal elements P
i, i = 1, 2, 3, 4, 5, 6
where the Pi represents the effect of various
302
Int. J. Mech. Eng. & Rob. Res. 2012 Sandeep Rathee et al., 2012
parameters, i.e., instead of P only (as shownin matrix C). Considering matrices D and E,VCM
GT is expressed as:
H = E – D
ParametersAFRTITCRIAT tc
663
5
4
3
24232
1413121
0000
00000
00010
00000
000
00
Pp
P
P
P
ppP
pppP
H
AFR
TIT
CR
IAT
t
c
...(4)
This matrix provides a powerful tool throughits determinant, called the variablecharacteristic GT performance parametermultinomial.
The determinant of the matrix H containspositive and negative sign with some of itscoefficients. Hence, complete information inthe GT environment will not be obtained assome will be lost due to addition andsubtraction of numerical values of diagonal andoff-diagonal elements (i.e., P
i’s and p
ij’s). Thus
the determinant of the variable characteristicmatrix, i.e., the matrix H, does not providecomplete information concerning the GTPPsystem. For this, another matrix known asVariable Permanent Matrix of GT parameter(VPM
GT) is introduced.
Variable Permanent Matrix of GTParameter (VPMGT)
Since the total quantitative value is notobtained in VCM
GT, VPMGT is defined for the
organization in general (assuming interactionsamong all parameters) as:
P = [E + D]
ParametersAFRTITCRIAT tc
66564636261
55554535251
46454434241
36353433231
26252423221
16151413121
Pppppp
pPpppp
ppPppp
pppPpp
ppppPp
pppppP
P
AFR
TIT
CR
IAT
t
c
...(5)
where, E and D have the meaning as inmatrix H.
Thus the VPMGT,
corresponding to the sixperformance parameters GT digraph (Figure3) is given by:
ParametersAFRtcTITCRIAT
663
5
442
3
2524232
151413121
*
0000
00000
0000
00000
00
0
Pp
P
Pp
P
pppP
ppppP
PVPMGT
AFR
TIT
CR
IAT
t
c
...(6)
The diagonal elements P1, P
2, P
3, P
4, P
5 and
P6 represent the effect of the six critical
performance parameters on GTPP and off-diagonal elements represent interdependenciesof each element in the matrix. The contributioncan be expressed quantitatively.
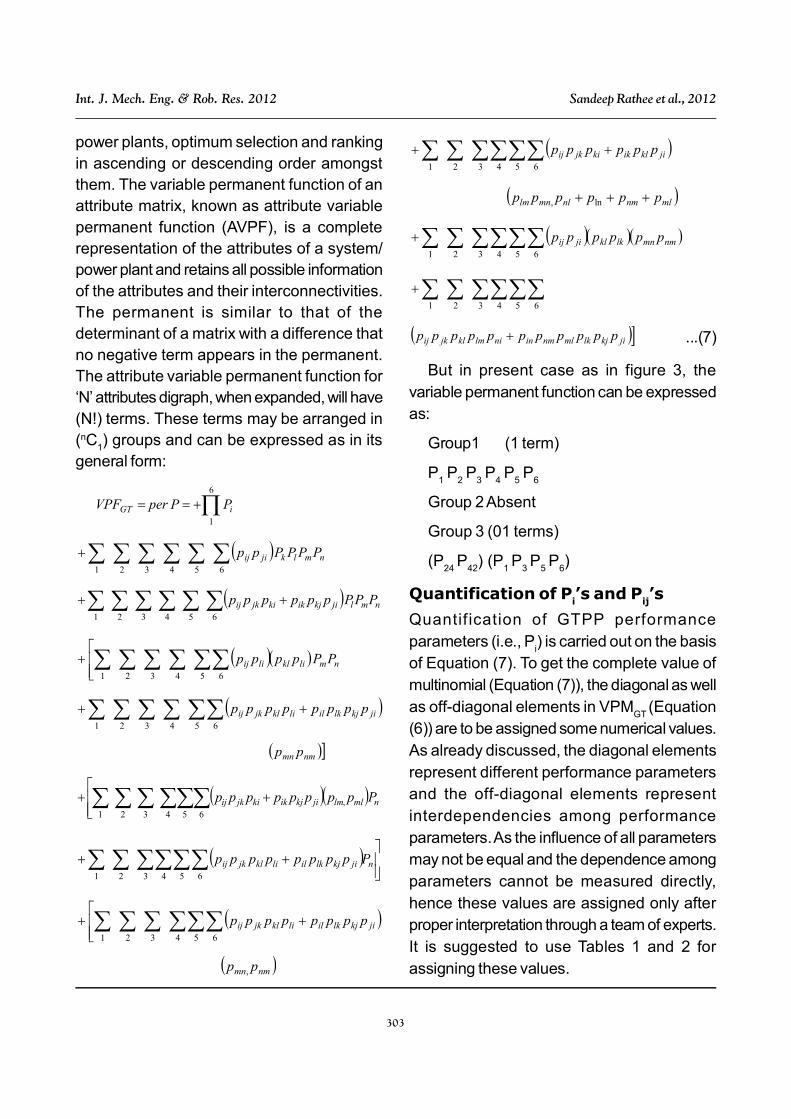
Permanent Function RepresentationVariable permanent function or simply knownas permanent is a standard matrix function thatis used in combinatorial mathematics(Michael, 2005). It is a powerful tool forattribute based evaluation of the systems/
303
Int. J. Mech. Eng. & Rob. Res. 2012 Sandeep Rathee et al., 2012
power plants, optimum selection and rankingin ascending or descending order amongstthem. The variable permanent function of anattribute matrix, known as attribute variablepermanent function (AVPF), is a completerepresentation of the attributes of a system/power plant and retains all possible informationof the attributes and their interconnectivities.The permanent is similar to that of thedeterminant of a matrix with a difference thatno negative term appears in the permanent.The attribute variable permanent function for‘N’ attributes digraph, when expanded, will have(N!) terms. These terms may be arranged in(nC
1) groups and can be expressed as in its
general form:
6
1iGT PPperVPF
nmlkjiij PPPPpp654321
nmljikjikkijkij PPPpppppp 654321
5 64321nmliklliij PPpppp
5 64321
jikjlkillikljkij pppppppp
nmmn pp
4 5 6,
321nmllmjikjikkijkij Ppppppppp
njikjlkillikljkij Ppppppppp
3 4 5 621
4 5 6321jikjlkillikljkij pppppppp
nmmn pp ,
3 4 5 621
jiklikkijkij pppppp
mlnmnlmnlm pppppp ln,
nmmnlkkljiij pppppp3 4 5 621
3 4 5 621
jikjlkmlnminnilmkljkij ppppppppppp ...(7)
But in present case as in figure 3, thevariable permanent function can be expressedas:
Group1 (1 term)
P1 P
2 P
3 P
4 P
5 P
6
Group 2 Absent
Group 3 (01 terms)
(P24
P42
) (P1 P
3 P
5 P
6)
Quantification of Pi’s and Pij’s
Quantif ication of GTPP performanceparameters (i.e., P
i) is carried out on the basis
of Equation (7). To get the complete value ofmultinomial (Equation (7)), the diagonal as wellas off-diagonal elements in VPM
GT (Equation
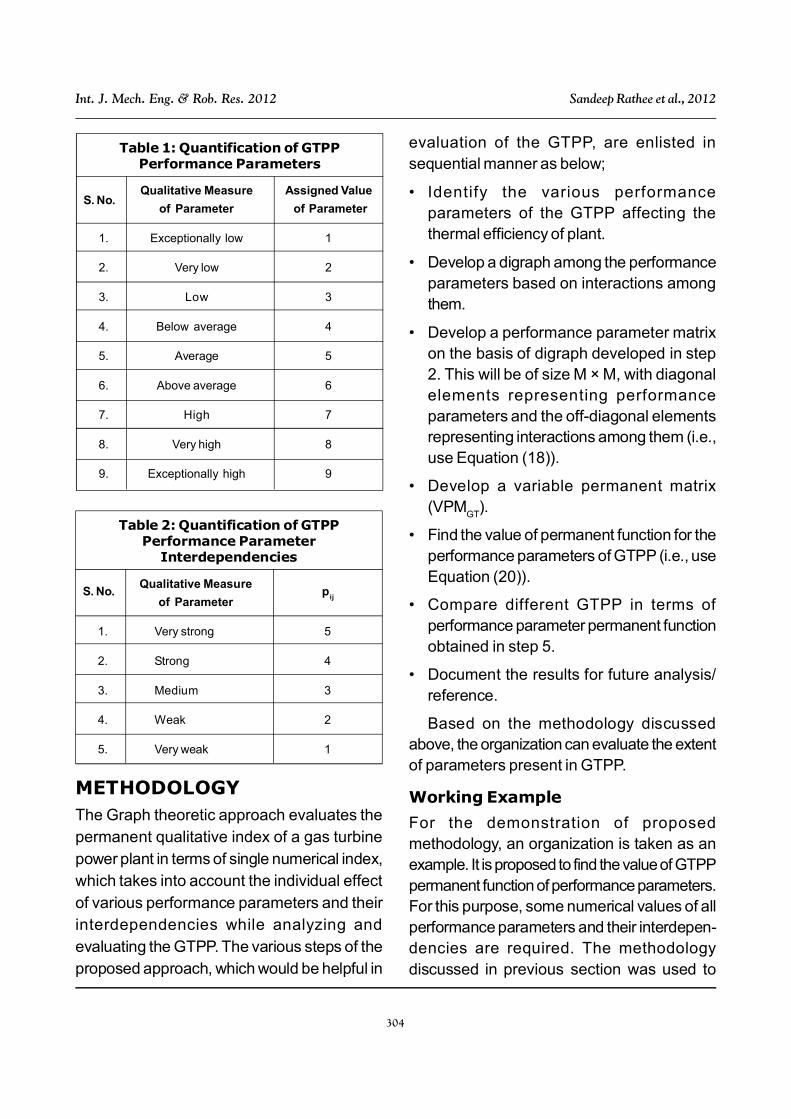
(6)) are to be assigned some numerical values.As already discussed, the diagonal elementsrepresent different performance parametersand the off-diagonal elements representinterdependencies among performanceparameters. As the influence of all parametersmay not be equal and the dependence amongparameters cannot be measured directly,hence these values are assigned only afterproper interpretation through a team of experts.It is suggested to use Tables 1 and 2 forassigning these values.
304
Int. J. Mech. Eng. & Rob. Res. 2012 Sandeep Rathee et al., 2012
Table 1: Quantification of GTPPPerformance Parameters
S. No.Qualitative Measure Assigned Value
of Parameter of Parameter
1. Exceptionally low 1
2. Very low 2
3. Low 3
4. Below average 4
5. Average 5
6. Above average 6
7. High 7
8. Very high 8
9. Exceptionally high 9
Table 2: Quantification of GTPPPerformance Parameter
Interdependencies
S. No.Qualitative Measure
pij
of Parameter
1. Very strong 5
2. Strong 4
3. Medium 3
4. Weak 2
5. Very weak 1
evaluation of the GTPP, are enlisted insequential manner as below;
• Identify the various performanceparameters of the GTPP affecting thethermal efficiency of plant.
• Develop a digraph among the performanceparameters based on interactions amongthem.
• Develop a performance parameter matrixon the basis of digraph developed in step2. This will be of size M × M, with diagonalelements representing performanceparameters and the off-diagonal elementsrepresenting interactions among them (i.e.,use Equation (18)).
• Develop a variable permanent matrix(VPM
GT).
• Find the value of permanent function for theperformance parameters of GTPP (i.e., useEquation (20)).
• Compare different GTPP in terms ofperformance parameter permanent functionobtained in step 5.
• Document the results for future analysis/reference.
Based on the methodology discussedabove, the organization can evaluate the extentof parameters present in GTPP.
Working Example
For the demonstration of proposedmethodology, an organization is taken as anexample. It is proposed to find the value of GTPPpermanent function of performance parameters.For this purpose, some numerical values of allperformance parameters and their interdepen-dencies are required. The methodologydiscussed in previous section was used to
METHODOLOGYThe Graph theoretic approach evaluates thepermanent qualitative index of a gas turbinepower plant in terms of single numerical index,which takes into account the individual effectof various performance parameters and theirinterdependencies while analyzing andevaluating the GTPP. The various steps of theproposed approach, which would be helpful in
305
Int. J. Mech. Eng. & Rob. Res. 2012 Sandeep Rathee et al., 2012
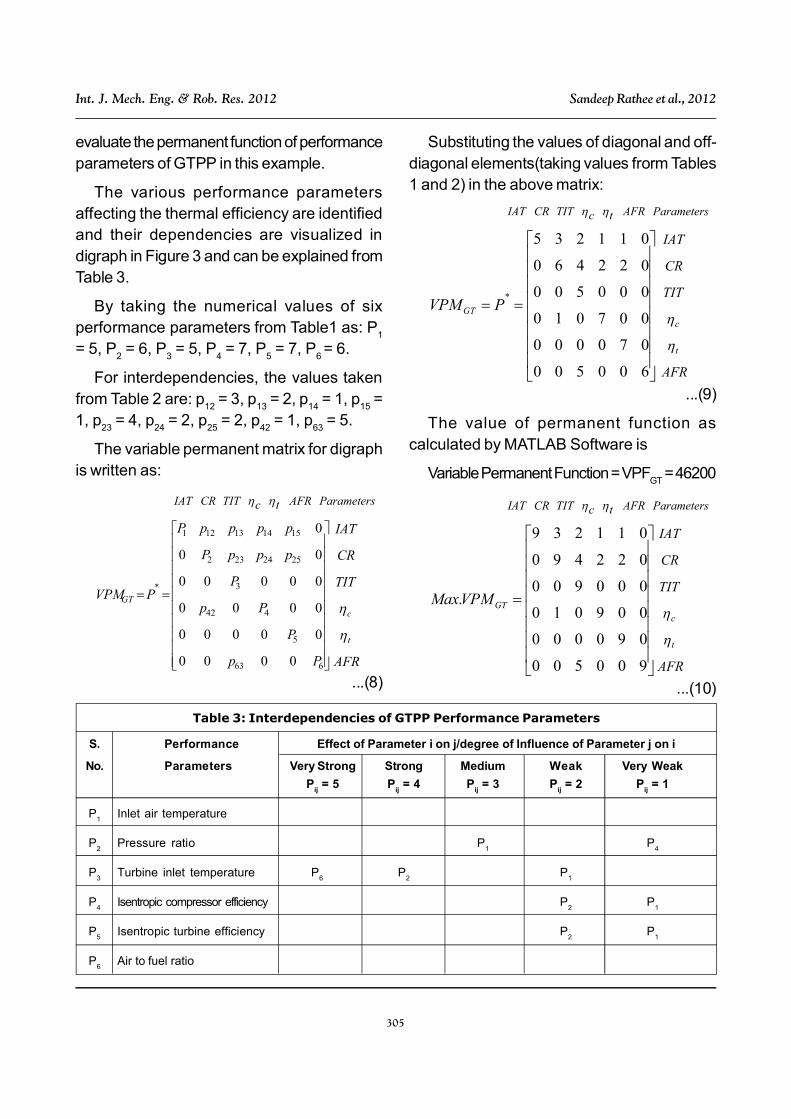
evaluate the permanent function of performanceparameters of GTPP in this example.
The various performance parametersaffecting the thermal efficiency are identifiedand their dependencies are visualized indigraph in Figure 3 and can be explained fromTable 3.
By taking the numerical values of sixperformance parameters from Table1 as: P
1
= 5, P2 = 6, P
3 = 5, P
4 = 7, P
5 = 7, P
6 = 6.
For interdependencies, the values takenfrom Table 2 are: p
12 = 3, p
13 = 2, p
14 = 1, p
15 =
1, p23
= 4, p24
= 2, p25
= 2, p42
= 1, p63
= 5.
The variable permanent matrix for digraphis written as:
ParametersAFRtcTITCRIAT
663
5
442
3
2524232
151413121
*
0000
00000
0000
00000
00
0
Pp
P
Pp
P
pppP
ppppP
PVPMGT
AFR
TIT
CR
IAT
t
c
...(8)
Substituting the values of diagonal and off-diagonal elements(taking values frorm Tables1 and 2) in the above matrix:
ParametersAFRtcTITCRIAT
600500
070000
007010
000500
022460
011235
*PVPM GT
AFR
TIT
CR
IAT
t
c
...(9)
The value of permanent function ascalculated by MATLAB Software is
Variable Permanent Function = VPFGT
= 46200
ParametersAFRtcTITCRIAT
900500
090000
009010
000900
022490
011239
. GTVPMMax
AFR
TIT
CR
IAT
t
c
...(10)
Table 3: Interdependencies of GTPP Performance Parameters
S. Performance Effect of Parameter i on j/degree of Influence of Parameter j on i
No. Parameters Very Strong Strong Medium Weak Very Weak
Pij = 5 P
ij = 4 P
ij = 3 P
ij = 2 P
ij = 1
P1
Inlet air temperature
P2
Pressure ratio P1
P4
P3
Turbine inlet temperature P6
P2
P1
P4
Isentropic compressor efficiency P2
P1
P5
Isentropic turbine efficiency P2
P1
P6
Air to fuel ratio

306
Int. J. Mech. Eng. & Rob. Res. 2012 Sandeep Rathee et al., 2012
The maximum value of variable permanentfunction is, Max VPF
GT = 544563
ParametersAFRtcTITCRIAT
100500
010000
001010
000100
022410
011231
. GTVPMMin
AFR
TIT
CR
IAT
t
c
...(11)
The minimum value of variable permanentfunction is, Min VPF
GT = 3
With the above method, the effect of eachindividual performance parameter can beseen by putting the maximum (9) andminimum (1) values of each individualparameter.
For inlet air temperature (IAT), the maximumand minimum values of permanent function iscalculated as;
ParametersAFRtcTITCRIAT
600500
070000
007010
000500
022410
011239
. 1VPMMax
AFR
TIT
CR
IAT
t
c
...(12)
The value of maximum permanent functionfor IAT is, Max VPF
1 = 83160
ParametersAFRtcTITCRIAT
600500
070000
007010
000500
022460
011231
. 1VPMMin
AFR
TIT
CR
IAT
t
c
...(13)
The value of minimum permanent functionfor IAT is, Min VPF
1 = 9240
For compression/pressure ratio (CR), themaximum and minimum values of permanentfunction are calculated as;
ParametersAFRtcTITCRIAT
600500
070000
007010
000500
022490
011235
. 2VPMMax
AFR
TIT
CR
IAT
t
c
...(14)
The value of maximum permanent functionfor CR is, Max VPF
2 = 68250
ParametersAFRtcTITCRIAT
600500
070000
007010
000500
022490
011239
. 2VPMMin
AFR
TIT
CR
IAT
t
c
...(15)

307
Int. J. Mech. Eng. & Rob. Res. 2012 Sandeep Rathee et al., 2012
The minimum value of variable permanentfunction for CR is, Min VPF
2 = 9450
For Turbine inlet temperature:
ParametersAFRtcTITCRIAT
600500
070000
007010
000900
022460
011235
. 3VPMMax
AFR
TIT
CR
IAT
t
c
...(16)
The maximum value of variable permanentfunction for TIT is, Max VPF
3 = 83160
ParametersAFRtcTITCRIAT
600500
070000
007010
000100
022460
011235
. 3VPMMin
AFR
TIT
CR
IAT
t
c
...(17)
The minimum value of variable permanent
function for TIT is, Min VPF3 = 9240
For isentropic compressor efficiency:
ParametersAFRtcTITCRIAT
600500
070000
009010
000500
022460
011235
. 4VPMMax
AFR
TIT
CR
IAT
t
c
...(18)
The maximum value of variable permanent
function for isentropic compressor efficiency is,
Max VPF4 = 58800
ParametersAFRtcTITCRIAT
600500
070000
001010
000500
022460
011235
. 4VPMMin
AFR
TIT
CR
IAT
t
c
...(19)The minimum value of variable permanent
function for isentropic compressor efficiency is,Min VPF
4 = 8400
For isentropic turbine efficiency:
ParametersAFRtcTITCRIAT
600500
090000
007010
000500
022460
011235
. 5VPMMax
AFR
TIT
CR
IAT
t
c
...(20)The maximum value of variable permanent
function for isentropic turbine efficiency is,Max VPF
5 = 58400
ParametersAFRtcTITCRIAT
600500
010000
007010
000500
022460
011235
. 5VPMMin
AFR
TIT
CR
IAT
t
c
...(21)
308
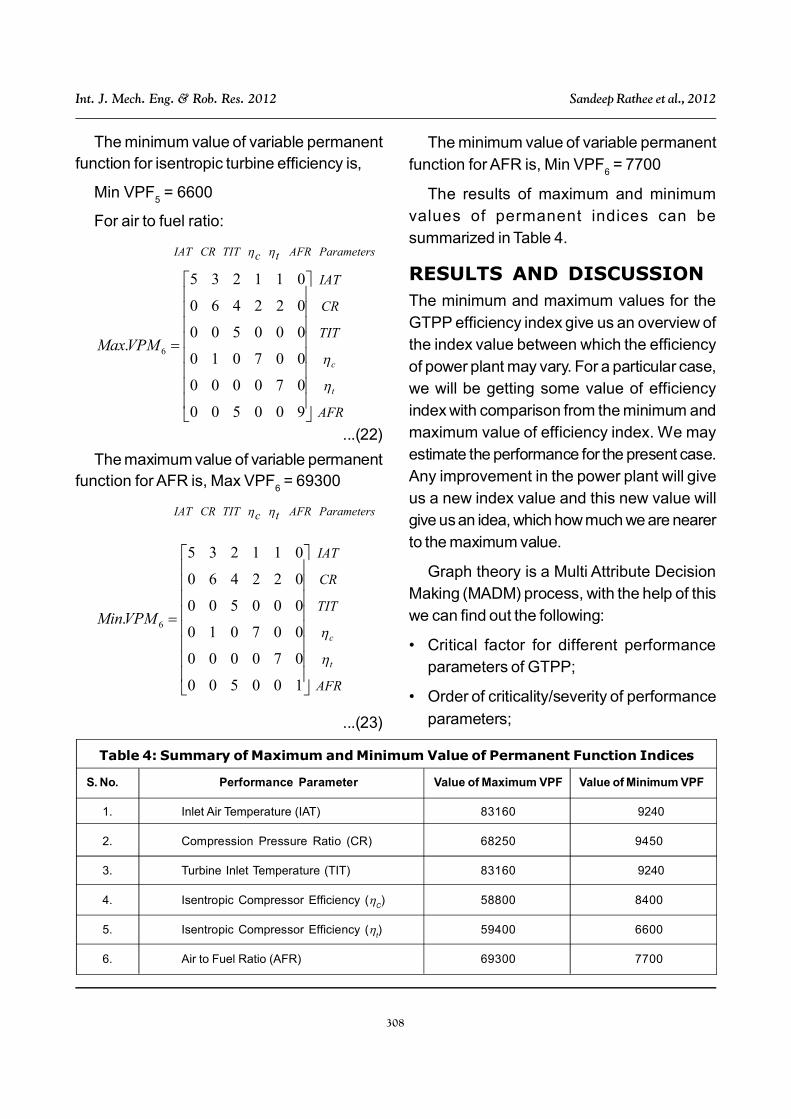
Int. J. Mech. Eng. & Rob. Res. 2012 Sandeep Rathee et al., 2012
The minimum value of variable permanentfunction for isentropic turbine efficiency is,
Min VPF5 = 6600
For air to fuel ratio:
ParametersAFRtcTITCRIAT
900500
070000
007010
000500
022460
011235
. 6VPMMax
AFR
TIT
CR
IAT
t
c
...(22)
The maximum value of variable permanentfunction for AFR is, Max VPF
6 = 69300
ParametersAFRtcTITCRIAT
100500
070000
007010
000500
022460
011235
. 6VPMMin
AFR
TIT
CR
IAT
t
c
...(23)
The minimum value of variable permanentfunction for AFR is, Min VPF
6 = 7700
The results of maximum and minimumvalues of permanent indices can besummarized in Table 4.
RESULTS AND DISCUSSIONThe minimum and maximum values for theGTPP efficiency index give us an overview ofthe index value between which the efficiencyof power plant may vary. For a particular case,we will be getting some value of efficiencyindex with comparison from the minimum andmaximum value of efficiency index. We mayestimate the performance for the present case.Any improvement in the power plant will giveus a new index value and this new value willgive us an idea, which how much we are nearerto the maximum value.
Graph theory is a Multi Attribute DecisionMaking (MADM) process, with the help of thiswe can find out the following:
• Critical factor for different performanceparameters of GTPP;
• Order of criticality/severity of performance
parameters;
Table 4: Summary of Maximum and Minimum Value of Permanent Function Indices
S. No. Performance Parameter Value of Maximum VPF Value of Minimum VPF
1. Inlet Air Temperature (IAT) 83160 9240
2. Compression Pressure Ratio (CR) 68250 9450
3. Turbine Inlet Temperature (TIT) 83160 9240
4. Isentropic Compressor Efficiency (C) 58800 8400
5. Isentropic Compressor Efficiency (t) 59400 6600
6. Air to Fuel Ratio (AFR) 69300 7700

309
Int. J. Mech. Eng. & Rob. Res. 2012 Sandeep Rathee et al., 2012
• Selection of power plants on the basis ofthermal efficiency;
• Improvements can be judged. We maycompare input parameters.
CONCLUSIONThe results of the model application using thedata, demonstrates that, once a complete setof criteria for power plant selection, along withset of alternatives and their threshold valuesare laid out, graph theoretical methodology canbe applied. This methodology allows adecision maker to perform, not just a generalanalysis, but also other various focusedanalyses regarding his personal preferences.Literally, the decision has unlimited choices inexploring the influences of various differentsets of attributes to final decision. In depthissue specific analyses, including sensitivitytest, can be performed without any majoradjustments. These findings validate theeffectiveness of the model, that it is capableof solving complex multi-attribute decisionproblems, incorporating both quantitative andqualitative factors. The usefulness of thismodel, however, can be ascertained throughextensive field testing.
REFERENCES1. Asian Development Bank (1988),
“Private Sector Participation in PowerDevelopment”, ADB.
2. IAEA (1984), Expansion Planning forElectrical Generating Systems: A GuideBook, Technical Report Series 3241,Vienna.
3. Jichu Lou (1984), “Theoretical Investigationof Probability and Economy of Power
Plants”, Kraftwerk Guiyang China Waerme,Vol. 90, No. 3, pp. 83-86.
4. Chung-Hsiao Wang and Jo MinK (2000),“Generation Planning with QuantifiedOutage Costs”, Electr. Power Syst. Res.,Vol. 54, pp. 37-46.
5. Kordan L M (1984), “Mathematical Modelsfor Power Generation ReliabilityEvaluation”, Acad. Sci. Moldavian SSRDept. Power Eng. Cybern Kishinev.USSR Electron Model, Vol. 3, No. 6,pp. 1234-1244.
6. Gupta V K, Prasad M and Agrawal A K(1989), “Transient TemperatureBehaviour of a Cooling Pond for aThermal Power Generator”, I. J. Me.,Vol. 70, pp. 62-66.
7. Jain M K, Iyengar R K and Jain R K(1985), Numerical Methods for Scientificand Engineering Computation, WileyEastern, New Delhi, India.
8. Kusiak A and Wang J (1993), “EfficientOrganizing of Design Activities”, Int. J.Prod. Res., Vol. 31, No. 4, pp. 753-769.
9. Matto R L (1997), “Coal Quality andPerformance of NTPC Lower Plant”,Indian J. Power River Valley Dev.,Vol. XLVII, Nos. 6 & 7, p. 122.
10. Selot S C (1986), “Economics of PowerPlants: A Case Study”, I. J. Me.,Vol. 67, pp. 4-6.
11. Chen S J and Hwang C L (1992), “FuzzyMultiple Attribute Decision Making-Methods and Applications”, LectureNotes in Economics and MathematicalSystems, Springer, Berlin.
310
Int. J. Mech. Eng. & Rob. Res. 2012 Sandeep Rathee et al., 2012
12. Widiyanto A, Kato Seizo and MaruyamaN (2004), “Optimizing Selection ofAppropriate Power Generation inIndonesia by Using Distance BasedApproach Method”, J. Energy ResourTechnol., p. 126.
13. Deo N (1974), Graph Theory withApplication to Engineering andComputer Science”, Engle Wood Cliff,Prentice Hall, New Jersey.
14. Agrawal V P and Rao J S (1987),“Structural Cassification of KinematicChains and Mechanisms”, Mech. Mach.Theory, Vol. 22, No. 5, pp. 489-496.
15. Agrawal V P and Rao J S (1989),“Identification and Isomorphism ofKinematic Chains and Mechanisms”,Mech. Mach. Theory, Vol. 24, No. 4,pp. 309-321.
16. Gandhi O P and Agrawal V P (1994),”A Digraph Approach to System WearsEvaluation and Analysis”, Trans. ASME:J. Tribology, Vol. 116, No. 4, pp. 268-274.
17. Michael J Reale (2005), “New HighEfficiency Simple Cycle Gas Turbine”,16th Symposium on Industrial Applicationof Gas Turbines (IAGT), Canada.