effect of sugar co ce tratio , fruit co te t thesis pak.pdf · physico-chemical analysis ... effect...
TRANSCRIPT

EFFECT OF SUGAR CO�CE�TRATIO�, FRUIT CO�TE�T
A�D CHEMICAL PRESERVATIVES O� ACCEPTABILITY
A�D SHELF LIFE OF JAM
BY
WASEEM TAHIR
MASTER OF SCIENCE (HONS) IN AGRICULTURE (FOOD SCIENCE AND TECHNOLOGY)
DEPARTME�T OF FOOD SCIE�CE & TECH�OLOGY,
FACULTY OF �UTRITIO� SCIE�CES
�WFP AGRICULTURAL U�IVERSITY,
PESHAWAR-PAKISTA�. June, 2002.

EFFECT OF SUGAR CO�CE�TRATIO�, FRUIT CO�TE�T
A�D CHEMICAL PRESERVATIVES O� ACCEPTABILITY
A�D SHELF LIFE OF JAM
BY
WASEEM TAHIR
Thesis submitted to the WFP Agricultural University, Peshawar in partial
fulfillment of the requirements for the degree of
MASTER OF SCIENCE (HONS) IN AGRICULTURE (FOOD SCIENCE AND TECHNOLOGY)
Approved By:
ADVISOR: Dr. Javidullah
Assistant Professor
Department of Food Science & Technology,
N.W.F.P Agricultural University, Peshawar
Co-ADVISOR: Dr. Maazullah Khan
Senior Engineer (Agri.)
Nuclear Institute for Food and Agriculture (NIFA)
Tarnab, Peshawar.
CONVENER: Mr. Bakhtiar Hussain
Board of Studies Chairman.
Department of Food Science & Technology,
N.W.F.P Agricultural University, Peshawar.
DEPARTME�T OF FOOD SCIE�CE & TECH�OLOGY,
FACULTY OF �UTRITIO� SCIE�CES
�WFP AGRICULTURAL U�IVERSITY,
PESHAWAR-PAKISTA�. June, 2002.

Date of Examination September 26, 2002
External Examiner: Dr. Badshah Wahid
Food Technologist,
Head
Food Technology Section,
Agricultural Research Institute Tarnab,
Peshawar, Pakistan.
Internal Examiner: Dr. Javidullah
Assistant Professor
Department of Food Science & Technology,
N.W.F.P Agricultural University, Peshawar

CO�TE�TS
Acknowledgements
Abstract ................................................................................................................ iv
I. INTRODUCTION ............................................................................................... 1
Legislation ............................................................................................... 1
Preservatives ............................................................................................ 3
II. REVIEW OF LITERATURE ............................................................................. 7
Preservatives ............................................................................................ 7
Quality Evaluation .................................................................................. 9
Formulation and Processing ................................................................... 12
III. MATERIALS AND METHODS ....................................................................... 26
Materials .................................................................................................. 26
Fruit Jam Preparation .............................................................................. 26
Packaging and Storage ............................................................................ 30
Physico-Chemical Analysis .................................................................... 31
Microbial Evaluation (Mold/Yeast Count) ............................................ 34
Sensory Evaluation ................................................................................. 35
Statistical Analysis .................................................................................. 35
IV. RESULTS AND DISCUSSION ......................................................................... 36
Physico-Chemical Analysis .................................................................... 37
Microbial Evaluation (Mold/Yeast Count) ............................................ 52
Sensory Evaluation ................................................................................. 55
V. CONCLUSION AND RECOMMENDATIONS .............................................. 74
VI. SUMMARY ......................................................................................................... 75
VII. LITERATURE CITED ....................................................................................... 78

ACK�OWLEDGEME�TS
All praise to almighty Allah. I am extremely thankful to my advisor
Dr. Javidullah Assistant Professor for positive approach in this project. I am also
thankful to Mr. Bakhtiar Hussain Chairman Department of Food Science and
Technology for his valuable suggestions and moral support.
I am highly thankful to my Co-advisor Dr. Maazullah Khan Senior
Engineering (Agri.) NIFA Tarnab Peshawar, for valuable suggestions and moral
support.
I am thankful to Mr. Haji Pervez of Imperial Foods and Wahid Traders for
providing mango pulp and commercial pectin.
Thanks are also due to Dr. Abdus Sattar (Late), Mr. Muhammad Ashraf
Chaudry, Dr. Aurangzeb, Mr. Faizullah Khan, Mr. Daulat Khan and Zahid Ali
from Nuclear Institute for Food and Agriculture (NIFA) Tarnab Peshawar, for
permission and practical help in preparing various Jam samples at Food
Engineering Laboratory at NIFA.
Lastly I would like to thanks Mr. Qasim (B.Sc.) and Sardar Shahid (M.Sc.)
for assistance in conducting various experiments during long working hours.
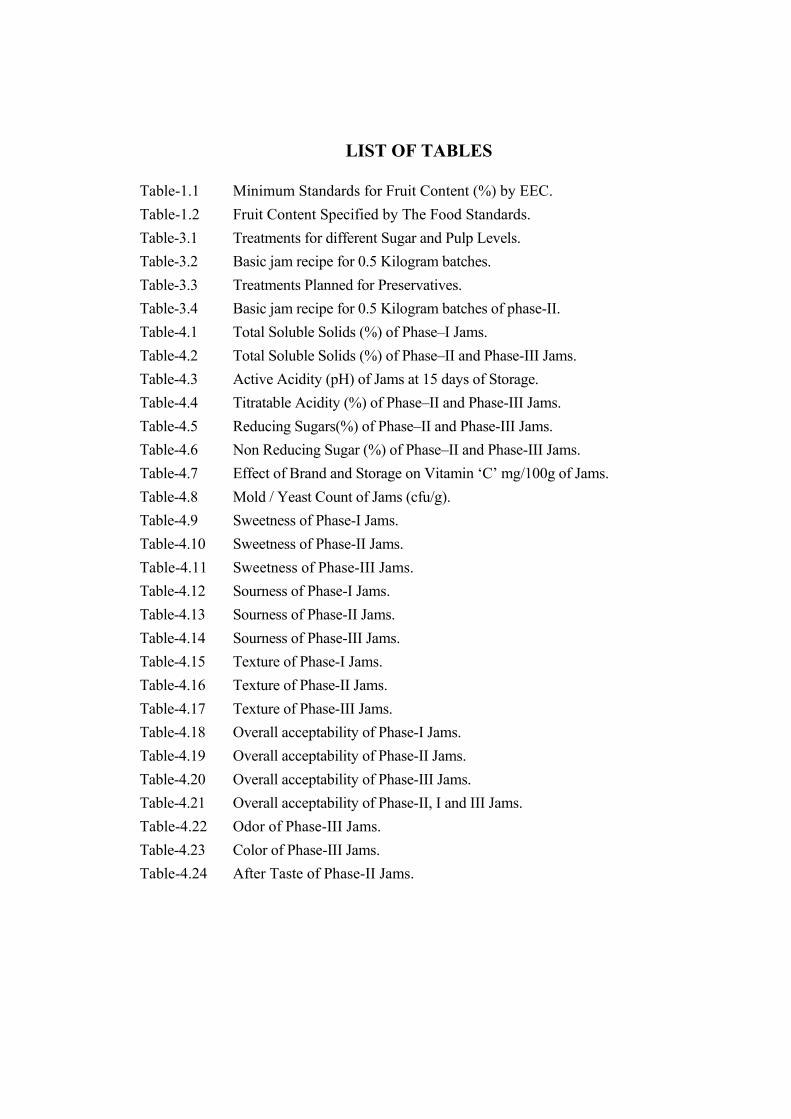
LIST OF TABLES
Table-1.1 Minimum Standards for Fruit Content (%) by EEC.
Table-1.2 Fruit Content Specified by The Food Standards.
Table-3.1 Treatments for different Sugar and Pulp Levels.
Table-3.2 Basic jam recipe for 0.5 Kilogram batches.
Table-3.3 Treatments Planned for Preservatives.
Table-3.4 Basic jam recipe for 0.5 Kilogram batches of phase-II.
Table-4.1 Total Soluble Solids (%) of Phase–I Jams.
Table-4.2 Total Soluble Solids (%) of Phase–II and Phase-III Jams.
Table-4.3 Active Acidity (pH) of Jams at 15 days of Storage.
Table-4.4 Titratable Acidity (%) of Phase–II and Phase-III Jams.
Table-4.5 Reducing Sugars(%) of Phase–II and Phase-III Jams.
Table-4.6 Non Reducing Sugar (%) of Phase–II and Phase-III Jams.
Table-4.7 Effect of Brand and Storage on Vitamin ‘C’ mg/100g of Jams.
Table-4.8 Mold / Yeast Count of Jams (cfu/g).
Table-4.9 Sweetness of Phase-I Jams.
Table-4.10 Sweetness of Phase-II Jams.
Table-4.11 Sweetness of Phase-III Jams.
Table-4.12 Sourness of Phase-I Jams.
Table-4.13 Sourness of Phase-II Jams.
Table-4.14 Sourness of Phase-III Jams.
Table-4.15 Texture of Phase-I Jams.
Table-4.16 Texture of Phase-II Jams.
Table-4.17 Texture of Phase-III Jams.
Table-4.18 Overall acceptability of Phase-I Jams.
Table-4.19 Overall acceptability of Phase-II Jams.
Table-4.20 Overall acceptability of Phase-III Jams.
Table-4.21 Overall acceptability of Phase-II, I and III Jams.
Table-4.22 Odor of Phase-III Jams.
Table-4.23 Color of Phase-III Jams.
Table-4.24 After Taste of Phase-II Jams.

LIST OF APPE�DICES
Appendix-1 ANOVA on Total Soluble Solids of Phase-II & III Jams.
Appendix-2 ANOVA on Acidity of Phase-II & III Jams.
Appendix-3 ANOVA on Reducing Sugars of Phase-II & III Jams.
Appendix-4 ANOVA on Non Reducing Sugar of Phase-II & III Jams.
Appendix-5 ANOVA on Ascorbic Acid of Phase-III Jams.
Appendix-6 ANOVA on Mold Count of Phase-II & III Jams.
Appendix-7 ANOVA on Sweetness of Phase-I Jams.
Appendix-8 ANOVA on Sweetness Phase-II Jams.
Appendix-9 ANOVA on Sweetness of Phase-III Jams.
Appendix-10 ANOVA on Sourness of Phase-I Jams.
Appendix-11 ANOVA on Sourness Phase-II Jams.
Appendix-12 ANOVA on Sourness of Phase-III Jams.
Appendix-13 ANOVA on Texture of Phase-I Jams.
Appendix-14 ANOVA on Texture Phase-II Jams.
Appendix-15 ANOVA on Texture of Phase-III Jams.
Appendix-16 ANOVA on Overall Acceptability of Phase-I Jams.
Appendix-17 ANOVA on Overall Acceptability Phase-II Jams.
Appendix-18 ANOVA on Overall Acceptability of Phase-III Jams.
Appendix-19 ANOVA on Overall Acceptability of Phase-I, II and III Jams.
Appendix-20 ANOVA on Odor of Phase-III Jams.
Appendix-21 ANOVA on Color of Phase- III Jams.
Appendix-22 ANOVA on After Taste of Phase- III Jams.
Appendix-23 Proforma used for Sensory Evaluation of Phase-I, II and III Jams.
iv
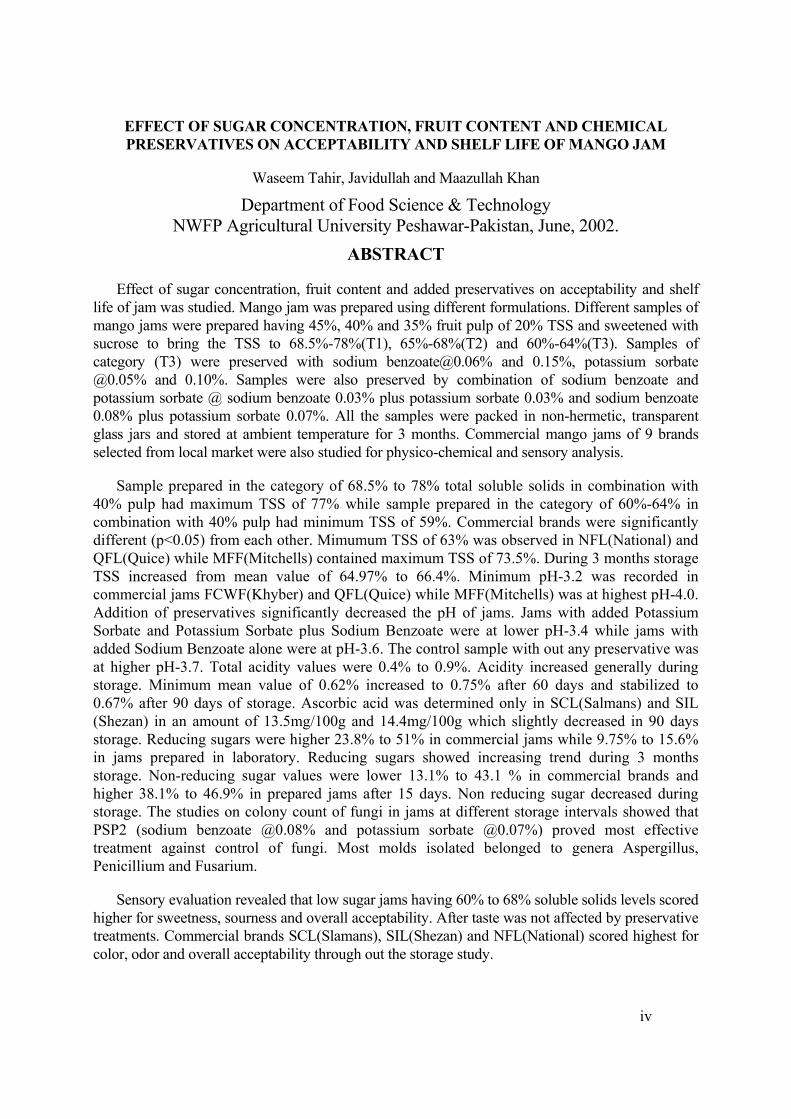
EFFECT OF SUGAR CO�CE�TRATIO�, FRUIT CO�TE�T A�D CHEMICAL
PRESERVATIVES O� ACCEPTABILITY A�D SHELF LIFE OF MA�GO JAM
Waseem Tahir, Javidullah and Maazullah Khan
Department of Food Science & Technology
NWFP Agricultural University Peshawar-Pakistan, June, 2002.
ABSTRACT
Effect of sugar concentration, fruit content and added preservatives on acceptability and shelf
life of jam was studied. Mango jam was prepared using different formulations. Different samples of
mango jams were prepared having 45%, 40% and 35% fruit pulp of 20% TSS and sweetened with
sucrose to bring the TSS to 68.5%-78%(T1), 65%-68%(T2) and 60%-64%(T3). Samples of
category (T3) were preserved with sodium [email protected]% and 0.15%, potassium sorbate
@0.05% and 0.10%. Samples were also preserved by combination of sodium benzoate and
potassium sorbate @ sodium benzoate 0.03% plus potassium sorbate 0.03% and sodium benzoate
0.08% plus potassium sorbate 0.07%. All the samples were packed in non-hermetic, transparent
glass jars and stored at ambient temperature for 3 months. Commercial mango jams of 9 brands
selected from local market were also studied for physico-chemical and sensory analysis.
Sample prepared in the category of 68.5% to 78% total soluble solids in combination with
40% pulp had maximum TSS of 77% while sample prepared in the category of 60%-64% in
combination with 40% pulp had minimum TSS of 59%. Commercial brands were significantly
different (p<0.05) from each other. Mimumum TSS of 63% was observed in NFL(National) and
QFL(Quice) while MFF(Mitchells) contained maximum TSS of 73.5%. During 3 months storage
TSS increased from mean value of 64.97% to 66.4%. Minimum pH-3.2 was recorded in
commercial jams FCWF(Khyber) and QFL(Quice) while MFF(Mitchells) was at highest pH-4.0.
Addition of preservatives significantly decreased the pH of jams. Jams with added Potassium
Sorbate and Potassium Sorbate plus Sodium Benzoate were at lower pH-3.4 while jams with
added Sodium Benzoate alone were at pH-3.6. The control sample with out any preservative was
at higher pH-3.7. Total acidity values were 0.4% to 0.9%. Acidity increased generally during
storage. Minimum mean value of 0.62% increased to 0.75% after 60 days and stabilized to
0.67% after 90 days of storage. Ascorbic acid was determined only in SCL(Salmans) and SIL
(Shezan) in an amount of 13.5mg/100g and 14.4mg/100g which slightly decreased in 90 days
storage. Reducing sugars were higher 23.8% to 51% in commercial jams while 9.75% to 15.6%
in jams prepared in laboratory. Reducing sugars showed increasing trend during 3 months
storage. Non-reducing sugar values were lower 13.1% to 43.1 % in commercial brands and
higher 38.1% to 46.9% in prepared jams after 15 days. Non reducing sugar decreased during
storage. The studies on colony count of fungi in jams at different storage intervals showed that
PSP2 (sodium benzoate @0.08% and potassium sorbate @0.07%) proved most effective
treatment against control of fungi. Most molds isolated belonged to genera Aspergillus,
Penicillium and Fusarium.
Sensory evaluation revealed that low sugar jams having 60% to 68% soluble solids levels scored
higher for sweetness, sourness and overall acceptability. After taste was not affected by preservative
treatments. Commercial brands SCL(Slamans), SIL(Shezan) and NFL(National) scored highest for
color, odor and overall acceptability through out the storage study.

1
Chapter-1
I�TRODUCTIO�
Commercial production of fruit jams is subject to standard formulations of fruit type,
sugar content, adjusted acidity and pectin content. Jam is defined as a semisolid food made
from not less than 45 % (by weight) fruit and 55% (by weight) sugar (Desrosier and
Desrosier, 1978). This substrate is concentrated to 65% or above soluble solids. Flavoring
and coloring agents may be added. Pectin and acid may be added to overcome the
deficiencies that occur in the fruit itself. Standard formulations are developed according to
their end use, consumer preferences, market demand, food laws, buyer’s specifications and
economic utilization of inputs required.
Relationship between Pectin, Sugar and Active Acidity (pH)
Gel formation occurs only within a narrow range of pH values. Optimum pH
conditions are found near 3.2 for gel formation. The optimum solids range is slightly above
65%. It is possible to have gel formation at 60% solids, by increasing the pectin and acid
levels. The quantity of pectin required for gel formation is dependent upon the quality of the
pectin. Ordinarily, slightly less than 1% is sufficient to produce a satisfactory structure.
(Desrosier and Desrosier, 1978). An economical formulation can be developed by using
minimum necessary sugar to pulp ratio and adjusted solids between 60% and 65%.
Legislation
The European Economic Community (EEC) Council Directive of 24 July
1979 (79/693/EEC : OJ �o. L205, 13.8.1979, p.5) lays down the standards for extra
jam, jam, extra jelly, jelly, marmalade and chestnut puree to be made effective in member
states. Extra jam and extra jelly contain higher quantities of fruit. Refractometer soluble
2
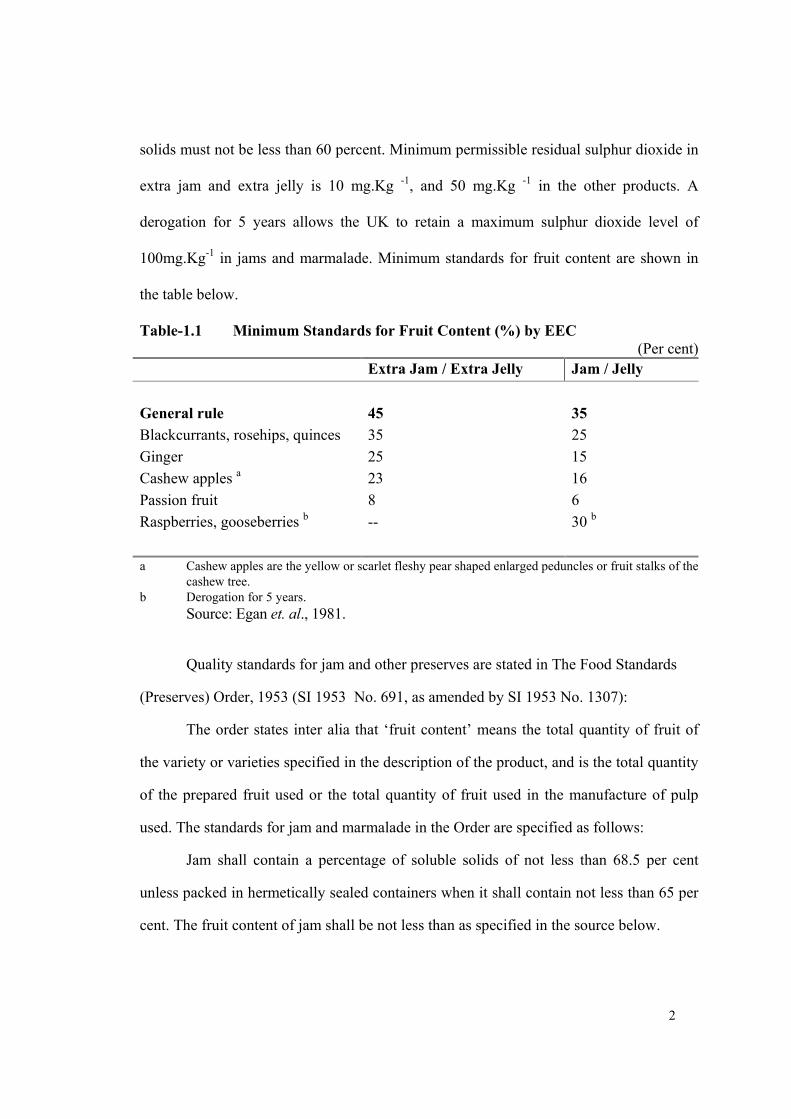
solids must not be less than 60 percent. Minimum permissible residual sulphur dioxide in
extra jam and extra jelly is 10 mg.Kg -1, and 50 mg.Kg
-1 in the other products. A
derogation for 5 years allows the UK to retain a maximum sulphur dioxide level of
100mg.Kg-1 in jams and marmalade. Minimum standards for fruit content are shown in
the table below.
Table-1.1 Minimum Standards for Fruit Content (%) by EEC
(Per cent)
Extra Jam / Extra Jelly Jam / Jelly
General rule 45 35
Blackcurrants, rosehips, quinces 35 25
Ginger 25 15
Cashew apples a 23 16
Passion fruit 8 6
Raspberries, gooseberries b -- 30
b
a Cashew apples are the yellow or scarlet fleshy pear shaped enlarged peduncles or fruit stalks of the
cashew tree.
b Derogation for 5 years.
Source: Egan et. al., 1981.
Quality standards for jam and other preserves are stated in The Food Standards
(Preserves) Order, 1953 (SI 1953 No. 691, as amended by SI 1953 No. 1307):
The order states inter alia that ‘fruit content’ means the total quantity of fruit of
the variety or varieties specified in the description of the product, and is the total quantity
of the prepared fruit used or the total quantity of fruit used in the manufacture of pulp
used. The standards for jam and marmalade in the Order are specified as follows:
Jam shall contain a percentage of soluble solids of not less than 68.5 per cent
unless packed in hermetically sealed containers when it shall contain not less than 65 per
cent. The fruit content of jam shall be not less than as specified in the source below.

3
Table-1.2 Fruit Content Specified by The Food Standards
Description of jam Fruit content %
Blackcurrant 25
Fig and lemon 40 (8)
Gooseberry and raspberry 30
Gooseberry and strawberry 30
Melon and lemon 40 (8)
Melon and pineapple 40 (5)
Raspberry 30
Raspberry and gooseberry 30
Raspberry and redcurrant 30
Redcurrant 35
Rhubarb and ginger 40 (1)
Strawberry 38
Strawberry and gooseberry 35
Youngberry 38
All other varieties 40
Source: Egan et. al., 1981.
The first-named fruit in all mixed jams should amount to not less than 50 per cent
and not more than 75 per cent of the fruit content. Where figures appear in brackets in the
second column of the table above, the figure in each case denotes the minimum
percentage by weight of the second named fruit to be contained in the finished jam. No
jam or marmalade shall contain any added acid other than citric, tartaric or malic acid.
PRESERVATIVES
High sugar content of jam suggests that these products should resist spoilage by
microorganisms. However, even 68% sugar solids is not a guarantee against the growth of
certain molds and yeasts, particularly molds. It might be mentioned that an Aspergillus

4
glaucus mold has been found that will grow readily in 68% sugar solutions and requires
heating to 74oC for 20 min for inactivation. (Desrosier, 1977).
Most jam is manufactured from sulphited pulp containing up to 3000 mg. Kg -1 of
sulphur dioxide but most of the preservative is lost during boiling (Egan et. al., 1981).
Sodium Benzoate may be used as a preservative (if declared on the label). Benzoic
acid and Sodium Benzoate are generally regarded as safe up to a maximum permitted level
of 0.1%. In most countries, the maximum permissible quantities generally range between
0.15 and 0.25%. Sorbic acid and its salts are some of the most widely used food
preservatives in the world. As food preservatives, sorbates have found wide application in
various foods, especially as yeast and mold inhibitors. Effective antimicrobial
concentrations of sorbates in most foods are in the range of 0.05% - 0.30%. In high sugar
products (e.g jams, jellies) smaller quantities of sorbic acid are adequate for preservation,
because of synergistic action of sorbate with sugar (Lueck, 1980). In these products sorbate
is either added directly in to the product or applied to the surface of the product or packaging
material.
There is no preservative that is completely effective against all microorganisms
present in a given foodstuff. In theory, one should be able to combine various preservatives
to achieve a broader spectrum and increased antimicrobial action (Lueck, 1980). Generally
Combination of methods are applied for the proper sterilization of the product and package
to inhibit microbial growth. This research work is based on the preparation of fruit jam with
different concentration of sugar, development of an economical product with different sugar
and pulp ratio, investigation of the mold growth, shelf stability and acceptability of added

5
chemical preservatives of sorbates and benzoates in low solid fruit jam packed in non
hermetic containers.
This study is beneficial in many aspects. It emphasizes the proper grading and
standardization of fruit jam which determines its price. The consumer with different taste
preferences is provided with a variety of jam. Economical formulations enable producers to
reduce the price of jam. Quality evaluations of different commercial brands help to choose
the best quality jam.
The recommendation of proper and safe amount of preservatives necessary to
preserve jam below 68.5 % soluble solids help to improve the shelf stability of jam packed
in non hermetic container. This is extremely useful for small and medium scale jam
producers.

6
JELLY STRE�GTH
Continuity of structure Acidity Rigidity of Structure
Concentration of Pectin (%) pH Value Concentration of Sugar (%)
0.5 1.0 1.5 64.0 67.5 71.0
Optimum weak jelly optimum crystal form
2.7 2.8 2.9 3.0 3.1 3.2 3.3 3.4 3.5 3.6
Fig-1.1 JELLY FORMATIO� DEPE�DE�T UPO� PECTI�, SUGAR A�D ACID COMBI�ATIO�
Narrow limits of operation for successful jelly manufacture.
Source: Desrosier and Desrosier, 1978.

7
Chapter-2
REVIEW OF LITERATURE
Preservatives
Movitz (1989) listed and discussed 14 preservatives approved for use in Sweden
and the individual foods or food groups to which they may or may not be added. With
preservative, contents of fat in margarine and sugar in jam can be reduced without
impairing keeping quality. Apart from possible allergies no health risks are envisaged.
Falco et al. (1993) tested Sodium benzoate and potassium sorbate for their ability
to preserve for 3 months concentrated jam (pH 3.7, water activity 0.87) stored in non-
hermetic containers, and for their effect on Penicillium italicum and Aspergillus
ochraceus. Although both compounds reduced the microbial count in samples of the jam,
potassium sorbate was more effective than sodium benzoate. Periodic counts of aerobic
mesophiles, moulds and yeasts, and osmophilic yeasts in jam treated with 500 p.p.m.
potassium sorbate confirmed its effectiveness. A. ochraceus was significantly (P <0.05)
more resistant to the treatments than P. italicum.
Ishiwata et al. (1997) estimated the concentrations of antifungal agents permitted
as food additives (diphenyl, imazalil, o-phenylphenol and thiabendazole) in foods sold in
Japan were using the results of the official inspected in fiscal year 1994 by 74 local
governments. The total number of inspection samples was 6,633 including 289 domestic
foods. The detection rates of diphenyl, imazalil, o-phenylphenol and thiabendazole in
foods in which the use of these antifungal agents is permitted were 2.7%, 41.5%, 29.1%
and 47.0%, respectively. The mean concentrations of these antifungal agents in the
whole body of citrus fruits in all tested samples in which their use is permitted were

8
0.3%, 12.2%, 3.9% and 9.5% of the legal maxima, respectively. Imazalil in the whole
body of bananas was 0.2% of the limit, and thiabendazole in the whole banana and
banana flesh was 0.2% and 0.5% of each limit, respectively. Some antifungal agents
were detected in some processed foods in the category of marmalade and jam. The
estimated daily intakes of these antifungal agents were 2.64, 8.77, 14.1 and 34.5 mu
g/person, respectively, calculated from the mean concentrations in foods (including peel
of citrus fruits) obtained in the present study when foods containing an undetectable level
(below the detection limit) were presumed to contain 0 mg/kg and utilizing the food
consumption levels reported by the "Investigation Group of the Daily Intake of Food
Additives in Japan in fiscal year 1994". The estimated daily intake of these antifungal
agents was less than 0.7% of the Acceptable Daily Intake(ADI). Citrus fruits contributed
more than 97.4% of the daily intake of imazalil, o-phenylphenol and thiabendazole, and
75.4% of that of diphenyl. The estimated daily intakes were 11.9, 10.3, 16.6 and 39.5
mu g/person, respectively, when foods with undetectable levels of the agents were
presumed to contain these agents at concentrations equal to the detection limit. Even in
this case, the values were not more than 0.8% of the ADI.
Awan and Rehman (1999) described a fruit jam preparation procedure. Pectin,
Grade 150 Rapid set was recommended at the rate of 5g per 2 Kg of finished material.
Sodium Benzoate at the rate of 0.1 % was used as a preservative.
Implovo et al. (2000) described an isocratic HPLC technique for the
determination of benzoic acid and sorbic acid in industrial quince jam. The preparation
procedure was optimized. precipitation of proteins and fat by the addition of methanol,
followed by centrifugation and/or filtration provided an extract suitable for

9
chromatographic analysis. The chromatographic separation was achieved with a C18
column and acetate buffer (pH = 4.4) - methanol (65:35) as the mobile phase. The
effluent was monitored at 235 nm. Effective separation and quantification was achieved
in less than 7 min. Specificity of the method was checked against common food
additives added to industrial quince jam, such as L-ascorbic acid and citric acid. Diode
array detection was used for confirmation of the preservatives. Mean recoveries of 95-
104% were obtained with a precision less than 2.6%, detection limits of 25 and 6.25
mg/kg were obtained for benzoic and sorbic acids, respectively. Results were in good
agreement with the reference methods. The presence of benzoic and sorbic acids in
quince jams available on the Portuguese market, was also determined. Eleven
commercial brands of quince jam were analysed. All contained benzoic acid. The
concentration ranged from 413.9 +/- 10.4 to 1501 +/- 4.2 mg of benzoic acid/ kg of
quince jam. Only two brands also contained sorbic acid. The concentrations were 515.0
+/- 7.0 and 908.3 +/- 5.3 mg of sorbic acid/kg of quince jam.
Quality Evaluation
Hyvonen and Torma (1983) tested keeping quality of the low sugar strawberry
jams during 10 months storage at room and refrigerator temperature (5oC) according to
physical color and texture measurements, and by sensory analysis. In general sorbitol and
xylitol jams and many of the jams containing some percentage of xylitol kept either better
than or as well as the conventional sucrose jam. The color, taste and preference of HFS
and fructose jams deteriorated sooner than those of most other jams during storage. When
xylitol was used with fructose and HFS the changes in the characteristics studied were
10
retarded. During storage the xylitol-maltodextirin jams became crystallized and were
unfit for sensory evaluation.
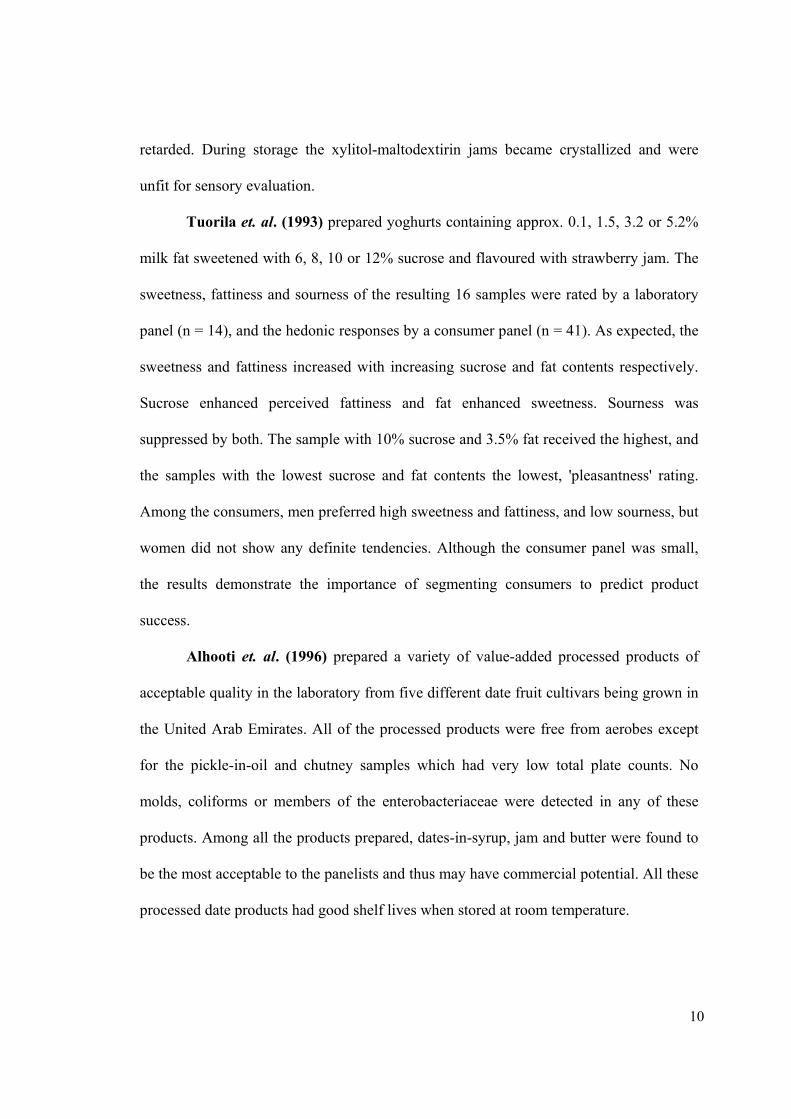
Tuorila et. al. (1993) prepared yoghurts containing approx. 0.1, 1.5, 3.2 or 5.2%
milk fat sweetened with 6, 8, 10 or 12% sucrose and flavoured with strawberry jam. The
sweetness, fattiness and sourness of the resulting 16 samples were rated by a laboratory
panel (n = 14), and the hedonic responses by a consumer panel (n = 41). As expected, the
sweetness and fattiness increased with increasing sucrose and fat contents respectively.
Sucrose enhanced perceived fattiness and fat enhanced sweetness. Sourness was
suppressed by both. The sample with 10% sucrose and 3.5% fat received the highest, and
the samples with the lowest sucrose and fat contents the lowest, 'pleasantness' rating.
Among the consumers, men preferred high sweetness and fattiness, and low sourness, but
women did not show any definite tendencies. Although the consumer panel was small,
the results demonstrate the importance of segmenting consumers to predict product
success.
Alhooti et. al. (1996) prepared a variety of value-added processed products of
acceptable quality in the laboratory from five different date fruit cultivars being grown in
the United Arab Emirates. All of the processed products were free from aerobes except
for the pickle-in-oil and chutney samples which had very low total plate counts. No
molds, coliforms or members of the enterobacteriaceae were detected in any of these
products. Among all the products prepared, dates-in-syrup, jam and butter were found to
be the most acceptable to the panelists and thus may have commercial potential. All these
processed date products had good shelf lives when stored at room temperature.

11
Halat et. al. (1997) produced Jams from fruit of eastern thornless blackberries
(Black Satin, Chester Hull Thornless, and Thornfree cultivars) harvested by hand or
machine, of a blend of imported fruit from Yugoslavia and Mexico, and of Marion
blackberries from Oregon. Jams were evaluated by 12 trained panelists for color,
spreadability, consistency, sweetness, blackberry flavor off-flavor and seediness. Jams
made from hand-harvested Marion, and Black Satin were the most red-purple in color.
Machine-harvested Chester fruit yielded the firmest jam and was among the jams rated
with the thickest mouthfeel. Jams of hand-harvested Thornfree and Black Satin fruit
were rated sweetest. No differences were noted among cultivars in seediness or
blackberry flavor Jam of Marion, Black Satin, and Chester fruit had less off-flavor than
the imported fruit blend and Thornfree; however, the intensity of off-flavor was scored
low in all jams. Jams made from hand-harvested blackberries were less seedy and had
more intense blackberry flavor than machine-harvested fruit.
Tuorila et. al. (1998) examined the acceptance of a new food 'yosa' (fermented
oat bran pudding, similar to flavored yogurt or porridge) among young (n = 44) and
elderly (n = 19) subjects. The. samples were sweetened at low or high levels of sucrose
and flavored with plum or wildberry jam (four combinations). The subjects rated the
expected and actual pleasantness, purchase interest and the extent to which they would
recommend the product to friends. Half of each age group was told that samples were
'low-calorie' while the other half was told they were 'high-fiber'. The subjects' food
neophobia score was determined. Overall, the elderly liked all samples better than the
young, and the young favored the wildberry over the plum samples. The higher sucrose
level was preferred over the lower one. 'Neophilic' subjects had higher purchase interest

12
than 'neophobic' subjects. The elderly rated their purchase interest and recommendation
to friends higher when informed of high fiber content, compared to the information of
low calorie content. The results demonstrate that the acceptance of a new product is
affected by various factors that operate either on their own (e.g. sucrose level; age group)
or in combination with other product, consumer or context based variables (e.g. type of
information x age group; type of flavor x age group x food neophobia).
Rosenfeld and �es (2000) performed sensory analysis on fresh fruits, frozen non-
cooked jam and traditionally cooked jam of 14 strawberry cultivars. The purpose was to
characterize and compare the sensory quality of different strawberry cultivars and different
types of jam. The results of the investigation were presented by means of multivariate
modelling methods such as principal component analysis (PCA) and partial least squares
regression (PLS). The sensory profile of cooked jam differed from that of fresh fruits and
frozen jam, explaining 75% of the total variation in the first component. Cooked jam scored
high for sweet taste, stickiness, bitter taste, earthy flavour, off-flavour and total intensity of
taste. Frozen jam had many of the same sensory characteristics as fresh fruits and scored
high for strawberry flavour, fruity flavour and whiteness, while fresh fruits scored highest
for colour strength, hue and sour taste. As analysed by means of PLS, sensory colour and
flavour variables of fresh fruits were able to predict 35% of sensory cooked jam variables.
Analysing early cultivars alone, sensory fresh fruit variables were able to predict 69% of
sensory cooked jam variables.
Formulation and Processing
Ali (1965) studied the storage stability of ascorbic acid in fruit juices indicated
that decrease in ascorbic acid content occurred during storage. He also reported that

13
increase in reducing sugars in canned orange juice may be due to conversion of non-
reducing sugars to reducing sugars.
Karim (1966) worked on the canning of citrus juices (grapefruit and orange
juices) and studied their keeping quality during storage. He reported that reducing sugars
increased in canned citrus juices during canning and storage at room temperature.
Tremazi (1967) reported that total soluble solids increased in canned Pakistani
peaches on storage.
Hyvonen and Torma (1983) studied the preparation of acceptable low sugar
jams and replacement of sucrose by other sweeteners in jam. Strawberry jam was
sweetened with sucrose, fructose, high fructose syrup (HFS), xylitol, sorbitol, lactose,
saccharin, cyclamate, or with combinations of these. It was technologically possible to
prepare jams with lower amounts of sucrose than currently used and still attain an
acceptable product. In addition, sucrose can be replaced in strawberry jam by other
sweeteners or by combinations of sweeteners. The attainment of a suitable texture may be
more difficult in xylitol and sorbitol jams than in jams with other sweeteners. The use of
maltodextrin as bulking agent in jam is limited by the abnormal appearance and taste it
gives to the product.
Khan (1987) conducted experiments on packed orange juice an found that total
percent acidity, total soluble solids and percent transmittance increased while ascorbic
acid and pH value decreased in the juice during storage.
Lopez et. al. (1990) described manufacture of a new low-energy form of jam roll,
one of the most frequently consumed confectionery products in Chile, in which sugars are
totally replaced by sweeteners. Moisture, ash, ether extract, protein, fibre, nitrogen-free

14
extract and total carbohydrates in the product were 57.2, 1.0, 1.7, 6.5, 0.4, 33.2 and 25.5
g/100 g compared with 33.8, 0.5, 0.4, 3.4, 0.4, 61.5 and 43.4 g/100 g in the original
product. Crude energy was 170.9 and 332.5 kcal/100 g, respectively. The product was
well accepted by a taste panel of obese subjects.
Abdel-Magied et .al. (1991) made chemical and physical determinations on 8
new Cucurbita moschata genotypes grown during 1989-90, and their prepared jams.
Sensory evaluation and microbiological assays of the jams were also carried out.
Genotypes 4 and 10 had thicker flesh than the others. High correlation was observed
between compositional traits of fruits (apart from vitamin C) with total solids (TS), total
soluble solids and carbohydrates. Genotype 2 had the highest carotene content and fruit
pigmentation. Highest jam yield (2.06 kg/kg fruit, including added sugar and water) was
given by genotype 10, against an overall mean of 1.94. This genotype also rated highest
for jam sensory quality. Low correlation coefficients between the chemical constituents
of jams were observed, except for TS and ash contents. All jams had bacterial loads of
less than 40 cells/g and were free from contamination by moulds and yeasts.
Scandinavian-Dairy-Information (1993) stated that jam without preservatives is
transported to the dairy in Fluid-Bag containers, which consist of a plastic inner bag
enclosed in an outer bag of strong plastic fabric held upright on a pallet by means of
corner supports. Bags of 750, 900 and 1000 litres capacity, which have been fitted with a
sterile filter and radiation sterilized, are filled with jam under aseptic conditions in an
atmosphere of N2. A special sterilizable connection is attached to the emptying valve for
yoghurt filling, and can be removed and cleaned between operations. Any contamination
of the jam is detected by monitoring CO2 levels in the N2-filled headspace of the bag.

15
Bera et. al. (1995) studied energy consumption patterns in canning of mango
juice, cream style corn, baked bean in tomato sauce and bottling of mixed fruit jam by
energy accounting system. Open-jacketted pan and autoclave were most energy intensive
units, and consumed more than 90% of the total energy input. Major portion of the total
input was obtained as thermal energy from solid fuel.
Defernez and Wilson (1995) analysed fourier transform infrared spectra of jams
by chemometric methods with the aim of differentiating between 'strawberry' and
'nonstrawberry' containing jams. Spectra were subjected to a data reduction step, which
was either principal component analysis (PCA)-based or partial least squares (PLS)-
based, before being classified in one of the two jam types on the basis of the smaller
distance to the group 'means'. Diffuse reflectance infrared spectra of the insoluble
materials of the jams led to a success in classification of almost 100%. However, the
preparation method was lengthy and still needs some improvement. Attenuated total
reflectance spectra of jams were classified according to fruit type with 91% success. This
method was found to be strongly influenced by the spectral differences between 'normal'
and 'reduced' total sugar content jams, which appeared in the first principal component.
Raphaelides et. al. (1996) prepared a series of peach jam samples using
commercial glucose syrups of 38DE and 44 DE, isoglucose, maltose syrup and their
mixtures with sucrose. Texture development of samples during aging was studied using
an instron machine. Jam texture was markedly affected by composition of the syrups.
Consistency of jams ranged from very firm when 100% isoglucose syrup was used to
very soft when 100% maltose syrup was used and three weeks aging was needed for

16
stabilization. Principal Component Analysis showed the jams could be classified
according to their mechanical and textural attributes.
Con et. al. (1996) conducted comparative microbiological analyses of fruit-
flavored yogurt, plain yogurt, and plain yogurt with 8% sugar. The fruit-flavored yogurts
were produced from evaporated cow's milk (19.75% dry matter) containing 16% jam
prepared with an equal weight of sugar and fruit (sour cherry, orange, strawberry, or
banana). The total plate count, lactic acid and coliform bacteria, and yeast and mold
counts were determined in yogurt samples stored for 1, 3, 5, 7, 9, and 13 days. In
conclusion, it is suggested that these types of yogurt should not be stored longer than 7
days, because when a carryover culture is used for yogurt production, most likely yeast
contamination will occur. Otherwise, pure starter culture should be utilized in yogurt
production.
Barwal and Kalia (1996) made attempts to develop low solids apple preserves
for health conscious and obese subjects through screening of gelling agents, viz., pectin,
agar-agar and guar gums. The products, thus developed, were studied for descriptive
sensory attributes of physical qualities. It was found that guar gum gave similar sensory
attributes to low solids jam as that of standard product However, agar-agar at 1% level
was suitable for the preparation of transparent, crumby and firm low solids apple jelly of
acceptable sensory characteristics.
Garciaviguera et. al. (1997) described an HPLC technique for the analysis of
anthocyanins from various fruit jams used to monitor the stability of anthocyanins during
processing. Commercial jams made from strawberry, blackberry, raspberry, blueberry,
blackcurrant and cherry were studied. Each product had a distinctive anthocyanin pattern

17
which enabled identification and characterisation of each jam. The manufacturing process
had no effect on the qualitative anthocyanin profile.
Bakr (1997) studied preparation of acceptable low energy fibre enriched and
diabetic jams, cakes and biscuits using different formulae of sucrose substitutes with the
partial replacement of wheat flour with bran as a source of dietary fibre. The nutritional
and storage qualities and the potential effect of most acceptable formulae from each food
group on the blood glucose level of lean and obese diabetes mellitus patients was
evaluated. It was technologically possible to prepare acceptable highly nutritional
diabetic and low energy apricot; guava and strawberry jams and jellies using
combinations of sweeteners including xylitol (xylitol-sorbitol-aspartame and xylitol-
fructose). The attainment of a suitable texture was difficult in xylitol and sorbitol jams,
therefore 0.2g CaCl2.H2O was added. Storage of these jams at 4oC improved their
keeping quality (p<0.05), where the microbial load was <20 cells/g and the products were
free from moulds and yeasts. Also, high nutritional and acceptable cakes and biscuits for
low energy supply and for diabetic subjects can be sweetened with low levels of
aspartame in combination with fructose, sorbitol and xylitol. Consumption of such low
energy and diabetic food items reduced (p<0.05) the plasma glucose level in lean and
obese diabetics. Addition of wheat bran in bakery products not only reduced energy value
of these foods and blood glucose, but it also improved peripheral insulin activity.
Villaran et. al. (1997) studied the rheological behaviour of apricot jam (Prunus
armeniaca) made with sucrose, and jams of bilberry (Vaccinium myrtillus) and rosehips
(Rosa canina) prepared for dietary use with fructose in a temperature range of 5-65 oC.
All three jams presented thixotropy, and the decrease in stress with time fit first order

18
kinetics. The flow behaviour can be described by power equations and the Herschel-
Bulkey equation. The relation between temperature and apparent viscosity was described
with the Arrhenius-Guzman equation.
Viberg et. al. (1997) manufactured Blackcurrant (Ribes nigrum) jam with the aim
of producing a jam with a low sugar content, and without any additives. Four
temperatures were investigated, namely 60 oC, 76
oC, 92
oC and 97
oC. Processing time
varied between 1-20 min. After processing, the highest content of ascorbic acid was
found in the jam processed at 97 oC for 1 min, which contained 63.3 +/- 2.6 mg ascorbic
acid/100 g jam. At all combinations investigated more than 60% of the original amount
of ascorbic acid was retained after manufacturing and packaging. The jam made at 92 oC
was stored in a shelf-life study for 13 months. The jam was then stored at 8 degrees C,
ambient temperature and at 37 oC. At ambient temperature the jam was stored both in
dark and in daylight, at 8 oC and at 37
oC the jam was stored in dark. After 13 months of
storage, at 8 oC, 60% of the amount of ascorbic acid and 29% of the amount of
anthocyanins were retained. In the jam stored at higher temperatures less of both was
retained. The beta-carotene in the jam was found to be stable throughout the whole shelf-
life study. Exposure to light did not have any effect on any of the components studied.
The degradation of anthocyanins was best described by a second-order reaction and the
activation energy was determined to be 90 kJ/mol. A jam of blackcurrant may be
considered as a good source of vitamins and antioxidants after one year, if certain
precautions concerning manufacture and storage conditions are taken.
Garcia-Viguera et .al. (1998) analysed Anthocyanin and colour stability of red
raspberry jams made from two different varieties ('Zeva' and 'Heritage') during 6 months,
19
stored at three temperatures (20, 30 and 37 oC). Also the influence of freezing the fruit,
previously to jam manufacture, was evaluated. Different anthocyanin composition was
detected for both cultivars and while 'Zeva' fruit had a higher total anthocyanin content,
Heritage variety produced jams with a higher redness hue. The development of browning
was directly related to storage temperature but not to thawing or the variety of fruit used.
Zafrilla et. al. (1998) stated that a recurrent problem in the fruit processing
industry is the loss of colour in fruit preserves during storage. Colour of such products
may be fortified by adding natural colourants. In this work a commonly used colourant
(elderberry extract) is compared with a newly proposed alternative, pomegranate juice,
for the stabilization of strawberry jam colour. The results showed that adding a colourant
to the jams helped to maintain the colour, and that the pomegranate-derived colourant
could possibly be used as an alternative to elderberry pigments for this purpose.
Garcia-Viguera et. al. (1999) evaluated the stability of three strawberry cultivars
for changes in jam color quality during processing and storage at 20 oC, 30
oC and 37
oC
for 200 days. Anthocyanin content was determined by HPLC, The effect of cultivar,
processing and storage on jam pigments, instrumental color (L*, a*, b*) and consumer
preference were also determined. 'Oso grande' jam had the lowest anthocyanin
concentration (110 mg/g f.w), higher monomeric pigment degradation during processing
and storage, highest pH, least desirable color score from the sensory panel and shortest
shelf-life. Similarities were found between jams prepared with Chandler' and 'Tudla'
cultivars, as well as initial differences in total anthocyanin concentrations (195 and 130
mg/g f.w.).
20
Prestamo et.al. (1999) described that high pressure is an alternative to thermal
processing and is used to preserve food. Listeria monocytogenes is a bacterium which
grows at low temperature, is able to multiply under vacuum, and is responsible for food
poisoning. Pressures of 100, 200, 300 and 400 MPa were used for 5, 10 and 15 min at
20 oC on pure culture, and on apple and plum jam baby food artificially contaminated
with Listeria. Pure culture was also to test pressures of 200, 300, 350 and 400 MPa at
5 oC for 30 min. The results were analysed statistically and showed that there were no
significant differences between pressures of 100 and 200 MPa at 5, 10 and 15 min.
However, at 300 MPa, there were significant differences at 15 min. When the pressure
treatment was 400 MPa, significant differences were observed at pressure times of 5, 10
and 15 min. The results were fitted to a linear curve. In pure culture, no viable cells were
detected after high pressure treatment of 350 MPa for 30 min at 5 degrees C. The use of
low temperature helps to maintain the sensory properties of the product.
Will and Kruges (1999) studied the fate of three fungicides (dichlofluanid,
procymidone, and iprodione) applied under field conditions during strawberry processing
to juice, wine, and jam. An untreated control was compared to raw material treated with
fungicides according to recommended doses and to a sample with 6-fold higher
application rates. The highest residue values mere found in the pomace after pressing.
Residue values in readily produced juices and fruit wines were very low and did not-
exceed legally required maximum residue levels. Generally, processing steps such as
pressing and clarification diminished fungicide residues from 50 to 100%. If the whole
fruit is processed, as in fruit preparations or jam, the residue levels remain higher due to
missing processing steps.
21
Barwal (1999) developed low calorie (dietetic) mixed fruit jam, apple jelly and
apricot squash with out compromising sensory qualities, using non-nutritive sweeteners
and food additives at optimum fruit constituents. The physico-chemical and sensory
observations were recorded at different intervals during storage period of 90 days at
ambient conditions. The results indicated that the dietetic products sweetened with
cyclamate were better than saccharin and were comparable with standard products. The
development efforts successfully reduced caloric value by up to 13.0, 8.0, and 25.0% in
jam, jelly and squash per difference between 50% saccharin sweetened and 50 and 75%
cyclamate sweetened was not significantly different.
Kar and Arslan (1999) examined the effects of temperature and concentration on
the viscosity of orange peel pectin solutions at five different temperatures between 20 and
60 oC and five concentration levels between 2.5-20 kg/m(3). The effects of temperature
was described by an Arrhenius-type equation. The activation energy for viscous how was
in the range 19.53-27.16 kJ/mol, depending on the concentration. The effect of
concentration was described by two types of equation, power-law and exponential.
Equations were derived which describes the combined effects of temperature and
concentration on the viscosity for two different models in the range of temperatures and
concentrations studied. Orange peel pectin was extracted by using HCl (pH 2.5, 90 oC,
90 min) ammonium oxalate (0.25%, pH 3.5, 75 oC, 90 min) and EDTA (0.5%, 90
oC, 90
min) extraction procedures. The best result was obtained with ammonium oxalate
extraction in which the pectin content of the final product was 30.12%, although the
efficiency among the procedures varied. The average molecular weight was measured by
light scattering technique. Magnitudes of intrinsic viscosity and molecular weight of

22
pectins obtained by extraction with HCl, ammonium oxalate and EDTA were 0.262,
0.281, 0.309 m(3)/kg and 84 500, 91 400, 102 800 kg/kgmol, respectively. The
molecular weight dependence of the intrinsic viscosity of the orange peel pectin
solutions was expressed by Mark-Houwink-Sakurada equation. The data were fined to
equation as eta(i) = 2.34 X 10(-5) (M-w,M-ave)(0.8224) which helps to evaluate the
average molecular weight of pectin solutions from orange peel with a Knowledge of
their intrinsic viscosity.
Prestamo et. al. (1999) observed that High pressure is an alternative to thermal
processing and is used to preserve food. Listeria monocytogenes is a bacterium which
grows at low temperature, is able to multiply under vacuum, and is responsible for food
poisoning. Pressures of 100, 200, 300 and 400 MPa were used for 5, 10 and 15 min at
20 oC on pure culture, and on apple and plum jam baby food artificially contaminated
with Listeria. Pure culture was also to test pressures of 200, 300, 350 and 400 MPa at
5 oC for 30 min. The results were analysed statistically and showed that there were no
signifcant differences between pressures of 100 and 200 MPa at 5, 10 and 15 min.
However, at 300 MPa, there were significant differences at 15 min. When the pressure
treatment was 400 MPa, significant differences were observed at pressure times of 5, 10
and 15 min. The results were fitted to a linear curve. In pure culture, no viable cells were
detected after high pressure treatment of 350 MPa for 30 min at 5 oC. The use of low
temperature helps to maintain the sensory properties of the product.
Riaz et. al. (1999) prepared strawberry jam from fresh supply of fruit and after
had been stored at -4oC for 60 days. Different formulations were tried with particular
emphasis on the effect of commercial grade pectin and apple pulp pectin on the ultimate

23
quality of strawberry jam. The products were subjected to organoleptic testing as well as
chemical analysis on day 0, 30, 60 and 90 of storage. At the onset of the experiment, the
maximum sensory appeal was recorded for samples made from the fresh fruit. The jams
prepared from strawberry preserved at -4oC for 60 days possessed less attractive color
and secured less scores as compared to the jam made from fresh fruit. For taste and flavor
attributes, almost similar scores were recorded for both types on storage. Formulations
containing apple pulp pectin were better than those having commercial grade pectin.
During storage, decline in vitamin C, non-reducing sugars and pH values, and rise in the
total soluble solids, reducing sugars and water-soluble pectin were observed.
Suutarinen et. al. (2000) studied the structural changes in strawberry tissues
during prefreezing treatments, freezing, thawing and jam making by means of
instrumental textural measurements and by bright-field as well as by Fourier transform
infrared microscopical studies and sensory evaluation. Calcium chloride, pectin
methylesterase (PME) or crystallized sucrose were used as pretreatment agents before
freezing. Calcium chloride and PME treatments were used either at normal air pressure or
in a vacuum. In addition, strawberries were dipped in calcium chloride solution after
which they were sprinkled with crystallized sucrose. Strawberries were also just sprinkled
with crystallized sucrose. Jams made from strawberries treated with CaCl2 and PME in a
vacuum or with CaCl2 and crystallized sucrose, respectively: had the highest firmness
values (about twice as great as the reference sample). Firmness of jam berries correlated
negatively with firmness of jam media, i.e. jams with finner strawberries had less firm
medium. According to microscopical studies, both CaCl2 and PME in a vacuum and
CaCl2 and sucrose pretreatments, respectively: affected the microstructure of strawberry

24
tissues. These pretreatments seemed to stabilize the vascular tissue and to affect pectin,
protein and structural carbohydrate. The use of a vacuum seemed to affect the
pretreatment solutions, affording more effective absorption to the cortex and pith and
providing stabilization there, especially for pectin and structural carbohydrate.
According to sensory evaluation of the jams, different prefreezing treatments were
shown to have a significant influence on the sensory attributes evaluated. The textural
attributes in particular were statistically significantly different among the strawberry
jams: wholeness of the berries in the jam (P < 0.001), firmness (P < 0.001) and clarity (P
= 0.001) of the jam medium as well as redness of the jam colour (P < 0.05) were
different among the strawberry jams analysed.
Grigelmo Miguel and Mortin Belloso (2000) evaluated the quality of peach
jams with peach dietary fiber (DF) as thickener. Peach jams with soluble solids contents
of up to 40, 45, 50 and 55 degrees Brix with total or partial substitution of commercial
amidated pectin by peach DF were studied. The uronic acid contents (pectin substances)
in the jam formulations were 0, 25, 50, 75 and 100% from peach DF with the residue
from the commercial pectin. Jam color was not affected by the incorporation of DF
because both the DF and the puree came from peach. Peach jams showed a pseudoplastic
flow behavior, which fitted well to the power-law model, and the viscosity of jams
increased with the DF content. From a sensorial point of view, high peach DF jams were
as acceptable as conventional jams.
Anjum et. al. (2000) prepared dried apricot jam by incorporating a suitable
combination of sorbitol, cyclamate and aspartame instead of sucrose and glucose syrup
on the equivalent solid basis. The treatments were analyzed of physico-chemical and
sensory evaluation fortnightly for two months. Significant results were obtained for TSS,
pH, acidity and reducing sugars with regard to treatments and storage periods. All the
sensory characteristics affected significantly due to the differences in sweetener
25
combinations while the effect of storage period was found to be non-significant. There
was no effect of treatment and storage period on ash contents of apricot jam. The total
soluble solids increased gradually in all treatments during storage periods. The mean TSS
was 68.9 at 0 days which rose to 69.60 after 60 days of storage. Minimum percent acidity
i.e. 0.69 was observed in sample containing 85% sorbitol, 7.5% cyclamate, 7.5%
aspartame. Minimum reducing sugars 2.43% were recorded in sample containing 80%
sorbitol, 10% cyclamate and 10% aspartame in their compositions. In organoleptic
evaluation, all treatments remained acceptable during 60 days of storage. Samples
containing sorbitol, aspartame and cyclamate in the ration 85:7.5:7.5 and 80:10:10,
respectively could be prepared successfully on commercial scale manufacturing due to
attractive color, good taste, charming flavor and low calories.
Torezan (2002) studied two types of mango (cv. Keitt) jam: one formulated with
no sugar addition, produced by a continuous process, in order to minimize nutritional and
organoleptic losses, since the heating is very quick (A); and one containing sugar
processed at atmospheric pressure (B). The jams were compared chemically and
physically (soluble solids, pH, total titratable acidity, moisture, water activity, reducing
and total sugars, vitamin C, synersis, color, texture by texturometer), and subject to a
sensory acceptance test, in terms of odor, flavor, appearance and texture. The results
indicated that both formulations presented pH (3.3 for A, 3.4 for B) and acidity (0.9% for
A, 0.6% for B) values within the proper ranges for jellification. Jam A presented about
twice the vitamin C content (14.5 mg/100g) of B (7.6 mg/100g), because of its faster
processing, reducing thermal and oxidative degradation. Acceptance scores varied from
“I liked slightly” to “I liked moderately”. There were significant differences for flavor
(6.38 for A, 7.38 for B) and texture (7.36 for A, 6.18 for B). The better texture value of A
can be attributed to its lower value for hardness (44.2g for A and 169.5g for B in
texturometer test), facilitating its spreadibility. It was concluded that mango is adequate
for the production of conventional or dietetic jam, with good acceptance and feasible
industrialization.

26
Chapter-3
MATERIALS A�D METHODS
1. Materials
Frozen Mango Pulp (Mangifera indica L. ) was used in preparation of the jams. The
test jams were sweetened with sucrose (sugar). Citric acid, table salt, sodium benzoate,
potassium sorbate, pectin, mango flavor (all commercial grade) were used as additives.
Commercial mango jams of 9 brands were also obtained from the local market for
comparison and analysis of quality attributes.
2. Fruit Jam Preparation
The test jams were prepared in two phases with different formulations while quality
study of nine commercial jams was included in phase three. The jam preparation procedure
for treatments was adopted from Awan and Rehman (1999).
Phase-I: Sugar and Pulp Ratio
The test jams were cooked in batches of 0.5 Kg in open steel kettles. The ingredients
and additives that were unchanged in all the jams of phase-I are stated in the basic recipe
(Table-3.2). The frozen mango pulp was defrosted one day before cooking. On the
following day sugar and pulp were weighed according to the formulation and heated to
boiling and allowed to boil for 10 minutes. Citric acid and salt dissolved in water was added
at this stage.
Pectin (4g) was mixed in hot water until dissolved (slowly to prevent lumps
formation) separately and added to the kettle. The mixture was allowed to boil for further 5
minutes to ensure complete dissolution of pectin. Preservatives dissolved in water were
added at the end of cooking.

27
Soluble solids were determined before pouring the hot jams in to 0.5 liter glass jars.
The surface of the jam was covered with melted wax (paraffin) that solidified on cooling
thus sealing the surface. The jams (phase-I) only were refrigerated after opening when room
temperature exceeded 30oC. The jams, which developed mold on surface or were infested
with insects were excluded from testing. The treatments (Jam Types) with different
combinations of sugar and pulp levels are shown in Table- 3.1.
Sugar and Pulp Levels
Sugar Level / Solids Pulp Level
Level-I: Above 68.5% Pulp Level-I: 45% (EEC)
Level-II: Above 65% and below 68% Pulp Level-II: 40% (The Food Standards)
Level-III: Above 60% and below 65% Pulp Level-III: 35% (EEC)
Table-3.1 Treatments for different Sugar and Pulp Levels
Treatments Jam Types Sugar Level Pulp Level
(%) (g) (%) (g)
T1.1 Extra Jam Above 68.5% 315 45% 225
T1.2 Normal Jam ″ 320 40% 200
T1.3 Jam ″ 325 35% 175
T2.1 Extra Jam Above 65% and
below 68%
290 45% 225
T2.2 Normal Jam ″ 295 40% 200
T2.3 Jam ″ 300 35% 175
T3.1 Jam Above 60% and
below 65%
273 45% 225
T3.2 Jam ″ 275 40% 200
T3.3 Jam ″ 280 35% 175

28
Table-3.2 Basic jam recipe for 0.5 Kilogram batches.
S.�o Ingredients Percentage (%) Grams (g) / ml
1. Pectin @ 0.8 % 4g
2. Citric Acid @ 0.3% 1.5g
3. Salt @ 0.2% 1g
4. Potassium sorbate @ 0.05 0.25g
5. Flavor @ 0.2% 1ml
6. Water Balanced -
Original mango pulp contained 20% soluble solids therefore Material Balance (Total
Mass Balance, Solid Balance and Water Balance) was done accordingly with desired
soluble solids levels optimized at 72%, 67% and 63% respectively.

29
Phase-II: Preservatives Treatment
Low solid fruit jam with pulp level-II, sugar level-III (T3.2) was treated with sodium
benzoate and potassium sorbate. The planning was as followed.
Table-3.3 Treatments Planned for Preservatives
Treatments Preservative Dose
Po Control (No Preservative)
PS1 Sodium Benzoate Minimum: @ 0.06%
PS2 Sodium Benzoate Maximum: @ 0.15%
PP1 Potassium Sorbate Minimum: @ 0.05%
PP2 Potassium Sorbate Maximum: @ 0.1%
PSP1 Sodium Benzoate and
Potassium Sorabte
Minimum: @ (0.03% + 0.03% = 0.06%)
PSP2 Sodium Benzoate and
Potassium Sorabte
Maximum: @ (0.08% + 0.07% = 0.15%)
Modification of Recipe
In order to prepare a low sugar and acceptable jam a test series was prepared in
which the amount of added citric acid was reduced as less acid could be added to less sweet
jam. The basic recipe adopted is given in Table-3.4. The preparation procedure was same as
in phase-I. Preservatives at various concentrations were added at the end of cooking.

30
Table-3.4 Basic jam recipe for 0.5 Kilogram batches of phase-II.
S.�o Ingredients or Additives 63 % Soluble Solids
Percentage (%) Weight (g)
1. Mango Pulp @ 40% 200g
2. Sugar @ 63% 275g
3. Citric acid @ 0.15% 0.75g
4. Pectin @ 0.8% 4g
5. Salt @ 0.2% 1g
6. Flavor @ 0.2% 1ml
7. Water Balanced -
Phase-III: Commercial Brands
Commercial mango jams of 9 brands were selected for quality analysis. The brands
selected were National (NFL), Salmans (SCL), Shezan (SIL), Mitchells (MFF),
Ahmed(AFL), Galaxy (GFI), Imperial (IFI), Quice (QFL) and Khyber (FCWF).
3. Packaging and Storage
Fruit jam was packed hot above 85 oC in 0.5 liter glass jars, molten wax was
spread over the surface of jams, which was removed after 15 days. Mango jam filled in
non-hermetic container was stored for a period of 3 months at room temperature
(Minimum: 15oC and Maximum: 35
oC). The product was studied for chemical, microbial
and sensory evaluation on day 15, 30, 45, 60 and 90 of storage period.

31
4. Physico-chemical Analysis
4.1 Ascorbic acid
Ascorbic acid content of the samples was determined by titrimetric method as
reported in AOAC (1975).
Preparation and Standardization of dye solution:
Fifty mg of 2, 6 dichlorophenol indophenol dye and 42 mg of sodium bicarbonate
were weighed, dissolved in distilled water and volume was made up to 250 ml. Fifty mg of
standard ascorbic acid was taken in 50 ml volumetric flask and the volume was made up
with 0.4% oxalic acid. Two ml of this ascorbic acid solution was titrated against dye
solution until light pink color was obtained which persisted for 15 seconds.
Titration of samples:
Ten gram of jam was taken from each sample in 100 ml volumetric flask and
volume was made up by adding 0.4% oxalic acid. Ten ml of this diluted jam was titrated
against standardized dye until light pink color appeared which persisted for 15 seconds.
Three consecutive readings were taken for each sample. The ascorbic acid was calculated by
using the following formula. A blank titration was also carried out.
Ascorbic Acid (mg/100g) = (F x T x 100 x 100) / (S x D)
Where, F = Factor from standardization = ml of Ascorbic acid / ml of Dye
T = ml of Dye used in sample.
S = ml of diluted sample taken for titration.
D = grams of jam taken for dilution.
32
4.2. Total Acidity
Total acidity was determined according to the method of AOAC (1975). Ten gram
of jam was taken in 100 ml volumetric flask and the desired volume was made with distilled
water. Ten ml of that diluted sample was taken in a conical flask and titrated against 0.1 N
NaOH using Phenolphthalein as an indicator. Percent acidity was calculated by the
following formula.
% Acidity = (0.0064 x ml of NaOH used x 100 x 100 ) / (10 x gram of sample)
4.3. Total Sugar
Total sugar was determined by Lane Eynon method as reported in AOAC (1975).
a. Reducing Sugar:
Reagents:
Fehling – A: Dissolve 34.65g of CuSO4 5H2O in 500 ml of distilled water.
Fehling – B: Dissolve 173g sodium potassium tartrate and 50g of NaOH in 500 ml
distilled water.
Indicator: Methylene blue
Procedure:
Two gram of jam was dissolved in 100ml distilled water. The burette was filled with
this solution. Five ml of Fehling A and 5 ml of Fehling B solution along with 10ml of
distilled water were taken in a conical flask. The flask was heated till boiling with out
disturbing the flask. Jam solution was added from the burette drop by drop while boiling till
the color became brick red in the flask. A drop of methylene blue was added as an indicator
in the boiling solution without shaking the flask. If color changed from red to blue for a
moment, reduction was not complete and more jam solution was added till red color
persisted.

33
Calculations:
5 ml of Fehling A + 5 ml of B will reduce, 0.05 gm of reducing sugar.
5 ml of Fehling A + 5 ml of B = X ml of 2 % jam solution = 0.05 gm of reducing sugar.
100 ml of 2% jam solution will contain = (0.05 x 100) / X ml = Y gm of reducing sugar
% of Reducing sugar in Jam = (Y x 100) / 2
b. �on Reducing Sugar (Sucrose)
Two gm of jam sample was dissolved in 100 ml of distilled water. Twenty ml of
this solution was taken in a flask and 10 ml of 1N Hcl was added. Then 10 ml of 1N NaOH
was added and made this solution up to 250ml.
This solution was taken in a burette. Five ml of Fehling A and 5ml of Fehling B
solutions along with 10 ml of distilled water was taken in a conical flask and boiled. When
boiling started, it was titrated against the jam solution from the burette till color changed to
red. It is tested with methylene blue as indicator till red color persisted.
Calculations:
X ml of Jam solution contain = 0.05 gm of Reducing Sugar
250 ml of Jam solution contain = (250 x 0.05) / X ml = Y gm of reducing sugar.
This 250 ml of Jam solution was prepared from 20 ml of original 2% Jam solution.
So 20 ml of 2 % Jam solution contain Y gm of reducing sugar.
100 ml of 2% Jam solution contain = (Y x 100) / 20 = P gm of R.S.
This 100 ml was prepared from 2 gm Jam.
2 gm of Jam solution contain P gm of R.S.
100 gm of Jam solution contain = (P x 100) / 2 = Q gm of total R.S.
Q gm of Reducing Sugar = Inverted sugar + Free Reducing sugar.
Non Reducing sugar = Total Reducing sugar – Free reducing sugar.
4.4. pH
The pH of the sample was determined by pH meter.
34
4.5. Total Soluble Solids
Total soluble solids of the jam were measured with Abbe Refractometer at room
temperature. The temperature correction, error factor and effect of organic acids and salts on
oBrix were taken into account when the total soluble solids were measured.
5. Microbial Evaluation
Low solid fruit jam was analyzed for mold and yeast count by the plate count
method described by Diliello (1982).
Reagents and Equipment:
Apparatus being used were cleaned and sterilized by autoclaving at 121oC for 15 to
20 minutes. Reagents used were Nacl, Peptone, Sabouraud Dextrose Agar (SDA), Potato
Dextrose Agar (PDA) and Tartaric Acid.
Procedure
Preparation of Diluent
Diluent was prepared according to the following ratio Nacl (0.85g) : Peptone (0.1g)
dissolved in 100 ml distilled water. Distributed 90ml of diluent in 250ml conical flask and
9ml in each 25 ml test tube. It was plugged and autoclaved at 121oC for 15 minutes.
Preparation of Medium
Potato Dextrose Agar Medium (PDA) was prepared by boiling 200g of diced potato
in 1 liter distilled water. Ten gm of Agar and 10 gm of Dextrose were mixed in cold water
separately and added to make the solution in 1 liter volumetric flask. Heated in water bath
till dissolved. Autoclaved at 121oC for 15 min. Cooled to approximately 45
oC. Tartaric Acid
solution (10%) 3 to 4 ml per 100 ml of Agar was added after cooling to adjust the pH in the
range of 3.5 to 4.5 thus making media selective for mold and yeast. Poured suitable amount
of agar medium in each sterilized petri plate aseptically. The agar was allowed to solidify.
Sampling
Ten gram of jam sample was weighed and mixed in 90ml diluent to make 1:10

35
dilution and shaked thoroughly. Subsequently made serial dilutions 1:100 by taking (1) ml
from previous dilution and added in 9 ml sterile diluent. Plates were marked and took 1ml of
diluted sample from each dilution and transferred to petri plates and spreaded with spreader.
The plates were incubated at room temperature in inverted position for 48 hours. Colonies
were counted and multiplied by its dilution factor.
Mold Count = No. of colonies x Dilution factor.
6. Sensory Evaluation
The panel consisted of five members of the staff and students of University
laboratories. The judges had previous experience in the sensory evaluation of foods. The
sweetness, sourness, saltiness, texture and overall acceptability of the jams were evaluated
after 15, 30, 45, 60 and 90 days. Phase-II jams were additionally evaluated for after taste
while phase-III for color and odor. A 9 point hedonic scale was used for ranking from 1
for “dislike extremely” to 9 for “like extremely”. The jam samples were served in
randomized order at room temperature. A sample was a spoonful of jam on a white coded
plate. Tap water was provided for oral rinsing. At each session 7-9 jams were evaluated of
each group (Phase-I, II and III).
7. Statistical Analysis
Physico-chemical and sensory evaluation data was analyzed according to the RCBD
Design two way analysis as described by Steel and Torie (1980). The Least Significant
Difference (LSD) test was used to determine differences between jams in relation to the
characteristic evaluated. The mean values of the two replicate jams were used in the analysis
of variance.

36
Chapter-4
RESULTS A�D DISCUSSIO�
Mango jams were prepared at 60% to 64%, 65% to 68% and above 68.5% total
soluble solid (TSS) levels in combination with 45%, 40% and 35% pulp content in Phase-I,
Sodium Benzoate and Potassium Sorbate were added in jams at 60% to 64% TSS in
Phase-II while 9 commercial brands of mango jams were studied in Phase-III. Jams of
Phase-I were studied for the acceptability of different sugar levels while jams of Phase-II
and Phase-III were studied for physico-chemical and sensory attributes after 15, 30, 45, 60
and 90 days of storage. Jams of Phase-II and 2 commercial brands that were below 65%
TSS were also analyzed for mold/yeast count.
Several researchers have tried to prepare jams having different formulations,
ingredients, sweeteners and studied their acceptability and keeping quality. Hyvonen and
Torma (1983) prepared low sugar strawberry jam replacing sucrose with other sweeteners
and tested their keeping quality during 10 month’s storage at room and refrigerator
temperature (5oC) according to color, texture and sensory analysis. Lopez et. al. (1990)
manufactured a new low energy form of jam roll, in which sugar are totally replaced by
sweeteners. Raphaelides et. al. (1996) prepared a series of peach jam samples using
commercial syrups of 38 DE and 44DE, isoglucose, maltose syrup and their mixtures with
sucrose. Barwal and Kalia (1996) made attempts to develop low solids apple preserves for
health conscious and obese subjects through screening of gelling agents, viz., pectin, agar-
agar and guar gums. Bakr (1997) studied preparation of acceptable low energy fiber
enriched and dietetic jams, using different formulae of sucrose substitutes. Viberg et. al.
(1997) manufactured Blackcurrant (Ribes nigrum) jam with the aim of producing a jam with

37
low sugar content, and with out any additives. Barwal (1999) developed low calorie
(dietetic) mixed fruit jam and apple jelly with out compromising sensory qualities, using
non-nutritive sweeteners and food additives at optimum fruit constituents. The physico-
chemical and sensory observations were recorded at different intervals during 90 days
storage at ambient conditions. Riaz et. al. (1999) prepared strawberry jam from fresh fruit
and after stored at -4oC for 60 days. Different formulations were tried emphasizing the effect
of commercial grade pectin and apple pulp pectin on the ultimate quality of strawberry jam.
The products were subjected to chemical and organoleptic testing on day 0, 30, 60 and 90 of
storage. Anjum et. al. (2000) prepared diet jam from dried apricot by incorporating a
suitable combination of sorbitol, cyclamate and aspartame instead of sucrose and glucose
syrup on the equivalent solid basis. The treatments were analyzed of physico-chemical
and sensory evaluation fortnightly for two months.
PHYSICO-CHEMICAL A�ALYSIS
Mango jams included in Phase-II and Phase III with added preservatives and 9
commercial brands respectively were subjected to physico-chemical analysis.
TOTAL SOLUBLE SOLIDS
Total soluble solids of Phase-I and Phase-II jams were successfully controlled
according to the desired ranges. Phase-I jams T1.1, T1.3 had 72%, T1.2 had 77% TSS in
above 68.5% group while T2.1, T2.2 at 65.5 and T2.3 amounted 66% TSS in range of 65%
to 68% soluble solids. Treatments T3.1, T3.2, T3.3 values for TSS were 60.5%, 59% and
64% in the range of 60% to 64% soluble solids level (Table-4.1).
Phase-II jams prepared between 60% to 64% TSS included Po, PSP2 at 61% TSS
while PS2, PP1 were at 60.5% TSS. Treatments PS1, PP2, PSP1 were at 60%, 62.5% and

38
63.5% TSS respecitively.
Commercial jams of Phase-III were significantly different (p<0.05) from each other.
Minimum TSS of 63% was recorded in NFL(National) and QFL(Quice) while MFF
(Mitchells), AFL(Ahmed), SIL(Shezan), GFI(Galaxy) contained maximum 73.5%, 71%,
70% and 69% soluble solids respectively. (Table-4.2 and Appendix-1).
Storage effect on TSS was significant (P<0.05) which increased from mean value of
66.8% to 67.6% in Phase-I while 64.97% to 66.41% in Phase-II and III jams respectively
after 90 days of storage. Several researchers have observed an increase in total soluble solids
of fruit products during storage. Maximum increase 5.27% in TSS was observed in PSP2
while there was no increase in TSS of sample having 77% total soluble solids. This is
obviously due to the loss of moisture. Tremazi (1967) reported that total soluble solids
increased in canned Pakistani peaches on storage. Riaz et. al. (1999) observed an increase in
total soluble solids of strawberry jam during storage. Anjum et. al. (2000) reported that
soluble solids increased gradually during storage in dried apricot diet jam. The mean of TSS
was 68.95% at 0 days which rose to 69.60% after 60 days of storage.
Researchers and different agencies have discussed and classified the jams according
to their soluble solids levels. Desrosier and Desrosier (1978) stated that the optimum solid
range is slightly above 65%. It is possible to have gel formation at 60% solids, by increasing
the pectin and acid levels. Egan et. al. (1981) described standards for Extra jam, jam and
puree for European Economic Community as laid down in council directive of 24 July 1979
(79/693/EEC:OJ NO. L205, 13.8.1979, p.5). Extra jams contain higher quantities of fruit.
Refractometer soluble solids must not be less than 60 percent. Jam shall contain a
percentage of soluble solids of not less than 68.5% unless packed in hermetically sealed
39
containers when it shall contain not less than 65%. A variety of commercial jams are
available in Pakistani market with out proper labeling to describe their quality. Two
commercial jams imported from Europe were checked and compared with the literature
Egan et. al. (1981). Complete synchronization was observed between literature and jams
available in market. This proved the practice of standards regarding Extra jam and jam.
Extra jam was at 65% TSS, with 45% fruit content while jam was at 63% soluble solids
level with 40% fruit content.
Jams with reduced total soluble solids have also been manufactured. Hyvonen and
Torma (1983) prepared acceptable low sugar jams and replaced sucrose by other sweeteners
in strawberry jam. The soluble solids of jams were at 45% and 35% in the final product.
Grigelmo-Miguel and Mortin Belloso (2000) evaluated the quality of peach jam with peach
dietary fiber (DF) as thickener. Peach jams with soluble solids contents of 40,45, 50 and 55
oBrix with total or partial substitution of commercial amidated pectin by peach DF were
studied.
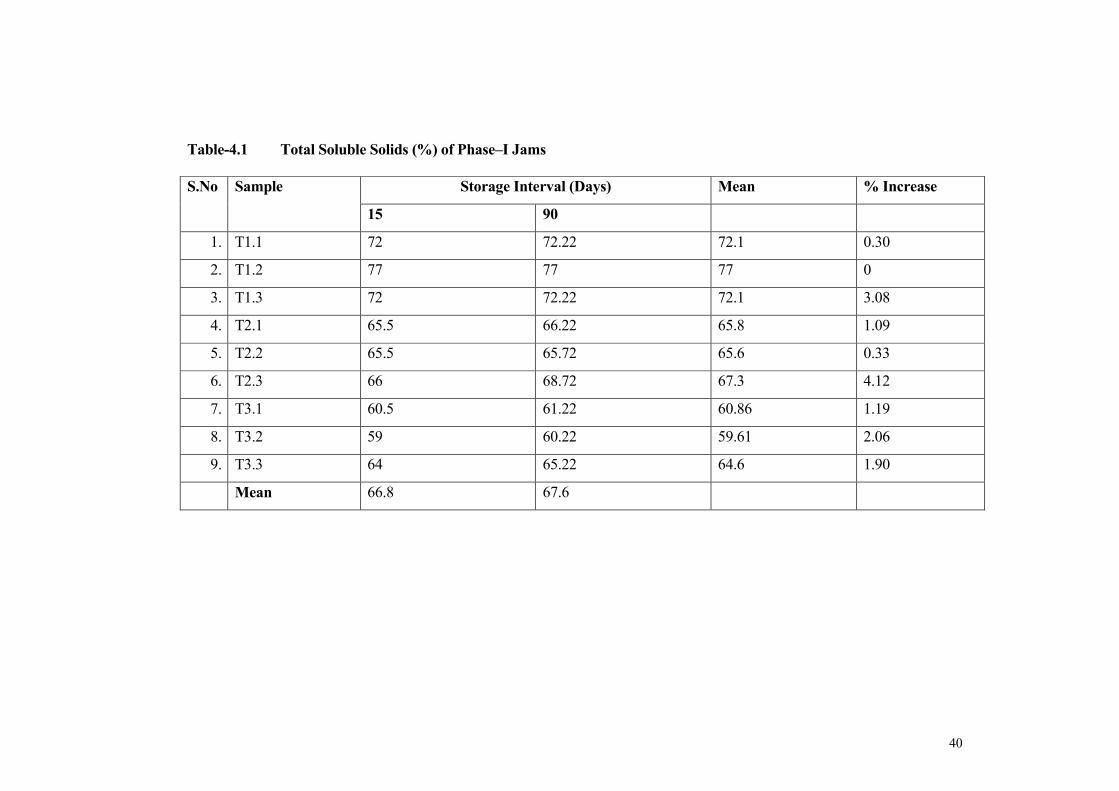
40
Table-4.1 Total Soluble Solids (%) of Phase–I Jams
S.�o Sample Storage Interval (Days) Mean % Increase
15 90
1. T1.1 72 72.22 72.1 0.30
2. T1.2 77 77 77 0
3. T1.3 72 72.22 72.1 3.08
4. T2.1 65.5 66.22 65.8 1.09
5. T2.2 65.5 65.72 65.6 0.33
6. T2.3 66 68.72 67.3 4.12
7. T3.1 60.5 61.22 60.86 1.19
8. T3.2 59 60.22 59.61 2.06
9. T3.3 64 65.22 64.6 1.90
Mean 66.8 67.6
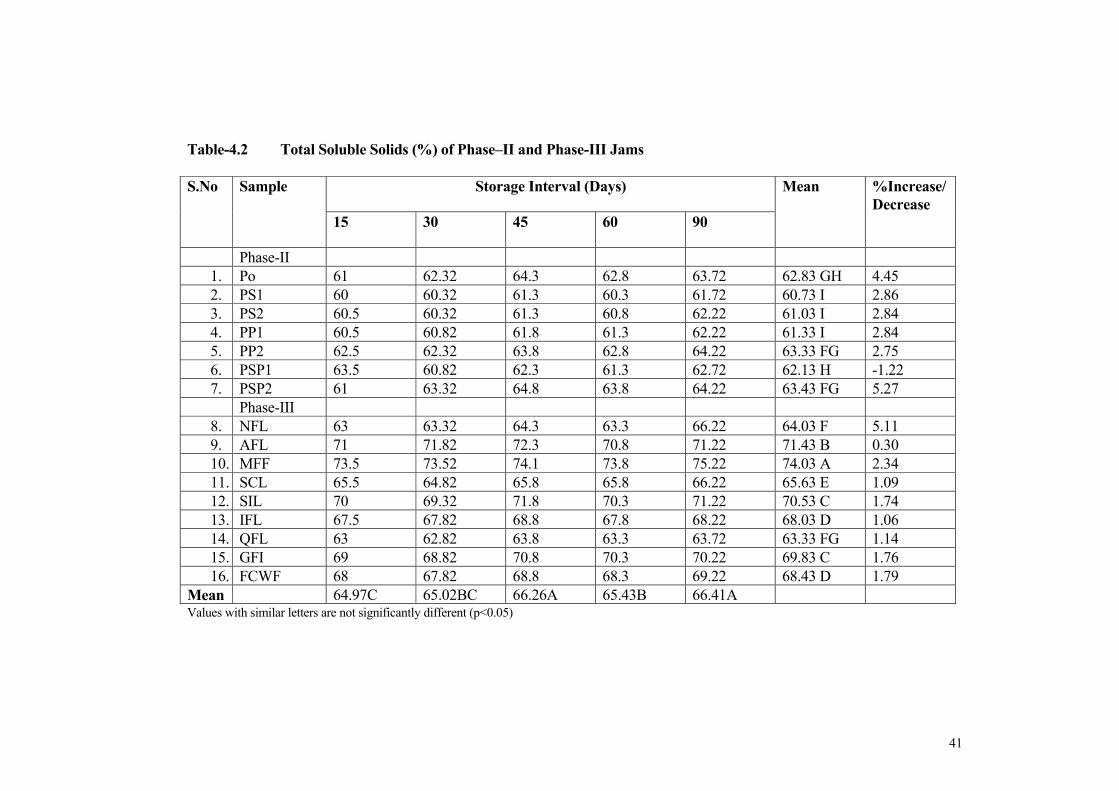
41
Table-4.2 Total Soluble Solids (%) of Phase–II and Phase-III Jams
S.�o Sample Storage Interval (Days) Mean %Increase/
Decrease
15 30 45 60 90
Phase-II
1. Po 61 62.32 64.3 62.8 63.72 62.83 GH 4.45
2. PS1 60 60.32 61.3 60.3 61.72 60.73 I 2.86
3. PS2 60.5 60.32 61.3 60.8 62.22 61.03 I 2.84
4. PP1 60.5 60.82 61.8 61.3 62.22 61.33 I 2.84
5. PP2 62.5 62.32 63.8 62.8 64.22 63.33 FG 2.75
6. PSP1 63.5 60.82 62.3 61.3 62.72 62.13 H -1.22
7. PSP2 61 63.32 64.8 63.8 64.22 63.43 FG 5.27
Phase-III
8. NFL 63 63.32 64.3 63.3 66.22 64.03 F 5.11
9. AFL 71 71.82 72.3 70.8 71.22 71.43 B 0.30
10. MFF 73.5 73.52 74.1 73.8 75.22 74.03 A 2.34
11. SCL 65.5 64.82 65.8 65.8 66.22 65.63 E 1.09
12. SIL 70 69.32 71.8 70.3 71.22 70.53 C 1.74
13. IFL 67.5 67.82 68.8 67.8 68.22 68.03 D 1.06
14. QFL 63 62.82 63.8 63.3 63.72 63.33 FG 1.14
15. GFI 69 68.82 70.8 70.3 70.22 69.83 C 1.76
16. FCWF 68 67.82 68.8 68.3 69.22 68.43 D 1.79
Mean 64.97C 65.02BC 66.26A 65.43B 66.41A Values with similar letters are not significantly different (p<0.05)
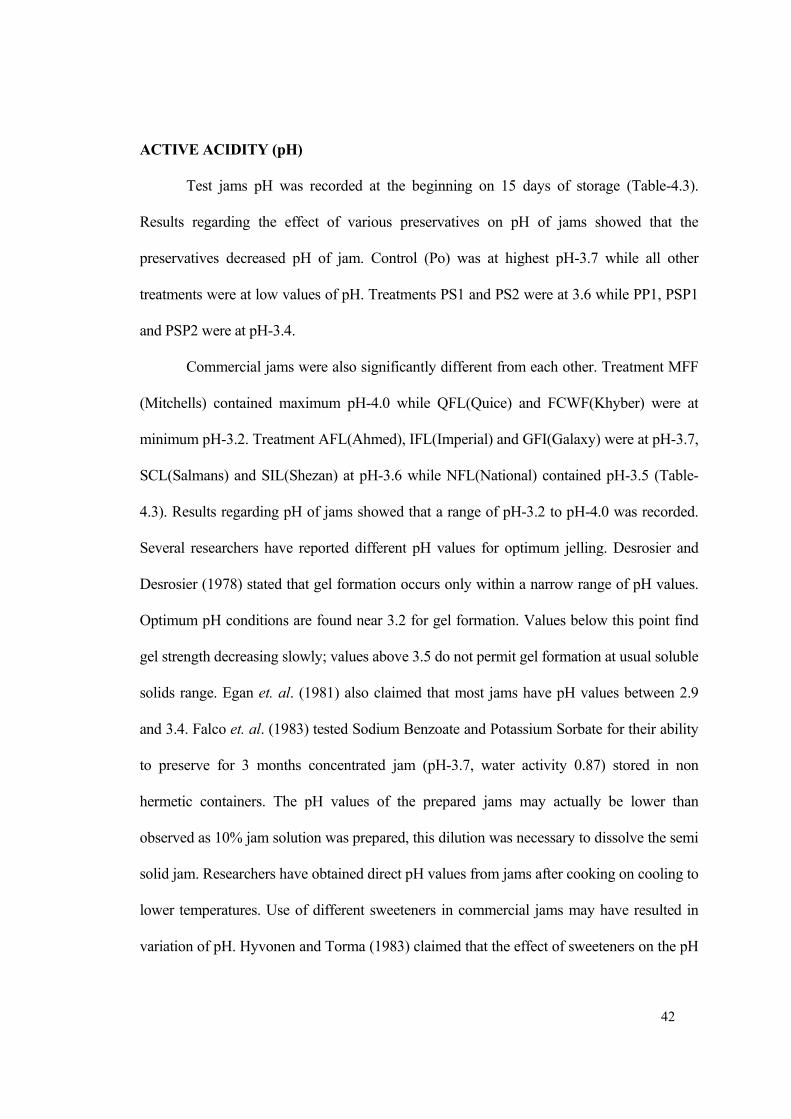
42
ACTIVE ACIDITY (pH)
Test jams pH was recorded at the beginning on 15 days of storage (Table-4.3).
Results regarding the effect of various preservatives on pH of jams showed that the
preservatives decreased pH of jam. Control (Po) was at highest pH-3.7 while all other
treatments were at low values of pH. Treatments PS1 and PS2 were at 3.6 while PP1, PSP1
and PSP2 were at pH-3.4.
Commercial jams were also significantly different from each other. Treatment MFF
(Mitchells) contained maximum pH-4.0 while QFL(Quice) and FCWF(Khyber) were at
minimum pH-3.2. Treatment AFL(Ahmed), IFL(Imperial) and GFI(Galaxy) were at pH-3.7,
SCL(Salmans) and SIL(Shezan) at pH-3.6 while NFL(National) contained pH-3.5 (Table-
4.3). Results regarding pH of jams showed that a range of pH-3.2 to pH-4.0 was recorded.
Several researchers have reported different pH values for optimum jelling. Desrosier and
Desrosier (1978) stated that gel formation occurs only within a narrow range of pH values.
Optimum pH conditions are found near 3.2 for gel formation. Values below this point find
gel strength decreasing slowly; values above 3.5 do not permit gel formation at usual soluble
solids range. Egan et. al. (1981) also claimed that most jams have pH values between 2.9
and 3.4. Falco et. al. (1983) tested Sodium Benzoate and Potassium Sorbate for their ability
to preserve for 3 months concentrated jam (pH-3.7, water activity 0.87) stored in non
hermetic containers. The pH values of the prepared jams may actually be lower than
observed as 10% jam solution was prepared, this dilution was necessary to dissolve the semi
solid jam. Researchers have obtained direct pH values from jams after cooking on cooling to
lower temperatures. Use of different sweeteners in commercial jams may have resulted in
variation of pH. Hyvonen and Torma (1983) claimed that the effect of sweeteners on the pH
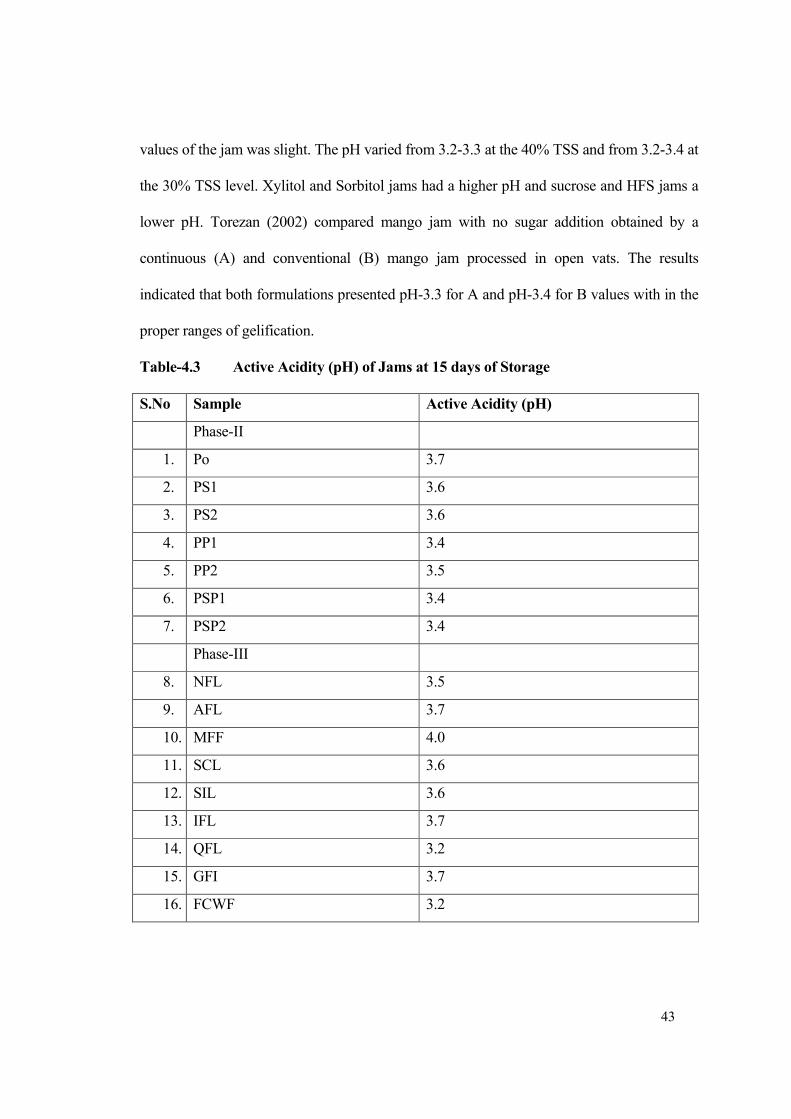
43
values of the jam was slight. The pH varied from 3.2-3.3 at the 40% TSS and from 3.2-3.4 at
the 30% TSS level. Xylitol and Sorbitol jams had a higher pH and sucrose and HFS jams a
lower pH. Torezan (2002) compared mango jam with no sugar addition obtained by a
continuous (A) and conventional (B) mango jam processed in open vats. The results
indicated that both formulations presented pH-3.3 for A and pH-3.4 for B values with in the
proper ranges of gelification.
Table-4.3 Active Acidity (pH) of Jams at 15 days of Storage
S.�o Sample Active Acidity (pH)
Phase-II
1. Po 3.7
2. PS1 3.6
3. PS2 3.6
4. PP1 3.4
5. PP2 3.5
6. PSP1 3.4
7. PSP2 3.4
Phase-III
8. NFL 3.5
9. AFL 3.7
10. MFF 4.0
11. SCL 3.6
12. SIL 3.6
13. IFL 3.7
14. QFL 3.2
15. GFI 3.7
16. FCWF 3.2

44
TITRATABLE ACIDITY
Results regarding the effect of different preservatives showed that jams with added
Potassium Sorbate alone or in combination with Sodium Benzoate resulted in increased
acidity. Treatments PP1, PSP1, PSP2 contained 0.92%, 0.84% and 0.8% acidity
respectively. Jams with added Sodium Benzoate PS1 and PS2 were similar to control (Po)
and contained 0.68% acidity after 15 days of storage. Commercial jams were found
significantly different (p<0.05) from each other (Table-4.4 & Appendix- 2). Treatments
AFL(Ahmed), MFF(Mitchells), IFL(Imperial) were at minimum 0.4% acidity while
GFI(Galaxy), FCWF(Khyber), SIL(Shezan) contained maximum 0.6% acidity.
Several workers have reported a range of acidity with proper gelation properties.
Desrosier and Desrosier (1978) argued that added acid should be adjusted to maintain proper
pH range necessary for gel formation. Egan et. al. (1981) suggested a minimum of 0.65%
acidity in table jelly crystals. Commercial producers of jam use the specification of
0.6%±0.05 of acidity (as citric acid) for mix fruit jams. Hyvonen and Torma reported that
although pH-3.2 could not be achieved in all the jams when the maximum amount of 0.5%
citric acid permitted by Finnish food legislation was added, only this quantity was used at
40% sweeteners level. Torezan (2002) observed the acidity values of 0.9% in jam prepared
by continuous process and 0.6% for jam prepared by conventional method.
Storage effect on acidity was also significant (p<0.05) with increase in storage
period acidity also increased from mean value of 0.62% to 0.75% after 60 days of storage
but it stabilized after 90 days at 0.67%. This trend was observed in general concluding that
the jams needed some time for aging. Commercial jams on the other hand were more stable
and exhibited increasing trend in acidity. Maximum increase in acidity of 48.07% was
45
observed in NFL(National) during 3 months storage. The increase in acidity is obviously
due to breakdown of sugars and increase in total soluble solids. This result is in agreement
with Khan (1987) and Palaniswamy et .al. (1974) who while working on different mango
products showed gradual increase in acidity during storage. Anjum et. al. (2000) observed
increase in percent acidity from 0.65% to 0.70% after 60 days of storage in dried apricot diet
Jam. .

46
Table-4.4 Titratable Acidity (%) of Phase–II and Phase-III Jams
S.�o Sample Storage Interval (Days) Mean %Increase/
Decrease
15 30 45 60 90
Phase-II
1. Po 0.68 0.64 0.57 0.8 0.54 0.65 CDEF -20.5
2. PS1 0.68 0.67 0.86 0.76 0.69 0.73 ABC 1.47
3. PS2 0.68 0.64 0.70 0.73 0.74 0.70 BCD 8.82
4. PP1 0.92 0.73 0.76 0.89 0.74 0.81 A -19.56
5. PP2 0.6 0.64 0.76 0.83 0.69 0.70 BCD 15
6. PSP1 0.84 0.64 0.70 1.0 0.66 0.77 AB -21.42
7. PSP2 0.8 0.60 0.73 0.89 0.83 0.77 AB 3.75
Phase-III
8. NFL 0.52 0.60 0.64 0.76 0.77 0.66 CDE 48.07
9. AFL 0.4 0.32 0.51 0.57 0.51 0.46 H 27.50
10. MFF 0.48 0.44 0.54 0.60 0.63 0.54 GH 31.25
11. SCL 0.52 0.64 0.64 0.76 0.74 0.66 CDE 42.30
12. SIL 0.6 0.62 0.60 0.70 0.63 0.63 DEF 5
13. IFL 0.44 0.48 0.44 0.64 0.57 0.51 GH 29.54
14. QFL 0.56 0.54 0.54 0.70 0.66 0.60 EFG 17.8
15. GFI 0.64 0.48 0.48 0.60 0.63 0.57 FG -1.56
16. FCWF 0.6 0.67 0.70 0.83 0.69 0.70 BCD 15
Mean 0.62 BC 0.58 C 0.64 B 0.75 A 0.67 B Values with similar letters are not significantly different (p<0.05)

47
REDUCI�G SUGARS
Reducing sugars showed increasing trend. Minimum value of 12.5% and maximum
54% were observed during 30 and 90 days of storage respectively (Table-4.5 & Appendix-
3). Maximum percent increase of 115.13% was recorded in SCL (Salmans). Statistical
analysis show significant effect of storage and differences between mean values of
commercial jam samples. Minimum mean value 26.66% of reducing sugars and maximum
35.61% were obtained on 15 and 90 days of storage. This means an increase of 8.95% in 3
months.
Commercial brands show significant difference between each other (p<0.05). Brand
GFI was distinct while AFL, FCWF, IFL and MFF were similar but different from SIL,
NFL, SCL and QFL. Jams prepared in phase-II showed no significant difference (p<0.05)
meaning no effect of preservative on reducing sugars. Generally jams of phase-II possesed
12.5% to 24% while commercial brands 23.8% to 54% reducing sugars, resulting in two
different ranges. This difference may be due to the effect of different processing techniques.
Commercial jams are cooked in vacuum assembly; different combinations of sweeteners are
used to obtain proper texture. The increase in reducing sugars is in agreement with Riaz et.
al. (1999) who observed an increasing trend in reducing sugars in strawberry jam during 3
months storage. Anjum et. al. (2000) while working on apricot diet jam observed increase in
reducing sugars. Desrosier and Desrosier (1978) emphasized that a balance is required
between the sucrose and invert sugar content of the jelly. Low inversion may result in
crystallization, high inversion in granulation of dextrose. The amount of invert sugar present
should be less than the amount of sucrose. It appears that 40:60 ratio is desirable.
Egan et. al. (1981) claimed that manufacturers prefer the reducing sugar content to
fall with in the range of 20-40 (calculated as a percentage of preserve) in order to prevent
separation of crystals during storage. The modern use of glucose syrups in jams and jellies
considerably reduces the tendency to crystallization.

48
Table-4.5 Reducing Sugars (%) of Phase–II and Phase-III Jams
S.�o Sample Storage Interval (Days) Mean %Increase/
Decrease
15 30 45 60 90
Phase-II
1. Po 14.6 15.7 16.6 20 24.7 18.32 E 69.17
2. PS1 13 12.5 17.8 20.8 24.2 17.66 E 86.15
3. PS2 9.75 16.1 15.8 15.3 20.3 15.45 E 108.2
4. PP1 13.55 20.8 17.6 20.8 24.7 19.49 E 82.28
5. PP2 13.5 15.6 17.2 20.4 26.0 18.54 E 92.5
6. PSP1 13.4 13.2 16.7 19.5 23.1 17.18 E 72.3
7. PSP2 15.6 15.6 17.8 19.3 19.53 17.57 E 25.19
Phase-III
1. NFL 32.6 34.2 31.25 40.3 40.3 35.73 D 23.6
2. AFL 45.8 45.45 55.5 50 51 49.55 AB 11.35
3. MFF 23.8 48 44.6 50 50 43.28 BC 110.08
4. SCL 25.1 38.4 36.2 41.6 54 38.26 CD 115.13
8. SIL 28.4 37.8 32.0 38.4 31.25 33.57 D 10.03
9. IFL 48 45.4 23.3 58.1 47.1 44.38 BC -1.87
10. QFL 33 44.6 38.4 43.8 36.2 39.2C D 9.69
11. GFI 51 71.4 46.2 53.1 45.4 53.42 A -10.9
12. FCWF 45.4 50 43.1 47.1 52 47.52 AB 14.5
Mean 26.66 C 32.80 AB 29.38 BC 34.91 A 35.61 A Values with similar letters are not significantly different (p<0.05)

49
�O� REDUCI�G SUGAR
Non reducing sugar decreased in 3 month storage. A maximum value of 49.93% and
minimum of 3.4% was observed at 30 and 90 days of storage. Storage time and treatment
effect was significant on non reducing sugar. Maximum mean value of 34.01% and
minimum 19.17% were obtained on 15 and 90 days of storage. A decrease of 14.84%
occurred during 3 months storage (Table-4.6 & Appendix-4). Maximum decrease of 116.7%
was recorded in IFL (Imperial) after 90 days of storage. Riaz et. al. (1999) also observed
the same results regarding non-reducing sugars in strawberry jams.
The difference between treatments of group of phase-II and commercial jams was
significant as observed in reducing sugars. Non reducing sugars were as low as 5% in
commercial jams with out any visible effect on texture. Sample GFI deteriorated in texture
after 60 days of storage and presented a honey like mass, it possessed a jelly like consistency
at the beginning of study. The phenomenon of low non-reducing sugar is contradictory to
the claims of Desrosier et. al. (1978) and Egan et. al. (1981). This may be due to the
addition of mixtures of sweeteners, still attaining acceptable texture with out using
conventional ratio 60% of sucrose. Several workers have reported that during storage non-
reducing sugars are converted in to reducing sugars. Ali (1965) reported that increase in
reducing sugars in canned orange juice may be due to conversion of non-reducing sugars to
reducing sugars. Karim (1966) worked on canning of citrus juices and concluded that
reducing sugars increased during canning and storage at room temperature.
Results regarding effect of preservatives on non reducing sugar showed that there
was no significant difference of either sodium benzoate or potassium sorbate on non
reducing sugar. Commercial brands of jam were also similar to each other but both phase-II
and commercial brands were different from each other. Low amount of sucrose was
determined in commercial jams.

50
Table-4.6 �on Reducing Sugar (%) of Phase–II and Phase-III Jams
S.�o Sample Storage Interval (Days) Mean % Decrease
15 30 45 60 90
Phase-II
1. Po 41.7 47.4 34.2 37.8 30.41 38.30 AB 27.07
2. PS1 39 31.5 33.8 35.5 24.6 32.88 BC 36.92
3. PS2 45.55 46.4 39 35.9 33.5 40.07 A 26.45
4. PP1 42.55 47.1 30.8 31.2 26.52 35.63 AB 37.67
5. PP2 46.9 43.3 31.2 35.9 30.8 37.62 AB 34.32
6. PSP1 45.5 49.93 33.7 35.8 30.7 39.13 AB 32.52
7. PSP2 38.1 40.2 32.6 36.5 25.67 34.61 ABC 32.62
Phase-III
8. NFL 28.6 16.2 22.75 13.5 16.9 19.59 E 40.90
9. AFL 16.7 18.25 9.6 6.8 6.5 11.57 F 61.07
10. MFF 43.1 21.4 25.3 15.3 17.9 24.60 DE 58.46
11. SCL 40.0 25.6 26.93 14.7 9.7 23.39 DE 75.75
12. SIL 37.3 30.5 30.5 16.7 27.65 28.53 CD 25.87
13. IFL 25.7 19.7 41.1 5.6 7.2 19.86 E 116.7
14. QFL 18.7 7.4 11.2 0.8 7.2 9.06 F 61.4
15. GFI 21.6 8.6 17.5 10.03 3.4 12.23 F 84.2
16. FCWF 13.1 18.6 14.7 7.7 8.0 12.42 F 38.93
Mean 34.01 A 29.51 B 27.83 B 21.23 C 19.17 C Values with similar letters are not significantly different (p<0.05)

51
ASCORBIC ACID
Ascorbic acid was not detected in the prepared jams of phase-II. Only two
commercial jams SCL and SIL contained vitamin ‘C’. This is clear indication of Ascorbic
acid fortification at the end of cooking. Ascorbic acid is sensitive to heat and light, during
open kettle cooking temperature is reached to the point of 105oC to 106
oC resulting in loss
of Vitamin ‘C’.
Sample SIL contained 14.4mg/100g while SCL contained 13.5mg/100g vitamin ‘C’
initially. A gradual decrease was observed after 3 months of storage. Storage mean valued
decreased by 2.65% from 13.95mg/100g to 11.30 mg/100g. Statistical analysis showed no
significant effect of either storage or different brand on vitamin ‘C’ content of these jams
(Table-4.7 & Appendix-5). The results are in agreement with Riaz et. al. (1999) who
observed a gradual decrease in vitamin C content of strawberry jams during 90 days storage.
Torezan (2002) reported that jam ‘A’ presented twice the vitamin C content (14.5 mg/100g)
of ‘B’ (7.6 mg/100g), because of its higher fruit soluble solid content (12% in A and 8.6% in
B) and because of its faster processing, reducing thermal and oxidative degradation.
Table-4.7 Effect of Brand and Storage on Vitamin ‘C’ mg/100g of Jams
S.�o Sample Storage Interval (Days) Mean %Decrease
15 30 45 60 90
1. SCL 13.5 13.2 12.6 12.24 11.4 12.59A 15.5
2. SIL 14.4 11.7 11.4 11.2 11.2 11.98A 22.2
Mean 13.95A 12.45A 12A 11.72A 11.30A
Values with similar letters are not significantly different (p<0.05)

52
MICROBIAL EVALUATIO�
The studies on the colony count of fungi are presented in Table-4.8 and Appendix-6.
Maximum number of colonies 500 cfu/g (colony forming units per gram) were observed on
control sample which were black mold. Colonies did not developed on QFL after 15 days,
PP1, PSP1 and PSP2 on 30 days while PSP2 on 60 days of storage.
Minimum mean count of 15.56 cfu/g and maximum of 146.7 cfu/g was obtained at
30 days and 45 days of storage. Statistically the storage effect was non significant (p<0.05).
According to microbial standards mold count should not exceed 100 cfu/g. This may be due
to laboratory contamination and poor handling techniques. Visible mold was not seen on
any sample including control in 3 months. A replicate of control and PP1 developed black
mold on the inner surface of caps but not on the surface of jams.
Jams imported from UK although not included in testing were analyzed separately.
These jams were at 65% soluble solids, 45% fruit content (Extra Jam) and 63%soluble
solids, 40% fruit content (Jam) respectively. Both brands were vacuum-sealed, after opening
visible mold developed after 60 days of storage at room temperature.
Treatments effect on mold count was statistically significant (p<0.05). Control (Po)
deteriorated after 3 months of storage and was significantly inferior from the other
treatments. Treatment PSP2 proved most effective against control of fungi. All other
treatments resembled each other thus meaning that different preservatives and their doses
were similarly effective against mold during 90 days of storage. A minimum dose of 0.05%
of sodium benzoate , potassium sorbate or combined is enough to preserve for 3 months, a
jam prepared from sulphited pulp with considerable acid at 63% soluble solids level filled in
non-hermetic container.

53
Synergistic effect was also observed in jams with added Potassium sorbate.
Treatments PP2, PSP2, NFL and QFL were better than PS1, PS2, PP1 and PSP1.
The fungus developed were identified as belonging to Fusarium, Alternaria and
Penicillium genus. Felco et. al. (1993) also reported similar results, concluding that although
sodium benzoate and potassium sorbate reduced microbial count in samples of the jam,
potassium sorbate was more effective than sodium benzoate. Periodic counts of mesophiles,
molds and yeasts in jam treated with 500 ppm potassium sorbate confirmed its effectiveness.
Hyvonen and Torma. (1983) prepared low sugar strawberry jams at 35% soluble
solids and 45% soluble solids replacing sucrose with different sweeteners. Sodium benzoate
(20% w/v solution) 3.5ml and Potassium sorbate (20% w/v solution) 2.5ml was successfully
used to protect jams against molds and yeasts. Awan and Rehman (1999) recommended use
of 0.1% sodium benzoate in apricot and apple jam, with 65-68% soluble solids stored in non
hermetic container. Implovo et. al. (2000) determined benzoic acid and sorbic acid in
industrial quince jam available on Portuguese market. Eleven commercial brands were
analyzed. All contained benzoic acid. The concentration ranged from 413 ± 10.4 to 1501 ±
4.2 mg of benzoic acid /Kg of quince jam. Only two brands also contained sorbic acid. The
concentrations were 515.0 ± 7.0 and 908.3 ± 5.3 mg of sorbic acid /Kg of quince jam.

54
Table-4.8 Mold / Yeast Count of Jams (cfu/g)
S.�o Sample Storage Interval (Days) Mean %Increase/
Decrease
15 30 45 60 90
Phase-II
1. Po 50 50 500 500 500 320 A 900
2. PS1 30 30 200 200 300 152 B 900
3. PS2 10 10 200 40 60 64B C 500
4. PP1 30 0 200 70 110 82B C 266
5. PP2 10 30 70 10 20 28 C 100
6. PSP1 120 0 100 30 50 60 BC -58
7. PSP2 10 0 20 0 10 8 C 0
Phase-III
8. NFL 20 20 10 30 40 24 C 100
9. QFL 0 0 20 10 20 10 C 2000
Mean 31.11 B 15.56 B 146.7 A 98.89 AB 123.3 A Values with similar letters are not significantly different (p<0.05)
55
SE�SORY EVALUATIO�
SWEET�ESS
PHASE-I
Results regarding effect of sugar concentration on sweetness score showed that
different sugar levels had significant effect (p<0.05) on sweetness. Jams having 63% soluble
solids level were rated highest score, followed by 67% TSS and the lowest were 72% TSS.
This shows a strong preference for jams at 60-65% soluble solids level (Table-4.9 &
Appendix-7). Maximum mean score of 7.0 and minimum of 6.28 was recorded in this
group. Storage time also significantly effected sweetness, which decreased during 3 months
from 7.11 to 6.24.
PHASE-II
Addition of various preservatives did not effect sweetness significantly (p<0.05) but
storage had negatively affected sweetness from mean score of 7.25 to 6.11 in 90 days
storage (Table-4.10 & Appendix-8).
PHASE-III
Commercial jams were significantly different from each other regarding sweetness.
Maximum mean score was observed in SCL, NFL and SIL, which were superior to all other
jams. Maximum mean score of 7.11 and minimum of 5.5 was observed (Table-4.11 &
Appendix-9). Effect of storage was as observed earlier, which negatively effected
sweetness from 7.16 to 5.4.

56
Table-4.9 Sweetness of Phase-I Jams
S.�o Sample Storage Interval (Days) Mean
15 30 45 60 90
Phase-I
1. T1.1 7 6.8 7.0 6.4 6.2 6.68 AB
2. T1.2 6.6 7.0 7.3 6.4 6.0 6.66 B
3. T1.3 6.5 7.2 6.1 6.0 5.6 6.28 C
4. T2.1 7.2 7.4 7.1 6.0 6.0 6.74 AB
5. T2.2 7.0 7.2 7.1 6.6 6.4 6.86 AB
6. T2.3 7.0 7.2 7.0 7.0 6.4 6.92 AB
7. T3.1 7.3 7.2 7.1 7.0 6.4 7.00 A
8. T3.2 6.8 7.0 6.6 6.8 6.6 6.76 AB
9. T3.3 6.8 7.0 7.0 6.6 6.6 6.80 AB
Mean 6.911 A 7.111 A 6.922 A 6.533 B 6.244 C Values with similar letters are not significantly different (p<0.05) / Each figure is mean of observations of five judges
Table-4.10 Sweetness of Phase-II Jams
S.�o Sample Storage Interval (Days) Mean
15 30 45 60 90
Phase-II
1. Po 7 7 6.3 7 6.8 6.82
2. PS1 6.9 7.2 6.3 6.6 6.2 6.64
3. PS2 6 7.6 6.5 6 6.4 6.5
4. PP1 7.1 7.2 7 5.8 6.6 6.74
5. PP2 6.7 7.4 7 7 4.8 6.58
6. PSP1 6.9 7.2 6.5 5.8 5.8 6.44
7. PSP2 6.5 7.2 6.6 6.4 6.2 6.58
Mean 6.729B 7.257A 6.600BC 6.370BC 6.114C Values with similar letters are not significantly different (p<0.05) / Each figure is mean of observations of five judges
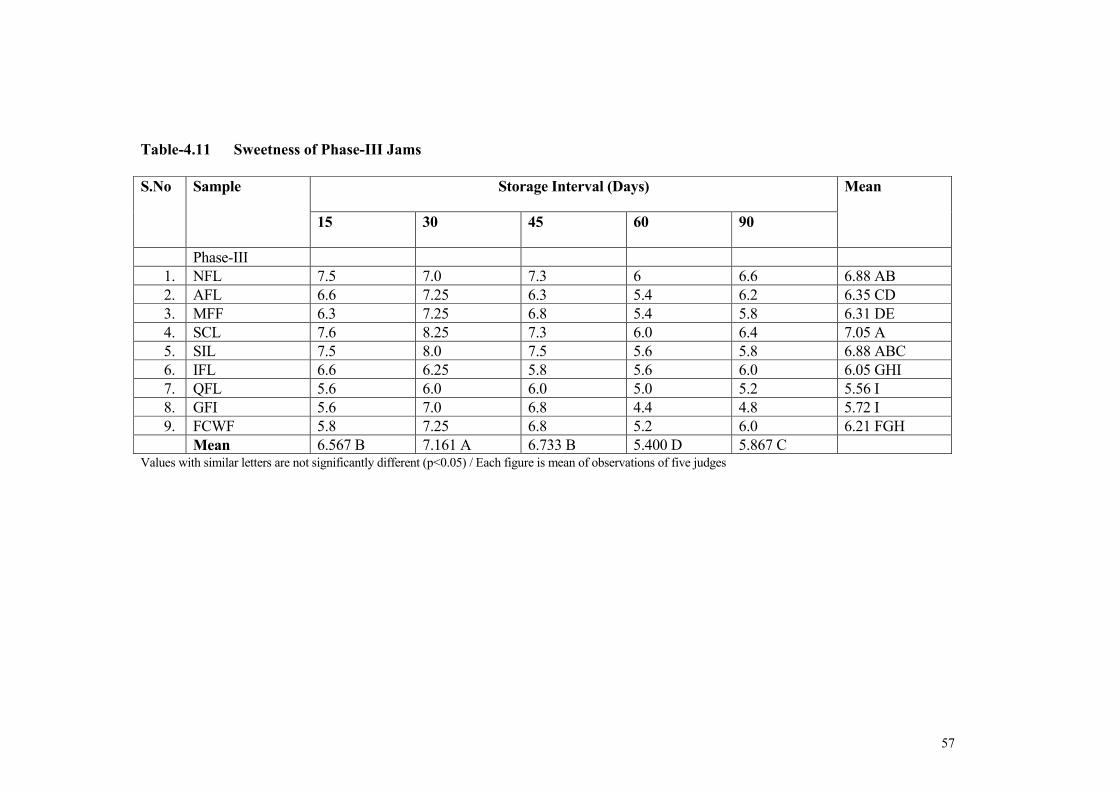
57
Table-4.11 Sweetness of Phase-III Jams
S.�o Sample Storage Interval (Days) Mean
15 30 45 60 90
Phase-III
1. NFL 7.5 7.0 7.3 6 6.6 6.88 AB
2. AFL 6.6 7.25 6.3 5.4 6.2 6.35 CD
3. MFF 6.3 7.25 6.8 5.4 5.8 6.31 DE
4. SCL 7.6 8.25 7.3 6.0 6.4 7.05 A
5. SIL 7.5 8.0 7.5 5.6 5.8 6.88 ABC
6. IFL 6.6 6.25 5.8 5.6 6.0 6.05 GHI
7. QFL 5.6 6.0 6.0 5.0 5.2 5.56 I
8. GFI 5.6 7.0 6.8 4.4 4.8 5.72 I
9. FCWF 5.8 7.25 6.8 5.2 6.0 6.21 FGH
Mean 6.567 B 7.161 A 6.733 B 5.400 D 5.867 C Values with similar letters are not significantly different (p<0.05) / Each figure is mean of observations of five judges

58
SOUR�ESS
PHASE-I
Effect of sugar concentrations on sourness score was not significant (p<0.05).
Maximum mean score of 6.56 while minimum of 6.12 was observed (Table-4.12 &
Appendix-10). Increase in storage period significantly decreased sourness score from 7.4 to
5. Maximum mean value of 7.06 decreased to 5.44.
PHASE-II
There was no significant effect of preservatives on sourness of jams in this group but
storage time negatively affected where a decrease of 5.85 from 6.82 was observed (Table-
4.13 & Appendix-11).
PHASE-III
Commercial brands were statistically different from each other. Maximum score of
7.25 and minimum of 4.4 was observed in SCL and GFI. Jams SCL, SIL and NFL were
superior to others and remained superior for every attribute. Maximum mean score of 6.43
and minimum 5.12 was seen in SCL and IFL respectively (Table-4.14 & Appendix-12).
Storage time deteriorated the product and decrease of mean value from 6.47 to 4.91 was
seen.
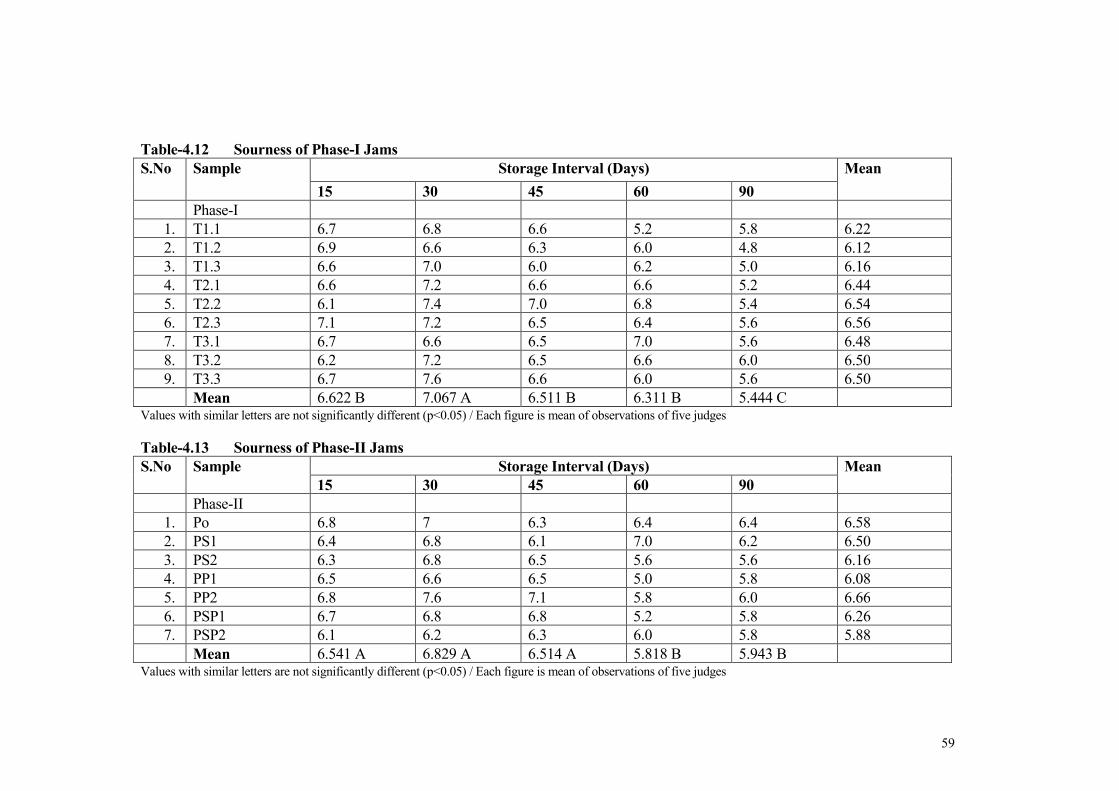
59
Table-4.12 Sourness of Phase-I Jams
S.�o Sample Storage Interval (Days) Mean
15 30 45 60 90
Phase-I
1. T1.1 6.7 6.8 6.6 5.2 5.8 6.22
2. T1.2 6.9 6.6 6.3 6.0 4.8 6.12
3. T1.3 6.6 7.0 6.0 6.2 5.0 6.16
4. T2.1 6.6 7.2 6.6 6.6 5.2 6.44
5. T2.2 6.1 7.4 7.0 6.8 5.4 6.54
6. T2.3 7.1 7.2 6.5 6.4 5.6 6.56
7. T3.1 6.7 6.6 6.5 7.0 5.6 6.48
8. T3.2 6.2 7.2 6.5 6.6 6.0 6.50
9. T3.3 6.7 7.6 6.6 6.0 5.6 6.50
Mean 6.622 B 7.067 A 6.511 B 6.311 B 5.444 C Values with similar letters are not significantly different (p<0.05) / Each figure is mean of observations of five judges
Table-4.13 Sourness of Phase-II Jams
S.�o Sample Storage Interval (Days) Mean
15 30 45 60 90
Phase-II
1. Po 6.8 7 6.3 6.4 6.4 6.58
2. PS1 6.4 6.8 6.1 7.0 6.2 6.50
3. PS2 6.3 6.8 6.5 5.6 5.6 6.16
4. PP1 6.5 6.6 6.5 5.0 5.8 6.08
5. PP2 6.8 7.6 7.1 5.8 6.0 6.66
6. PSP1 6.7 6.8 6.8 5.2 5.8 6.26
7. PSP2 6.1 6.2 6.3 6.0 5.8 5.88
Mean 6.541 A 6.829 A 6.514 A 5.818 B 5.943 B Values with similar letters are not significantly different (p<0.05) / Each figure is mean of observations of five judges

60
Table-4.14 Sourness of Phase-III Jams
S.�o Sample Storage Interval (Days) Mean
15 30 45 60 90
Phase-III
1. NFL 6.5 6.5 5.8 5.4 6.0 6.04 AB
2. AFL 6.16 6.25 5.3 5.0 5.0 5.54 CDE
3. MFF 5.8 6.25 6.3 5.0 4.8 5.63 BCD
4. SCL 6.8 7.25 7.3 5.2 5.6 6.43 A
5. SIL 6.6 7.25 6.8 5.0 4.8 6.09 AB
6. IFL 5.16 5.25 5.6 4.6 5.0 5.12 E
7. QFL 5.6 6.0 5.6 4.6 4.4 5.24 DE
8. GFI 5.5 6.5 6.1 4.8 4.4 5.46 CDE
9. FCWF 6.16 7.0 6.1 4.6 5.0 5.77 BC
Mean 6.031 B 6.472 A 6.100 B 4.911 C 5.00 C Values with similar letters are not significantly different (p<0.05) / Each figure is mean of observations of five judges

61
TEXTURE
PHASE-I
Results pertaining to different fruit content (pulp ratio) showed that there was
significant effect (p<0.05) on texture. Pulp ratio of 40%, 45% along with 60-67% soluble
solids were superior to higher 72% soluble solids level. Maximum mean score of 6.54 and
minimum of 5.687 was seen in this phase (Table-4.15 & Appendix-13). Storage period
decreased mean value of texture from 6.73 to 5.70.
PHASE-II
Texture was not affected by the addition of preservatives while storage as previously
decreased the mean score from 7.02 to 6.10 (Table-4.16 & Appendix-14).
PHASE-III
Results regarding texture of different commercial brands are given in Table-4.17.
The texture was significantly different in commercial brands. Jam SIL got maximum mean
score of 7.01 while GFI received minimum score of 4.71. Brands SCL, SIL, FCWF, MFF
and AFL were similar and scored better than other brands (Table-4.17 & Appendix-15).
Increased storage time deteriorated the texture of jams. Maximum mean score of 6.861 and
minimum of 5.22 was observed during 90 days of storage.
Texture of the jam is affected by different factors and is important in sensorial
quality. Phase-I jams were checked for 45%, 40% and 35% pulp content effecting ultimate
sensory quality of the jams. Commercial jams may be different due to combination of
sweeteners used which is reported by many researchers. Raphaelides et. al. (1996) prepared
series of peach jam samples using commercial glucose syrups of 38DE and 44DE,
isoglucose, maltose syrup and their mixtures with sucrose. Jams texture was markedly

62
effected by composition of the syrups. Consistency of 100% isoglucose syrup was very firm
while very soft when 100% maltose syrup was used and three weeks aging was needed for
stabilization. Vilaran et .al. (1997) studied the rheological behavior of apricot jam made
with sucrose, and bilberry and rosehips prepared with fructose in a temperature range of 5-
65oC. Riaz et. al. (1999) analyzed the strawberry jam prepared from fresh fruit and after had
been stored at -4oC for 60 days. Different formulations with particular emphasis on the
effect of commercial grade pectin and apple pulp pectin on ultimate quality of jam.
Formulations with apple pulp pectin were better than those having commercial grade pectin.
Suutarinen et. al. (2000) studied the structural changes in strawberry tissues during pre-
freezing treatments, freezing, thawing and jam making. According to sensory evaluation of
the jams, different pre-freezing treatments were shown to have a significant influence.

63
Table-4.15 Texture of Phase-I Jams
S.�o Sample Storage Interval (Days) Mean
15 30 45 60 90
Phase-I
1. T1.1 6.8 6.4 6.16 6.4 5.8 6.31 AB
2. T1.2 6.6 6.4 5.1 6.4 5.4 5.98 BC
3. T1.3 6.6 6.6 5.8 5.2 5.8 6.0 BC
4. T2.1 7.0 7.2 5.6 6.8 6.0 6.52 A
5. T2.2 6.7 6.8 6.0 6.0 6.0 6.30 AB
6. T2.3 6.4 5.6 5.0 5.6 5.8 5.68 C
7. T3.1 6.8 6.0 5.8 6.4 5.6 6.12 ABC
8. T3.2 6.9 7.0 5.8 6.4 6.6 6.54 A
9. T3.3 6.8 7.2 6.1 5.6 6.2 6.38 AB
Mean 6.733 A 6.578 A 5.707 C 6.089 B 5.911 BC Values with similar letters are not significantly different (p<0.05) / Each figure is mean of observations of five judges
Table-4.16 Texture of Phase-II Jams
S.�o Sample Storage Interval (Days) Mean
15 30 45 60 90
Phase-II
1. Po 7.3 7.8 6.0 6.4 6.4 6.78
2. PS1 6.5 7.2 6.3 6.0 5.8 6.36
3. PS2 6.6 7.0 5.8 6.2 6.6 6.44
4. PP1 7.2 6.2 6.5 5.8 6.8 6.50
5. PP2 6.8 7.8 6.0 7.2 6.2 6.80
6. PSP1 6.5 6.6 5.6 5.8 6.2 6.14
7. PSP2 6.7 6.6 6.5 6.8 6.8 6.68
Mean 6.800 AB 7.029 A 6.100 C 6.314 C 6.400 BC Values with similar letters are not significantly different (p<0.05) / Each figure is mean of observations of five judges

64
Table-4.17 Texture of Phase-III Jams
S.�o Sample Storage Interval (Days) Mean
15 30 45 60 90
Phase-III
1. NFL 5.8 7.0 6.1 6.4 6.8 6.42 BC
2. AFL 7.3 7.25 6.0 5.2 6.6 6.47 AB
3. MFF 7.0 7.25 6.5 5.2 6.6 6.51 AB
4. SCL 7.8 7.75 6.6 6.2 6.4 6.95 AB
5. SIL 7.5 7.75 7.0 6.0 6.8 7.01 A
6. IFL 6.5 6.25 6.0 4.4 6.2 5.87 CD
7. QFL 6.0 6.0 5.3 4.8 5.4 5.50 D
8. GFI 5.0 4.75 5.0 3.4 5.4 4.71 E
9. FCWF 6.6 7.75 7.1 5.4 6.4 6.65 AB
Mean 6.611 AB 6.861 A 6.178 C 5.222 D 6.289 BC Values with similar letters are not significantly different (p<0.05) / Each figure is mean of observations of five judges

65
OVERALL ACCEPTABILITY
PHASE-I
Statistical data showed that the effect of various sugar concentrations on overall
acceptability was not significant. The preference score showed that low sugar (63% TSS)
were given more preference than high sugar level jams (Table-4.18 & Appendix-16).
Increased storage time effect was significant which showed a decreased preference with
increased storage. Maximum mean value of 6.91 and minimum of 5.97 was observed on 30
and 90 days of storage.
PHASE-II
Results about the effect of different preservatives were not significant (p.>0.05) thus
concluding that preservatives were causing no negative impact on acceptability of jams
(Tablw-3.19 & Appendix-17). Storage effect on the other side was slightly significant. The
acceptability decreased and then stabilized at the end. A maximum mean value of 6.85 and
minimum of 6.14 was recorded during 90 days of storage.
PHASE-III
The commercial brands were significantly different from one another regarding
overall acceptability. Sample SCL and NFL scored highest 7.25 and 6.88 respectively. They
were followed by SIL and FCWF. The minimum mean score was observed in GFI, IFL and
QFL (Table-4.20 & Appendix-18). Increase in storage had no effect till 45 days of storage
but the acceptability declined on 60 and 90 days. A maximum mean score of 6.37 and
minimum 5.28 was observed in 3 months.
Overall acceptability was taken as preference the comparison between all the jams of
phase-I, II and III is shown in Table-4.21 & Appendix-19. It clearly showed that jams with

66
low sugar level (60-65% TSS) were significantly more acceptable than high sugar level
(70% TSS) jams. Commercial sample SCL scored highest which was noticed as
exceptionally preferred over all other samples, it was closely followed by control (Po) of
phase-II, NFL and SIL. Maximum score of 7.25 while minimum 4.80 was obtained in this
comparison.
Several researchers made attempts to prepare medium sugar, low sugar (dietetic)
jams in combination with artificial sweeteners and texture stabilizers. These products were
subjected to sensory evaluation. Hyvonen and Torma (1983) prepared an acceptable
strawberry jam at 45% and 35% total soluble solids in combination with artificial
sweeteners. LM-Pectin was used for proper texture. All the jams were acceptable by taste
and were rated average or better at the beginning of keeping quality study but the preference
decreased during 10 months storage. Lopez et. al. (1990) manufactured a new low energy
form of jam roll replacing sugar and decreasing its amount from 43.4g/100g in the original
product to 35.5g/100g. The product was acceptable by a taste panel of obese subjects.
Barwal and Kalia (1996) made attempts to develop low solid apple preserve. It was found
that guar gum and agar-agar at 1% level gave acceptable sensory characteristics. Bakr
(1997) prepared acceptable low energy fiber enriched and diabetic jams. Viberg (1997)
manufactured Blackcurrant (Ribes nigrum) jam with the aim of producing a jam with low
sugar content and with out additives. Barwal (1999) developed low calorie (dietetic) mixed
fruit jam, apple jelly with out compromising sensory qualities using non-nutritive
sweeteners and food additives. The difference between 50% saccharin sweetened and 50
and 75% cyclamate sweetened was not significantly different. Grigelmo Miguel and Mortin
Belloso (2000) developed and studied peach jams with soluble solids contents of 40, 45, 50

67
and 55 oBrix with partial and total substitution of commercial amidated pectin by peach
dietary fiber (DF). From sensorial point of view, high peach DF jams were as acceptable as
conventional jams. Rosenfeld and Nes (2000) performed sensory analysis on different types
of jam prepared from fresh fruits, frozen non-cooked jam and traditionally cooked jam.
Cooked jam scored for sweet taste, stickiness, bitter taste, earthy flavor, off-flavor and total
intensity o taste, while fresh fruits scored highest for color, strength, hue and sour taste.
ODOR
Commercial brands of phase-III were evaluated for odor. Storage and treatment
effect was significant (p<0.05) for odor. Maximum score of 8.25 and minimum of 3.2 were
observed during 30 and 90 days of storage (Table-4.22 & Appendix-20).
Odor of commercial brand deteriorated during 3 months storage from like slightly to
dislike slightly. Maximum mean score of 6.36 and minimum of 4.6 were obtained during 30
and 90 days of storage.
Commercial brands of SCL scored maximum followed by NFL and SIL during 15
to 60 days of storage. AFL, FCWF, MFF and QFL were rated as average. IFL and GFI were
rated inferior to all other brands.
COLOR
Storage and treatments effect was statistically significant regarding color. Almost
similar trend was observed as in odor. Maximum score of 7.8 and minimum of 4 were
obtained during 15 and 30 days of storage. Color gradually became inferior during 3 months
storage. Maximum mean score of 6.56 and minimum of 5.57 was recorded with decrease of
0.99% (Table-4.23 & Appendix-21).
Commercial brands were significantly different from each other (p<0.05). Two

68
groups were obvious SCL scored maximum followed by NFL and SIL, which resembled
each other and were superior to all other brands. They were liked moderately. All other
brands were liked slightly and resembled each other; no significant difference was noticed
among them.
Several researchers have studied the stability factors affecting color of jam during
processing and storage. It is common practice to fortify the jams with permitted food colors.
Garcia Vigura et. al. (1998) analyzed anthocyanin and color stability of red raspberry jam
during 6 months stored at three temperatures (20, 30 and 37oC). Also the influence of
freezing the fruit, previously to jam manufacture, was evaluated. The development of
browning was directly related to storage temperature but not to thawing or the variety of
fruit used. Zafrilla et. al. (1998) compared a commonly used colorant (elderberry extract)
with a newly proposed alternative, pomegranate juice for the stabilization of strawberry jam.
AFTER TASTE
After taste was not affected by preservative treatments, and no significant difference
(p<0.05) was observed between Phase-II jams with added sodium benzoate or potassium
sorbate. This concluded that both preservatives added @ 0.15% do not impart any
unacceptable taste to the jams (Table-4.24 & Appendix-22).
Storage effect was slightly significant (p<0.05) while non significant at (p<0.01).
Thus 3 months storage also did not produced any objectionable taste in jams.

69
Table-4.18 Overall acceptability of Phase-I Jams
S.�o Sample Storage Interval (Days) Mean
15 30 45 60 90
Phase-I
1. T1.1 6.6 6.4 6.6 6.0 6.2 6.36
2. T1.2 6.5 6.8 6.3 6.6 5.4 6.32
3. T1.3 6.5 6.4 6.0 5.8 5.4 6.03
4. T2.1 6.7 7.6 6.1 6.0 6.0 6.48
5. T2.2 6.6 7.4 6.6 6.4 5.2 6.44
6. T2.3 6.7 6.2 6.1 6.2 6.4 6.32
7. T3.1 6.9 6.6 6.3 6.8 6.0 6.52
8. T3.2 6.8 7.4 6.0 6.2 6.6 6.60
9. T3.3 7.0 7.4 6.1 6.0 6.6 6.62
Mean 6.700 A 6.911 A 6.233 B 6.222 B 5.978 B Values with similar letters are not significantly different (p<0.05) / Each figure is mean of observations of five judges
Table-4.19 Overall acceptability of Phase-II Jams
S.�o Sample Storage Interval (Days) Mean
15 30 45 60 90
Phase-II
1. Po 6.9 7.6 6.0 7.0 7 6.90
2. PS1 6.2 6.8 6.1 6.8 6.2 6.42
3. PS2 6.6 7.2 6.3 5.6 6.8 6.50
4. PP1 6.7 6.2 7.0 5.6 6.6 6.42
5. PP2 6.6 7.0 5.8 6.2 6.2 6.36
6. PSP1 6.6 6.4 6.5 5.6 6.0 6.22
7. PSP2 6.4 6.8 6.6 6.2 6.4 6.48
Mean 6.571 AB 6.857 A 6.329 B 6.143 B 6.457 AB Values with similar letters are not significantly different (p<0.05) / Each figure is mean of observations of five judges

70
Table-4.20 Overall acceptability of Phase-III Jams
S.�o Sample Storage Interval (Days) Mean
15 30 45 60 90
Phase-III
1. NFL 7.0 7.0 6.6 6.6 7.2 6.88 AB
2. AFL 6.5 6.25 5.6 5.4 5.4 5.83 D
3. MFF 5.8 6.25 6.3 5.0 5.6 5.79 D
4. SCL 7.5 8.25 7.3 6.4 6.8 7.25 A
5. SIL 7.0 7.5 7.1 5.6 5.8 6.60 BC
6. IFL 6.3 5.5 4.5 4.4 4.8 5.10 E
7. QFL 5.8 5.5 5.1 5.0 4.4 5.16 E
8. GFI 5.5 4.0 5.5 4.4 4.6 4.80 E
9. FCWF 6.0 6.75 6.8 4.8 5.6 5.99 CD
Mean 6.378 A 6.333 A 6.089 A 5.289 B 5.578 B
Values with similar letters are not significantly different (p<0.05) / Each figure is mean of observations of five judges

71
Table-4.21 Overall acceptability of Phase-II, I and III Jams
S.�o Sample Storage Interval (Days) Mean
15 30 45 60 90
Phase-II
1. Po 6.9 7.6 6.0 7.0 7 6.90AB
2. PS1 6.2 6.8 6.1 6.8 6.2 6.42BCDE
3. PS2 6.6 7.2 6.3 5.6 6.8 6.50BCDE
4. PP1 6.7 6.2 7.0 5.6 6.6 6.42BCDE
5. PP2 6.6 7.0 5.8 6.2 6.2 6.36BCDE
6. PSP1 6.6 6.4 6.5 5.6 6.0 6.22DEFG
7. PSP2 6.4 6.8 6.6 6.2 6.4 6.48BCDE
Phase-I
8. T1.1 6.6 6.4 6.6 6.0 6.2 6.36BCDEF
9. T1.2 6.5 6.8 6.3 6.6 5.4 6.32CDEFG
10. T1.3 6.5 6.4 6.0 5.8 5.4 6.03EFG
11. T2.1 6.7 7.6 6.1 6.0 6.0 6.48BCDE
12. T2.2 6.6 7.4 6.6 6.4 5.2 6.44BCDE
13. T2.3 6.7 6.2 6.1 6.2 6.4 6.32CDEFG
14. T3.1 6.9 6.6 6.3 6.8 6.0 6.52BCDE
15. T3.2 6.8 7.4 6.0 6.2 6.6 6.60BCD
16. T3.3 7.0 7.4 6.1 6.0 6.6 6.62BCD
Phase-III
17. NFL 7.0 7.0 6.6 6.6 7.2 6.88ABC
18. AFL 6.5 6.25 5.6 5.4 5.4 5.83FG
19. MFF 5.8 6.25 6.3 5.0 5.6 5.79G
20. SCL 7.5 8.25 7.3 6.4 6.8 7.25A
21. SIL 7.0 7.5 7.1 5.6 5.8 6.60BCD
22. IFL 6.3 5.5 4.5 4.4 4.8 5.10H
23. QFL 5.8 5.5 5.1 5.0 4.4 5.16H
24. GFI 5.5 4.0 5.5 4.4 4.6 4.80H
25. FCWF 6.0 6.75 6.8 4.8 5.6 5.99EFG
Mean 6.55 A 6.69 A 5.98 B 5.86 C 5.97 BC
Values with similar letters are not significantly different (p<0.05) / Each figure is mean of observations of five judges
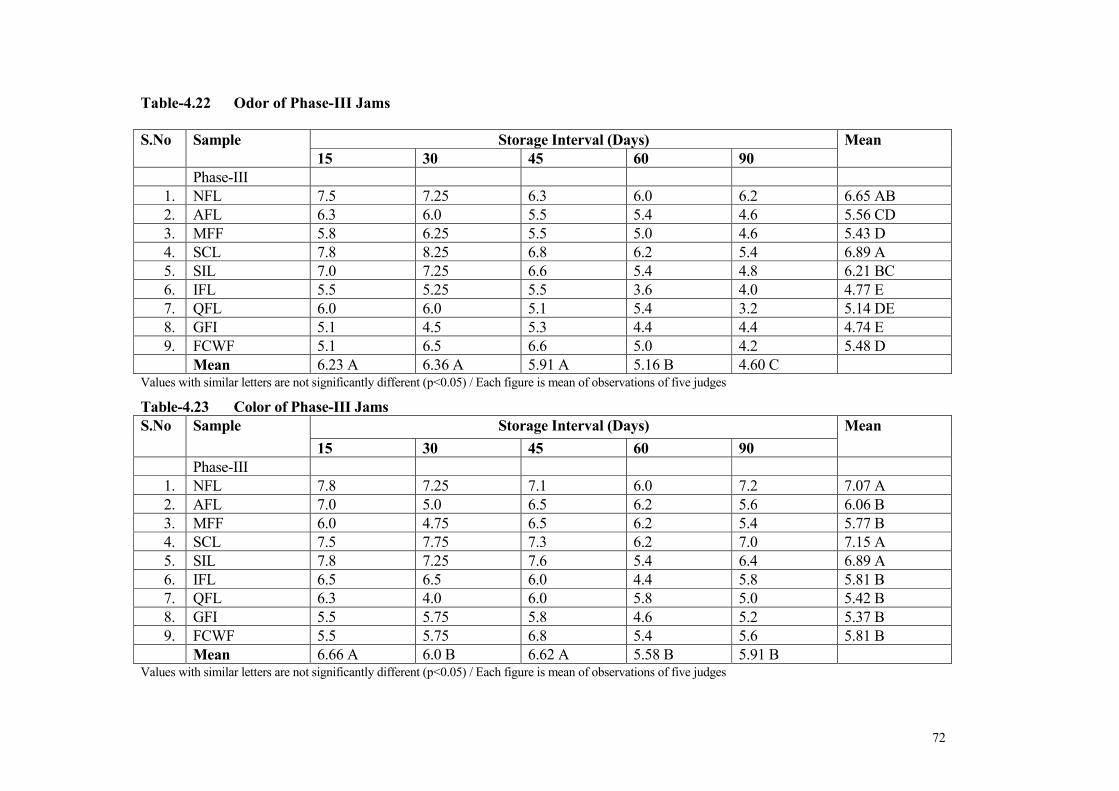
72
Table-4.22 Odor of Phase-III Jams
S.�o Sample Storage Interval (Days) Mean
15 30 45 60 90
Phase-III
1. NFL 7.5 7.25 6.3 6.0 6.2 6.65 AB
2. AFL 6.3 6.0 5.5 5.4 4.6 5.56 CD
3. MFF 5.8 6.25 5.5 5.0 4.6 5.43 D
4. SCL 7.8 8.25 6.8 6.2 5.4 6.89 A
5. SIL 7.0 7.25 6.6 5.4 4.8 6.21 BC
6. IFL 5.5 5.25 5.5 3.6 4.0 4.77 E
7. QFL 6.0 6.0 5.1 5.4 3.2 5.14 DE
8. GFI 5.1 4.5 5.3 4.4 4.4 4.74 E
9. FCWF 5.1 6.5 6.6 5.0 4.2 5.48 D
Mean 6.23 A 6.36 A 5.91 A 5.16 B 4.60 C Values with similar letters are not significantly different (p<0.05) / Each figure is mean of observations of five judges
Table-4.23 Color of Phase-III Jams
S.�o Sample Storage Interval (Days) Mean
15 30 45 60 90
Phase-III
1. NFL 7.8 7.25 7.1 6.0 7.2 7.07 A
2. AFL 7.0 5.0 6.5 6.2 5.6 6.06 B
3. MFF 6.0 4.75 6.5 6.2 5.4 5.77 B
4. SCL 7.5 7.75 7.3 6.2 7.0 7.15 A
5. SIL 7.8 7.25 7.6 5.4 6.4 6.89 A
6. IFL 6.5 6.5 6.0 4.4 5.8 5.81 B
7. QFL 6.3 4.0 6.0 5.8 5.0 5.42 B
8. GFI 5.5 5.75 5.8 4.6 5.2 5.37 B
9. FCWF 5.5 5.75 6.8 5.4 5.6 5.81 B
Mean 6.66 A 6.0 B 6.62 A 5.58 B 5.91 B Values with similar letters are not significantly different (p<0.05) / Each figure is mean of observations of five judges
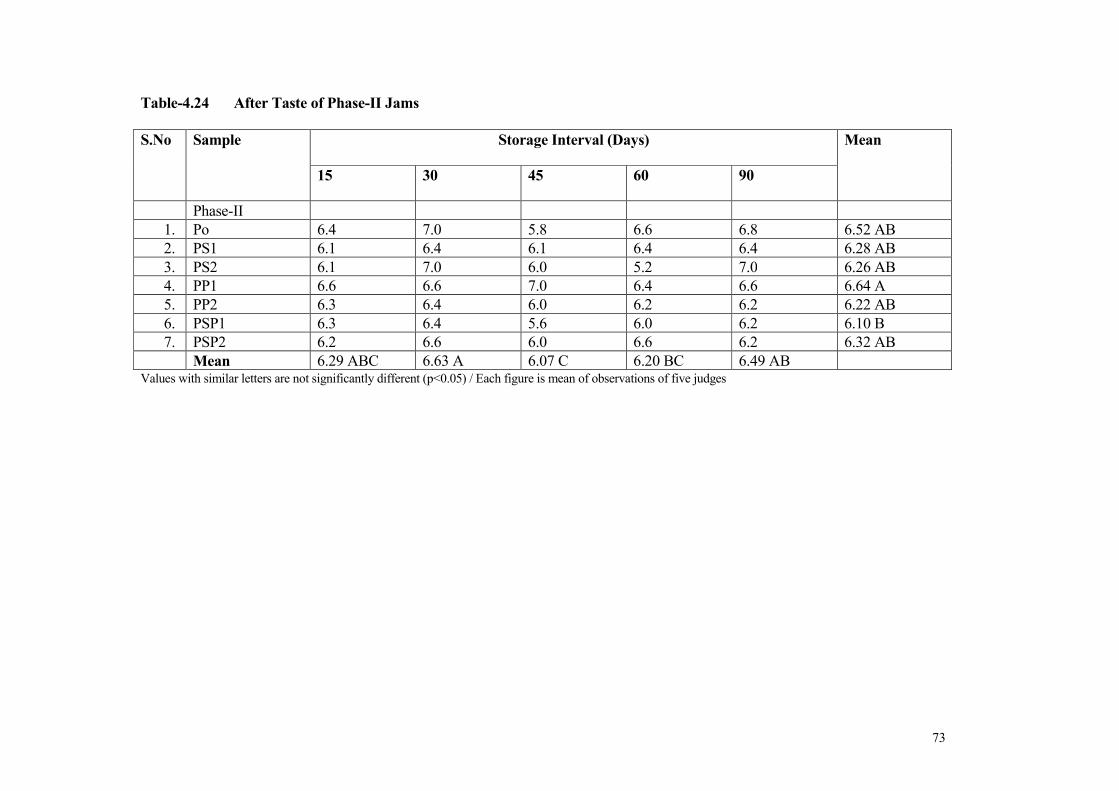
73
Table-4.24 After Taste of Phase-II Jams
S.�o Sample Storage Interval (Days) Mean
15 30 45 60 90
Phase-II
1. Po 6.4 7.0 5.8 6.6 6.8 6.52 AB
2. PS1 6.1 6.4 6.1 6.4 6.4 6.28 AB
3. PS2 6.1 7.0 6.0 5.2 7.0 6.26 AB
4. PP1 6.6 6.6 7.0 6.4 6.6 6.64 A
5. PP2 6.3 6.4 6.0 6.2 6.2 6.22 AB
6. PSP1 6.3 6.4 5.6 6.0 6.2 6.10 B
7. PSP2 6.2 6.6 6.0 6.6 6.2 6.32 AB
Mean 6.29 ABC 6.63 A 6.07 C 6.20 BC 6.49 AB Values with similar letters are not significantly different (p<0.05) / Each figure is mean of observations of five judges

74
Chapter-5
CO�CLUSIO� A�D RECOMME�DTIO�S
CO�CLUSIO�
According to the results of this study it is concluded that sugar concentration
plays its role in sweetness preference. Jams with low sugar levels 60% to 65% soluble
solids levels were better than above 68.5% soluble solid level. The same trend was
observed in sourness and overall acceptability.
Sodium Benzoate or potassium sorbate used at the rate of 0.05% confirmed its
effectiveness against molds in jams prepared from sulphited pulp with considerable acid
(10g/Kg) and below 68.5% soluble solids level stored in non-hermetic containers. Added
preservatives at the rate of 0.15% did not produce any bad effect on the taste of jams.
RECOMME�DATIO�S
It is recommended that:
1. Proper grading should be practiced depending on the sugar and pulp content of
the jams. Standards can be adopted and modified according to locally available
fruits in Pakistan.
2. Proper labeling should be practiced and all the ingredients used should be
declared on the label.
3. Price of the jam should be according to the quality standard of the jam.
4. Types of sugars used (other than sucrose) should be declared on the label.
5. If preservatives are added their name and quantity should be declared on the label.
75
Chapter-6
SUMMARY
Effect of different sugar concentration, pulp content and added preservatives on
acceptability and shelf life of mango jam was studied. Mango jam was prepared using
different levels of sucrose in the ranges of 60% to 64%, 65% to 68% and above 68.5%.
Different pulp ratios were used at the rate of 45%, 40% and 35% in combination with sugar
levels. Jams at 60% to 64% soluble solids levels were tested with addition of Sodium
Benzoate at the rate of 0.06% and 0.15%, Potassium Sorbate at the rate of 0.05% and 0.10%
while in combination Sodium Benzoate at the rate of 0.03% and 0.08% with Potassium
Sorbate at the rate of 0.03% and 0.07% respectively. Jams were stored at room temperature
in non-hermetic container for 3 months. Nine commercial brands of jams were selected from
local market. The jams were tested for physico-chemical, microbial and sensory attributes.
Jams with different sugar and pulp ratio were tested for sweetness, sourness, texture
and overall acceptability. Jam with added preservatives along with 9 commercial brands
were analyzed for TSS, Acidity, pH, Reducing, Non-reducing sugars and Ascorbic acid.
Jams at low soluble solids level 60% to 64% were tested for mold growth it also included 2
commercial jams NFL (National) and QFL (Quice). Sweetness, sourness, texture and
overall acceptability was observed from all jams while after taste of preservative treated and
color, odor of commercial jams was additionally evaluated. The study is fruit full as it
emphasizes the role of proper grading and standardization of jams with its price. It provides
with different formulations and the proper amount of preservative to be used for preserving
jam stored in non-hermetic container.
Previous studies showed that different formulations and substitutes of ingredients

76
were tried for preparation of jams. It was technologically possible to prepare jam at soluble
solids lower than currently used. The sucrose was replaced with different sweeteners. Non-
hermetic containers offer a potential source of contamination and molds may grow at the
surface of jams. Different preservatives were used in high pH concentrated jams to check
the mold growth. Commercial brands of jam were evaluated in Europe for presence of
preservatives. Fruit jam has also been used to flavor yogurt.
Results of the study revealed that soluble solids were according to the ranges as
planned 72% to 77%, 65.5% to 66% and 59% to 64% in Phase-I, 60% to 63.5% in Phase-II.
Commercial samples were significantly different from each other ranging 63.5% to 73.5%.
Active acidity (pH) of control sample was 3.7 and with added preservatives it decreased to
3.6 in case of Sodium Benzoate while 3.4 in Potassium Sorbate. Commercial jams were
found having as low as pH-3.2 and maximum of pH-4.0. Total acidity was 0.68% in Po, PS1
and PS2 it was higher in jams with added Potassium Sorbate 0.8% in PSP1, PSP2 and
0.92% in PP1. Acidity values increased during storage from minimum mean value of 0.62%
to 0.75% after 60 days and stabilized after 90 days of storage. Reducing sugars were 9% to
15% in Phase-II jams while 23% to 51% in commercial jam samples there was a clear
difference. Reducing sugars increased during storage from mean value of 26.6% to 35.6% in
90 days. Non-reducing sugars were 38% to 46% in Phase-II and lower 13% to 43% in
commercial jams. Non-reducing sugars decreased during storage from mean value of
34.01% to 19.17%. Ascorbic acid (Vit C) was determined in only SCL (Salmans) and SIL
(Shezan) in an amount of 13.5 mg/100g and 14.4 mg/100g respectively. Vitamin ‘C’ slightly
decreased during 3 months storage. The studies on colony count of fungi in jams at different
storage intervals showed that PSP2 proved most effective treatment against control of fungi.

77
The fungi isolated were identified as belonging to genera Aspergillus, Pencillium and
Fusarium.
Sensory evaluation revealed that jams with low sugar levels 60% to 65% soluble
solids level were preferred for sweetness, sourness and overall acceptability. Addition of
preservatives produced no objectionable taste to the jams. Synersis was observed in jams
with added Potassium Sorbate. Pulp content of 40% and 45% in combination to 60% to 65%
soluble solids levels was preferred over others. Commercial brands SCL (Salmans), SIL
(Shezan) and NFL (National) scored extraordinary better than others in color, odor and all
other sensory attributes.

78
LITERATURE CITED
Abdel-Magied, M.M., N.M. El-Shimi and E.A.A. El-Hassan.1991. Utilization of new
pumpkin strains for jam production. Bulletin of Faculty of Agriculture, University
of Cairo. 42: 4, 1187-1211.
Alhooti, S., J.S. Sidhu., H. Alamiri., J. Alotaibi and H. Qabazard.1996. Quality and
acceptability of processed products from date fruits cultivars grown in the United
Arab Emirates. Arab Gulf J. Sci. Res. 14(2):383-403.
Ali, M. 1965. Canning of fruits vegetables and their juices. Effect of canning and storage
on the quality of juice from different varieties of oranges. M.Sc.thesis. Dept.of
Food Technology, Agri.Univ. Faisalabad.
Anjum, F. M., M. U. Din., I. Ahmad and A. R. Pasha. 2000. Preparation and evaluation
of dried apricot diet jam. Pak. J. Food Sci., 3(10):21-24.
AOAC 1975. Official methods of analysis Association of Official Analytical Chemists 12th
edition. Washington, D.C.
Awan, J.A. and S.U. Rehman. 1999. Food Preservation Manual. Uni. Tech. Publishers.
Faisalabad. Pakistan.
Bakr, A.A. 1997. Application potential for some sugar substitutes in some low energy and
diabetic foods. Nahrung. 41:3, 170-175.
Barwal, V.S. and M, Kalia. 1996. Effect of gelling agents on the preparation of low
solids apple preserves. J. Food Sci. & Tech. Mysore. 33(6):525-526.
Barwal, V.S. 1999. Development and significance of low calorie fruit products. Indian J.
Nutr. & Diet. 36:8, 378-383.
79
Bera., M.B., A. Agrawal and Y.K. Sharma. 1995.Energy accounting in fruit and
vegetable canning industry. J. Food Sci. & Tech. Mysore. 32(4):342-344.
Con, A.H., S. Cakmakci., A. Caglar and H.Y.Gokalp. 1996. Effects of different fruits and
storage periods on microbiological qualities of fruit-flavored yogurt produced in
Turkey. J. Food Prot. 59(4):402-406.
Defernez, M. and R.H. Wilson.1995. Mid-infrared spectroscopy and chemometrics for
determining the type of fruit used in jam. J. Sci. of Food & Agr. 67(4):461-467.
Desrosier, N.W. 1977. Elements of food technology. AVI Publishing Co. Inc. Westport,
Connecticut.
Desrosier, N.W. and J.N. Desrosier. 1978. The technology of food preservation. Fourth
edition. AVI Publishing Co. Inc. Westport, Connnecticut.
DiLiello, L. R. 1982. Methods in Food and Dairy Microbiology. AVI Publishing
Company, Inc. Westport, Connecticut.
Egan, H., R.S. Kirk and R. Sawyer. 1981. Pearson’s Chemical Analysis of Foods. Eighth
Edition, Churchill Livingstone, Longman Group Limited, NewYork.
Falco, A.S., J.A.Larrauri., B. Borroto., E. Sevillano and M. Nunez. 1993. Use of
combined methods for preserving a concentrated jam obtained from strawberry
wastes. Alimentaria. 30: 242, 69-71.
Garcia Viguera, C., P. Zafrilla, F. Romero., P. Abellan., F. Artes and F.A. Tomas. 1999.
Color stability of strawberry jam as affected by cultivar and storage temperature.
J. Food Sci. 64(2):243-247.
80
Garcia-Viguera, C., P. Zafrilla., F. Artes., F. Romero., P. Abellan and F.A. Tomas-
Barberan.1998. Colour and anthocyanin stability of red raspberry jam. J. of the
Sci. Food & Agri. 78(4):565-573.
Garciaviguera, C., P. Zafrilla and F.A. Tomasbarberan.1997. Determination of
authenticity of fruit jams by HPLC analysis of anthocyanins. J. Sci. of Food &
Agri. 73(2):207-213.
Grigelmo-Miguel, N. and O. Martin-Belloso. 2000. The quality of peach jams stabilized
with peach dietary fiber. European Food Res. & Tech. 211(5):336-341.
Halat, M.S., C.A. Reitmeier., F. Takeda and D.L. Peterson. 1997. Sensory evaluation of
jams made from three eastern thornless and marion blackberries. J. Food Quality.
20(3):177-188.
Hyvonen, L. and R. Torma. 1983. Examinatin of sugars, sugar alcohols and artificial
sweeteners as substitutes for sucrose in strawberry jam. Product development. J.
Food Sci. 48:183-185.
Hyvonen, L. and R. Torma. 1983. Examinatin of sugars, sugar alcohols and artificial
sweeteners as substitutes for sucrose in strawberry jam. Keeping quality tests. J.
Food Sci. 48:186-192.
Implovo, F. E., Mendes., P. Brito and M.A. Ferreira. 2000. Simultaneous determination
of benzoic and sorbic acids in quince jam by HPLC. Food Res. Inter. 33(2):113-
117.
Ishiwata, H., M. Nishijima., Y. Fukasawa ., Y. Ito and T. Yamada. 1997. Evaluation of
the contents of antifungal agents allowed as food additives in foods and the daily
81
intake deduced from the results of the official inspection in Japan in fiscal year
1994. J. Food Hyg. Soc. of Japan. 38(5):296-306.
Kar, F. and N. Arslan . 1999. Effect of temperature and concentration on viscosity of
orange peel pectin solutions and intrinsic viscosity-molecular weight relationship.
Carbohydrate Polymers. 40(4):277-284.
Karim, 1966. Canning of citrus juices. Effect of Blending and canning on juices of
Layallpur grown grape fruits and oranges on their quality during storage. M.Sc.
Thesis. Agri. Univ. Faisalabad.
Khan, N.R. 1987. Photochemical changes in packed orange juice during storage. M.Sc.
Thesis, Dept, of Food Sci. and Tech. NWFP Agri. Univ.Peshawar.
Kramer, A. and B.A.Twigg. 1982. Quality Control for the Food Industry: Taste Testing.
Third Edition. AVI Publishing Company. Inc. Westport. Connecticut. 1: 120-154.
Larmond. 1977. Laboratory method of sensory evaluation of food: Publication 1977,
Canada, Dept: of Agir. Ottawa.
Lopez, L., E. Wittig., M. Craddock and C. Wainer. 1990. Manufacture of a low-energy
product: jam roll. Revista de Agroquimica y Tecnologia de Alimentos. 30: 1, 122-
129.
Lueck, E. 1980. Antimicrobial Food Additives, Springer-Verlog. New York.
Movitz, J. 1989. Food preservatives. Var-Foda. 41: 5-6, 260-270.
Palaniswamy, R.P., C.R. Mukhurishman and K.g. Shamuganelw. 1974. Studies on the
evaluation of certain mango varieties of tainel Nadvi for pulp and squash. Indian
Food Packers. 28:509.

82
Prestamo, G., P.D. Sanz., M. Fonberg-Broczek and G. Arroyo. 1999. High pressure
response of fruit jams contaminated with Listeria monocytogenes. Letters in
Applied Microbiology. 28(4):313-316.
Prestamo, G., P.D. Sanz., M. Fonberg-Broczek and G. Arroyo. 1999. High pressure
response of fruit jams contaminated with Listeria monocytogenes.Letters in
Applied Microbiology. 28(4):313-316.
Raphaelides, S.N., A. Ambatzidou and Petridis. 1996. Sugar composition effects on
textural parameters of peach jam. J. Food Sci. 61(5):942-946.
Riaz, M.N., G. Mohyuddin and M.I. Al-Haq. 1999. Physical, chemical and sensory
characteristics of jams made from fresh and frozen strawberries. Pakistan J. Arid
Agric. 2(1):51-60.
Rosenfeld, H.J. and A. Nes. 2000. Prediction of sensory quality of strawberry jam by
means of sensory quality attributes of fresh fruits. J. Sci. of Food & Agri.
80(13):1895-1902.
Scandinavian-Dairy-Information. 1993. Aseptic one-way container improves quality of
jam used in yoghurt. Scandinavian Dairy Information. 1993,7:2.
Steel, R.G.D. and J.H. Torie. 1980. Principles and procedures of statistics. Mc. GrawHill
Publ. Co. Inc. New York.
Suutarinen, J., K. Honkapaa., R.L Heinio., K. Autio and M. Mokkila . 2000. The effect
of different prefreezing treatments on the structure of strawberries before and
after jam making. Lebensmittel Wissenschaft Technologie. Food Sci. Tech.
33(3):188-201.
Torezan, G.A.P. 2002. Comparison between mango (cv. Keitt) jam with no sugar
addition obtiained by a continuous process and conventional jam processed in
83
open vats. Department of Food Technology, University of Campinas,
Departmento de Tecnologia de Alimentos FEA UNICAMP CP 6121M,
Campinas, 13083970, Brazil and N. H. Pezoa-Garcia.
Tremazi, S.A. and I.H. Tremzi. 1967. Canning of Pakistani peaches. Pak. J. Sci. Res.
19(1): 18-23.
Tuorila, H., A. Andersson., A. Martikainen and H. Salovaara. 1998. Effect of product
formula, information and consumer characteristics on the acceptance of a new
snack food. Food Quality & Preference. 9(5):313-320.
Tuorila, H., C. Sommardahl., L. Hyvonen., K. Leporanta and P. Merimaa. 1993. Sensory
attributes and acceptance of sucrose and fat in strawberry yoghurts.International J.
Food Sci. & Tech. 1993, 28: 4, 359-369.
Viberg, U. G. Ekstrom., K. Fredlund., R.E. Oste and I. Sjoholm . 1997. A study of some
important vitamins and antioxidants in a blackcurrant jam with low sugar content
and without additives. Inter. J. Food Sci. & Nutr. 48(1):57-66.
Villaran, M.C., E. Cepeda ., F.J. Llorens and A. Ibarz. 1997. Influence of temperature on
rheological behaviour of jams of apricot (prunus armeniaca), bilberry (vaccinium
myrtillus) and rose hip (rosa canina) Food Sci. & Tech. Inter. 3(1):13-19.
Will, F. and E. Kruger. 1999. Fungicide residues in strawberry processing. J. Agri. &
Food Chem. 47(3):858-861.
Zafrilla, P., A. Valero and C. Garcia-Viguera. 1998. Stabilization of strawberry jam
colour with natural colourants. Food Sci. & Tech. Inter. 4(2):99-105.

84
APPE�DICES
Appendix-1 ANOVA on Total Soluble Solids of Phase-II & III Jams
K
Value
Source of
Variation
Degrees of
Freedom
Sum of
Squares
Mean
Square
F
Value
Prob
1. Storage 4 29.578 7.395 20.999 0.0000
2. Treatments 15 1310.576 87.372 248.1293 0.0000
3. Error 60 21.127 0.352
Total 79 1361.282
Coefficient of Variation: 0.90%
LSD Value for storage: 0.4196 at alpha=0.05
LSD Value for Treatment: 0.7643 at alpha=0.05
Appendix-2 ANOVA on Acidity of Phase-II & III Jams
K
Value
Source of
Variation
Degrees of
Freedom
Sum of
Squares
Mean
Square
F
Value
Prob
1. Storage 4 0.262 0.066 13.9893 0.0000
2. Treatments 15 0.719 0.048 10.2401 0.0000
3. Error 60 0.281 0.005
Total 79 1.263
Coefficient of Variation: 10.48%
LSD Value for storage: 0.05001 at alpha=0.05
LSD Value for Treatment: 0.08946 at alpha=0.05
Appendix-3 ANOVA on Reducing Sugars of Phase-II & III Jams
K
Value
Source of
Variation
Degrees of
Freedom
Sum of
Squares
Mean
Square
F
Value
Prob
1. Storage 4 919.469 229.867 7.0762 0.0001
2. Treatments 15 14191.502 946.100 29.1245 0.0000
3. Error 60 1949.080 32.485
Total 79 17060.052
Coefficient of Variation: 17.88%
LSD Value for storage: 4.031 at alpha=0.05
LSD Value for Treatment: 7.211 at alpha=0.05

85
Appendix-4 ANOVA on Non Reducing Sugar of Phase-II & III Jams
K
Value
Source of
Variation
Degrees of
Freedom
Sum of
Squares
Mean
Square
F
Value
Prob
1. Storage 4 2351.546 587.886 19.1983 0.0000
2. Treatments 15 9167.595 611.173 19.9494 0.0000
3. Error 60 1838.168 30.636
Total 79 13357.309
Coefficient of Variation: 21.11%
LSD Value for storage: 3.914 at alpha=0.05
LSD Value for Treatment: 7.002 at alpha=0.05
Appendix-5 ANOVA on Ascorbic Acid of Phase-III Jams
K
Value
Source of
Variation
Degrees of
Freedom
Sum of
Squares
Mean
Square
F
Value
Prob
1. Storage 4 8.386 2.097 4.4845 0.0876
2. Treatments 1 0.900 0.900 1.9251 0.2376
3. Error 4 1.870 0.467
Total 9 11.156
Coefficient of Variation: 5.57%
Appendix-6 ANOVA on Mold Count of Phase-II & III Jams
K
Value
Source of
Variation
Degrees of
Freedom
Sum of
Squares
Mean
Square
F
Value
Prob
1. Storage 4 118564.444 29641.111 3.8970 0.0109
2. Treatments 8 396404.444 49550.556 6.5146 0.0000
3. Error 32 243395.556 7606.11
Total 44 758364.444
Coefficient of Variation:104.94%
LSD Value for storage: 83.74 at alpha=0.05
LSD Value for Treatment: 112.4 at alpha=0.05
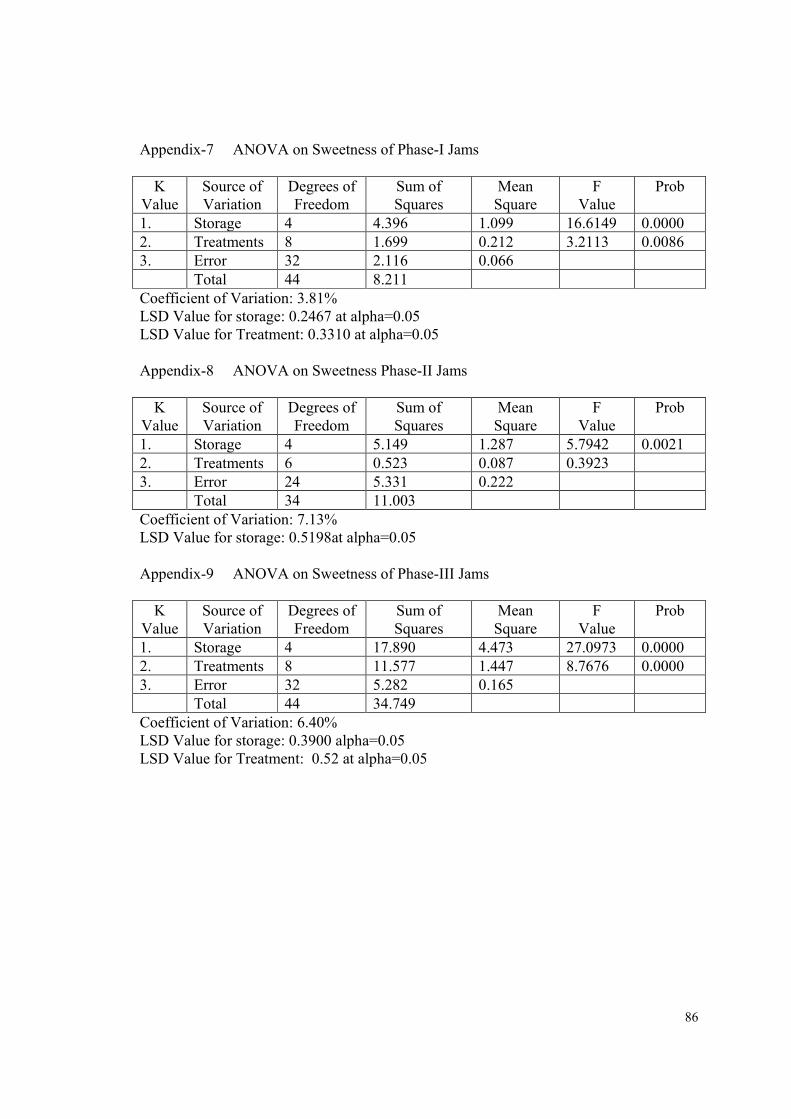
86
Appendix-7 ANOVA on Sweetness of Phase-I Jams
K
Value
Source of
Variation
Degrees of
Freedom
Sum of
Squares
Mean
Square
F
Value
Prob
1. Storage 4 4.396 1.099 16.6149 0.0000
2. Treatments 8 1.699 0.212 3.2113 0.0086
3. Error 32 2.116 0.066
Total 44 8.211
Coefficient of Variation: 3.81%
LSD Value for storage: 0.2467 at alpha=0.05
LSD Value for Treatment: 0.3310 at alpha=0.05
Appendix-8 ANOVA on Sweetness Phase-II Jams
K
Value
Source of
Variation
Degrees of
Freedom
Sum of
Squares
Mean
Square
F
Value
Prob
1. Storage 4 5.149 1.287 5.7942 0.0021
2. Treatments 6 0.523 0.087 0.3923
3. Error 24 5.331 0.222
Total 34 11.003
Coefficient of Variation: 7.13%
LSD Value for storage: 0.5198at alpha=0.05
Appendix-9 ANOVA on Sweetness of Phase-III Jams
K
Value
Source of
Variation
Degrees of
Freedom
Sum of
Squares
Mean
Square
F
Value
Prob
1. Storage 4 17.890 4.473 27.0973 0.0000
2. Treatments 8 11.577 1.447 8.7676 0.0000
3. Error 32 5.282 0.165
Total 44 34.749
Coefficient of Variation: 6.40%
LSD Value for storage: 0.3900 alpha=0.05
LSD Value for Treatment: 0.52 at alpha=0.05

87
Appendix-10 ANOVA on Sourness of Phase-I Jams
K
Value
Source of
Variation
Degrees of
Freedom
Sum of
Squares
Mean
Square
F
Value
Prob
1. Storage 4 12.841 3.210 22.2782 0.0000
2. Treatments 8 1.204 0.151 1.0448 0.4245
3. Error 32 4.611 0.144
Total 44 18.656
Coefficient of Variation: 5.94%
LSD Value for storage: 0.3644 at alpha=0.05
Appendix-11 ANOVA on Sourness Phase-II Jams
K
Value
Source of
Variation
Degrees of
Freedom
Sum of
Squares
Mean
Square
F
Value
Prob
1. Storage 4 4.830 1.207 7.8130 0.0004
2. Treatments 6 1.795 0.299 1.9356 0.1159
3. Error 24 3.710 0.155
Total 34 10.335
Coefficient of Variation: 6.21%
LSD Value for storage: 0.3830 at alpha=0.05
Appendix-12 ANOVA on Sourness of Phase-III Jams
K
Value
Source of
Variation
Degrees of
Freedom
Sum of
Squares
Mean
Square
F
Value
Prob
1. Storage 4 17.804 4.451 31.1794 0.0000
2. Treatments 8 7.194 0.899 6.2994 0.0001
3. Error 32 4.568 0.143
Total 44 29.567
Coefficient of Variation: 6.63%
LSD Value for storage: 0.3631 alpha=0.05
LSD Value for Treatment: 0.4872 at alpha=0.05

88
Appendix-13 ANOVA on Texture of Phase-I Jams
K
Value
Source of
Variation
Degrees of
Freedom
Sum of
Squares
Mean
Square
F
Value
Prob
1. Storage 4 6.896 1.724 14.0947 0.0000
2. Treatments 8 3.190 0.399 3.2599 0.0079
3. Error 32 3.914 0.122
Total 44 14.001
Coefficient of Variation: 5.64%
LSD Value for storage: 0.3354 at alpha=0.05
LSD Value for Treatment: 0.4500 at alpha=0.05
Appendix-14 ANOVA on Texture Phase-II Jams
K
Value
Source of
Variation
Degrees of
Freedom
Sum of
Squares
Mean
Square
F
Value
Prob
1. Storage 4 3.989 0.997 5.4845 0.0028
2. Treatments 6 1.739 0.290 1.5946 0.1920
3. Error 24 4.363 0.182
Total 34 10.091
Coefficient of Variation: 6.53 %
LSD Value for storage: 0.4706 at alpha=0.05
Appendix-15 ANOVA on Texture of Phase-III Jams
K
Value
Source of
Variation
Degrees of
Freedom
Sum of
Squares
Mean
Square
F
Value
Prob
1. Storage 4 14.088 3.522 18.7465 0.0000
2. Treatments 8 22.241 2.780 14.7976 0.0000
3. Error 32 6.012 0.188
Total 44 42.341
Coefficient of Variation: 6.95%
LSD Value for storage: 0.4163 at alpha=0.05
LSD Value for Treatment: 0.5586 at alpha=0.05

89
Appendix-16 ANOVA on Overall Acceptability of Phase-I Jams
K
Value
Source of
Variation
Degrees of
Freedom
Sum of
Squares
Mean
Square
F
Value
Prob
1. Storage 4 5.296 1.324 8.8726 0.0001
2. Treatments 8 1.344 0.168 1.1261 0.3728
3. Error 32 4.776 0.149
Total 44 11.416
Coefficient of Variation: 6.03%
LSD Value for storage: 0.3706 at alpha=0.05
Appendix-17 ANOVA on Overall Acceptability Phase-II Jams
K
Value
Source of
Variation
Degrees of
Freedom
Sum of
Squares
Mean
Square
F
Value
Prob
1. Storage 4 2.011 0.503 2.9204 0.0423
2. Treatments 6 1.327 0.221 1.2848 0.3014
3. Error 24 4.133 0.182
Total 34 7.471
Coefficient of Variation: 6.41 %
LSD Value for storage: 0.455 at alpha=0.05
Appendix-18 ANOVA on Overall Acceptability of Phase-III Jams
K
Value
Source of
Variation
Degrees of
Freedom
Sum of
Squares
Mean
Square
F
Value
Prob
1. Storage 4 8.311 2.078 9.1070 0.0000
2. Treatments 8 28.428 3.553 15.5751 0.0000
3. Error 32 7.301 0.228
Total 44 44.040
Coefficient of Variation: 8.05%
LSD Value for storage: 0.4585 at alpha=0.05
LSD Value for Treatment: 0.6151 at alpha=0.05
Appendix-19 ANOVA on Overall Acceptability of Phase-I, II and III Jams
K
Value
Source of
Variation
Degrees of
Freedom
Sum of
Squares
Mean
Square
F
Value
Prob
1. Storage 4 12.770 3.192 16.0813 0.0000
2. Treatments 24 38.461 1.603 8.0724 0.0000
3. Error 96 19.058 0.199
Total 124 70.289
Coefficient of Variation: 7.12%
LSD Value for storage: 0.2505 at alpha=0.05
LSD Value for Treatment: 0.5600 at alpha=0.05

90
Appendix-20 ANOVA on Odor of Phase-III Jams
K
Value
Source of
Variation
Degrees of
Freedom
Sum of
Squares
Mean
Square
F
Value
Prob
1. Storage 4 20.350 5.087 19.4869 0.0000
2. Treatments 8 23.996 2.999 11.4892 0.0000
3. Error 32 8.354 0.261
Total 44 52.700
Coefficient of Variation: 9.04%
LSD Value for storage: 0.4906 at alpha=0.05
LSD Value for Treatment: 0.6582 at alpha=0.05
Appendix-21 ANOVA on Color of Phase- III Jams
K
Value
Source of
Variation
Degrees of
Freedom
Sum of
Squares
Mean
Square
F
Value
Prob
1. Storage 4 7.970 1.992 5.2389 0.0023
2. Treatments 8 19.497 2.437 6.4081 0.0001
3. Error 32 12.170 0.380
Total 44 39.637
Coefficient of Variation: 10.02%
LSD Value for storage: 0.5919 at alpha=0.05
LSD Value for Treatment: 0.7941 at alpha=0.05
Appendix-22 ANOVA on After Taste of Phase- III Jams
K
Value
Source of
Variation
Degrees of
Freedom
Sum of
Squares
Mean
Square
F
Value
Prob
1. Storage 4 1.393 0.348 2.9403 0.0413
2. Treatments 6 1.023 0.170 1.4392 0.2411
3. Error 24 2.843 0.118
Total 34 5.259
Coefficient of Variation: 5.43%
LSD Value for storage: 0.3790 at alpha=0.05

91
Appendix-23 Proforma used for Sensory Evaluation of Phase-I, II and III Jams.
SE�SORY EVALUATIO�
Observation Sheet – VIII Judges Score
�ame: Profession/Field: Age:
Storage Interval (Days): Date: Replication:
[Scale: (9-Like Extremely) (8-Like Very Much) (7-Like Moderately) (6-Like Slightly) (5-�either Like nor
Dislike) (4-Dislike Slightly) (3-Dislike Moderately) (2-Dislike Very Much) (1-Dislike Extremely)]
Table-1 Preservatives
S.�o. Sample Sweetness Sourness Saltiness Texture After
Taste
Over All
acceptability
1. Po
2. PS1
3. PS2
4. PP1
5. PP2
6. PSP1
7. PSP2
Table-2 Sugar and Pulp Percentage
S.�o. Sample Sweetness Sourness Texture Over All
acceptability
8. T1.1
9. T1.2
10. T1.3
11. T2.1
12. T2.2
13. T2.3
14. T3.1
15. T3.2
16. T3.3
Table-3 Commercial Brands
S.�o. Sample Sweetness Sourness Saltiness Texture Odor Color Over All
acceptability
17. �FL
18. AFL
19. MFF
20. SCL
21. SIL
22. IFL
23. QFL
24. GFI
25. FCWF
NOTES:
1. Move product all around the Tongue to have mouth feel.
2. Wash mouth with drinking water after tasting each sample.
3. Please indicate if you smoke, sniff, use tobacco (naswar) regularly: YES: NO: