effect of fluence on the discoloration of marble cleaned
TRANSCRIPT

www.elsevier.com/locate/apsusc
Applied Surface Science 253 (2007) 3083–3092
Effect of fluence on the discoloration of marble cleaned with UV lasers
Jie Zhang a,*, Andrew J. Birnbaum a, Y. Lawrence Yao a, Fen Xu b, John R. Lombardi b
a Department of Mechanical Engineering, Columbia University, New York, NY 10027, United Statesb Department of Chemistry, City College of New York, New York, NY 10031, United States
Received 29 March 2006; accepted 26 June 2006
Available online 1 August 2006
Abstract
The effect of fluence level on the discoloration of marble surfaces after the removal of the encrustation by 355 nm laser pulses is comparatively
studied. Considering the thermochemical reaction possibly occurring in the encrustation during laser irradiation, the mechanism responsible for the
discoloration of the cleaned marble surface is analyzed. The reduction of iron oxides by graphite plays a key role in determining the final color of
the cleaned marble surface. A two-dimensional laser ablative cleaning model including the reaction heat is applied to calculate the temperature
distribution during laser heating. The kinetics of the thermochemical reaction is estimated based on the simulated temperature field. The
occurrence of the thermochemical reaction is also verified indirectly with experiments. The marble surfaces before and after laser irradiation are
characterized in terms of the chemical components through surface enhanced Raman spectroscopy. The surface color is measured with a
chromameter using a 1976 CIE L*a*b* color system. The proposed mechanism is also applied to numerically analyze the severe discoloration of
marble cleaned with laser pulses at 1064 nm.
# 2006 Elsevier B.V. All rights reserved.
PACS: 42.62.�b; 79.20.Ds
Keywords: Laser cleaning; UV laser; Marble
1. Introduction
Marble, a metamorphic limestone, primarily consists of
calcite, a crystalline form of calcium carbonate (CaCO3).
Marble is widely used in statues and monuments, as well as a
structural material. Its exposure to a sulphur dioxide (SO2)-
polluted atmosphere, particularly in an urban environment,
results in a thin layer of black encrustation due to the formation
of gypsum (CaSO4�2H2O). Sulphur dioxide from the combus-
tion of fossil fuels readily reacts with the CaCO3 present in the
marble to form gypsum. The softer and more water-soluble
gypsum is easily contaminated by soot particles containing
metal oxide and graphite, as well as numerous organic
constituents, further contributing to the generation of the black
encrustation [1].
* Correspondence to: Columbia University, Department of Mechanical Engi-
neering, Foundation School of Engineering and Applied Science, 220 Mudd
Bldg., MC4703 New York, NY 10027, United States. Tel.: +1 212 666 2393;
fax: +1 212 666 2393.
E-mail address: [email protected] (J. Zhang).
0169-4332/$ – see front matter # 2006 Elsevier B.V. All rights reserved.
doi:10.1016/j.apsusc.2006.06.056
This encrustation has a detrimental effect on the aesthetic
value of both artistic and practical marble structures. Moreover,
the encrustation facilitates the biodeterioration of the marble
since it can host bacteria, lichen, mosses, higher plants and
other microorganisms [2]. Chemical cleaning is the traditional
means for removing the encrustation. However, there exists the
possibility of chemical reactions between the chemical agents
utilized and marble, as well as the environmental pollution. The
encrustation is also mechanically removed through using a
scalpel or the air-abrasive machine. The effectiveness of the
scalpel is restricted by the restorative talents of the restorer and
the brittleness of the material. The results of air-abrasive
machine treatments are also largely dependent on the restorer’s
skill levels, as the machine cannot distinguish the encrustation
from the stone. Due to the non-uniformity of the encrustation,
unavoidable surface damage of the marble results in the loss of
fine details of the artworks [3].
Pulsed laser removal of the encrustation is a promising
alternative due to the fast and non-contact operation and the
high-precision spatial and temporal control. In addition, the
laser pulses cannot damage the marble surface after the removal

J. Zhang et al. / Applied Surface Science 253 (2007) 3083–30923084
of the encrustation due to the large difference in the absorptivity
between the encrustation and the marble, which is termed self-
limiting [3]. Laser cleaning nano-particles from semiconductor
surfaces [4] and surface layer from metals or semiconductors
[5] have been extensively studied. Since the pulsed laser
cleaning of the encrustation from the marble was first
implemented by John Asmus in 1971 [6], massive investiga-
tions related to the laser cleaning of stoneworks have been
performed.
Laboure et al. [7] explored the effect of laser fluence, spot
area and water spraying on the cleaning rate of the stone. Siano
et al. [8] studied how pulse duration affects the laser stone-
cleaning process. Siano et al. [9] also experimentally
determined the fluence thresholds corresponding to the various
side effects in laser stone cleaning. Laser-induced breakdown
spectroscopy (LIBS) was employed as an in situ technique for
monitoring the laser removal of the encrustation by Maravelaki
et al. [10]. Rodriguez-Navarro et al. [11] found that the marble
surface was roughened by the excessive laser pulses at
supposedly safe fluence levels.
Both Maravelaki-Kalaitzaki et al. [12] and Marakis et al.
[13] comparatively investigated the removal of different types
of encrustation with different wavelengths. While the
prominent self-limiting effect at 1064 nm is extremely
beneficial in protecting the marble surface, the cleaned marble
surface becomes severely yellowed. On the contrary, no severe
yellowing occurs on the marble surface cleaned at 355 nm.
Klein et al. [14] and Potgieter-Vermaak et al. [15] both
postulated that the yellowing at 1064 nm is due to residues of
iron oxides on the marble surface detected by their experiments.
However, they did not provide an explanation for the presence
of these residues. Zafiropulos et al. [16] proposed that the
discoloration is mainly an optical phenomenon. The dark
particles are vaporized by the IR laser fluences below the
cleaning threshold to generate voids in the encrustation. These
voids make the light scattering different so that the color
perception is altered towards yellow. Nevertheless, this
argument lacks evidence.
In the present paper, the influence of the fluence levels on
the surface color of marble cleaned with the 355 nm laser
pulses is examined. A mechanism leading to the discoloration
of the marble surface is proposed based on an analysis of the
thermochemical reactions possibly occurring in the encrusta-
tion during laser irradiation. A two-dimensional laser ablative
cleaning model including the reaction heat of the thermo-
chemical reactions is applied in simulating the temperature
field generated by the laser irradiation. Then, the kinetics of
the thermochemical reactions are used to verify their
presence. The proposed mechanism is also used to explain
the severe discoloration of marble cleaned with laser pulses at
1064 nm.
2. Experiment conditions
A Q-switched Nd:YAG laser operating at 355 nm in
TEM00 mode is used as the light source. The laser has a pulse
duration of 50 ns, with a constant repetition rate at 1 kHz.
The beam diameter is set at 100 mm and the pulse fluence is
varied from 0.3 to 3 J/cm2 through adjusting the distance of
the sample from the focusing lens. The sample is placed on
the computer-controlled XYZ stage in open air, while the
compressed air blows on the sample to prevent the ablation-
formed plasma from touching the focusing lens during the
experiment.
Italian white Carrara marble was selected as the investigated
sample with dimensions 15 mm � 15 mm � 9 mm. Its surface
is honed to eliminate the obvious surface dents. The sample is
thoroughly cleaned with methanol before making the encrusta-
tion. For numerical calculation of the laser produced
temperature field, the encrustation is artificially made to better
control the material property. The encrustation is a compound
of 5% or 10% hematite (Fe2O3) powder, 20% graphite powder
and 75% or 70% gypsum (CaSO4�2H2O) (vol.%), mixed with
distilled water, and smeared onto the marble with a brush [14].
The marble with the encrustation is then left for 72 h in a
storage box. On average, the encrustation thickness is
approximately 120 mm.
3. Related thermochemical reactions
3.1. Thermal dehydration and decomposition of gypsum
(CaSO4�2H2O)
Gypsum (CaSO4�2H2O, calcium sulphate dehydrate), the
major ingredient in the encrustation, is a crystalline mineral that
contains about 21% chemically combined water by weight.
When gypsum is heated, two thermal dehydration reactions
occur starting at 373 and 573 K, respectively. These two
reactions are described as:
CaSO4 � 2H2O!CaSO4 � 12H2Oþ 3
2H2O� 17:2 kJ=mol (1)
CaSO4 � 12H2O!CaSO4 þ 1
2H2O� 8:6 kJ=mol (2)
During these two reactions, water is released as steam with an
absorbed energy of 81.7 kJ/mol. Therefore, the total required
energy in the dehydration of gypsum is 107.5 kJ/mol [17].
At temperatures above 1373 K, CaSO4 starts to decompose
into calcium oxide (CaO) and sulphur dioxide (SO2) according
to the following equation [18]:
CaSO4!CaOþ SO2 þ 12O2 � 480 kJ=mol (3)
Calcite (CaCO3) is dissociated into CaO and carbon dioxide
(CO2) starting at the temperature of 1173–1223 K. The reaction
is described as the follows [19]:
CaCO3 ! CaO þ CO2� 170 kJ=mol (4)
3.2. Hematite reduced by solid carbon
When a mixture of hematite (Fe2O3) and solid carbon is
heated up to the certain temperature, the hematite is reduced
into wustite (FeO) at an extremely high rate through two conse-
cutive steps, namely hematite! magnetite (Fe3O4)! wustite,
J. Zhang et al. / Applied Surface Science 253 (2007) 3083–3092 3085
like Fe2O3(s) + C(s)! 2FeO(s) + CO [20]. Then, two coupled
gas–solid reactions take place,
FeO þ CO ! Fe þ CO2 (5)
CO2þC ! 2CO (6)
It is known that reaction (5) is catalyzed by the reduced metallic
iron. More carbon monoxide (CO) produced in the vicinity of
FeO increases the reduction rate of FeO.
If the molten hematite is reduced by solid carbon, the
reduction rate rises rapidly. This is termed a smelting reduction.
The possible reason is that the molten FeO can more easily
contact carbon than solid FeO [21]. The weight volume of FeO is
proportional to its reduction rate by solid carbon due to the
increased interface area between FeO and carbon [22]. Also, CaO
even at the low concentration can significantly expedite this
reduction reaction [20]. The catalysis results from the enhanced
formation rate of CO through the following redox process:
CaO þ CO2 ! CaO � O þ CO (7)
CaO � O þ C ! CaO þ CO (8)
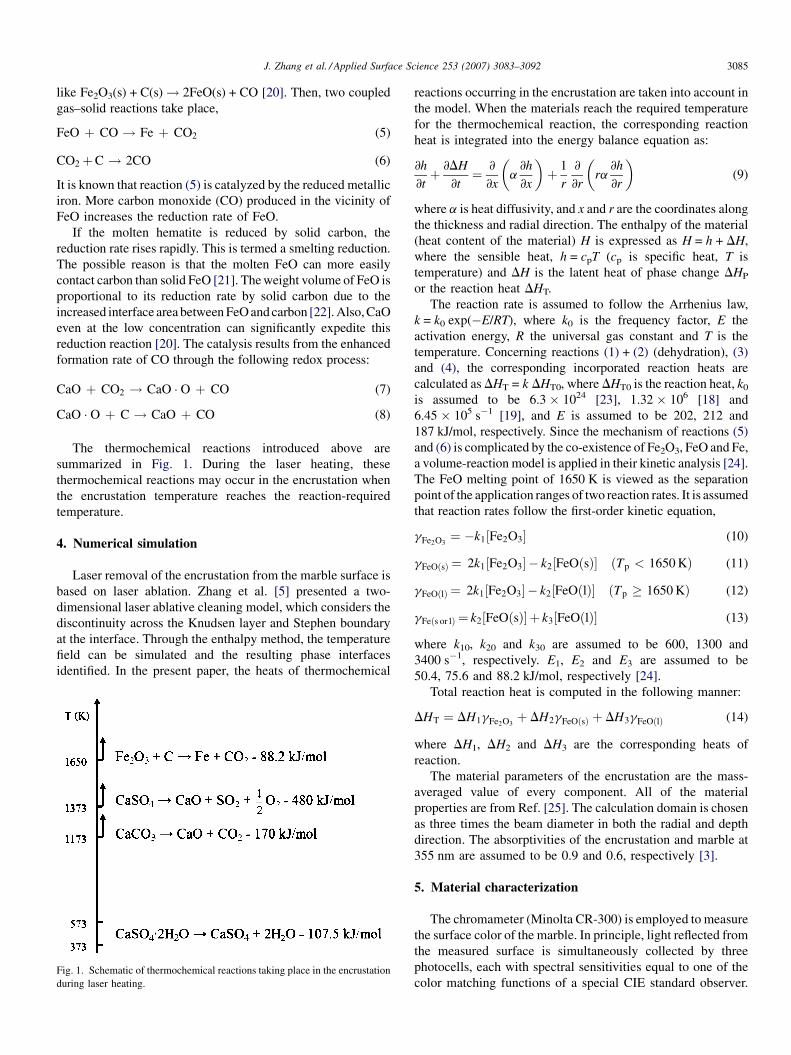
The thermochemical reactions introduced above are
summarized in Fig. 1. During the laser heating, these
thermochemical reactions may occur in the encrustation when
the encrustation temperature reaches the reaction-required
temperature.
4. Numerical simulation
Laser removal of the encrustation from the marble surface is
based on laser ablation. Zhang et al. [5] presented a two-
dimensional laser ablative cleaning model, which considers the
discontinuity across the Knudsen layer and Stephen boundary
at the interface. Through the enthalpy method, the temperature
field can be simulated and the resulting phase interfaces
identified. In the present paper, the heats of thermochemical
Fig. 1. Schematic of thermochemical reactions taking place in the encrustation
during laser heating.
reactions occurring in the encrustation are taken into account in
the model. When the materials reach the required temperature
for the thermochemical reaction, the corresponding reaction
heat is integrated into the energy balance equation as:
@h
@tþ @DH
@t¼ @
@x
�a
@h
@x
�þ 1
r
@
@r
�ra
@h
@r
�(9)
where a is heat diffusivity, and x and r are the coordinates along
the thickness and radial direction. The enthalpy of the material
(heat content of the material) H is expressed as H = h + DH,
where the sensible heat, h = cpT (cp is specific heat, T is
temperature) and DH is the latent heat of phase change DHP
or the reaction heat DHT.
The reaction rate is assumed to follow the Arrhenius law,
k = k0 exp(�E/RT), where k0 is the frequency factor, E the
activation energy, R the universal gas constant and T is the
temperature. Concerning reactions (1) + (2) (dehydration), (3)
and (4), the corresponding incorporated reaction heats are
calculated as DHT = k DHT0, where DHT0 is the reaction heat, k0
is assumed to be 6.3 � 1024 [23], 1.32 � 106 [18] and
6.45 � 105 s�1 [19], and E is assumed to be 202, 212 and
187 kJ/mol, respectively. Since the mechanism of reactions (5)
and (6) is complicated by the co-existence of Fe2O3, FeO and Fe,
a volume-reaction model is applied in their kinetic analysis [24].
The FeO melting point of 1650 K is viewed as the separation
point of the application ranges of two reaction rates. It is assumed
that reaction rates follow the first-order kinetic equation,
gFe2O3¼ �k1½Fe2O3� (10)
gFeOðsÞ ¼ 2k1½Fe2O3� � k2½FeOðsÞ� ðTp < 1650 KÞ (11)
gFeOðlÞ ¼ 2k1½Fe2O3� � k2½FeOðlÞ� ðTp � 1650 KÞ (12)
gFeðs or lÞ ¼ k2½FeOðsÞ� þ k3½FeOðlÞ� (13)
where k10, k20 and k30 are assumed to be 600, 1300 and
3400 s�1, respectively. E1, E2 and E3 are assumed to be
50.4, 75.6 and 88.2 kJ/mol, respectively [24].
Total reaction heat is computed in the following manner:
DHT ¼ DH1gFe2O3þ DH2gFeOðsÞ þ DH3gFeOðlÞ (14)
where DH1, DH2 and DH3 are the corresponding heats of
reaction.
The material parameters of the encrustation are the mass-
averaged value of every component. All of the material
properties are from Ref. [25]. The calculation domain is chosen
as three times the beam diameter in both the radial and depth
direction. The absorptivities of the encrustation and marble at
355 nm are assumed to be 0.9 and 0.6, respectively [3].
5. Material characterization
The chromameter (Minolta CR-300) is employed to measure
the surface color of the marble. In principle, light reflected from
the measured surface is simultaneously collected by three
photocells, each with spectral sensitivities equal to one of the
color matching functions of a special CIE standard observer.

J. Zhang et al. / Applied Surface Science 253 (2007) 3083–30923086
Fig. 2. Schematic of a 1976 CIE L*a*b* color system.
Fig. 3. Raman spectrum and image of white Carrara marble (Raman shifts are
excited by the 514 nm laser).
The CR-300 has a measurement spot diameter of 8 mm and use
D56 standard xenon light to irradiate the surface. The color
measurements are expressed in the perceptually uniform color
space, CIE L*a*b* (CIELAB), shown in Fig. 2. The L* axis is
known as the lightness ranging from 0 (black) to 100 (white).
The a* axis and b* axis represent redness-greenness and
yellowness-blueness, respectively. Total color difference DE�ab
is defined as DE�ab ¼ffiffiffiffiffiffiffiffiffiffiffiffiffiffiffiffiffiffiffiffiffiffiffiffiffiffiffiffiffiffiffiffiffiffiffiffiffiffiffiffiffiffiffiffiffiffiffiffiffiffiffiffiðDL�Þ2 þ ðDa�Þ2 þ ðDb�Þ2
q, where
DL� ¼ L� � L�t describes the lightness change, Da� ¼ a� �a�t and Db� ¼ b� � b�t describe the chromaticity change, L�t , a�tand b�t are values of reference white [26].
Surface enhanced Raman spectroscopy (SERS) is used to
identify the chemical constituents of the marble surface [27].
When the surface is illuminated by a laser photon, a second
photon is scattered. This photon differs in energy from the
incipient photon by an energy difference in the levels of the
surface constituents. The resulting Raman shift reveals structural
information, as well as serving as an analytical tool to identify
specific molecular adsorbents. The Raman signals from the
surface may be greatly enhanced by application of silver colloid
particles on the surface. Raman spectra are excited using a
514 nm CW Argon-ion laser (Spectra-Physics model 2020) at a
power of approximately 20 mW. The scattered lines are collected
at 908 with a Spex model 1401 double monochromator
(resolution ca. 2 cm�1) and detected by an ITT FW-130
photomultiplier (PM) tube with Raman 2005 (software package).
Scanning Electron Microscopy (JEOL) and Scanner (HP
Scanjet 5100C) are employed to take the images of cleaned
marble surface, respectively. In the case of SEM, the marble
surface is coated with silver so that it is electrically conductive.
6. Results and discussions
6.1. Determination of fluence threshold
Successful cleaning is defined as the complete removal of
the encrustation without any change of the marble surface in the
integrity, structure and color. To experimentally determine the
fluence threshold, the sample is irradiated by a single pulse per
location. The fluence is continuously increased. When the
damage of the encrustation including 5% hematite or the
marble is noticeable under the optical microscope, the
corresponding fluence values are considered as the thresholds.
The experimentally determined thresholds for the encrustation
and the marble are 0.45 and 2.5 J/cm2, respectively.
In order to estimate the accuracy of the proposed numerical
model, the fluence threshold is also determined with this model.
At 50 ns, the fluence increasing the encrustation surface to the
mass-averaged value of the graphite vaporization temperature,
the decomposition temperature of hematite and gypsum,
namely 2160 K, is considered as its threshold. Similarly, the
fluence heating the marble surface to the decomposition
temperature of calcite is the threshold for the marble. In Fig. 3,
the Raman spectrum of the marble has four bands of CaCO3 at
158, 285, 711 and 1084 cm�1 [28]. It is evident that the
principal ingredient of the marble is CaCO3.

J. Zhang et al. / Applied Surface Science 253 (2007) 3083–3092 3087
Fig. 4. Images and color measurements of the marble surface before and after the removal of the encrustation with different fluence levels.
The numerically determined thresholds are 0.3 and 1.8 J/cm2
for the encrustation and the marble, respectively. If the model
does not include the thermochemical reaction heat, the
determined threshold is 0.12 and 0.42 J/cm2 for the encrustation
and the marble, respectively. The thresholds determined by the
model with the reaction heat are more close to the experimental
ones, which shows this model is accurate to some extent. The
slight overestimate of the model in the ablation effect is possibly
because that the heat taken away by the released gases produced
in the thermochemical reactions is neglected in the model. Both
the experimental and numerical results demonstrate that the
threshold difference between the encrustation and the marble is
large. This provides marble cleaning at 355 nm, which is self-
limiting, thereby avoiding damage to the marble substrate.
6.2. Effect of fluence levels
6.2.1. Experiments
Under the multiple-pulse strategy, the applied laser fluence
should be higher than the encrustation threshold of 0.45 J/cm2
and lower than the marble threshold of 2.5 J/cm2. Here, the
laser fluence is chosen as 0.67 and 1.3 J/cm2, respectively.
Considering the chromameter measurement spot diameter of
8 mm, a circular encrustation area with the diameter of 9 mm is
removed. The laser pulses irradiate the encrustation along the
circular orbits from the outside to the inside. The pulses have
the overlapping rate of 50% to reduce the effect of the Gaussian
beam on the irradiation results.
The samples with the encrustation containing 5% hematite
are employed in the experiments. Fig. 4(a and b) are the
Table 1
Color measurements
Original marble Encrustation Marble cleaned by 8
pulses at F = 0.67 J/cm2
DL* 90.8433 59.39 84.2767
Da* �1.0333 11.2167 �0.20333
Db* �0.94 13.9633 1.89333
DL*: lightness; Da*: red-green; Db*: blue-yellow.
scanned images of the marble cleaned by eight pulses at 0.67 J/
cm2 and five pulses at 1.3 J/cm2, respectively. The color
measurements of the original and cleaned marble surface as
well as the encrustation are listed in Table 1. In Fig. 4(c), the
color measurements are shown in the 1971 CIE L*a*b* color
space. All of color data is the average of five independent
measurements.
Compared with the original marble surface, the lightness of
the encrustation is much lower, which indicates the black
appearance of the encrustation due to the graphite. The positive
values of Da* and Db* denote the encrustation color is inclined
to the redness and yellowness owing to the dark-brown hematite
in the encrustation.
The lightness of both cleaned marble surfaces are very close
to the original ones, which implies the removal of the
encrustation. However, the lightness difference between the
cleaned and the original surfaces is larger in the case of 0.67 J/
cm2. This reflects the encrustation may not be completely
removed. At 1.3 J/cm2, both of Da* and Db* are close to the
original values and have the same sign. It can be concluded that
there is no color variation. At 0.67 J/cm2, Da* is close to the
original one and has the same sign. However, Db* has a positive
sign, which means the surface is becoming slightly yellowed.
This phenomenon is referred to as the discoloration of the
marble surface.
The Raman spectra of two cleaned surfaces are shown in
Fig. 5. The spectrum of the surface irradiated at 1.3 J/cm2 only
shows bands of CaCO3 at 158, 285, 711 and 1084 cm�1. Yet,
the spectrum of the surface irradiated at 0.67 J/cm2 consists of
bands of CaCO3 as well as additional bands of Fe2O3 at 224 and
Original marble Encrustation Marble cleaned by 5
pulses at F = 1.3 J/cm2
88.2367 59.39 86.1133
�1.19 11.2167 �0.58333
�0.8967 13.9633 �0.0333

J. Zhang et al. / Applied Surface Science 253 (2007) 3083–30923088
Fig. 5. Raman spectrum of marble surface after the removal of the encrustation
with different fluence levels (Raman shifts are excited by 514 nm laser at a
power of 20 mW, the green line has an upward shift of 300 for the clarity).
Fig. 6. SEM images of marble surface after the removal of the encrusta
Fig. 7. Simulated time history of temperature distribution in the encrustation produ
pulse at 0.67 J/cm2 at the end of pulse duration 50 ns.
405 cm�1 [29]. The CaCO3 bands in two spectra indicate the
marble surfaces are exposed after the removal of the
encrustation. The Fe2O3 bands reflect Fe2O3 still resides on
the surface irradiated at 0.67 J/cm2. Thus, it could be deduced
that the presence of Fe2O3 is related to the surface
discoloration. Very small amounts of Fe2O3 on the white
calcite surface may result in a yellow shift [30]. The SEM
pictures of these two cleaned marble surfaces are shown in
Fig. 6. Some particles are on the surface cleaned at 0.67 J/cm2.
The surface cleaned at 1.3 J/cm2 is fairly clean.
6.2.2. Analysis of the discoloration mechanism
6.2.2.1. The hematite reduced by the graphite. Fig. 7 shows
the simulated history of temperature distribution in the
encrustation produced at 1.3 J/cm2 and the temperature
distribution at 50 ns induced by the fluence of 0.67 J/cm2.
Fe2O3 and FeO in the grey area are in the molten state due to the
temperature ranging between the melting point of Fe2O3
tion with different fluence levels: (a) 0.67 J/cm2 and (b) 1.3 J/cm2.
ced by the pulse at 1.3 J/cm2 and the temperature distribution produced by the
J. Zhang et al. / Applied Surface Science 253 (2007) 3083–3092 3089
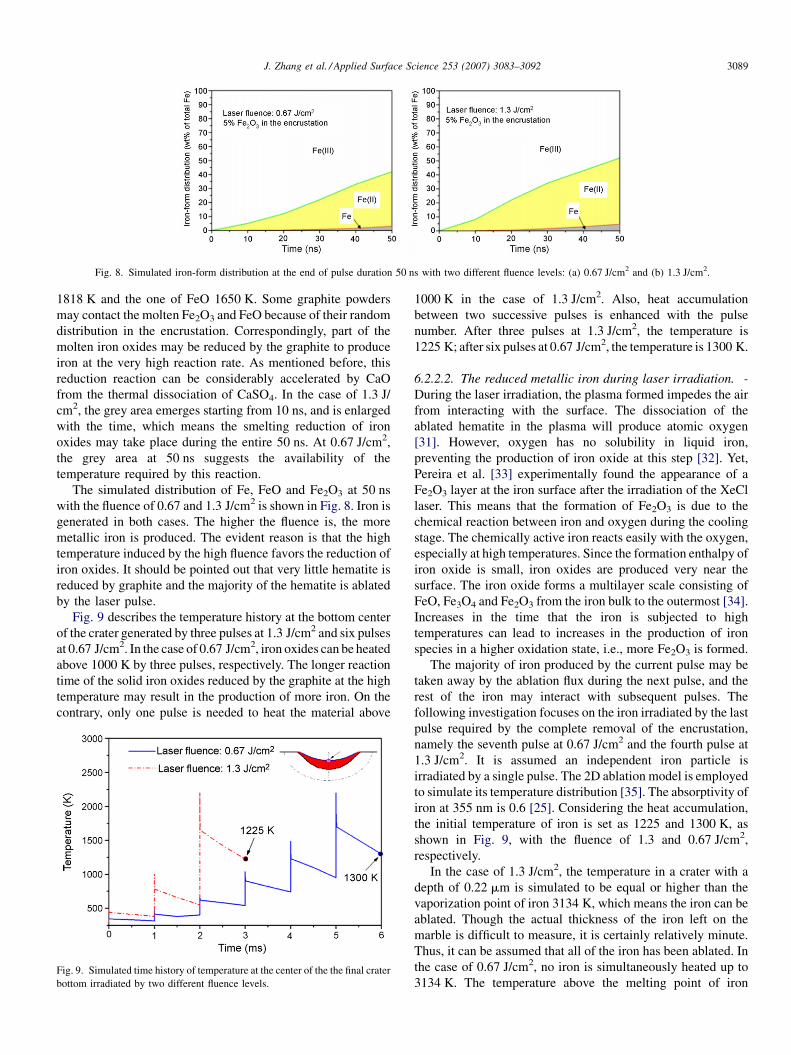
Fig. 8. Simulated iron-form distribution at the end of pulse duration 50 ns with two different fluence levels: (a) 0.67 J/cm2 and (b) 1.3 J/cm2.
1818 K and the one of FeO 1650 K. Some graphite powders
may contact the molten Fe2O3 and FeO because of their random
distribution in the encrustation. Correspondingly, part of the
molten iron oxides may be reduced by the graphite to produce
iron at the very high reaction rate. As mentioned before, this
reduction reaction can be considerably accelerated by CaO
from the thermal dissociation of CaSO4. In the case of 1.3 J/
cm2, the grey area emerges starting from 10 ns, and is enlarged
with the time, which means the smelting reduction of iron
oxides may take place during the entire 50 ns. At 0.67 J/cm2,
the grey area at 50 ns suggests the availability of the
temperature required by this reaction.
The simulated distribution of Fe, FeO and Fe2O3 at 50 ns
with the fluence of 0.67 and 1.3 J/cm2 is shown in Fig. 8. Iron is
generated in both cases. The higher the fluence is, the more
metallic iron is produced. The evident reason is that the high
temperature induced by the high fluence favors the reduction of
iron oxides. It should be pointed out that very little hematite is
reduced by graphite and the majority of the hematite is ablated
by the laser pulse.
Fig. 9 describes the temperature history at the bottom center
of the crater generated by three pulses at 1.3 J/cm2 and six pulses
at 0.67 J/cm2. In the case of 0.67 J/cm2, iron oxides can be heated
above 1000 K by three pulses, respectively. The longer reaction
time of the solid iron oxides reduced by the graphite at the high
temperature may result in the production of more iron. On the
contrary, only one pulse is needed to heat the material above
Fig. 9. Simulated time history of temperature at the center of the the final crater
bottom irradiated by two different fluence levels.
1000 K in the case of 1.3 J/cm2. Also, heat accumulation
between two successive pulses is enhanced with the pulse
number. After three pulses at 1.3 J/cm2, the temperature is
1225 K; after six pulses at 0.67 J/cm2, the temperature is 1300 K.
6.2.2.2. The reduced metallic iron during laser irradiation. -
During the laser irradiation, the plasma formed impedes the air
from interacting with the surface. The dissociation of the
ablated hematite in the plasma will produce atomic oxygen
[31]. However, oxygen has no solubility in liquid iron,
preventing the production of iron oxide at this step [32]. Yet,
Pereira et al. [33] experimentally found the appearance of a
Fe2O3 layer at the iron surface after the irradiation of the XeCl
laser. This means that the formation of Fe2O3 is due to the
chemical reaction between iron and oxygen during the cooling
stage. The chemically active iron reacts easily with the oxygen,
especially at high temperatures. Since the formation enthalpy of
iron oxide is small, iron oxides are produced very near the
surface. The iron oxide forms a multilayer scale consisting of
FeO, Fe3O4 and Fe2O3 from the iron bulk to the outermost [34].
Increases in the time that the iron is subjected to high
temperatures can lead to increases in the production of iron
species in a higher oxidation state, i.e., more Fe2O3 is formed.
The majority of iron produced by the current pulse may be
taken away by the ablation flux during the next pulse, and the
rest of the iron may interact with subsequent pulses. The
following investigation focuses on the iron irradiated by the last
pulse required by the complete removal of the encrustation,
namely the seventh pulse at 0.67 J/cm2 and the fourth pulse at
1.3 J/cm2. It is assumed an independent iron particle is
irradiated by a single pulse. The 2D ablation model is employed
to simulate its temperature distribution [35]. The absorptivity of
iron at 355 nm is 0.6 [25]. Considering the heat accumulation,
the initial temperature of iron is set as 1225 and 1300 K, as
shown in Fig. 9, with the fluence of 1.3 and 0.67 J/cm2,
respectively.
In the case of 1.3 J/cm2, the temperature in a crater with a
depth of 0.22 mm is simulated to be equal or higher than the
vaporization point of iron 3134 K, which means the iron can be
ablated. Though the actual thickness of the iron left on the
marble is difficult to measure, it is certainly relatively minute.
Thus, it can be assumed that all of the iron has been ablated. In
the case of 0.67 J/cm2, no iron is simultaneously heated up to
3134 K. The temperature above the melting point of iron

J. Zhang et al. / Applied Surface Science 253 (2007) 3083–30923090
Fig. 10. Simulated temperature history of the points on the iron corresponding
to the beam center under the fluence of 0.67 J/cm2.Fig. 11. Raman spectrum of marble surface after the removal of the encrusta-
tion without the graphite with different laser fluence levels (Raman shifts are
exited by the 514 nm CW laser at a power of 20 mW, the green line has an
upward shift of 300 for the clarity).
(1811 K) is in the crater with the depth of 0.4 mm. Thus, theiron is assumed to be just melted.
The simulated temperature history of the points correspond-
ing to the beam center at the different depths in the case of
0.67 J/cm2 is shown in Fig. 10. It is apparent that the peak
temperature is generated at the end of the pulse. The iron could
be oxidized during its cooling period of approximately 1 s. Due
to the high temperature in the very shallow iron, the iron oxides
are in the form of Fe2O3. This newly formed Fe2O3 may stay at
the porous structure of the marble surface because the molten
iron may penetrate it during laser irradiation. As extra pulses
are incident on the marble, the marble surface temperature is
raised very slightly due to its low absorptivity. At this time, the
hematite is heated mainly through heat conduction from the
marble. Thus, the temperature of hematite may be much lower
than its vaporization temperature.
6.3. Effect of graphite
Without graphite, the encrustation consists of 5% hematite
and 95% gypsum. The encrustation is irradiated by eight pulses
Table 2
Color measurements
Original marble Encrustation Marble cleaned by 8
pulses at F = 0.67 J/cm2
DL* 86.5633 66.8067 85.09
Da* �1.2933 20.6333 �0.8
Db* �0.7633 10.9733 �0.21
DL*: lightness; Da*: red-green; Db*: blue-yellow.
Table 3
Color measurements
Original marble Encrustation Marble cleaned by 8
pulses at F = 0.67 J/cm2
DL* 89.3667 57.4067 82.0667
Da* �1.3067 19.0167 �0.49667
Db* �1.79 13.4667 2.99333
DL*: lightness; Da*: red-green; Db*: blue-yellow.
at 0.67 J/cm2 and five pulses at 1.3 J/cm2, respectively. The
color of original and cleaned marble surfaces as well as the
encrustation are measured and listed in Table 2, respectively.
In the case of two fluence levels, the lightness of cleaned
surface is very close to its corresponding original value.
Meanwhile, two lightness differences between the cleaned and
the original surface are almost equal. This probably means the
encrustation is completely removed in both cases. Both of Da*
and Db* values are also close to the original ones, and the signs
are identical. So, it can be concluded that there is no color
variation on the marble surface cleaned at 0.67 and 1.3 J/cm2.
The Raman spectra measured on these two cleaned surfaces are
shown in Fig. 11. Both of the Raman spectra are characterized
with the bands of CaCO3 (158, 285, 711 and 1084 cm�1). No
Fe2O3 bands at 224 and 405 cm�1 appear. This indicates no
Fe2O3 exists on two cleaned marble surfaces. Without the
graphite, the hematite in the encrustation is just heated, and
then ablated. This group of experiments indirectly verifies that
Original marble Encrustation Marble cleaned by 5
pulses at F = 1.3 J/cm2
87.0067 66.8067 85.67
�1.057 20.6333 �0.25
�0.85 10.9733 �0.1933
Original marble Encrustation Marble cleaned by 5
pulses at F = 1.3 J/cm2
88.2867 57.4067 86.51
�1.2833 19.0167 �0.68933
�1.0533 13.4667 0.03

J. Zhang et al. / Applied Surface Science 253 (2007) 3083–3092 3091
Fig. 13. Simulated temperature distribution in the encrustation produced by a
1064 nm laser pulse with the fluence of 0.5 J/cm2 at the end of pulse duration
7 ns.
hematite is reduced by the graphite to produce iron during laser
irradiation.
6.4. Effect of volume weight of hematite
Marble samples are covered with the encrustation containing
10% hematite, 20% graphite and 70% gypsum. These samples
are also irradiated by eight pulses at 0.67 J/cm2 and five pulses
at 1.3 J/cm2, respectively. Table 3 lists the color measurements
of original and cleaned marble surfaces as well as the
encrustation, respectively.
The color variation of the surfaces cleaned at 0.67 and 1.3 J/
cm2 is similar to the corresponding color measurements shown
in Section 6.2.1. The only difference is the value of Db* after the
irradiation of the pulse at 0.67 J/cm2. It further shifts towards
the positive direction, which means the yellowing of the
cleaned surface is aggravated.
Fig. 12 shows the Raman spectra collected from these two
cleaned surfaces. Both samples have the CaCO3 bands of 158,
285, 711 and 1084 cm�1. Only the sample irradiated at 0.67 J/
cm2 shows the Fe2O3 bands of 224 and 405 cm�1, which
indicates the presence of Fe2O3 on the marble surface irradiated
at 0.67 J/cm2.
The increased yellowing shift is probably due to the high
volume weight of hematite in the encrustation. Lee et al. [22]
found that the reduction rate of hematite by graphite rises with
the weight of hematite owing to the augmentation of the
interface area between hematite and graphite. Therefore,
increased iron production results in an increase in the formation
of iron oxides. Such experimental results indicate the
occurrence of the thermochemical reaction to some extent.
6.5. Analysis of severe yellowing of marble at 1064 nm
In order to explain the severe yellowing of marble cleaned at
1064 nm with the proposed mechanism, the experimental
parameters applied in Ref. [14] are adopted in the following
Fig. 12. Raman spectrum of marble surface after the removal of the encrusta-
tion with 10% hematite with different laser fluence levels (Raman shifts are
excited by the 514 nm CW laser at a power of 20 mW, the green line has an
upward shift of 300 for the clarity).
analysis. The artificial encrustation contains 20% graphite, 20%
hematite and 60% gypsum. The encrustation is removed by 10
or 20 pulses at 0.5 J/cm2. The pulse duration is 7 ns, and the
repetition rate is 2 Hz. In the simulation, the beam size is
assumed to be 100 mm in diameter, and the encrustation
thickness is 120 mm. The properties of the encrustation are
recalculated based on the new ratio of the ingredients.
Fig. 13 shows the simulated temperature distribution in the
encrustation generated with a fluence of 0.5 J/cm2 at 7 ns. The
ablation temperature of this encrustation is assumed to be
2250 K. Clearly, the temperature in part of the encrustation is in
the range from 1818 K (melting point of Fe2O3) to 1650 K
(melting point of FeO). The smelting reduction of hematite by
graphite may take place to form the iron in this area.
Whether iron can be ablated by the last applied pulse in the
experiment is related to the final presence of iron on the surface.
Therefore, an independent iron particle is assumed to be
irradiated by the 10th pulse and the 20th pulse at 0.5 J/cm2,
respectively. The absorptivity of iron at 1064 nm is around 0.31
[25]. Similarly, the initial temperature of iron is numerically
calculated to be 700 and 1150 K in the case of the 10th pulse
Fig. 14. Simulated temperature history of the point on the iron corresponding to
the beam center by the 1064 nm laser pulses.

J. Zhang et al. / Applied Surface Science 253 (2007) 3083–30923092
and the 20th pulse, respectively. The simulated temperature
history of the point corresponding to the beam center at the iron
surface is shown in Fig. 14. In both cases, the peak temperature is
lower than the vaporization temperature of iron 3134 K, which
means iron cannot be ablated, just melted. After the pulse is over,
the iron requires almost 1 s to cool. Then, the oxygen can react
with the high temperature iron to form iron oxides. Hence, the
marble surface becomes yellowed. The severe yellowing at
1064 nm may result from the generation of more iron oxide. The
marble absorptivity at 1064 nm is only 0.25 [3]. However, the
marble absorptivity at 355 nm is slightly higher. The marble-
absorbed heat may be helpful in increasing the temperature of the
iron to its vaporization point, and hence reducing the amount of
the remaining iron and then iron oxide in the case of 355 nm.
7. Conclusions
The fluence levels affect the surface color of marble after the
removal of the encrustation by 355 nm laser pulses. During
laser irradiation, some hematite is reduced by the graphite to
produce iron. High fluence can ablate the iron, but the low
fluence just makes the iron melt and remain on the marble. The
remaining iron is oxidized by the air right after the laser
irradiation. The generated iron oxides are responsible for the
light discoloration of the marble surface cleaned with the low
fluence. The laser-induced temperature field is calculated with a
two-dimensional laser ablative cleaning model including the
reaction heat to analyze the kinetics of the thermochemical
reactions. With the low fluence, the removal of the encrustation
without the graphite does not cause any discoloration to the
marble, which indirectly verifies the occurrence of the
reduction reaction of hematite by graphite. The higher the
volume weight of hematite in the encrustation, the more yellow
the marble surface cleaned at low fluence level becomes, which
implies an increase in the volume weight of hematite increases
the reduction rate of hematite, and then produces more iron.
The severe discoloration of marble cleaned at 1064 nm is due to
the inability to ablate the iron produced in the reduction of
hematite based on the numerical analysis.
Acknowledgements
The authors are grateful to Dr. Mohammad Athar of
Columbia University for his permission to access the
chromameter. The authors thank Mr. Justin Rasso for his
technical assistance during the measurements.
References
[1] T. Skoulikidis, D. Charalambous, Br. Corros. J. 16 (1981) 49.
[2] P.S. Griffin, N. Indictor, R.J. Koestler, Int. Biodeterior. 28 (1991) 187.
[3] M. Cooper, Laser Cleaning in Conservation: An Introduction, Butter-
worth-Heinemann, 1998.
[4] A.C. Tam, W.P. Leung, W. Zapka, W. Ziemlih, J. Appl. Phys. 71 (7) (1992)
3515.
[5] J. Zhang, Y.W. Wang, P. Cheng, Y.L. Yao, J. Appl. Phys. 99 (6) (2006)
064902.
[6] J.F. Asmus, W. Munk, C. Murphy, Proc. Soc. Photo-Opt. Instrum. 41
(1974) 19.
[7] M. Laboure, P. Bromblet, G. Orial, G. Wiedemann, C. Simon-Boisson, J.
Cult. Herit. 1 (2000) s21.
[8] S. Siano, F. Margheri, R. Pini, P. Mazzinghi, R. Salimbeni, Appl. Opt. 36
(27) (1997) 7073.
[9] S. Siano, F. Fabiani, R. Pini, R. Salimbeni, M. Giamello, G. Sabatini, J.
Cult. Herit. 1 (2000) s47.
[10] P. Maravelaki, V. Zafiropulos, V. Kilikoglou, M. Kalaitzaki, C. Fotakis,
Spectrochim. Acta Part B 52 (1997) 41.
[11] C. Rodriguez-Navarro, A. Rodriguez-Navarro, K. Elert, E. Sebastian, J.
Appl. Phys. 95 (7) (2004) 3350.
[12] P. Maravelaki-Kalaitzaki, V. Zafiropulos, C. Fotakis, Appl. Surf. Sci. 148
(1999) 92.
[13] G. Marakis, P. Pouli, V. Zafiropulos, P. Maravelaki-Kalaitzaki, J. Cult.
Herit. 4 (2003) 83s.
[14] S. Klein, F. Fekrsanati, J. Hildenhagen, K. Dickmann, H. Uphoff, Y.
Marakis, V. Zafiropulos, Appl. Surf. Sci. 171 (2001) 242.
[15] S. Potgieter-Vermaak, R. Godoi, R. Grieken, J. Potgieter, M. Oujja, M.
Castillejo, Spectrochim. Acta Part A 61 (2005) 2460.
[16] V. Zafiropulos, C. Balas, A. Manousaki, Y. Marakis, P. Maravelaki-
Kalaitzaki, K. Melesanaki, P. Pouli, T. Stratoudaki, S. Klein, J. Hildenha-
gen, K. Dickmann, B. Luk’Yanchuk, C. Mujat, A. Dogariu, J. Cult. Herit.
4 (2003) 249s.
[17] J.R. Mehaffey, P. Cuerrier, G. Carisse, Fire Mater. 18 (1994) 297.
[18] A. Fuertes, M. Fernandez, Trans. IchemE 73 (Part A) (1995) 854.
[19] W. Lipinski, A. Steinfeld, Int. J. Heat Mass Trans. 47 (2004) 1907.
[20] S.B. Jagtap, A.R. Pande, A.N. Gokarn, J. Chem. Eng. Jpn. 25 (1) (1991) 6.
[21] A. Sato, G. Aragane, K. Kamihara, S. Yoshimatsu, Tetsu-to-Hagane 73
(1987) 812.
[22] J. Lee, D. Min, S. Kim, Metall. Mater. Trans. B 28B (1997) 1019.
[23] D. Fatu, J. Therm. Anal. Calorim. 65 (2001) 213.
[24] K. Sugawara, K. Morimoto, T. Sugawara, AIChE J. 45 (3) (1999) 574.
[25] D.R. Lide, CRC Handbook of Chemistry and Physics, CRC Press, Boca
Raton, FL, 2004.
[26] R. Berns, Billmeyer and Saltzman’s Principles of Color Technology, John
Wiley & Sons Inc., New York, 2000.
[27] R.L. Birke, T.H. Lu, J.R. Lombardi, in: R. Varma, J.R. Selman (Eds.),
Techniques for Characterization of Electrodes and Electrochemical Pro-
cesses, John Wiley & Sons, NY, 1991, p. 211.
[28] M. Prencipe, F. Pascale, C. Zicovich-Wilson, V. Saunders, R. Orlando, R.
Dovesi, Phys. Chem. Miner. 31 (2004) 559.
[29] D. Faria, S. Silva, M. Oliveira, J. Raman Spectrosc. 28 (1997) 873.
[30] V. Barro’n, J. Torrent, J. Soil Sci. 37 (1986) 499.
[31] A. Pereira, P. Delaporte, M. Sentis, A. Cros, W. Marine, A. Basillais, A.
Thomann, C. Leborgne, N. Semmar, P. Andreazza, T. Sauvage, Thin Solid
Films 453–454 (2004) 16.
[32] P. Schaaf, M. Han, K. Lieb, E. Carpene, Appl. Phys. Lett. 80 (6) (2002)
1091.
[33] A. Pereira, A. Cros, P. Delaporte, W. Marine, M. Sentis, Appl. Surf. Sci.
197–198 (2002) 845.
[34] A.S. Khanna, Introduction to High Temperature Oxidation and Corrosion,
ASM International, Materials Park, 2002.
[35] W.W. Zhang, Y.L. Yao, K. Chen, Int. J. Adv. Manuf. Technol. 18 (2001)
323.