effectiveness and limitation of coastal dykes in jakarta ... · sunda kelapa port is already below...
TRANSCRIPT
sustainability
Article
Effectiveness and Limitation of Coastal Dykes inJakarta: The Need for Prioritizing Actions againstLand Subsidence
Hiroshi Takagi 1,*, Daisuke Fujii 1, Miguel Esteban 2 and Xiong Yi 1
1 School of Environment and Society, Tokyo Institute of Technology, Tokyo 152-8550, Japan;[email protected] (D.F.); [email protected] (X.Y.)
2 Graduate School of Frontier Sciences, University of Tokyo, Chiba 277-8563, Japan; [email protected]* Correspondence: [email protected]
Academic Editor: Tan YigitcanlarReceived: 22 February 2017; Accepted: 14 April 2017; Published: 16 April 2017
Abstract: Jakarta has been experiencing severe land subsidence over the last few decades.A questionnaire survey of local inhabitants revealed that seawater is already overtopping coastaldykes and flooding a vulnerable community along Jakarta’s waterfront. The present study projectscoastal floods around Jakarta until the year 2050 to understand the long term effectiveness of proposeddykes under continuing rapid land subsidence scenarios. This is done through a hydrodynamic modelthat considers land subsidence, sea-level rise, and tides. The analysis confirms that, if high enough,coastal dykes will help to prevent flooding, though their effectiveness will eventually disappear asland subsidence continues. For example, a 3-m dyke, which is expected to be sufficiently high tocope with present-day conditions, could completely lose its ability to stop floods by the year 2040.Moreover, higher dykes can also bring about other problems, because if they are overtopped, theyactually prolong flooding, essentially trapping a higher volume of water inland. On the other hand,a small 1-m dyke can be expected to stop coastal floods if land subsidence can be stopped. Thisstudy demonstrates that actions to stop land subsidence would be the most effective countermeasureto mitigate coastal floods from the middle of the 21st century onwards, emphasizing the need toprioritize such actions among the range of countermeasures being proposed for Jakarta.
Keywords: Jakarta; land subsidence; sea-level rise; coastal flood projection; coastal dykes;questionnaire survey; pumping stations
1. Introduction
Jakarta is one of the largest coastal megacities in the world, with a total population of over10 million inhabitants. Although it has been facing many urban development issues [1], land subsidenceappears to currently pose one of the biggest challenges to its long-term ability to sustain humansettlement. Subsidence rates along the coast of Jakarta ranged from 9.5 to 21.5 cm/year for the 2007to 2009 period [2]. The current pace of subsidence in Jakarta appears to be the fastest amongst largeAsian cities, including cities such as Tokyo, Bangkok, Hanoi, and Can Tho [3–6]. The soil in Jakarta’scoast consists primarily of thick unconsolidated layers of clay and silt, partially filled with sand, upto a depth of about 300 m [7]. Land subsidence has been mainly caused by the formally prohibitedpractice of extracting groundwater for industrial usage, and has led to severe damage to infrastructureand buildings, increasing the extent of flooded areas [8,9]. As a result, Jakarta is considered to be oneof the most vulnerable cities in the world to coastal floods [10]. At present, large portions of the coastalarea are barely above sea water (see Figure 1a, showing how Sunda Kelapa port, where the level of thewater is already higher than the ground behind the narrow kerb/dyke that protects the port area from
Sustainability 2017, 9, 619; doi:10.3390/su9040619 www.mdpi.com/journal/sustainability

Sustainability 2017, 9, 619 2 of 15
getting flooded), or are already below seawater (the Pluit area is already protected by a dyke whichsurpasses the average height of an adult, about 1.8 m high, see Figure 1b). If groundwater extractioncontinues at the current rate, Jakarta is likely to sink a further 5–6 m by 2100 [11], which would requirecoastal dykes to be built around the entire coastal perimeter of the city or people to be relocatedaway from these areas. Thus, the National Capital Integrated Coastal Development (NCICD) [7]has urged Jakarta’s policy makers to prioritize solving the issue of land-subsidence as quickly aspossible. If effective countermeasures to mitigate subsidence are not undertaken, future flood eventswill inevitably cause greater damage to Jakarta than what can be expected at present, especially giventhe increase in future exposure due to rapid economic and population growth. The potential areas atrisk of being flooded in Jakarta are expected to drastically increase in the next decades, with subsidencebeing responsible for 88% of this increase [12]. However, the flood projection by Takagi et al. [12] wasderived through a simulation that neglects the presence of coastal dykes, essentially investigating thepotential flood extent without taking into account mitigation countermeasures against coastal floods.This assumption may cause an overestimation of the possible future impacts of flooding, at a timewhen the government of Jakarta has upgraded coastal protection in the area into a national project,as described later. In order to predict more realistic coastal floods until the year 2050, the authorsdeveloped a coastal hydrodynamic model that focused on the city of Jakarta. The aim of this modelis to examine the effectiveness and limitation of coastal dykes, in order to address the fundamentalquestion of how long the dykes will work under scenarios of continuing rapid land subsidence.
Sustainability 2017, 9, 619 2 of 14
port, where the level of the water is already higher than the ground behind the narrow kerb/dyke that protects the port area from getting flooded), or are already below seawater (the Pluit area is already protected by a dyke which surpasses the average height of an adult, about 1.8 m high, see Figure 1b). If groundwater extraction continues at the current rate, Jakarta is likely to sink a further 5–6 m by 2100 [11], which would require coastal dykes to be built around the entire coastal perimeter of the city or people to be relocated away from these areas. Thus, the National Capital Integrated Coastal Development (NCICD) [7] has urged Jakarta’s policy makers to prioritize solving the issue of land-subsidence as quickly as possible. If effective countermeasures to mitigate subsidence are not undertaken, future flood events will inevitably cause greater damage to Jakarta than what can be expected at present, especially given the increase in future exposure due to rapid economic and population growth. The potential areas at risk of being flooded in Jakarta are expected to drastically increase in the next decades, with subsidence being responsible for 88% of this increase [12]. However, the flood projection by Takagi et al. [12] was derived through a simulation that neglects the presence of coastal dykes, essentially investigating the potential flood extent without taking into account mitigation countermeasures against coastal floods. This assumption may cause an overestimation of the possible future impacts of flooding, at a time when the government of Jakarta has upgraded coastal protection in the area into a national project, as described later. In order to predict more realistic coastal floods until the year 2050, the authors developed a coastal hydrodynamic model that focused on the city of Jakarta. The aim of this model is to examine the effectiveness and limitation of coastal dykes, in order to address the fundamental question of how long the dykes will work under scenarios of continuing rapid land subsidence.
(a) (b)
Figure 1. (a). Sunda Kelapa port is already below sea level. (b) Pluit area is currently protected by a narrow coastal dyke, and in the future many areas of Jakarta will have to be protected by similar dykes unless ground subsidence can be stopped. [Photos taken by the authors in May 2016].
2. Methodology
The present study extends the coastal flood model developed for Jakarta by Takagi et al. [12], by taking into account a variety of different scenarios of possible dyke heights. This section will briefly describe this model and the different scenarios that the authors will consider regarding the future height of the dykes, land subsidence, and sea-level rise. To ascertain the current situation of coastal flooding, questionnaire surveys were also conducted in a small coastal community which is currently situated 2–3 m below sea level, protected from the sea by a narrow concrete dyke (Pluit, see Figure 1b).
2.1. Future Scenarios
This study considers the year of 2015 as the base year for the projection of the future extent of floods in Jakarta, and the year of 2050 as the end of the projection. In this projection, it is assumed that the present coastline does not have any effective dykes, and that the construction of a comprehensive coastal dyke that covers the entire shoreline of the city will be completed by 2030. It should be noted that some small sections of this coastline are already protected by relatively tall dykes,
Figure 1. (a) Sunda Kelapa port is already below sea level. (b) Pluit area is currently protected by anarrow coastal dyke, and in the future many areas of Jakarta will have to be protected by similar dykesunless ground subsidence can be stopped. [Photos taken by the authors in May 2016].
2. Methodology
The present study extends the coastal flood model developed for Jakarta by Takagi et al. [12],by taking into account a variety of different scenarios of possible dyke heights. This section will brieflydescribe this model and the different scenarios that the authors will consider regarding the futureheight of the dykes, land subsidence, and sea-level rise. To ascertain the current situation of coastalflooding, questionnaire surveys were also conducted in a small coastal community which is currentlysituated 2–3 m below sea level, protected from the sea by a narrow concrete dyke (Pluit, see Figure 1b).
2.1. Future Scenarios
This study considers the year of 2015 as the base year for the projection of the future extent offloods in Jakarta, and the year of 2050 as the end of the projection. In this projection, it is assumed thatthe present coastline does not have any effective dykes, and that the construction of a comprehensivecoastal dyke that covers the entire shoreline of the city will be completed by 2030. It should be noted
Figure 1. (a) Sunda Kelapa port is already below sea level; (b) Pluit area is currently protected by anarrow coastal dyke, and in the future many areas of Jakarta will have to be protected by similar dykesunless ground subsidence can be stopped. [Photos taken by the authors in May 2016].
2. Methodology
The present study extends the coastal flood model developed for Jakarta by Takagi et al. [12], bytaking into account a variety of different scenarios of possible dyke heights. This section will brieflydescribe this model and the different scenarios that the authors will consider regarding the futureheight of the dykes, land subsidence, and sea-level rise. To ascertain the current situation of coastalflooding, questionnaire surveys were also conducted in a small coastal community which is currentlysituated 2–3 m below sea level, protected from the sea by a narrow concrete dyke (Pluit, see Figure 1b).
2.1. Future Scenarios
This study considers the year of 2015 as the base year for the projection of the future extent offloods in Jakarta, and the year of 2050 as the end of the projection. In this projection, it is assumed thatthe present coastline does not have any effective dykes, and that the construction of a comprehensivecoastal dyke that covers the entire shoreline of the city will be completed by 2030. It should be noted

Sustainability 2017, 9, 619 3 of 15
that some small sections of this coastline are already protected by relatively tall dykes, and eventuallythese will have to be extended to cover all areas. Essentially, the scenario envisaged here is similar tothe Phase A project of the NCICD roadmap [7]. After 2030, two distinctive scenarios are considered(Figure 2); in the first scenario, land subsidence and sea-level rise (SLR) are both assumed to continueuntil 2050, whereas the second scenario assumes that land subsidence will stop by 2030, though SLRwould continue after 2030. The heights of dykes were set to be either 1 m, 3 m, or 5 m high, besides a“no-dyke present” (i.e., present day conditions) scenario, resulting in a total of eight scenarios beingconsidered (Figure 2).
Sustainability 2017, 9, 619 3 of 14
and eventually these will have to be extended to cover all areas. Essentially, the scenario envisaged here is similar to the Phase A project of the NCICD roadmap [7]. After 2030, two distinctive scenarios are considered (Figure 2); in the first scenario, land subsidence and sea-level rise (SLR) are both assumed to continue until 2050, whereas the second scenario assumes that land subsidence will stop by 2030, though SLR would continue after 2030. The heights of dykes were set to be either 1 m, 3 m, or 5 m high, besides a “no-dyke present” (i.e., present day conditions) scenario, resulting in a total of eight scenarios being considered (Figure 2).
Figure 2. Outline of scenarios considered between the base year (2015) and 2050, depending on the height of the coastal dyke and whether land subsidence (LS) and sea-level rise (SLR) are taken into account.
It is clear that the subsidence scenario assumed in this paper could represent an overestimation of what could happen, as subsidence could rapidly be halted if adequate policies are put in place. For example, the “100-0-100” sanitation policy issued by the Ministry of Public Works (PU) aims to provide 100% of the water supply needed by the Jakarta Metropolitan area by 2019, which would greatly contribute to the mitigation of subsidence. However, the authors consider that this is unlikely to happen in the short term as it seems that tangible countermeasures against land subsidence have yet to be prioritized in national plans, such as those by the Ministry of National Development Planning [13]. Thus, flood projections in this study were performed for these two distinctive situations, with the aim of investigating both the best and worst future scenarios.
The annual rate of land subsidence in Jakarta was estimated through monitoring data at a total of 14 global positioning system (GPS) subsidence monitoring stations in the city in the period from December 1997 to October 2001 [14], where the average and maximum rates were estimated to be 5.6 cm year−1 and 15 cm year−1, respectively [12]. Due to the heterogeneous nature of the environment and ground, which is influenced by geographical considerations and the different distribution and concentration of population and industries, the subsidence rate in Jakarta tends to be faster in the north-western coast than in the inland part of the city (see Figure A1). Therefore, it is anticipated that coastal flooding will become more pronounced as land subsidence progresses. The present study assumes that land subsidence will continue at the current rate, similar to the assumptions in other studies [12,15]. The authors admit that data used for this land subsidence analysis are not necessarily sufficient for the projection of the first half of the 21st century. Since publicly available data are very limited in Indonesia, however, there was no other viable option than to use the short-span of GPS data. The projections in terms of the land subsidence should be refined with data from a longer period in future research.
SLR was assumed to be 7 mm year−1, based on satellite data analysis between 1992 and 2015 [12]. There is considerable uncertainty in the estimated pace of sea level rise after 2050, as summarized in the Intergovernmental Panel on Climate Change 5th Assessment Report (IPCC AR5), which depends on the model and greenhouse gas forcing used. In fact, the projections of global mean SLRs by 2100
Figure 2. Outline of scenarios considered between the base year (2015) and 2050, depending onthe height of the coastal dyke and whether land subsidence (LS) and sea-level rise (SLR) are takeninto account.
It is clear that the subsidence scenario assumed in this paper could represent an overestimationof what could happen, as subsidence could rapidly be halted if adequate policies are put in place.For example, the “100-0-100” sanitation policy issued by the Ministry of Public Works (PU) aims toprovide 100% of the water supply needed by the Jakarta Metropolitan area by 2019, which wouldgreatly contribute to the mitigation of subsidence. However, the authors consider that this is unlikely tohappen in the short term as it seems that tangible countermeasures against land subsidence have yet tobe prioritized in national plans, such as those by the Ministry of National Development Planning [13].Thus, flood projections in this study were performed for these two distinctive situations, with the aimof investigating both the best and worst future scenarios.
The annual rate of land subsidence in Jakarta was estimated through monitoring data at a totalof 14 global positioning system (GPS) subsidence monitoring stations in the city in the period fromDecember 1997 to October 2001 [14], where the average and maximum rates were estimated to be5.6 cm·year−1 and 15 cm·year−1, respectively [12]. Due to the heterogeneous nature of the environmentand ground, which is influenced by geographical considerations and the different distribution andconcentration of population and industries, the subsidence rate in Jakarta tends to be faster in thenorth-western coast than in the inland part of the city (see Figure A1). Therefore, it is anticipatedthat coastal flooding will become more pronounced as land subsidence progresses. The present studyassumes that land subsidence will continue at the current rate, similar to the assumptions in otherstudies [12,15]. The authors admit that data used for this land subsidence analysis are not necessarilysufficient for the projection of the first half of the 21st century. Since publicly available data are verylimited in Indonesia, however, there was no other viable option than to use the short-span of GPS data.The projections in terms of the land subsidence should be refined with data from a longer period infuture research.
Figure 2. Outline of scenarios considered between the base year (2015) and 2050, depending onthe height of the coastal dyke and whether land subsidence (LS) and sea-level rise (SLR) are takeninto account.
It is clear that the subsidence scenario assumed in this paper could represent an overestimationof what could happen, as subsidence could rapidly be halted if adequate policies are put in place.For example, the “100-0-100” sanitation policy issued by the Ministry of Public Works (PU) aims toprovide 100% of the water supply needed by the Jakarta Metropolitan area by 2019, which wouldgreatly contribute to the mitigation of subsidence. However, the authors consider that this is unlikely tohappen in the short term as it seems that tangible countermeasures against land subsidence have yet tobe prioritized in national plans, such as those by the Ministry of National Development Planning [13].Thus, flood projections in this study were performed for these two distinctive situations, with the aimof investigating both the best and worst future scenarios.
The annual rate of land subsidence in Jakarta was estimated through monitoring data at a totalof 14 global positioning system (GPS) subsidence monitoring stations in the city in the period fromDecember 1997 to October 2001 [14], where the average and maximum rates were estimated to be5.6 cm year−1 and 15 cm year−1, respectively [12]. Due to the heterogeneous nature of the environmentand ground, which is influenced by geographical considerations and the different distribution andconcentration of population and industries, the subsidence rate in Jakarta tends to be faster in thenorth-western coast than in the inland part of the city (see Figure A1). Therefore, it is anticipatedthat coastal flooding will become more pronounced as land subsidence progresses. The present studyassumes that land subsidence will continue at the current rate, similar to the assumptions in otherstudies [12,15]. The authors admit that data used for this land subsidence analysis are not necessarilysufficient for the projection of the first half of the 21st century. Since publicly available data are verylimited in Indonesia, however, there was no other viable option than to use the short-span of GPS data.The projections in terms of the land subsidence should be refined with data from a longer period infuture research.

Sustainability 2017, 9, 619 4 of 15
SLR was assumed to be 7 mm year−1, based on satellite data analysis between 1992 and 2015 [12].There is considerable uncertainty in the estimated pace of sea level rise after 2050, as summarized inthe Intergovernmental Panel on Climate Change 5th Assessment Report (IPCC AR5), which dependson the model and greenhouse gas forcing used. In fact, the projections of global mean SLRs by 2100are rather uncertain, varying in the range from 0.28 to 0.98 m, depending on RCP (RepresentativeConcentration Pathway) scenarios [16]. On the other hand, the projections for the middle of the century(2046–2065) show relatively small variations, within the range of 0.17 to 0.38 m. Thus, the authorsconsidered it prudent to stop their analysis in the year 2050 to minimize the uncertainties associatedwith the selection of the scenarios. This assumption would also constitute the typical planning horizonof civil engineering projects (which typically have a design life of a few decades, meaning that anydyke completed by 2030 would be expected to remain functional up to the year 2050).
It should be noted that this study only discusses coastal floods induced by an overflow of thedykes, neglecting other mechanisms such as seawater that penetrates through sewage pipes andinundates the ground, geotechnical failure of the dykes due to differential settlement, or river flooding.These are also very important problems, and are likely to become worse as the extent of groundsubsidence increases. Also, the possibility of the dykes failing during overtopping is not considered,despite this having been identified as a major problem in recent years (e.g., dramatic dyke failuresduring the 2011 Tohoku tsunami [17] and the 2013 Typhoon Haiyan [18]). However, such matters areoutside the scope of the present paper, and should be the target of future work.
2.2. Numerical Simulation
A versatile hydrodynamic model, Delft3D-FLOW, was used for the simulation of ocean tidesthat travel from the offshore region to shallow bay areas, and eventually flood over downtownJakarta. Although this model is applicable for a 3D domain, the present study used a 2D horizontalgrid, and, thus, the code is equivalent to a non-linear long-wave model, which is the most commonway to simulate long-wave propagation [19]. In combination with a flooding scheme for advectionin the momentum equation, the algorithm referred to as drying and flooding in this numericalmodel is expected to give a good representation of rapidly varying flows with large water-levelgradients as a result of overflows [20]. The topographical data was derived by combining theSRTM 90 m Digital Elevation Database [21] and the General Bathymetric Chart of the Oceans with30 arc-second intervals [22]. The computational domain encompasses Jakarta in its entirety andthe bay between 5.9◦ S–106.68◦ E and 6.2◦ S–107.03◦ E, covering an area of 38.8 km × 33.1 km(Figure 3). The computational grid sizes gradually become smaller from the offshore to the onshorearea, with the smallest size being 60 m (Easting) × 20 m (Northing) grid cells. The tidal constituents,originally derived from the TPXO7.1 Global Tide Model [23], were adjusted with a historically abnormaltide event in November 2007 [12] and then assigned along the offshore open boundary (Figure 3).This historical event was likely brought about by a coincidence of the lunar nodal period and anannual spring tide, and the next peaks would be expected to appear in the periods around 2025–2027and 2044–2046 [24]. Figure 3 also shows the perimeter of the hypothetical coastal dyke, which isapproximately similar with that in the NCICD project.
As highlighted by the IPCC AR5, coastal floods are likely to become more common in coastalareas around the world due to the consequences of future climate change, including tropical cycloneintensification [25]. Although coastal areas could experience the indirect minor impact of a majortyphoon which travels near the Philippines or Vietnam in the western north Pacific [26,27], Jakarta isnot on the route that tropical cyclones take and, thus, is unlikely to face a significant typhoon-generatingstorm surge event. Therefore, the present study did not take such large/sudden storm eventsinto consideration.

Sustainability 2017, 9, 619 5 of 15Sustainability 2017, 9, 619 5 of 15
Sustainability 2017, 9, 619 5 of 14
Figure 3. Computational domain, encompassing Jakarta city and its bay. The analysis of coastal floods focuses on the target area, while the simulation runs for a wider area, including the buffer zones.
2.3. Definition of Inundation Area
The target area (Figure 3) encompasses the main districts in downtown Jakarta and its coastal area. The extent of the flooded areas, water depths, and volumes were all projected within this target area. The inundation map was created by masking a simulation result with a predefined base map, which classifies each point as either sea or land (Figure 4). As the coastline moves back and forth with tides, the present study defined the coastline by reference to the mean sea level on 20 November 2015 (the abovementioned abnormal tide took place 5–6 days later). By subtracting the sea area from the simulated extent of the water at one given point, an inundation map—Figure 4c—can be created, from which parameters such as the inundation area and depth can be extracted. The total volume of floodwater can be calculated by integrating the inundation depth and area over the entire domain.
Figure 4. Creation of inundation map, obtained by masking the simulation result with the base map.
2.4. Questionnaire Surveys
The authors conducted a structured questionnaire survey amongst local residents of the Pluit area in May 2016, with the aim of investigating the frequency of coastal floods and their impacts. Prior to this survey, the authors also conducted a series of field surveys along the coastline of Jakarta in January 2015, May 2015, September 2015, and February 2016 in order to investigate the current situation of Jakarta’s coast and identify the potential coastal hazards affecting local communities. After these surveys, the authors identified this small coastal village as one of the most vulnerable
Figure 3. Computational domain, encompassing Jakarta city and its bay. The analysis of coastal floodsfocuses on the target area, while the simulation runs for a wider area, including the buffer zones.
2.3. Definition of Inundation Area
The target area (Figure 3) encompasses the main districts in downtown Jakarta and its coastalarea. The extent of the flooded areas, water depths, and volumes were all projected within this targetarea. The inundation map was created by masking a simulation result with a predefined base map,which classifies each point as either sea or land (Figure 4). As the coastline moves back and forth withtides, the present study defined the coastline by reference to the mean sea level on 20 November 2015(the abovementioned abnormal tide took place 5–6 days later). By subtracting the sea area from thesimulated extent of the water at one given point, an inundation map—Figure 4c—can be created,from which parameters such as the inundation area and depth can be extracted. The total volume offloodwater can be calculated by integrating the inundation depth and area over the entire domain.
Sustainability 2017, 9, 619 5 of 14
Figure 3. Computational domain, encompassing Jakarta city and its bay. The analysis of coastal floods focuses on the target area, while the simulation runs for a wider area, including the buffer zones.
2.3. Definition of Inundation Area
The target area (Figure 3) encompasses the main districts in downtown Jakarta and its coastal area. The extent of the flooded areas, water depths, and volumes were all projected within this target area. The inundation map was created by masking a simulation result with a predefined base map, which classifies each point as either sea or land (Figure 4). As the coastline moves back and forth with tides, the present study defined the coastline by reference to the mean sea level on 20 November 2015 (the abovementioned abnormal tide took place 5–6 days later). By subtracting the sea area from the simulated extent of the water at one given point, an inundation map—Figure 4c—can be created, from which parameters such as the inundation area and depth can be extracted. The total volume of floodwater can be calculated by integrating the inundation depth and area over the entire domain.
Figure 4. Creation of inundation map, obtained by masking the simulation result with the base map.
2.4. Questionnaire Surveys
The authors conducted a structured questionnaire survey amongst local residents of the Pluit area in May 2016, with the aim of investigating the frequency of coastal floods and their impacts. Prior to this survey, the authors also conducted a series of field surveys along the coastline of Jakarta in January 2015, May 2015, September 2015, and February 2016 in order to investigate the current situation of Jakarta’s coast and identify the potential coastal hazards affecting local communities. After these surveys, the authors identified this small coastal village as one of the most vulnerable
Figure 4. Creation of inundation map, obtained by masking the simulation result with the base map.
2.4. Questionnaire Surveys
The authors conducted a structured questionnaire survey amongst local residents of the Pluitarea in May 2016, with the aim of investigating the frequency of coastal floods and their impacts.Prior to this survey, the authors also conducted a series of field surveys along the coastline of Jakartain January 2015, May 2015, September 2015, and February 2016 in order to investigate the current
Figure 3. Computational domain, encompassing Jakarta city and its bay. The analysis of coastal floodsfocuses on the target area, while the simulation runs for a wider area, including the buffer zones.
2.3. Definition of Inundation Area
The target area (Figure 3) encompasses the main districts in downtown Jakarta and its coastalarea. The extent of the flooded areas, water depths, and volumes were all projected within this targetarea. The inundation map was created by masking a simulation result with a predefined base map,which classifies each point as either sea or land (Figure 4). As the coastline moves back and forthwith tides, the present study defined the coastline by reference to the mean sea level on 20 November2015 (the abovementioned abnormal tide took place 5–6 days later). By subtracting the sea area fromthe simulated extent of the water at one given point, an inundation map—Figure 4c—can be created,from which parameters such as the inundation area and depth can be extracted. The total volume offloodwater can be calculated by integrating the inundation depth and area over the entire domain.
Sustainability 2017, 9, 619 5 of 15
Sustainability 2017, 9, 619 5 of 14
Figure 3. Computational domain, encompassing Jakarta city and its bay. The analysis of coastal floods focuses on the target area, while the simulation runs for a wider area, including the buffer zones.
2.3. Definition of Inundation Area
The target area (Figure 3) encompasses the main districts in downtown Jakarta and its coastal area. The extent of the flooded areas, water depths, and volumes were all projected within this target area. The inundation map was created by masking a simulation result with a predefined base map, which classifies each point as either sea or land (Figure 4). As the coastline moves back and forth with tides, the present study defined the coastline by reference to the mean sea level on 20 November 2015 (the abovementioned abnormal tide took place 5–6 days later). By subtracting the sea area from the simulated extent of the water at one given point, an inundation map—Figure 4c—can be created, from which parameters such as the inundation area and depth can be extracted. The total volume of floodwater can be calculated by integrating the inundation depth and area over the entire domain.
Figure 4. Creation of inundation map, obtained by masking the simulation result with the base map.
2.4. Questionnaire Surveys
The authors conducted a structured questionnaire survey amongst local residents of the Pluit area in May 2016, with the aim of investigating the frequency of coastal floods and their impacts. Prior to this survey, the authors also conducted a series of field surveys along the coastline of Jakarta in January 2015, May 2015, September 2015, and February 2016 in order to investigate the current situation of Jakarta’s coast and identify the potential coastal hazards affecting local communities. After these surveys, the authors identified this small coastal village as one of the most vulnerable
Figure 3. Computational domain, encompassing Jakarta city and its bay. The analysis of coastal floodsfocuses on the target area, while the simulation runs for a wider area, including the buffer zones.
2.3. Definition of Inundation Area
The target area (Figure 3) encompasses the main districts in downtown Jakarta and its coastalarea. The extent of the flooded areas, water depths, and volumes were all projected within this targetarea. The inundation map was created by masking a simulation result with a predefined base map,which classifies each point as either sea or land (Figure 4). As the coastline moves back and forth withtides, the present study defined the coastline by reference to the mean sea level on 20 November 2015(the abovementioned abnormal tide took place 5–6 days later). By subtracting the sea area from thesimulated extent of the water at one given point, an inundation map—Figure 4c—can be created,from which parameters such as the inundation area and depth can be extracted. The total volume offloodwater can be calculated by integrating the inundation depth and area over the entire domain.
Sustainability 2017, 9, 619 5 of 14
Figure 3. Computational domain, encompassing Jakarta city and its bay. The analysis of coastal floods focuses on the target area, while the simulation runs for a wider area, including the buffer zones.
2.3. Definition of Inundation Area
The target area (Figure 3) encompasses the main districts in downtown Jakarta and its coastal area. The extent of the flooded areas, water depths, and volumes were all projected within this target area. The inundation map was created by masking a simulation result with a predefined base map, which classifies each point as either sea or land (Figure 4). As the coastline moves back and forth with tides, the present study defined the coastline by reference to the mean sea level on 20 November 2015 (the abovementioned abnormal tide took place 5–6 days later). By subtracting the sea area from the simulated extent of the water at one given point, an inundation map—Figure 4c—can be created, from which parameters such as the inundation area and depth can be extracted. The total volume of floodwater can be calculated by integrating the inundation depth and area over the entire domain.
Figure 4. Creation of inundation map, obtained by masking the simulation result with the base map.
2.4. Questionnaire Surveys
The authors conducted a structured questionnaire survey amongst local residents of the Pluit area in May 2016, with the aim of investigating the frequency of coastal floods and their impacts. Prior to this survey, the authors also conducted a series of field surveys along the coastline of Jakarta in January 2015, May 2015, September 2015, and February 2016 in order to investigate the current situation of Jakarta’s coast and identify the potential coastal hazards affecting local communities. After these surveys, the authors identified this small coastal village as one of the most vulnerable
Figure 4. Creation of inundation map, obtained by masking the simulation result with the base map.
2.4. Questionnaire Surveys
The authors conducted a structured questionnaire survey amongst local residents of the Pluitarea in May 2016, with the aim of investigating the frequency of coastal floods and their impacts.Prior to this survey, the authors also conducted a series of field surveys along the coastline of Jakartain January 2015, May 2015, September 2015, and February 2016 in order to investigate the current
Figure 4. Creation of inundation map, obtained by masking the simulation result with the base map.
2.4. Questionnaire Surveys
The authors conducted a structured questionnaire survey amongst local residents of the Pluit areain May 2016, with the aim of investigating the frequency of coastal floods and their impacts. Prior tothis survey, the authors also conducted a series of field surveys along the coastline of Jakarta in January2015, May 2015, September 2015, and February 2016 in order to investigate the current situation of
Sustainability 2017, 9, 619 6 of 15
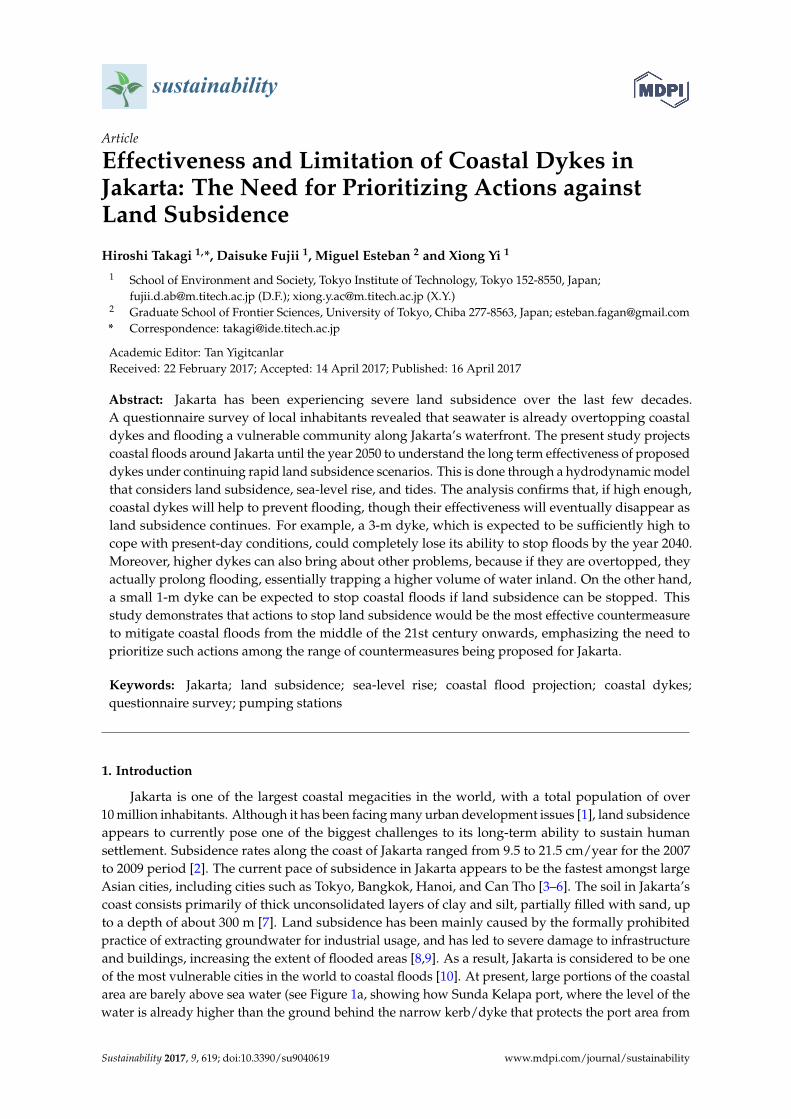
Jakarta’s coast and identify the potential coastal hazards affecting local communities. After thesesurveys, the authors identified this small coastal village as one of the most vulnerable communities inJakarta, as it is only protected by a thin coastal dyke (Figure 5). The rate of land subsidence near thiscoastal area was considered particularly fast [2,28].
A total of 200 responses were collected, all of which were valid (n = 200). The structuredquestionnaire was administered by three enumerators, based on an original drafted in English that wasthen translated into Bahasa Indonesia, the national language of Indonesia. Since the area is surroundedby both the sea and the river, enumerators started by informing respondents that the definition of“coastal flood” is a flood event caused by high water levels in the sea, which should be different froma “river flood”, which is a flood event caused by high water levels in the river upstream. A randomsampling method was used to select respondents, who were all residents of Pluit or adjacent districtsin North Jakarta. Most respondents were of working age, with 80% being between 20 and 50 years old.The majority of respondents were housewives, with the second major group being labor workers.
Sustainability 2017, 9, 619 6 of 15
situation of Jakarta’s coast and identify the potential coastal hazards affecting local communities.After these surveys, the authors identified this small coastal village as one of the most vulnerablecommunities in Jakarta, as it is only protected by a thin coastal dyke (Figure 5). The rate of landsubsidence near this coastal area was considered particularly fast [2,28].
A total of 200 responses were collected, all of which were valid (n = 200). The structuredquestionnaire was administered by three enumerators, based on an original drafted in English that wasthen translated into Bahasa Indonesia, the national language of Indonesia. Since the area is surroundedby both the sea and the river, enumerators started by informing respondents that the definition of“coastal flood” is a flood event caused by high water levels in the sea, which should be different froma “river flood”, which is a flood event caused by high water levels in the river upstream. A randomsampling method was used to select respondents, who were all residents of Pluit or adjacent districtsin North Jakarta. Most respondents were of working age, with 80% being between 20 and 50 years old.The majority of respondents were housewives, with the second major group being labor workers.
Sustainability 2017, 9, 619 6 of 14
communities in Jakarta, as it is only protected by a thin coastal dyke (Figure 5). The rate of land subsidence near this coastal area was considered particularly fast [2,28].
A total of 200 responses were collected, all of which were valid (n = 200). The structured questionnaire was administered by three enumerators, based on an original drafted in English that was then translated into Bahasa Indonesia, the national language of Indonesia. Since the area is surrounded by both the sea and the river, enumerators started by informing respondents that the definition of “coastal flood” is a flood event caused by high water levels in the sea, which should be different from a “river flood”, which is a flood event caused by high water levels in the river upstream. A random sampling method was used to select respondents, who were all residents of Pluit or adjacent districts in North Jakarta. Most respondents were of working age, with 80% being between 20 and 50 years old. The majority of respondents were housewives, with the second major group being labor workers.
Figure 5. Interview with a stall owner in Pluit, Jakarta. The community is protected by a thin coastal dyke, shown on the left side. Substantial leakage of seawater through a concrete joint made the road wet, as can be observed in the photo. The details on the dyke and community were described by Takagi et al. [28].
3. Results
This section shows the results of the projections of the flooded area and floodwater volume caused by coastal floods up until the year 2050, which demonstrate how land subsidence will be the main reason why the impact of flooding is likely to become more severe in the future. The results of the questionnaire survey regarding the current situation of coastal floods in the target coastal community are also described.
3.1. Projection of the Extent of Coastal Floods in Jakarta by 2050
Figure 6 presents the projection of the extent of the inundation areas between 2015 and 2050 for the range of scenarios shown in Figure 2. The present study assumed the worst possible high tide condition, essentially reproducing the abnormal tidal event in November 2007. Since this event represents the case of a coastal flood that actually took place, the simulation correctly estimates that some parts of the coastline can already potentially be flooded. However, the maximum extent of the
Figure 5. Interview with a stall owner in Pluit, Jakarta. The community is protected by a thin coastaldyke, shown on the left side. Substantial leakage of seawater through a concrete joint made the roadwet, as can be observed in the photo. The details on the dyke and community were described byTakagi et al. [28].
3. Results
This section shows the results of the projections of the flooded area and floodwater volume causedby coastal floods up until the year 2050, which demonstrate how land subsidence will be the mainreason why the impact of flooding is likely to become more severe in the future. The results of thequestionnaire survey regarding the current situation of coastal floods in the target coastal communityare also described.
3.1. Projection of the Extent of Coastal Floods in Jakarta by 2050
Figure 6 presents the projection of the extent of the inundation areas between 2015 and 2050for the range of scenarios shown in Figure 2. The present study assumed the worst possible high
Figure 5. Interview with a stall owner in Pluit, Jakarta. The community is protected by a thin coastaldyke, shown on the left side. Substantial leakage of seawater through a concrete joint made the roadwet, as can be observed in the photo. The details on the dyke and community were described byTakagi et al. [28].
3. Results
This section shows the results of the projections of the flooded area and floodwater volume causedby coastal floods up until the year 2050, which demonstrate how land subsidence will be the mainreason why the impact of flooding is likely to become more severe in the future. The results of thequestionnaire survey regarding the current situation of coastal floods in the target coastal communityare also described.
3.1. Projection of the Extent of Coastal Floods in Jakarta by 2050
Figure 6 presents the projection of the extent of the inundation areas between 2015 and 2050for the range of scenarios shown in Figure 2. The present study assumed the worst possible hightide condition, essentially reproducing the abnormal tidal event in November 2007. Since this event

Sustainability 2017, 9, 619 7 of 15
represents the case of a coastal flood that actually took place, the simulation correctly estimates thatsome parts of the coastline can already potentially be flooded. However, the maximum extent of thepossible area that can be flooded is limited to within a few hundred meters from the coastline. If thedyke is finished within the next decade, as planned by the NCICD, it is expected that coastal floodscould be completely prevented by 2030.
Sustainability 2017, 9, 619 7 of 15
tide condition, essentially reproducing the abnormal tidal event in November 2007. Since this eventrepresents the case of a coastal flood that actually took place, the simulation correctly estimates thatsome parts of the coastline can already potentially be flooded. However, the maximum extent of thepossible area that can be flooded is limited to within a few hundred meters from the coastline. If thedyke is finished within the next decade, as planned by the NCICD, it is expected that coastal floodscould be completely prevented by 2030.
Sustainability 2017, 9, 619 7 of 14
possible area that can be flooded is limited to within a few hundred meters from the coastline. If the dyke is finished within the next decade, as planned by the NCICD, it is expected that coastal floods could be completely prevented by 2030.
Figure 6. Extent of expected flood area between 2015 and 2050. The simulation assumes that coastal dykes do not exist in 2015 and will be completed by 2030, according to the National Capital Integrated Coastal Development (NCICD) roadmap. The numbers in parenthesis provide the flooded area and average inundation depth, respectively. The five red spots that are shown in the bottom right figure indicate the location of pumping stations, numbered 1 to 5, corresponding with those listed in Table 1.
After 2030, however, the potential extent of the flooding depends on the scenario considered. In particular, continuing land subsidence greatly influences the outcome of the simulation. If land subsidence is stopped by 2030, the risk of coastal floods will be virtually eliminated, as SLR alone may not cause a drastic increase in the coastal flood risk, at least not until 2050. However, if land subsidence continues after 2030, the effectiveness of a 1-m high dyke will be nullified within 10 years of the dyke’s completion. Particularly, the western coast (which experiences the fastest rate of subsidence in the city) will start to get inundated as early as 2040, with inundation areas gradually extending towards the east coast and central districts. By 2050, the extent of the flooded area with a 1-m dyke would become almost identical to the case where no dyke was present, because if the dyke is overflowed, water will rapidly propagate over land, almost as if there was no coastal protection.
A 3-m high dyke will obviously preserve its functionality for a longer period, though even in this case its effectiveness will probably be limited to just 10 or 15 years after its completion in 2030. However, it is worth noting that its performance would suddenly drop just before 2050, resulting in a rapid expansion of the potential flooded areas within a very short transition period. In spite of the fact that a 3-m high dyke seems to be sufficiently high for present needs, the dyke will inevitably sink if the ground underneath it continues to subside, and will likely end up being totally submerged before 2050.
Since a 5-m high dyke appears to be too high to be overflowed, as proven by Figure 7, the flooded area will substantially increase until at least 2050, irrespective of the scenarios assumed, and, thus, Figure 6 does not show the results for the 5-m dyke.
Figure 6. Extent of expected flood area between 2015 and 2050. The simulation assumes that coastaldykes do not exist in 2015 and will be completed by 2030, according to the National Capital IntegratedCoastal Development (NCICD) roadmap. The numbers in parenthesis provide the flooded area andaverage inundation depth, respectively. The five red spots that are shown in the bottom right figureindicate the location of pumping stations, numbered 1 to 5, corresponding with those listed in Table 1.
After 2030, however, the potential extent of the flooding depends on the scenario considered.In particular, continuing land subsidence greatly influences the outcome of the simulation. If landsubsidence is stopped by 2030, the risk of coastal floods will be virtually eliminated, as SLR alone maynot cause a drastic increase in the coastal flood risk, at least not until 2050. However, if land subsidencecontinues after 2030, the effectiveness of a 1-m high dyke will be nullified within 10 years of the dyke’scompletion. Particularly, the western coast (which experiences the fastest rate of subsidence in the city)will start to get inundated as early as 2040, with inundation areas gradually extending towards theeast coast and central districts. By 2050, the extent of the flooded area with a 1-m dyke would becomealmost identical to the case where no dyke was present, because if the dyke is overflowed, water willrapidly propagate over land, almost as if there was no coastal protection.
A 3-m high dyke will obviously preserve its functionality for a longer period, though even inthis case its effectiveness will probably be limited to just 10 or 15 years after its completion in 2030.However, it is worth noting that its performance would suddenly drop just before 2050, resultingin a rapid expansion of the potential flooded areas within a very short transition period. In spite ofthe fact that a 3-m high dyke seems to be sufficiently high for present needs, the dyke will inevitablysink if the ground underneath it continues to subside, and will likely end up being totally submergedbefore 2050.
Since a 5-m high dyke appears to be too high to be overflowed, as proven by Figure 7, the floodedarea will substantially increase until at least 2050, irrespective of the scenarios assumed, and, thus,Figure 6 does not show the results for the 5-m dyke.

Sustainability 2017, 9, 619 8 of 15
Sustainability 2017, 9, 619 8 of 15
Since a 5-m high dyke appears to be too high to be overflowed, as proven by Figure 7, the floodedarea will substantially increase until at least 2050, irrespective of the scenarios assumed, and, thus,Figure 6 does not show the results for the 5-m dyke.Sustainability 2017, 9, 619 8 of 14
Figure 7. Floodwater volumes, which vary according to tidal conditions, were projected until 2050 for the eight scenarios considered, as shown in Figure 2. The total number of days needed for pumping out the floodwater was calculated by dividing the water volume by the discharge capacity of 77 m3/s.
3.2. Floodwater Volume and Required Pump Facilities
Pluit Pump Station is the largest pump in Jakarta (situated adjacent to the sea, with a discharge capacity of about 50 m3/s), followed by Cideng–Siantar Pump Station (40 m3/s, [29]). The total discharge capacity of the 17 pump facilities in Jakarta is estimated to be around 200 m3/s. Among them, five stations are located within the potential coastal areas that can be flooded, as shown in Figure 6. The present study, thus, assumes that these five pumps could work to discharge floodwater up to their total capacity of 77 m3/s (see Table 1).
Figure 7 shows the projections of floodwater volumes, which significantly vary depending on the year, scenario, and tidal conditions considered. The scenario that considers no dyke, continuing land subsidence, and SLR (top left in Figure 7) indicates that the rate of increase in the potential flooded area would be accelerated in later years, demonstrating an exponential increase in the impact of flooding as time progresses. Figure 7 also indicates the time required to pump out all the floodwater using the five pumping stations, which was simply estimated by dividing the total water volume by the discharge capacity of 77 m3/s. Although tidal ranges in Jakarta are relatively small (less than 1.2 m), the total water volume that could enter the land as a consequence of a high tide would be considerably larger than those during mean or low tide. Therefore, floodwater volumes and water levels need to take into account the maximum possible tides, as the worst flood damage would obviously take place during such events.
Nevertheless, Figure 7 also shows that the influence of the tidal fluctuations on the extent of the flooding will diminish as the coastal dykes become higher, as higher walls will trap more floodwater than a smaller wall when the water returns to the sea during the ebb tidal phase. This implies that a higher dyke is not necessarily better than a smaller dyke, and could sometimes cause a more persistent flood. For example, a 3-m dyke may work well to prevent coastal floods until 2045. However, afterwards the volume of floodwater that would have to be removed from behind the dykes would suddenly jump to about 60 million m3, irrespective of the tidal phase considered.
Compared with the case where no dyke is present, the 3-m dyke appears to be more effective in reducing the maximum volume of floodwater. However, the results show that unless the pumping
Figure 7. Floodwater volumes, which vary according to tidal conditions, were projected until 2050 forthe eight scenarios considered, as shown in Figure 2. The total number of days needed for pumpingout the floodwater was calculated by dividing the water volume by the discharge capacity of 77 m3/s.
3.2. Floodwater Volume and Required Pump Facilities
Pluit Pump Station is the largest pump in Jakarta (situated adjacent to the sea, with a dischargecapacity of about 50 m3/s), followed by Cideng–Siantar Pump Station (40 m3/s, [29]). The totaldischarge capacity of the 17 pump facilities in Jakarta is estimated to be around 200 m3/s. Amongthem, five stations are located within the potential coastal areas that can be flooded, as shown inFigure 6. The present study, thus, assumes that these five pumps could work to discharge floodwaterup to their total capacity of 77 m3/s (see Table 1).
Figure 7 shows the projections of floodwater volumes, which significantly vary depending on theyear, scenario, and tidal conditions considered. The scenario that considers no dyke, continuing landsubsidence, and SLR (top left in Figure 7) indicates that the rate of increase in the potential flooded areawould be accelerated in later years, demonstrating an exponential increase in the impact of flooding astime progresses. Figure 7 also indicates the time required to pump out all the floodwater using the fivepumping stations, which was simply estimated by dividing the total water volume by the dischargecapacity of 77 m3/s. Although tidal ranges in Jakarta are relatively small (less than 1.2 m), the totalwater volume that could enter the land as a consequence of a high tide would be considerably largerthan those during mean or low tide. Therefore, floodwater volumes and water levels need to take intoaccount the maximum possible tides, as the worst flood damage would obviously take place duringsuch events.
Nevertheless, Figure 7 also shows that the influence of the tidal fluctuations on the extent of theflooding will diminish as the coastal dykes become higher, as higher walls will trap more floodwaterthan a smaller wall when the water returns to the sea during the ebb tidal phase. This impliesthat a higher dyke is not necessarily better than a smaller dyke, and could sometimes cause a more
Figure 7. Floodwater volumes, which vary according to tidal conditions, were projected until 2050 forthe eight scenarios considered, as shown in Figure 2. The total number of days needed for pumpingout the floodwater was calculated by dividing the water volume by the discharge capacity of 77 m3/s.
3.2. Floodwater Volume and Required Pump Facilities
Pluit Pump Station is the largest pump in Jakarta (situated adjacent to the sea, with a dischargecapacity of about 50 m3/s), followed by Cideng–Siantar Pump Station (40 m3/s, [29]). The totaldischarge capacity of the 17 pump facilities in Jakarta is estimated to be around 200 m3/s. Amongthem, five stations are located within the potential coastal areas that can be flooded, as shown inFigure 6. The present study, thus, assumes that these five pumps could work to discharge floodwaterup to their total capacity of 77 m3/s (see Table 1).
Figure 7 shows the projections of floodwater volumes, which significantly vary depending on theyear, scenario, and tidal conditions considered. The scenario that considers no dyke, continuing landsubsidence, and SLR (top left in Figure 7) indicates that the rate of increase in the potential flooded areawould be accelerated in later years, demonstrating an exponential increase in the impact of flooding astime progresses. Figure 7 also indicates the time required to pump out all the floodwater using the fivepumping stations, which was simply estimated by dividing the total water volume by the dischargecapacity of 77 m3/s. Although tidal ranges in Jakarta are relatively small (less than 1.2 m), the totalwater volume that could enter the land as a consequence of a high tide would be considerably largerthan those during mean or low tide. Therefore, floodwater volumes and water levels need to take intoaccount the maximum possible tides, as the worst flood damage would obviously take place duringsuch events.
Nevertheless, Figure 7 also shows that the influence of the tidal fluctuations on the extent of theflooding will diminish as the coastal dykes become higher, as higher walls will trap more floodwaterthan a smaller wall when the water returns to the sea during the ebb tidal phase. This impliesthat a higher dyke is not necessarily better than a smaller dyke, and could sometimes cause a morepersistent flood. For example, a 3-m dyke may work well to prevent coastal floods until 2045. However,afterwards the volume of floodwater that would have to be removed from behind the dykes wouldsuddenly jump to about 60 million m3, irrespective of the tidal phase considered.

Sustainability 2017, 9, 619 9 of 15
Compared with the case where no dyke is present, the 3-m dyke appears to be more effective inreducing the maximum volume of floodwater. However, the results show that unless the pumpingfacilities are drastically expanded or upgraded, it may take as long as 9 days by 2050 to remove allthe potential floodwater once a flooding event occurs. However, if land subsidence can be stopped by2030, a 1-m dyke would effectively protect Jakarta from coastal floods, at least until 2050. Furthermore,in this case, it is probably not necessary to upgrade the present pumping systems, which appearadequate to handle the occasional coastal flood.
Table 1. List of the five pump facilities in Jakarta’s coastal area (adapted from a table present in a reportby JICA (Japan International Cooperation Agency) [29]).
Area Place for Discharging Floodwater Pump Capacity (m3/s)
1 Pluit Java Sea 502 Muara Angke K. Angke 13 Teluk Gong K. Angke 0.84 Pademangan/Ancol K. Ancol 155 Sunter Barat Utara K. Ancol 9.9
Total 76.7
3.3. Current Situation of Coastal Floods Revealed through the Interview
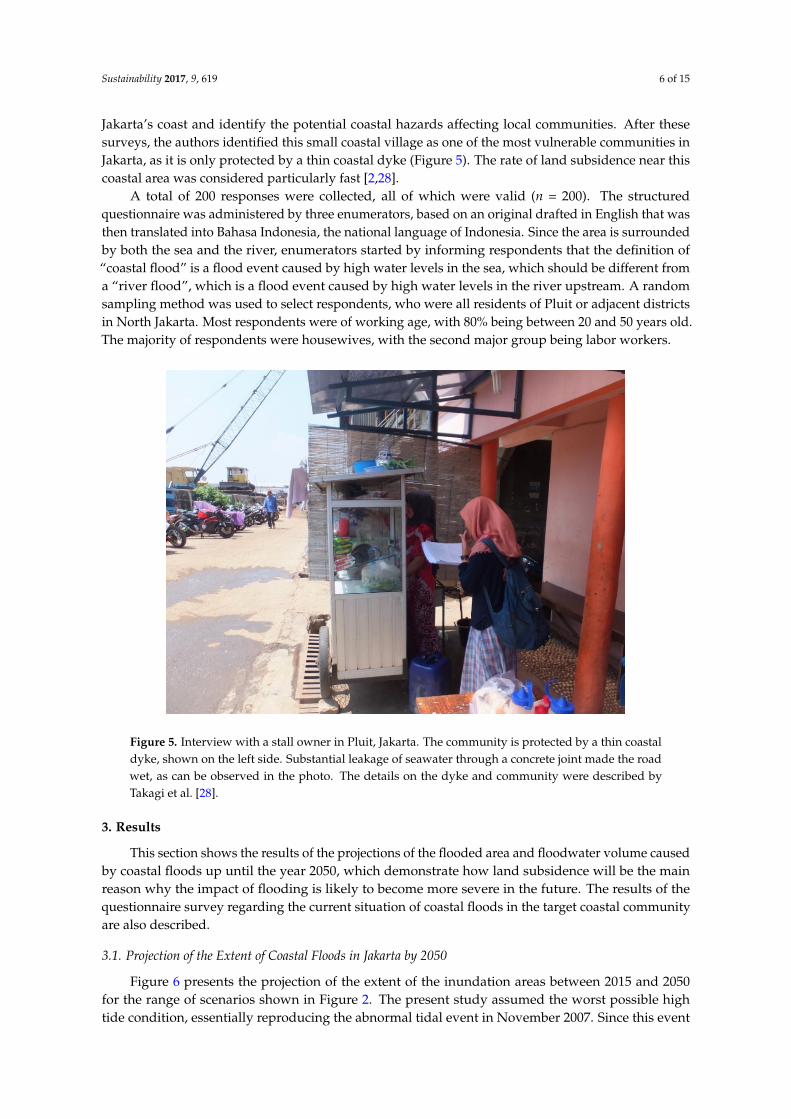
Figure 8a indicates that 85.5% of respondents (n = 200) have experienced some sort of damagecaused by coastal floods in the course of their lives, with about 68% of them answering that theirproperties/houses suffered major damage or were completely destroyed (Figure 8b). This is notsurprising considering that the last major floods took place in 2007, as reported in Takagi et al. [12,28].Essentially, this was an important benchmark event that could be used to calibrate the responses ofthose interviewed, giving the authors confidence in the results of the questionnaire. As a result of this2007 event, few respondents appeared to have been spared the consequences of this event, with 14.5%of the respondents replying that they have not experienced any sort of damage, and 11.1% replyingthat there was no damage due to coastal flooding. As these two answers should theoretically coincide,the slight difference points out that there is some confusion regarding flood type among local people,who may not necessarily distinguish the mechanism behind the floods.
From the results, it is clear that events where the seawater overtops the dykes and floodsvulnerable communities adjacent to Jakarta bay are already taking place. Figure 8c shows that,according to respondents, the frequency of coastal floods is between once a week to once every few years,indicating that the chance of inundation is not uniformly distributed even in this small community.
Regarding the most severe flood they had experienced during their lives, 95% of respondentsreplied that water was 1 m deep or more (Figure 8d). As the authors had not originally foreseen thatsuch deep inundation was taking place, the questionnaire could not accurately capture the ranges forhigher inundations. Nevertheless, some respondents indicated that the flood waters reached up to thefirst floor of their houses, which would represent a maximum inundation of nearly 2 m.
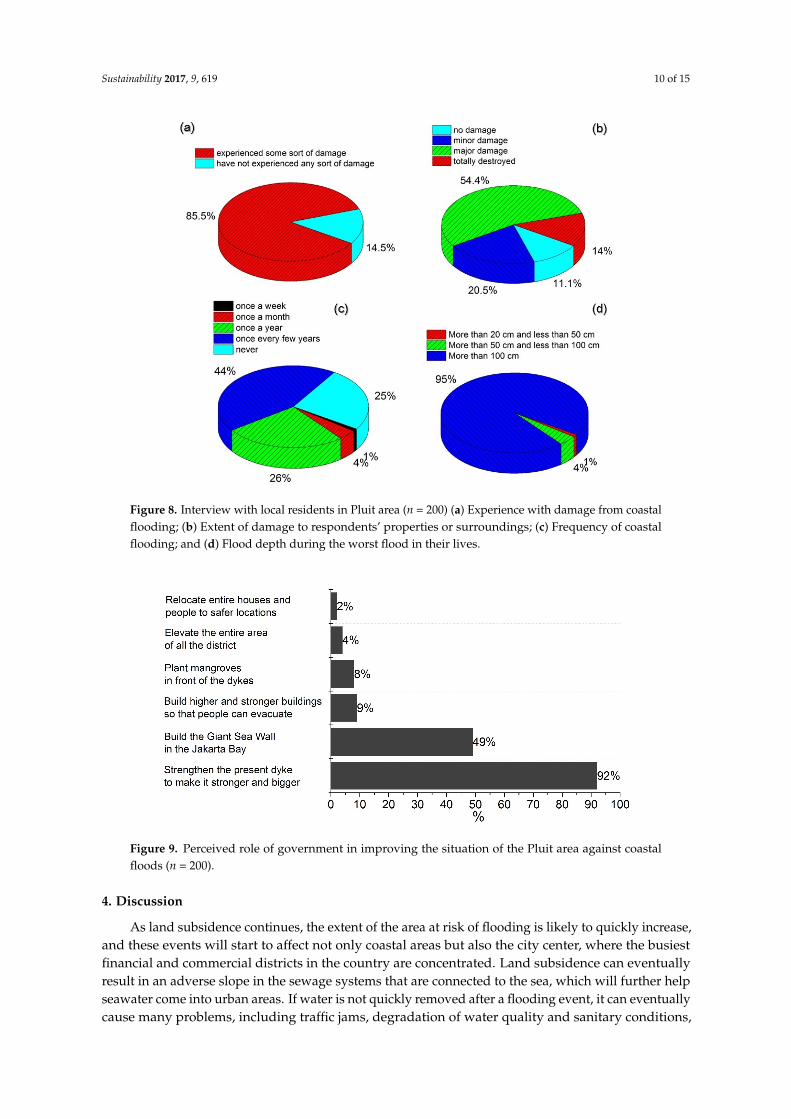
Finally, respondents were also asked about what measures the government should implement toaddress the issue of flooding in the Pluit district (Figure 9), with most of them indicating that the dykeshould be strengthened, and about half of respondents also favoring an even bigger “seawall” in theJakarta bay (as will be discussed later).
Sustainability 2017, 9, 619 10 of 15Sustainability 2017, 9, 619 10 of 15Sustainability 2017, 9, 619 10 of 14
Figure 8. Interview with local residents in Pluit area (n = 200) (a) Experience with damage from coastal flooding; (b) Extent of damage to respondents’ properties or surroundings; (c) Frequency of coastal flooding; and (d) Flood depth during the worst flood in their lives.
Figure 9. Perceived role of government in improving the situation of the Pluit area against coastal floods (n = 200).
4. Discussion
As land subsidence continues, the extent of the area at risk of flooding is likely to quickly increase, and these events will start to affect not only coastal areas but also the city center, where the busiest financial and commercial districts in the country are concentrated. Land subsidence can eventually result in an adverse slope in the sewage systems that are connected to the sea, which will further help seawater come into urban areas. If water is not quickly removed after a flooding event, it can eventually cause many problems, including traffic jams, degradation of water quality and sanitary conditions, disease outbreaks (e.g., dengue fever, cholera), and electric blackouts, which can
Figure 8. Interview with local residents in Pluit area (n = 200) (a) Experience with damage from coastalflooding; (b) Extent of damage to respondents’ properties or surroundings; (c) Frequency of coastalflooding; and (d) Flood depth during the worst flood in their lives.
Sustainability 2017, 9, 619 10 of 14
Figure 8. Interview with local residents in Pluit area (n = 200) (a) Experience with damage from coastal flooding; (b) Extent of damage to respondents’ properties or surroundings; (c) Frequency of coastal flooding; and (d) Flood depth during the worst flood in their lives.
Figure 9. Perceived role of government in improving the situation of the Pluit area against coastal floods (n = 200).
4. Discussion
As land subsidence continues, the extent of the area at risk of flooding is likely to quickly increase, and these events will start to affect not only coastal areas but also the city center, where the busiest financial and commercial districts in the country are concentrated. Land subsidence can eventually result in an adverse slope in the sewage systems that are connected to the sea, which will further help seawater come into urban areas. If water is not quickly removed after a flooding event, it can eventually cause many problems, including traffic jams, degradation of water quality and sanitary conditions, disease outbreaks (e.g., dengue fever, cholera), and electric blackouts, which can
Figure 9. Perceived role of government in improving the situation of the Pluit area against coastalfloods (n = 200).
4. Discussion
As land subsidence continues, the extent of the area at risk of flooding is likely to quickly increase,and these events will start to affect not only coastal areas but also the city center, where the busiestfinancial and commercial districts in the country are concentrated. Land subsidence can eventuallyresult in an adverse slope in the sewage systems that are connected to the sea, which will further helpseawater come into urban areas. If water is not quickly removed after a flooding event, it can eventuallycause many problems, including traffic jams, degradation of water quality and sanitary conditions,
Figure 8. Interview with local residents in Pluit area (n = 200) (a) Experience with damage from coastalflooding; (b) Extent of damage to respondents’ properties or surroundings; (c) Frequency of coastalflooding; and (d) Flood depth during the worst flood in their lives.
Sustainability 2017, 9, 619 10 of 15Sustainability 2017, 9, 619 10 of 14
Figure 8. Interview with local residents in Pluit area (n = 200) (a) Experience with damage from coastal flooding; (b) Extent of damage to respondents’ properties or surroundings; (c) Frequency of coastal flooding; and (d) Flood depth during the worst flood in their lives.
Figure 9. Perceived role of government in improving the situation of the Pluit area against coastal floods (n = 200).
4. Discussion
As land subsidence continues, the extent of the area at risk of flooding is likely to quickly increase, and these events will start to affect not only coastal areas but also the city center, where the busiest financial and commercial districts in the country are concentrated. Land subsidence can eventually result in an adverse slope in the sewage systems that are connected to the sea, which will further help seawater come into urban areas. If water is not quickly removed after a flooding event, it can eventually cause many problems, including traffic jams, degradation of water quality and sanitary conditions, disease outbreaks (e.g., dengue fever, cholera), and electric blackouts, which can
Figure 8. Interview with local residents in Pluit area (n = 200) (a) Experience with damage from coastalflooding; (b) Extent of damage to respondents’ properties or surroundings; (c) Frequency of coastalflooding; and (d) Flood depth during the worst flood in their lives.
Sustainability 2017, 9, 619 10 of 14
Figure 8. Interview with local residents in Pluit area (n = 200) (a) Experience with damage from coastal flooding; (b) Extent of damage to respondents’ properties or surroundings; (c) Frequency of coastal flooding; and (d) Flood depth during the worst flood in their lives.
Figure 9. Perceived role of government in improving the situation of the Pluit area against coastal floods (n = 200).
4. Discussion
As land subsidence continues, the extent of the area at risk of flooding is likely to quickly increase, and these events will start to affect not only coastal areas but also the city center, where the busiest financial and commercial districts in the country are concentrated. Land subsidence can eventually result in an adverse slope in the sewage systems that are connected to the sea, which will further help seawater come into urban areas. If water is not quickly removed after a flooding event, it can eventually cause many problems, including traffic jams, degradation of water quality and sanitary conditions, disease outbreaks (e.g., dengue fever, cholera), and electric blackouts, which can
Figure 9. Perceived role of government in improving the situation of the Pluit area against coastalfloods (n = 200).
4. Discussion
As land subsidence continues, the extent of the area at risk of flooding is likely to quickly increase,and these events will start to affect not only coastal areas but also the city center, where the busiestfinancial and commercial districts in the country are concentrated. Land subsidence can eventuallyresult in an adverse slope in the sewage systems that are connected to the sea, which will further helpseawater come into urban areas. If water is not quickly removed after a flooding event, it can eventuallycause many problems, including traffic jams, degradation of water quality and sanitary conditions,

Sustainability 2017, 9, 619 11 of 15
disease outbreaks (e.g., dengue fever, cholera), and electric blackouts, which can lead to significanteconomic and human risks. If heavy rain or fluvial floods coincide with the timing of an extensivecoastal flood, the combined event could have catastrophic consequences to the Jakarta metropolitanarea. To respond to the possibility of unprecedented floods taking place in the future, large numbers ofpumping stations would need to be installed to remove the huge quantities of seawater that couldaccumulate behind the dykes.
The NCICD has urged policy makers and municipal officials to prioritize attempting to solve thecurrent land-subsidence problem. Nevertheless, effective and tangible countermeasures against landsubsidence have yet to be implemented, and would obviously require alternative provisions of cleanwater, in itself not easy given that this is a megacity with a population of over 10 million. Otherwise,the NCICD program has also proposed a comprehensive roadmap to eliminate coastal floods, which iscomposed of multiple phases over the next four decades. The first stage of the project, referred to as“phase A”, aims to strengthen current sea walls and build new dykes during the course of the next10 years, costing about $1.9 billion [7].
As corroborated by the present study, a similar project in Jakarta would be expected to contributeto the reduction of flood damage, at least over the course of the next 10 to 20 years. The authors’questionnaire survey confirmed that local people consider that the strengthening of the present dykeshould be the first countermeasure to be implemented (Figure 9).
However, the possibility of extensive floods affecting the region would resurface by the middle ofthe 21st century if land subsidence continues, potentially allowing seawater to reach several kilometersinland, effectively affecting downtown Jakarta. For instance, due to land subsidence, a 3-m dykewould completely lose its flood-protecting function by the year 2040.
It is obvious that the higher the dyke, the greater the flood mitigation functionality. Indeed, theresults for a 5-m dyke demonstrate that it would be effective to almost completely protect coastalareas until 2050 (Figure 7). However, as Figure 10a illustrates, SLR and land subsidence will bothincrease the relative difference between the sea surface and the ground, which would create the riskof a dyke-break induced tsunami taking place [28]. Although analyzing the structural stability of thedykes is out of the scope of this study, the thin coastal dykes found in many communities of Jakartacould suddenly collapse due to material aging, the occurrence of high waves, SLR, land subsidence,landslides, a collision with ships, earthquakes, or other adverse mechanisms. Takagi et al. [28] inthe course of their field visits investigated the thin dyke (with the height of 1.8 m) that protects thePluit area, and already found that there is substantial leakage of seawater through a concrete joint.As even such a relatively low dyke is not capable of completely holding back seawater, there are seriousquestions about what could happen during the lifetime of a 5-m high dyke that made use of similarconstruction techniques, which could potentially be structurally unstable and even less impermeable.
The NCICD [7] has also proposed a second stage of the project, Phase B, which is collectivelycalled the Giant Sea Wall and Great Garuda project. This project involves the construction of anouter seawall over 35 km long and land reclamation of 1.250 ha, which will attempt to protect Jakartaagainst coastal floods by creating a large water storage basin between the sea and the land. Manyconcerns have been voiced by local residents, activists, and scientists about the impacts of such aproject [30,31], though, according to our questionnaire survey, over half of respondents support thesemassive national projects, rather than more reasonable solutions such as constructing higher buildings,planting mangroves, or raising the lands.
It is worth noting, however, that there are a number of other grave concerns relating to suchan ambitious project. In the event that the great seawalls fail to shut out seawater or the project issuspended or postponed due to economic turmoil, engineering difficulties, environmental impact, orpolitical decisions, and assuming that efforts to reduce land subsidence are not carried out, downtownJakarta would eventually become submerged. This could result in environmental displacement [32,33],eventually forcing the relocation of hundreds of thousands, if not millions, of Jakarta’s citizens, unlessalternative adaptation strategies could be attempted.

Sustainability 2017, 9, 619 12 of 15
To make matters worse, contemplating such grandiose national plans could lower the awarenessamongst people of the most pressing problem, which is clearly land subsidence. The constructionof a dyke along the perimeter of the city could dilute these concerns and the necessity to implementmeasures to stop ground water extraction.
If the Phase A project is implemented, this will mean that Jakarta will follow the path of Tokyo,Japan, which experienced similar land subsidence over the course of the 20th century, resulting in theconstruction of large dykes and many pumping stations to protect areas such as Koto and Edogawawards (currently 2–4 m under sea level, [34]). However, the robustness of the dykes in Tokyo appearsto be much more reliable than those found in Jakarta. If Jakarta was to prioritize hard structures,far more robust dykes should be built, similar, for example, to those protecting low-lying coasts inTokyo (Figure 10b).
Sustainability 2017, 9, 619 12 of 15
To make matters worse, contemplating such grandiose national plans could lower the awarenessamongst people of the most pressing problem, which is clearly land subsidence. The constructionof a dyke along the perimeter of the city could dilute these concerns and the necessity to implementmeasures to stop ground water extraction.
If the Phase A project is implemented, this will mean that Jakarta will follow the path of Tokyo,Japan, which experienced similar land subsidence over the course of the 20th century, resulting in theconstruction of large dykes and many pumping stations to protect areas such as Koto and Edogawawards (currently 2–4 m under sea level, [34]). However, the robustness of the dykes in Tokyo appearsto be much more reliable than those found in Jakarta. If Jakarta was to prioritize hard structures, farmore robust dykes should be built, similar, for example, to those protecting low-lying coasts in Tokyo(Figure 10b).
Sustainability 2017, 9, 619 12 of 14
a dyke along the perimeter of the city could dilute these concerns and the necessity to implement measures to stop ground water extraction.
If the Phase A project is implemented, this will mean that Jakarta will follow the path of Tokyo, Japan, which experienced similar land subsidence over the course of the 20th century, resulting in the construction of large dykes and many pumping stations to protect areas such as Koto and Edogawa wards (currently 2–4 m under sea level, [34]). However, the robustness of the dykes in Tokyo appears to be much more reliable than those found in Jakarta. If Jakarta was to prioritize hard structures, far more robust dykes should be built, similar, for example, to those protecting low-lying coasts in Tokyo (Figure 10b).
(a) (b)
Figure 10. (a) Illustration showing a sinking coastal community protected by a 5-meter thin dyke, such as the ones currently used in Jakarta; (b) Robust coastal dyke defending Koto ward in Tokyo (note that the houses on the left are a few meters below sea level).
5. Conclusions
The present study projected coastal floods around Jakarta until the year 2050 to address concerns over how long the dykes will remain effective under the rapid land subsidence being experienced in Jakarta. To do so, the authors developed a coastal hydrodynamic model that considers land subsidence, sea-level rise, and tidal range. The tidal constituents were adjusted to reproduce the observed abnormal tides that took place in November 2007 and which lead to extensive coastal flooding. The changing effectiveness of the dykes over the coming decades was investigated by assuming multiple coastal protection scenarios, including a long dyke being built along the coastline of Jakarta, with heights ranging from 1 m to 5 m. Two further scenarios were considered, one where land subsidence was stopped by 2030, and the other where it continued past this date. The simulations showed that the dyke can effectively prevent coastal floods in the early stage of its lifetime, though it would soon lose its effectiveness unless land subsidence is stopped. Once seawater overflows the dyke, extensive flooding would immediately occur, potentially reaching a few kilometers inland into downtown Jakarta. For example, a 3-m dyke is expected to be sufficiently high for present day conditions, but it would have entirely lost its flood-protecting function by the year 2040. On the other hand, even a short structure such as a 1-m dyke is expected to stop coastal floods if land subsidence is stopped. Hence, the present study demonstrates that any actions that attempts to stop land subsidence would be the most effective countermeasure to mitigate future coastal floods, and should clearly be prioritized by the national government.
Acknowledgments: Funding for this research was supported by grants to Tokyo Institute of Technology from the Technology Development Fund (S-14) of the Ministry of the Environment Japan and JSPS KAKENHI (16KK0121, 26702009).
Author Contributions: H.T. conceived and designed the research objectives and methods; H.T., D.F. and X.Y. performed the numerical simulations; M.E. and H.T. designed the questionnaire survey and analyzed the data; H.T. and M.E. wrote the paper.
Conflicts of Interest: The authors declare no conflict of interest.
Figure 10. (a) Illustration showing a sinking coastal community protected by a 5-meter thin dyke, suchas the ones currently used in Jakarta; (b) Robust coastal dyke defending Koto ward in Tokyo (note thatthe houses on the left are a few meters below sea level).
5. Conclusions
The present study projected coastal floods around Jakarta until the year 2050 to address concernsover how long the dykes will remain effective under the rapid land subsidence being experienced inJakarta. To do so, the authors developed a coastal hydrodynamic model that considers land subsidence,sea-level rise, and tidal range. The tidal constituents were adjusted to reproduce the observed abnormaltides that took place in November 2007 and which lead to extensive coastal flooding. The changingeffectiveness of the dykes over the coming decades was investigated by assuming multiple coastalprotection scenarios, including a long dyke being built along the coastline of Jakarta, with heightsranging from 1 m to 5 m. Two further scenarios were considered, one where land subsidence wasstopped by 2030, and the other where it continued past this date. The simulations showed that thedyke can effectively prevent coastal floods in the early stage of its lifetime, though it would soonlose its effectiveness unless land subsidence is stopped. Once seawater overflows the dyke, extensiveflooding would immediately occur, potentially reaching a few kilometers inland into downtownJakarta. For example, a 3-m dyke is expected to be sufficiently high for present day conditions, but itwould have entirely lost its flood-protecting function by the year 2040. On the other hand, even a shortstructure such as a 1-m dyke is expected to stop coastal floods if land subsidence is stopped. Hence,the present study demonstrates that any actions that attempts to stop land subsidence would be themost effective countermeasure to mitigate future coastal floods, and should clearly be prioritized bythe national government.
Acknowledgments: Funding for this research was supported by grants to Tokyo Institute of Technology fromthe Technology Development Fund (S-14) of the Ministry of the Environment Japan and JSPS KAKENHI(16KK0121, 26702009).
Figure 10. (a) Illustration showing a sinking coastal community protected by a 5-meter thin dyke, suchas the ones currently used in Jakarta; (b) Robust coastal dyke defending Koto ward in Tokyo (note thatthe houses on the left are a few meters below sea level).
5. Conclusions
The present study projected coastal floods around Jakarta until the year 2050 to address concernsover how long the dykes will remain effective under the rapid land subsidence being experienced inJakarta. To do so, the authors developed a coastal hydrodynamic model that considers land subsidence,sea-level rise, and tidal range. The tidal constituents were adjusted to reproduce the observed abnormaltides that took place in November 2007 and which lead to extensive coastal flooding. The changingeffectiveness of the dykes over the coming decades was investigated by assuming multiple coastalprotection scenarios, including a long dyke being built along the coastline of Jakarta, with heightsranging from 1 m to 5 m. Two further scenarios were considered, one where land subsidence wasstopped by 2030, and the other where it continued past this date. The simulations showed that thedyke can effectively prevent coastal floods in the early stage of its lifetime, though it would soonlose its effectiveness unless land subsidence is stopped. Once seawater overflows the dyke, extensiveflooding would immediately occur, potentially reaching a few kilometers inland into downtownJakarta. For example, a 3-m dyke is expected to be sufficiently high for present day conditions, but itwould have entirely lost its flood-protecting function by the year 2040. On the other hand, even a shortstructure such as a 1-m dyke is expected to stop coastal floods if land subsidence is stopped. Hence,the present study demonstrates that any actions that attempts to stop land subsidence would be themost effective countermeasure to mitigate future coastal floods, and should clearly be prioritized bythe national government.
Acknowledgments: Funding for this research was supported by grants to Tokyo Institute of Technology from theTechnology Development Fund (S-14) of the Ministry of the Environment Japan and JSPS KAKENHI (16KK0121,26702009).

Sustainability 2017, 9, 619 13 of 15
Author Contributions: H.T. conceived and designed the research objectives and methods; H.T., D.F. and X.Y.performed the numerical simulations; M.E. and H.T. designed the questionnaire survey and analyzed the data;H.T. and M.E. wrote the paper.
Conflicts of Interest: The authors declare no conflict of interest.
Appendix A
Sustainability 2017, 9, 619 13 of 15
Author Contributions: H.T. conceived and designed the research objectives and methods; H.T., D.F. and X.Y.performed the numerical simulations; M.E. and H.T. designed the questionnaire survey and analyzed the data;H.T. and M.E. wrote the paper.
Conflicts of Interest: The authors declare no conflict of interest.
Appendix
Sustainability 2017, 9, 619 13 of 14
Appendix A
Figure A1. Estimated annual land subsidence rates in Jakarta (after Takagi et al. [12]). The discontinuous blue line shows the area in which the rate of land subsidence was estimated, using data from global positioning system (GPS) subsidence monitoring stations, indicated by the black dots. The thin line in the upper part indicates the coastline.
References
1. Braadbaart, O.; Braadbaart, F. Policing the Urban Pumping Race: Industrial Groundwater Overexploitation in Indonesia. World Dev. 1997, 25, 199–210.
2. Brinkman, J. Jakarta Coastal Defense Strategy (JCDS) study. In Proceedings of the PPPs second workshop on Peatland subsidence and flooding modelling, Banjarmasin, Indonesia, 31 January 2012; pp. 59–95.
3. Chaussard, E.; Amelung, F.; Adibin, H.; Hong, S.-H. Sinking cities in Indonesia: ALOS PALSAR detects rapid subsidence due to groundwater and gas extraction. Remote Sens. Environ. 2013, 128, 150–161.
4. Church, J.A.; Clark, P.U.; Cazenave, A.; Gregory, J.M.; Jevrejeva, S.; Levermann, A.; Merrifield, M.A.; Milne, G.A.; Nerem, R.S.; Nunn, P.D.; et al. Sea Level Change. In: Climate Change 2013: The Physical Science Basis; Contribution of Working Group I to the Fifth Assessment Report of the Intergovernmental Panel on Climate Change; Cambridge University Press: New York, NY, USA, 2013.
5. Deltares. User Manual Delft3D-FLOW—Simulation of Multi-Dimensional Hydrodynamic Flows and Transport Phenomena, Including Sediments; Deltares: Delft, The Netherlands, 2011; p. 690.
6. Djaja, R.; Rais, J.; Abidin, Z.H.; Wedyanto, K. Land subsidence of Jakarta Metropolitan Area. In Proceedings of the 3rd FIG Regional Conference, Jakarta, Indonesia, 3–7 October 2004; p. 14.
7. Egbert, G.D.; Erofeeva, S.Y. Efficient inverse modeling of barotropic ocean tides. J. Atmos. Ocean Technol. 2002, 19, 183–204.
8. Esteban, M.; Takagi, H.; Jamero, L.; Thao, N.D.; Mikami, T.; Onuki, M.; Yamamoto, L. Adaptation to Sea Level Rise in Cities: Lessons from Present Examples of Land Subsidence. In Proceedings of the Coasts, Marine Structures and Breakwaters 2017, Liverpool, UK, 6–7 September 2017.
9. GEBCO (General Bathymetric Chart of the Oceans). Centenary Edition of the GEBCO Digital Atlas, published on CD-ROM on behalf of the Intergovernmental Oceanographic Commission and the International Hydrographic Organization as part of the General Bathymetric Chart of the Oceans; British Oceanographic Data Centre: Liverpool, UK, 2003.
10. Jamero, L.M.; Esteban, M.; Onuki, M. Potential in-Situ Adaptation Strategis for Climate-Related Sea-Level Rise: Insights from a Small Islan in The Philippines Experiencing Earthquake Induced Land Subsidence. Int. J. Sustain. Futur. Hum. Secur. 2016, 47, 44–53.
11. Jarvis, A.; Reuter, H.I.; Nelson, A.; Guevara, E. Hole-Filled SRTM for the Globe Version 4, CGIAR-CSI SRTM 90m Database, 2008. Available online: http://srtm.csi.cgiar.org (accessed on 1 May 2016).
12. Jayaratne, M.P.R.; Premaratne, B.; Adewale, A.; Mikami, T.; Matsuba, S.; Shibayama, T.; Esteban, M.; Nistor, I. Failure Mechanisms and Local Scour at Coastal Structures Induced by Tsunami. Coast. Eng. J. 2016, 581, 1640017.
13. Jakarta Coastal Development Strategy (JCDS). End-of-Project Review-Final Mission Report; NL Agency: Utrecht, The Netherlands, 2012; p. 33.
14. JICA (Japan International Cooperation Agency). The Institutional Revitalization Project for Flood Management in JABODETABEK; Technical Cooperation Report; JICA: Tokyo, Japan, 2006; p. 52.
Figure A1. Estimated annual land subsidence rates in Jakarta (after Takagi et al. [12]).The discontinuous blue line shows the area in which the rate of land subsidence was estimated,using data from global positioning system (GPS) subsidence monitoring stations, indicated by theblack dots. The thin line in the upper part indicates the coastline.
References
1. Braadbaart, O.; Braadbaart, F. Policing the Urban Pumping Race: Industrial Groundwater Overexploitationin Indonesia. World Dev. 1997, 25, 199–210. [CrossRef]
2. Brinkman, J. Jakarta Coastal Defense Strategy (JCDS) study. In Proceedings of the PPPs second workshop onPeatland subsidence and flooding modelling, Banjarmasin, Indonesia, 31 January 2012; pp. 59–95.
3. Chaussard, E.; Amelung, F.; Adibin, H.; Hong, S.-H. Sinking cities in Indonesia: ALOS PALSAR detects rapidsubsidence due to groundwater and gas extraction. Remote Sens. Environ. 2013, 128, 150–161. [CrossRef]
4. Church, J.A.; Clark, P.U.; Cazenave, A.; Gregory, J.M.; Jevrejeva, S.; Levermann, A.; Merrifield, M.A.;Milne, G.A.; Nerem, R.S.; Nunn, P.D.; et al. Sea Level Change. In Climate Change 2013: The Physical ScienceBasis; Contribution of Working Group I to the Fifth Assessment Report of the Intergovernmental Panel onClimate Change; Cambridge University Press: New York, NY, USA, 2013.
5. Deltares. User Manual Delft3D-FLOW—Simulation of Multi-Dimensional Hydrodynamic Flows and TransportPhenomena, Including Sediments; Deltares: Delft, The Netherlands, 2011; p. 690.
6. Djaja, R.; Rais, J.; Abidin, Z.H.; Wedyanto, K. Land subsidence of Jakarta Metropolitan Area. In Proceedingsof the 3rd FIG Regional Conference, Jakarta, Indonesia, 3–7 October 2004; p. 14.
7. Egbert, G.D.; Erofeeva, S.Y. Efficient inverse modeling of barotropic ocean tides. J. Atmos. Ocean Technol.2002, 19, 183–204. [CrossRef]
8. Esteban, M.; Takagi, H.; Jamero, L.; Thao, N.D.; Mikami, T.; Onuki, M.; Yamamoto, L. Adaptation to SeaLevel Rise in Cities: Lessons from Present Examples of Land Subsidence. In Proceedings of the Coasts,Marine Structures and Breakwaters 2017, Liverpool, UK, 6–7 September 2017.
9. GEBCO (General Bathymetric Chart of the Oceans). Centenary Edition of the GEBCO Digital Atlas, publishedon CD-ROM on behalf of the Intergovernmental Oceanographic Commission and the International HydrographicOrganization as part of the General Bathymetric Chart of the Oceans; British Oceanographic Data Centre: Liverpool,UK, 2003.
10. Jamero, L.M.; Esteban, M.; Onuki, M. Potential in-Situ Adaptation Strategis for Climate-Related Sea-LevelRise: Insights from a Small Islan in The Philippines Experiencing Earthquake Induced Land Subsidence.Int. J. Sustain. Future Hum. Secur. 2016, 47, 44–53.
11. Jarvis, A.; Reuter, H.I.; Nelson, A.; Guevara, E. Hole-Filled SRTM for the Globe Version 4, CGIAR-CSI SRTM90m Database. 2008. Available online: http://srtm.csi.cgiar.org (accessed on 1 May 2016).
Figure A1. Estimated annual land subsidence rates in Jakarta (after Takagi et al. [12]). The discontinuousblue line shows the area in which the rate of land subsidence was estimated, using data from globalpositioning system (GPS) subsidence monitoring stations, indicated by the black dots. The thin line inthe upper part indicates the coastline.
References
1. Pravitasari, A.M.; Saizen, I.; Rustiadi, E. Towards Resilience of Jabodetabek Megacity: Developing LocalSustainability Index with Considering Local Spatial Interdependency. Int. J. Sustain. Futur. Hum. Secur. 2016,4, 27–34.
2. Chaussard, E.; Amelung, F.; Adibin, H.; Hong, S.-H. Sinking cities in Indonesia: ALOS PALSAR detects rapidsubsidence due to groundwater and gas extraction. Remote Sens. Environ. 2013, 128, 150–161. [CrossRef]
3. Land Bureau Japan. Ground Water Map—Chiba Tokyo Kanagawa Prefectures District; Land Bureau Japan: Tokyo,Japan, 1996; p. 142.
4. Phi, T.H.; Strokova, L.A. Prediction maps of land subsidence caused by groundwater exploitation in Hanoi,Vietnam. Resour. Effic. Technol. 2015, 1, 80–89. [CrossRef]
5. Phien-Wej, N.; Giao, P.H.; Nutalaya, P. Land subsidence in Bangkok, Thailand. Eng. Geol. 2006, 82, 187–201.[CrossRef]
6. Takagi, H.; Thao, N.D.; Anh, L.T. Sea-Level Rise and Land Subsidence: Impacts on Flood Projections for theMekong Delta’s Largest City. Sustainability 2016, 8, 15. [CrossRef]
7. NCICD (National Capital Integrated Coastal Development). Master Plan of National Capital Integrated CoastalDevelopment 2014; NCICD: Jakarta, Indonesia, 1998; p. 114.
8. Braadbaart, O.; Braadbaart, F. Policing the Urban Pumping Race: Industrial Groundwater Overexploitationin Indonesia. World Dev. 1997, 25, 199–210. [CrossRef]
9. Ng, A.H.-M.; Ge, L.; Li, X.; Abidin, H.Z.; Andreas, H.; Zhang, K. Mapping land subsidence in Jakarta,Indonesia using persistent scatterer interferometry (PSI) technique with ALOS PALSAR. Int. J. Appl. EarthObs. Geoinf. 2012, 18, 232–242. [CrossRef]
10. Swiss Re. Mind the Risk—A Global Ranking of Cities under Threat from Natural Disasters; Swiss ReinsuranceCompany Ltd.: Zurich, Switzerland, 2013; p. 39.
11. Brinkman, J. Jakarta Coastal Defense Strategy (JCDS) study. In Proceedings of the PPPs second workshop onPeatland subsidence and flooding modelling, Banjarmasin, Indonesia, 31 January 2012; pp. 59–95.
12. Takagi, H.; Esteban, M.; Mikami, T.; Fujii, D. Projection of coastal floods in 2050 Jakarta. Urban Clim. 2016, 17,135–145. [CrossRef]
Sustainability 2017, 9, 619 14 of 15
13. Ministry of National Development Planning. Regulation of the President of the Republic of Indonesia, Number 5of 2010 Regarding the National Medium-term Development Plan (RPJNM) 2010–2014, Book I, National Priorities;Ministry of National Development Planning: Jakarta, Indonesia, 2010; p. 96.
14. Djaja, R.; Rais, J.; Abidin, Z.H.; Wedyanto, K. Land subsidence of Jakarta Metropolitan Area. In Proceedingsof the 3rd FIG Regional Conference, Jakarta, Indonesia, 3–7 October 2004; p. 14.
15. Moe, I.R.; Kure, S.; Januriyadi, N.F.; Farid, M.; Udo, K.; Kazama, S.; Koshimura, S. Effect of land subsidenceon flood inundation in Jakarta, Indonesia. J. Jpn. Soc. Civ. Eng. Ser. G Environ. Res. 2016, 72, 283–289.[CrossRef]
16. Church, J.A.; Clark, P.U.; Cazenave, A.; Gregory, J.M.; Jevrejeva, S.; Levermann, A.; Merrifield, M.A.;Milne, G.A.; Nerem, R.S.; Nunn, P.D.; et al. Sea Level Change. In Climate Change 2013: The Physical ScienceBasis; Contribution of Working Group I to the Fifth Assessment Report of the Intergovernmental Panel onClimate Change; Cambridge University Press: New York, NY, USA, 2013.
17. Jayaratne, M.P.R.; Premaratne, B.; Adewale, A.; Mikami, T.; Matsuba, S.; Shibayama, T.; Esteban, M.; Nistor, I.Failure Mechanisms and Local Scour at Coastal Structures Induced by Tsunami. Coast. Eng. J. 2016, 581,1640017. [CrossRef]
18. Mikami, T.; Shibayama, T.; Takagi, H.; Matsumaru, R.; Esteban, M.; Nguyen, D.T.; de Leon, M.;Valenzuela, V.P.; Oyama, T.; Nakamura, R.; et al. Storm Surge Heights and Damage Caused by the 2013Typhoon Haiyan along the Leyte Gulf Coast. Coast. Eng. J. 2016, 58, 1640005. [CrossRef]
19. Takagi, H.; Bricker, J. Assessment of the Effectiveness of General Breakwaters in Reducing TsunamiInundation in Ishinomaki. Coast. Eng. J. 2014, 56, 1450018. [CrossRef]
20. Deltares. User Manual Delft3D-FLOW—Simulation of Multi-Dimensional Hydrodynamic Flows and TransportPhenomena, Including Sediments; Deltares: Delft, The Netherlands, 2011; p. 690.
21. Jarvis, A.; Reuter, H.I.; Nelson, A.; Guevara, E. Hole-Filled SRTM for the Globe Version 4, CGIAR-CSI SRTM90m Database. 2008. Available online: http://srtm.csi.cgiar.org (accessed on 1 May 2016).
22. GEBCO (General Bathymetric Chart of the Oceans). Centenary Edition of the GEBCO Digital Atlas, publishedon CD-ROM on behalf of the Intergovernmental Oceanographic Commission and the International HydrographicOrganization as part of the General Bathymetric Chart of the Oceans; British Oceanographic Data Centre: Liverpool,UK, 2003.
23. Egbert, G.D.; Erofeeva, S.Y. Efficient inverse modeling of barotropic ocean tides. J. Atmos. Ocean Technol.2002, 19, 183–204. [CrossRef]
24. Jakarta Coastal Development Strategy (JCDS). End-of-Project Review-Final Mission Report; NL Agency: Utrecht,The Netherlands, 2012; p. 33.
25. Wong, P.P.; Losada, I.J.; Gattuso, J.-P.; Hinkel, J.; Khattabi, A.; McInnes, K.L.; Saito, Y.; Sallenger, A. Coastalsystems and low-lying areas. In Climate Change 2014: Impacts, Adaptation, and Vulnerability. Part A: Global andSectoral Aspects; Contribution of Working Group II to the Fifth Assessment Report of the IntergovernmentalPanel on Climate Change; Cambridge University Press: Cambridge, UK, 2014; pp. 361–409.
26. Ningsih, N.S.; Suryo, W.; Anugrah, S.D. Study on characteristics of residual water level in Jakarta, Semarang,and Surabaya waters – Indonesia and its relation to storm events in November 2007. Int. J. Basic Appl. Sci.2011, 11, 19–25.
27. Takagi, H.; Esteban, M.; Shibayama, T.; Mikami, T.; Matsumaru, R.; Nguyen, D.T.; Oyama, T.; Nakamura, R.Track analysis, simulation and field survey of the 2013 typhoon Haiyan storm surge. J. Flood Risk Manag.2017, 10, 42–52. [CrossRef]
28. Takagi, H.; Mikami, T.; Fujii, D.; Esteban, M.; Kurobe, S. Mangrove forest against dyke-break-inducedtsunami on rapidly subsiding coasts. Nat. Hazards Earth Syst. 2016, 16, 1629–1638. [CrossRef]
29. JICA (Japan International Cooperation Agency). The Institutional Revitalization Project for Flood Management inJABODETABEK; Technical Cooperation Report; JICA: Tokyo, Japan, 2006; p. 52.
30. Sherwell, P. $40bn to Save Jakarta: The Story of the Great Garuda. The Guardian. 2016. Available online:https://www.theguardian.com/cities/2016/nov/22/jakarta-great-garuda-seawall-sinking (accessed on11 February 2017).
31. Van der Wulp, S.A.; Dsikowitzky, L.; Hesse, K.J.; Schwarzbauer, J. Master Plan Jakarta, Indonesia: The GiantSeawall and the need for structural treatment of municipal waste water. Mar. Pollut. Bull. 2016, 110, 686–693.[CrossRef] [PubMed]
Sustainability 2017, 9, 619 15 of 15
32. Jamero, L.M.; Esteban, M.; Onuki, M. Potential in-Situ Adaptation Strategis for Climate-Related Sea-LevelRise: Insights from a Small Islan in The Philippines Experiencing Earthquake Induced Land Subsidence.Int. J. Sustain. Futur. Hum. Secur. 2016, 47, 44–53.
33. Yamamoto, L. Environmental displacement in Vietnam. In Coastal Disasters and Climate Change in Vietnam:Engineering and Planning Perspectives; Thao, N.D., Takagi, H., Esteban, M., Eds.; Elsevier: New York, NY,USA, 2014; pp. 379–393.
34. Esteban, M.; Takagi, H.; Jamero, L.; Thao, N.D.; Mikami, T.; Onuki, M.; Yamamoto, L. Adaptation to SeaLevel Rise in Cities: Lessons from Present Examples of Land Subsidence. In Proceedings of the Coasts,Marine Structures and Breakwaters 2017, Liverpool, UK, 6–7 September 2017.
© 2017 by the authors. Licensee MDPI, Basel, Switzerland. This article is an open accessarticle distributed under the terms and conditions of the Creative Commons Attribution(CC BY) license (http://creativecommons.org/licenses/by/4.0/).