effectiveness of a childhood obesity prevention … · delivered through schools, targeting 6 and 7...
TRANSCRIPT
the bmj | BMJ 2018;360:k211 | doi: 10.1136/bmj.j3984 1
RESEARCH
Effectiveness of a childhood obesity prevention programme delivered through schools, targeting 6 and 7 year olds: cluster randomised controlled trial (WAVES study)Peymane Adab,1 Miranda J Pallan,1 Emma R Lancashire,1 Karla Hemming,1 Emma Frew,1 Tim Barrett,2 Raj Bhopal,3 Janet E Cade,4 Alastair Canaway,5 Joanne L Clarke,1 Amanda Daley,1 Jonathan J Deeks,1 Joan L Duda,6 Ulf Ekelund,7,8 Paramjit Gill,1 Tania Griffin,1 Eleanor McGee,9 Kiya Hurley,1 James Martin,1 Jayne Parry,1 Sandra Passmore,10 K K Cheng1
ABSTRACTOBJECTIVETo assess the effectiveness of a school and family based healthy lifestyle programme (WAVES intervention) compared with usual practice, in preventing childhood obesity.DESIGNCluster randomised controlled trial.SETTINGUK primary schools from the West Midlands.PARTICIPANTS200 schools were randomly selected from all state run primary schools within 35 miles of the study centre (n=980), oversampling those with high minority ethnic populations. These schools were randomly ordered and sequentially invited to participate. 144 eligible schools were approached to achieve the target recruitment of 54 schools. After baseline measurements 1467 year 1 pupils aged 5 and 6 years (control: 28 schools, 778 pupils) were randomised, using a blocked balancing algorithm. 53 schools remained in the trial and data on 1287 (87.7%) and 1169 (79.7%) pupils were available at first follow-up (15 month) and second follow-up (30 month), respectively.
INTERVENTIONSThe 12 month intervention encouraged healthy eating and physical activity, including a daily additional 30 minute school time physical activity opportunity, a six week interactive skill based programme in conjunction with Aston Villa football club, signposting of local family physical activity opportunities through mail-outs every six months, and termly school led family workshops on healthy cooking skills.OUTCOME MEASURESThe protocol defined primary outcomes, assessed blind to allocation, were between arm difference in body mass index (BMI) z score at 15 and 30 months. Secondary outcomes were further anthropometric, dietary, physical activity, and psychological measurements, and difference in BMI z score at 39 months in a subset.RESULTSData for primary outcome analyses were: baseline, 54 schools: 1392 pupils (732 controls); first follow-up (15 months post-baseline), 53 schools: 1249 pupils (675 controls); second follow-up (30 months post-baseline), 53 schools: 1145 pupils (621 controls). The mean BMI z score was non-significantly lower in the intervention arm compared with the control arm at 15 months (mean difference −0.075 (95% confidence interval −0.183 to 0.033, P=0.18) in the baseline adjusted models. At 30 months the mean difference was −0.027 (−0.137 to 0.083, P=0.63). There was no statistically significant difference between groups for other anthropometric, dietary, physical activity, or psychological measurements (including assessment of harm).CONCLUSIONSThe primary analyses suggest that this experiential focused intervention had no statistically significant effect on BMI z score or on preventing childhood obesity. Schools are unlikely to impact on the childhood obesity epidemic by incorporating such interventions without wider support across multiple sectors and environments.TRIAL REGISTRATIONCurrent Controlled Trials ISRCTN97000586.
IntroductionExcess weight in childhood is a global problem, affecting around 41 million children under the age of 5 years.1 In addition to physical and psychosocial health consequences in these early years, childhood
For numbered affiliations see end of article.Correspondence to: P Adab [email protected] this as: BMJ 2018;360:k211 http://dx.doi.org/10.1136/bmj.k211
Accepted: 19 December 2017
WhAT IS AlReAdy knoWn on ThIS TopICComprehensive systematic reviews have suggested that school based interventions could be effective in preventing childhood obesity in high income countriesHeterogeneity in intervention components and outcomes limit practical recommendationsFurthermore, inconsistent findings in relation to differential effects on subgroups, and impact on inequalities, limited data on potential harms, process measures, and long term effects, as well as lack of data on cost effectiveness, restrict interpretation and wider applicability
WhAT ThIS STudy AddSThe WAVES study evaluated a theoretically informed, skills based intervention targeting children’s diet and physical activity behaviours through schools and familiesIt did not result in any meaningful effect on adiposity, dietary intake, or physical activity after 15 or 30 monthsAlthough such interventions can fulfil the responsibility of schools for wider education, without upstream support they are unlikely to halt the childhood obesity epidemic

RESEARCH
2 doi: 10.1136/bmj.j3984 | BMJ 2018;360:k211 | the bmj
excess weight is an important predictor of obesity in adulthood,2 with additional adverse health and economic3 effects. In the UK around a quarter of children have excess weight at school entry (age 4 or 5 years).4 The proportion of very overweight children doubles during the subsequent six years (from approximately 9% to 19%),4 highlighting this period as critical for preventive action.
Systematic reviews of childhood obesity prevention studies suggest that school based interventions may be effective in reducing the proportion of children with excess weight.5 6 Heterogeneity of study design and interventions precludes conclusions about which combination of components are likely to be most effective. Nevertheless, overall, longer duration, multicomponent interventions, targeting school curriculums and food and physical activity environments, providing teacher support, and extending activities to the home and community were more likely to be associated with positive results. However, trials to date have had several methodological weaknesses that limit recommendations for widespread implementation.5 In particular, few previous trials reported longer term outcomes, subgroup effects, or cost effectiveness.
We report the results of the West Midlands ActiVe lifestyle and healthy Eating in School children (WAVES) study; a cluster randomised controlled trial evaluating an intervention that aims to prevent excess weight in primary school children. The trial dealt with the main limitations identified in previous research: use of the Medical Research Council framework for complex intervention development and evaluation7; a sample size large enough to detect clinically significant differences in adiposity; a comprehensive process evaluation; assessment of longer term effects, using a range of adiposity and psychosocial measures; and an objective measure of physical activity.
MethodsTrial design and eligibility
This was a school based, cluster randomised, controlled trial evaluating the effectiveness of a complex obesity prevention intervention on primary school children’s body mass index (BMI) z scores at 15 and 30 months after baseline measurements (3 and 18 months post-intervention completion).8
Primary schools in the West Midlands, UK, within 35 miles of the study centre were eligible for inclusion (n=980). The region includes a multiethnic population from diverse socioeconomic backgrounds living in rural and urban areas. We excluded schools with fewer than 17 year 1 (aged 5 and 6 years) pupils (minimum cluster size) or schools in “special measures” (unlikely to have capacity to contribute to study). Within participating schools, all children in year 1 at recruitment were eligible for inclusion.
Interventions and intervention developmentIrrespective of whether children participated in measurements, intervention delivery was at school class level to all eligible children and their families.
The development process of the WAVES study intervention commenced in 2005. We summarised intervention components incorporated in previous childhood obesity prevention trials (70 included studies within eight systematic reviews) in relation to setting, target behaviour, and type of activity. To help prioritise intervention components we then conducted focus groups with parents, school staff, and local health, government, and community members. The discussions considered the perceived importance and feasibility of implementation of techniques (eg, reward behaviours, role model, exposure to opportunities for physical activity), activities (eg, education materials, cooking workshops), and particular settings (eg, school curriculum, community setting). We checked prioritised ideas against available local resources, and the intervention package was formed with input from an expert group of professionals. Thus we balanced the prioritised intervention components (eg, role models to influence behaviour, or family campaigns) with the resources that were readily available in our setting (eg, the Villa Vitality programme described later). This intervention comprised activities within two broad aims: increasing children’s physical activity levels through school and home and supporting the development of health behaviour skills in families through activity based learning.9 The intervention was further refined following a feasibility study.10 That study showed that the proposed measurements could be completed successfully (measurements obtained for 574 out of 606 children with consent (95%) at baseline) and that loss to follow-up two years after baseline was at an acceptable level (follow-up measurements obtained for 83% and 86% of children in control and intervention schools, respectively). The feasibility study was not powered to investigate intervention outcomes, but the direction of effect was in favour of the intervention for most outcomes. In particular, children in the intervention arm compared with control arm had significantly lower adjusted BMI z scores at follow-up (−0.15 kg/m2, 95% confidence interval −0.27 to −0.03). Table 1 provides details of the finalised intervention.
WAVES study intervention and its deliveryThe intervention components, delivered over 12 months, targeted the home and school environment. The target group, based on findings from the feasibility study, was year 2 children (aged 6 or 7 years) and their families. Several behaviour change strategies were employed to encourage increased physical activity and improved diet quality. School staff were provided with training and resources for intervention delivery. A termly family newsletter reinforced messages delivered through the various intervention components. The intervention programme (summarised in table 1) comprised four overlapping components:
(1) Thirty minutes of additional moderate to vigorous physical activity on each school day—at least 15 minutes to be outside of break times, although class teachers customised timing of delivery and

RESEARCH
the bmj | BMJ 2018;360:k211 | doi: 10.1136/bmj.j3984 3
exact activities undertaken according to their class circumstances, supported by resources supplied as part of the study. Class teachers selected two preferred resources out of four offered and were taken through each selected resource and its detailed delivery materials by a researcher
(2) Termly cooking workshops during school time, which parents were invited to attend to participate in with their child and that were preceded by short classroom sessions for the children. School staff responsible for implementation (with the exception of two schools where equivalent training was delivered in school by the same researcher) attended a one day training session. To minimise teacher preparation time and ensure delivery of consistent nutritional messages, the presentation and interactive activity materials, together with take home information sheets and suggested lesson and workshop plans were provided, but timing of sessions and how parents were involved was left to the discretion of teachers
(3) A six week programme (Villa Vitality) developed to encourage healthy eating and increase physical activity and delivered by staff from an iconic sporting institution. School classes spent two days undertaking activities (indoor based movement routines, using dance mats, ball skills session, interactive nutritional sessions, and an opportunity to practise cooking skills) at an English premier league football club, separated
by a six week period during which teachers were asked to spend curriculum time working on a class project and involving children and their parents with weekly health challenges. The teacher customised the elements undertaken in school supported by a school visit from a member of staff from Villa Vitality
(4) Information sheets signposting children and their families on ways to be active over the summer (identical for all schools) and physical activity opportunities in their local area (school specific sheets produced by the study team and checked before distribution by the school).
Comparator interventionSchools allocated to the comparator arm continued with ongoing year 2 health related activities. In addition, we provided citizenship education resources, excluding topics related to healthy eating and physical activity.
OutcomesThe primary outcome for clinical effectiveness specified in our analysis plan and trial protocol was the difference in BMI z scores between arms at 15 and 30 months. Table 2 summarises the trial protocol prespecified secondary outcome measures. At trial registration, the secondary outcomes of waist circumference, sum of four skinfolds, and body fat percentage were included
Table 1 | Summary of WAVES study intervention programmeIntervention component and fit with stakeholder prioritisation Who delivers and details When delivered Intended participantsAim 1: increase children’s physical activity levelsDaily opportunity for additional 30 minutes of moderate to vigorous physical activity in bouts of >5 minutes through classroom or playground routines Extracurricular intervention to increase school day physical activity
Class teacher guided through choice of four resources8 to assist in delivery. Type of activity and timing of delivery tailored by teacher according to class circumstances
Every school day in year 2, within school time (≥15 minutes to be outside of school breaks)
Children
Brightly coloured information sheets: a) signposting local facilities and opportunities for family based physical activity outside school b) including motiva-tional messages and ideas for being active at home Community initiatives and facilities
Detailed information on opportunities and facilities for family based physical activity in locality, prepared by researchers in consultation with school staff, distributed to families through school
After randomisation and term 1 in year 2
Children and their families
Villa Vitality programme (iconic sport institution to provide role model and motivation). Three sessions over six weeks, interspersed by weekly family “challenges” and a class project Role models Family campaigns
Indoor and outdoor sessions led by Villa community coaches, highlighted ways in which children could incorporate physical activity into their daily lives Family challenges included a pledge to be active for at least an hour a day Class teachers worked with their class to develop a song on healthy lifestyles
Six week programme any time during year 2. Coaching sessions: two half days at football ground; one hour in school
Children with family support for weekly challenges
Aim 2: improve children’s dietary intakeCooking skills workshops to increase knowledge and equip families with skills to prepare healthier food (increase fruit, vegetable, and fibre intake, and reduce fat and sugar intake) Parent education sessions to confer skills Family activities
Teacher provided with training and resources to deliver workshops and two or three short lessons on healthy eating before each workshop. Parents invited to accompany children during workshops, led by teachers, where they practised skills (eg, chopping, grating, peel-ing, mixing) to prepare a meal. Written information sent home after each session
Three workshops (breakfast, lunch/snacks, evening meal); one each term during year 2
Children and parents
Villa Vitality programme (iconic sport institution to provide role model and motivation). Two sessions over six weeks, interspersed by weekly family “challenges” and a class project. Sessions designed to reinforce healthy eating messages and skills from cooking workshops Role models Family campaigns
Villa community staff provided interactive sessions on healthy eating and supervised practical preparation of a healthy meal over the two stadium visit days (six weeks apart) Family challenges: swap a snack, drink more water, eat a healthy breakfast every day, eat five portions of fruit and vegetables every day, and cook a healthy family meal Class teachers worked with their class to develop a song on healthy lifestyles
Six week programme any time during year 2, with two half day sessions at football ground
Children with family support for weekly challenges

RESEARCH
4 doi: 10.1136/bmj.j3984 | BMJ 2018;360:k211 | the bmj
Table 2 | Summary of measurements undertaken within WAVES study and their associated outcome variables
Measurements
Time points
Instrument
No of measures at each time point
Method of assessment
Outcome variables*Baseline
1st follow-up
2nd follow-up
3rd follow-up
Weight Yes Yes Yes Yes Tanita bioimpedance monitor (Tanita SC-331S; Tanita, Tokyo, Japan)
Once Barefoot and in light clothing
Body mass index (BMI) z score Overweight or obese (BMI ≥85th centile or ≥95th centile (both using UK 1990 BMI reference curves for children33)
Height Yes Yes Yes Yes Leicester height measure
Twice (third measure if differ-ence >0.4 cm)†
Barefoot and in light clothing
Demographic data (sex and date of birth)
Yes No No No Parent questionnaires NA Parent report and school records
Body fat % Yes Yes Yes Yes Tanita bioimpedance monitor (Tanita SC-331S; Tanita, Tokyo, Japan)
Once Barefoot and in light clothing using two limb (legs) bioelectrical im-pedance technology
Body fat %
Waist circumference (to nearest 0.1 cm)
Yes Yes Yes Yes Flexible, non-stretch, cloth tape measure
Twice (third measure if differ-ence >0.4 cm)†
Measured at iliac crest Waist circumference z score using UK 1990 BMI reference curves for children33
Skinfold thickness (biceps, triceps, sub-scapular, suprailiac, and thigh)
Yes Yes Yes Yes Holtain Tanner/White-house Skinfold Caliper (Holtain, UK)
Twice (third measure if difference >0.4 mm)‡
Measured on non-domi-nant side
Sum of four skinfolds§ (biceps, triceps, suprailiac, and sub-scapular)
Dietary intake Yes Yes Yes Yes Child And Diet Evalu-ation Tool (CADET) (a validated 115 item 24 hour food tick list22 completed for seven distinct time periods)
Once (24 hours) Completed by trained researchers in school, and parent/carer at home (with instructional DVD)
Dietary daily total energy intake (kJ in 24 hours), fat, sugar, fibre (g/day), and fruit and vegetable intake (g/day and portions)
Physical activity Yes Yes Yes No Actiheart (Cambridge Neurotechnology, Papworth, UK)
Once (worn con-tinuously for five days, including a weekend)
Fitted in school by trained researcher
Daily physical activity energy expenditure (kJ/kg body weight/day)¶, and time spent being sedentary and undertaking at least moderate intensity activity (min/24 hours) assessed by Actiheart
Blood pressure Yes Yes Yes Yes Automated oscillometric monitor (BpTRU BPM-100, British Columbia, Canada)
Twice (third measure if error reading, or if one value outside normal range)**
Three minutes seated rest before and between readings
Systolic and diastolic blood pressure
Quality of life Yes Yes Yes Yes Pediatric quality of life inventory (PedsQL)
NA Researcher administered questionnaire
Self reported health related quality of life
Social acceptance Yes Yes Yes Yes Kidscreen-52 health questionnaire for chil-dren and young people
NA Researcher administered questionnaire
Social acceptance
Body image dissatis-faction
Yes Yes Yes Yes Child’s body image scale (CBIS)
NA Researcher administered questionnaire (score derived from sex specific 7 point child’s body image scale)
Body image dissatis-faction
Demographic data (date of birth, sex, ethnicity, postcode (proxy measure for deprivation))
Yes No No No Parent questionnaires NA Parent report and school records
Sex, ethnicity, deprivation (index of multiple deprivation)
Measurements were carried out by trained research staff using standard protocols.*Primary outcomes (from trial protocol)=difference in BMI z scores between arms at first follow-up and second follow-up, all other outcomes are trial protocol secondary outcomes but some of the measures of obesity (proportion of children overweight/obese between arms, waist circumference z score, sum of four skinfolds, and body fat %) were included as primary outcomes in the trial registration.†Where two values were within ≤0.4 cm, a definitive measurement value was calculated as the average of the two. For individuals with three values recorded, a definitive measurement value was calculated as the average of the closest pair (within ≤0.4 cm) or average of all three readings (if there were no two closest readings, but the differences between values were ≤0.4 cm). When none of the three values were within 0.4 cm of each other no definitive measurement value was calculated.‡Where two values were within ≤0.4 mm, a definitive measurement value was calculated as the average of the two. For individuals with three values recorded, a definitive measurement value was calculated as the average of the closest pair (within ≤0.4 mm) or average of all three readings (if there were no two closest readings, but the differences between values were ≤0.4 mm). When none of the three values were within 0.4 cm of each other no definitive measurement value was calculated.§Skinfold thickness was measured at five different sites (biceps, triceps, thigh, suprailiac, and subscapular), as detailed in the protocol. Compared with the other sites, however, the children found the measurement of thigh skinfold thickness more intrusive, resulting in a lower level of data availability for this compared with the other sites. The skinfold thickness summary measure was therefore calculated excluding the thigh measurement.¶Children with less than 24 hours of valid data were excluded. In addition, to ensure representation across the whole 24 hour period, for those with 24 hours of valid data, only those with a distribution of at least six hours in each quadrant of the day (morning; 3 am-9 am, noon; 9 am-3 pm, afternoon; 3 pm-9 pm, and midnight; 9 pm-3 am) were included.**Readings with a systolic or diastolic, or both, value 20 mm hg above the 99.6th centile of the UK age specific and sex specific reference data34 were excluded as implausible values. Pairs of readings for which an error message was returned for either the systolic or diastolic value were excluded. Subsequent to these exclusions, systolic and diastolic values that remained were treated independently. For individuals with only one systolic or diastolic value this was taken as the definitive measurement value. For individuals with two remaining systolic or diastolic values the definitive measurement value was taken as the average of the two values. For individuals with three remaining systolic or diastolic values, provided there was a closest pair of values, the definitive measurement value was taken as the average of these two values, or, in instances of no closest pair, the average of all three values.
RESEARCH
the bmj | BMJ 2018;360:k211 | doi: 10.1136/bmj.j3984 5
as primary outcomes. All outcomes were assessed at 15 and 30 months post-baseline measures (3 and 18 months post-intervention). Further details on the methods, including standardised operating procedures for all primary and secondary outcome measurements, are available in the final report of the WAVES study, available through the National Institute for Health Research website (www.journalslibrary.nihr.ac.uk).
ImplementationThe trial statistician (KH) undertook sampling and subsequent randomisation, and the trial coordinator (ERL) recruited schools. To enable subgroup analysis we stratified schools by ethnic mix of pupils, and we used a weighted random sampling strategy to increase the selection likelihood (3:1) of schools with a higher minority ethnic population. Using this method, we selected 200 schools, which were ordered using a random number generator and sequentially invited to participate. To allow measurement of a large number of children in a limited timeframe within study resources, we recruited and randomised the schools into two groups (27 schools in each group), one year apart. Parental informed consent was sought and verbal assent from the children was obtained for all measurements undertaken.
Participant assessment and data collection proceduresBaseline assessment took place when children were at the end of year 1 (aged 5 or 6 years). Outcome assessments using identical procedures were undertaken at 15 months (first follow-up) and 30 months (second follow-up) post-baseline (aged 7 or 8, and 8 or 9 years, respectively). In schools recruited in the first year (group 1), we further assessed at 39 months (third follow-up) post-baseline (aged 9 or 10 years), but this was not possible for schools recruited in the second year (group 2) within the trial timetable. We collected data from school records, direct assessment of participating children in school, and parent questionnaires distributed at the time of pupil measurements. Trained research staff undertook assessments using standardised protocols and validated instruments, as detailed in the protocol8 and summarised in table 2.
Sample sizeSample size was based on the primary outcome (BMI z score), taking into account repeated measures (estimated correlation between measures=0.9), varying cluster size (assuming mean 25 (SD 23) cluster size), and likely estimates of the intraclass correlation coefficient (0 to 0.04). To detect a clinically meaningful difference of 0.25 BMI z score11 between intervention and comparator groups with 90% power, a two sided α of 0.05, and estimated pupil dropout rate of 20%, we needed a follow-up sample of 1000 children from 50 schools. Allowing for school drop-out of 8%, we recruited 54 schools. This sample size also provides more than 80% power to detect a
0.125 difference in BMI z score (clinically important difference for prevention12) and an approximately 7% difference in the change of proportion of children who are overweight or obese from baseline to follow-up in control compared with intervention schools.
RandomisationA blocked balancing algorithm was used to randomise participating schools to intervention or comparator arms. Schools were randomly allocated according to a randomisation scheme, which minimised imbalance13 on several characteristics: percentage of pupils eligible for free school meals (measure of deprivation), proportion of pupils from South Asian, black African-Caribbean, white, or other ethnic groups, and school size. We randomised the first 27 schools (group 1) within the first block. A year later we randomly allocated the remaining 27 schools (group 2) in a similar way, but conditioning on the allocations that had already been made in group 1.
To ensure concealment of allocation we carried out randomisation after baseline measurements. Sessional researchers blind to arm allocation mainly undertook further data collection. Supplementary figure 1 summarises the timeline for trial processes.
Statistical analysisAnalyses of all outcomes were by intention to treat and are reported at 15, 30, and 39 months after baseline (3, 18, and 27 months after the end of the intervention). For the primary analyses (complete case analysis), we used mixed linear regression models for all continuous outcomes (eg, BMI z score) and Poisson mixed regression for binary outcomes to allow estimation of adjusted risk differences consistent with CONSORT guidelines. To accommodate any non-normality of the outcomes, we transformed data when necessary and when such transformation improved the model. The baseline adjusted model included the baseline measurement and treatment arm as the independent variables, and to account for the clustered nature of the sample, school as the random effect. We also report models further adjusted for prespecified baseline school and child level covariates. Planned subgroup analyses, using interaction tests, examined whether any intervention effects differed by ethnicity, sex, socioeconomic status, baseline weight status, and fidelity of implementation.
Sensitivity analyses included using multiple imputation (using chained equations) for missing values for each outcome, exploring cluster heterogeneity by period (group 1 versus group 2 schools), and methods of adjusting for missing baseline variables to maximise use of available data and heterogeneity of the intraclass correlation coefficient in intervention and control arms. Additional details on the statistical methods are available in the final report, available through the National Institute for Health Research website (www.journalslibrary.nihr.ac.uk).
We set the level of statistical significance at 0.05 (two sided) for the primary outcomes (see table 2) and

RESEARCH
6 doi: 10.1136/bmj.j3984 | BMJ 2018;360:k211 | the bmj
at 0.01 for all other outcomes. Analyses were carried out in Stata 1314 and REALCOM-impute15 software.
Because of the timelines of recruitment and outcome assessments, there was no opportunity for interim analyses. The trial steering committee maintained assessment of data quality and completion.
Process evaluationWe used a variety of methods for assessment of intervention delivery and process, including interviews with teachers; parent and child focus groups; head teacher, class teacher, and parental questionnaires; teacher logbooks; and direct observation of sessions by researchers.16 With the exception of the signposting sheets for which there was no variation in implementation between schools, we used a consensus method for each of the other three intervention components to allocate schools a score on a 5 point Likert scale for each dimension of the process evaluation (fidelity and adherence; reach, dose, and exposure; recruitment, quality, and participant responsiveness). Context and information on programme differentiation influence all of these
and were therefore also considered throughout this score allocation process. We then ranked schools by total score, and grouped the schools to reflect low, medium, or high intervention implementation. A detailed report on the method used to synthesise the process evaluation data is published elsewhere.17
Changes to methods from trial registration stageThe trial registration was submitted before the practical planning for the trial had started. Some aspects were subsequently altered in the development of the trial protocol, but the trial registration was not updated and therefore does not incorporate these changes. Supplementary table 1 summarises all changes between trial registration and trial protocol. In particular, at the early planning stages for the trial (and before the start of baseline measurements) the investigator team modified the primary outcomes from those specified at trial registration. To increase power to detect change and for consistency and comparability with previous trials, we changed the primary outcome for clinical effectiveness from the binary variable specified in the registry (of difference in proportion of children
Allocated to control (n=28 schools; 1328 pupils)Median pupils consented/school (n=22; range 13-51)Consented pupils (n=778; 52 limited measures only)
Allocated to intervention (n=26 schools; 1134 pupils)Delivered intervention: Schools (n=24) Median pupils consented/school (n=25; range 11-44) Consented pupils (n=638; 31 limited measures only) Physical activity component not delivered (n=1 school; 20 pupils)Did not deliver intervention: Schools (n=2) Consented pupils (n=51; 20 + 31)
Eligible schools (n=980)Weighted random sample of 200 schools drawn and invited sequentially to take part,
155 approached and assessed for eligibility, 54 recruited
Lost to �rst follow-up: Schools (n=1 (school withdrew; 20 consented pupils)) Other loss at follow-up 1 (n=76 pupils) Consent withdrawn (n=7) Le� school (n=69)Lost to second follow-up: Schools (n=0) Other additional loss at follow-up 2 (n=64 pupils) Consent withdrawn (n=9) Le� school (n=55)Lost to third follow-up: Schools (n=12; Group 2 school - no third follow-up planned, 294 consented pupils) Other additional loss at follow-up 3 (n=10 pupils) Consent withdrawn (n=4) Le� school (n=6)
Lost to �rst follow-up: Schools (n=0) Other loss at follow-up 1 (n=84 pupils) Consent withdrawn (n=21) Le� school (n=63)Lost to second follow-up: Schools (n=0) Other additional loss at follow-up 2 (n=54 pupils) Consent withdrawn (n=18) Le� school (n=36)Lost to third follow-up: Schools (n=14; Group 2 school - no third follow-up planned, 361 consented pupils) Other additional loss at follow-up 3 (n=9 pupils) Consent withdrawn (n=3) Le� school (n=6)
Analysed (n=26 schools; 660 pupils)Excluded from analysis (n=0 schools; 29 pupils (all data for 1 outcome not available))
Analysed (n=28 schools; 732 pupils)Excluded from analysis (n=0 schools; 46 pupils (all data for 1 outcome not available))
Excluded (n=101): Refused to participate (n=90) No response (n=4) School with Ofsted special measures status (n=3) School with <17 year 1 pupils (n=3) Not invited owing to outcome response bias checks undertaken as part of enrollment process (n=1)
Fig 1 | Flow of school recruitment and trial arm allocation

RESEARCH
the bmj | BMJ 2018;360:k211 | doi: 10.1136/bmj.j3984 7
categorised as overweight or obese between arms) to the continuous outcome specified in the protocol of difference in BMI z scores between arms. Concurrently this binary variable and the additional anthropometric measurements included as primary outcomes at trial registration were specified as secondary outcomes. The reporting of the trial is in keeping with the published protocol,8 which was submitted before the start of data
analysis, but any differences between what is reported and the trial registration information are specified in both the text and the tables.
Patient and public involvementPublic involvement was a key feature of the early phases of trial development and feasibility testing before this main trial. Intervention development
Table 3 | Baseline characteristics of school pupils participating in the WAVES study overall and by trial armCharacteristics Intervention arm Control arm TotalDemographic n=662 n=735 n=1397Mean (SD) age (years); not known 6.3 (0.3); 27 6.3 (0.3); 43 6.3 (0.3); 70Sex: n=689 n=778 n=1467 Male 339 (49.2) 410 (52.7) 749 (51.1) Female 350 (50.8) 368 (47.3) 718 (48.9)Ethnicity: n=676 n=775 n=1451 White British 297 (43.9) 361 (46.6) 658 (45.3) South Asian 221 (32.7) 222 (28.6) 443 (30.5) Black African-Caribbean 62 (9.2) 53 (6.8) 115 (7.9) Other 96 (14.2) 139 (17.9) 235 (16.2) Not known* 13 3 16Deprivation fifth†: n=670 n=769 n=1439 1 (most deprived) 392 (58.5) 398 (51.8) 790 (54.9) 2 120 (17.9) 154 (20.0) 274 (19.0) 3 72 (10.7) 74 (9.6) 146 (10.1) 4 65 (9.7) 54 (7.0) 119 (8.3) 5 (least deprived) 21 (3.1) 89 (11.6) 110 (7.6)Median (interquartile range) deprivation score†; not known*
39.8 (21.9-52.7); 19 37.6 (17.9-48.8); 9 38.9 (20.1-49.5); 28
AnthropometricBMI z score: n=660 n=732 n=1392 Mean (SD) BMI z score; not known 0.23 (1.2); 29 0.15 (1.2); 46 0.19 (1.2); 75Height (cm): n=664 n=732 n=1396 Mean (SD); not known: 118.6 (5.6); 25 118.2 (5.4); 46 118.4 (5.5); 71Waist circumference, z score: n=589 n=670 n=1259 Mean (SD); not known: 0.77 (1.2); 100 0.66 (1.3); 108 0.71 (1.3); 208Sum of skinfolds (mm)‡ n=540 n=597 n=1137 Median (interquartile range); not known 28.6 (23.3-35.4); 149 28.1 (23.0-36.6); 181 28.4 (23.1-36.1); 330Body fat %: n=660 n=716 n=1376 Mean (SD); not known 21.3 (5.4); 29 21.0 (5.2); 62 21.1 (5.3); 91Weight status§: n=660 n=732 n=1392 Underweight (≤2nd centile) 20 (3.0) 20 (2.7) 40 (2.9) Healthy weight (>2nd and <85th centiles) 495 (75.0) 562 (76.8) 1057 (75.9) Overweight (≥85th and <95th centiles) 61 (9.2) 63 (8.6) 124 (8.9) Obese (≥95th centile) 84 (12.7) 87 (11.9) 171 (12.3) Not known* 29 46 7524 hour dietary intake n=562 n=625 n=1187Median (interquartile range) energy (kJ/24 hrs); not known
6904 (5865-8054); 127 6911 (5804-7964); 153 6907 (5829-8002); 280
≥5 portions of fruit and vegetables: n=562 n=625 n=1187 Yes 336 (59.8) 405 (64.8) 741 (62.4) No 226 (40.2) 220 (35.2) 446 (37.6) Not known* 127 153 280Physical activity n=492 n=560 n=1052Mean (SD) physical activity energy expenditure (kJ/kg/day); not known
96.4 (23.2); 197 94.1 (24.4); 218 95.2 (23.8); 415
≥60 mins MVPA/24 hours: n=491 n=557 n=1048 Yes 228 (46.4) 276 (49.6) 504 (48.1) No 263 (53.6) 281 (50.4) 544 (51.9) Not known* 198 221 419Psychological n=663 n=721 n=1384Median (interquartile ranage) PedsQL total score; not known
71.7 (60.9-82.6); 26 73.9 (60.9-82.6); 57 71.7 (60.9-82.6); 83
MVPA=moderate to vigorous physical activity; PedsQL=pediatric quality of life inventory.*Not included in denominator for calculation of percentages.†Index of multiple deprivation.‡Subscapular, suprailiac, biceps, and triceps skinfolds.§Based on UK 1990 reference centile curves and applying cut-offs used for population monitoring.

RESEARCH
8 doi: 10.1136/bmj.j3984 | BMJ 2018;360:k211 | the bmj
was informed by detailed consultation with parents, teachers, and other school staff. The intervention was further refined and the process for measuring outcomes tested and adapted by asking the children, parents, and teachers about their experiences during the feasibility study. Measures of wellbeing and body dissatisfaction were included as outcomes based on their perceived importance among school staff. Our research team includes an education advisor at the Health Education Service, who has regular contact with schools and advised on school and participant recruitment. No patients were involved in this trial.
ResultsFigure 1 shows the flow of schools and pupils during the trial. Among 2462 eligible pupils from 54 participating schools at baseline, parental consent for baseline measurements was obtained from 1467 (59.6%). Recruitment took place between April and May 2011 (group 1 schools and pupils) and from January to May 2012 (group 2 schools and pupils). Table 3 summarises the baseline characteristics. Although school characteristics were balanced between the two groups, there was baseline imbalance at the pupil level, with children in the control arm compared with intervention arm more likely to be male (52.7% v 49.2%), from generally less deprived households (mean index of multiple deprivation score 37.6 v 39.8), less likely to be overweight (mean BMI z score 0.15 v 0.23), more likely to consume five portions of fruit and vegetables daily (64.8% v 59.8%), and more likely to achieve at least 60 minutes of moderate to vigorous physical activity daily (49.6% v 46.4%).
Primary outcomesThe primary outcomes are also reported in the trial protocol (table 4). At 15 months the mean BMI z score was non-significantly lower in the intervention arm compared with control arm: mean difference −0.075 (95% confidence interval −0.183 to 0.033, P=0.18) in baseline adjusted models (n=1197, 86% of those with baseline BMI z score available) and −0.077 (−0.191 to 0.037, P=0.19) in further adjusted (n=837, 60% of those with baseline BMI z score available) models.
At 30 months the mean difference was smaller and remained non-significant (−0.027, −0.137 to 0.083; P=0.63) in the baseline adjusted model (n=1094, 79% of those with baseline BMI z score available).
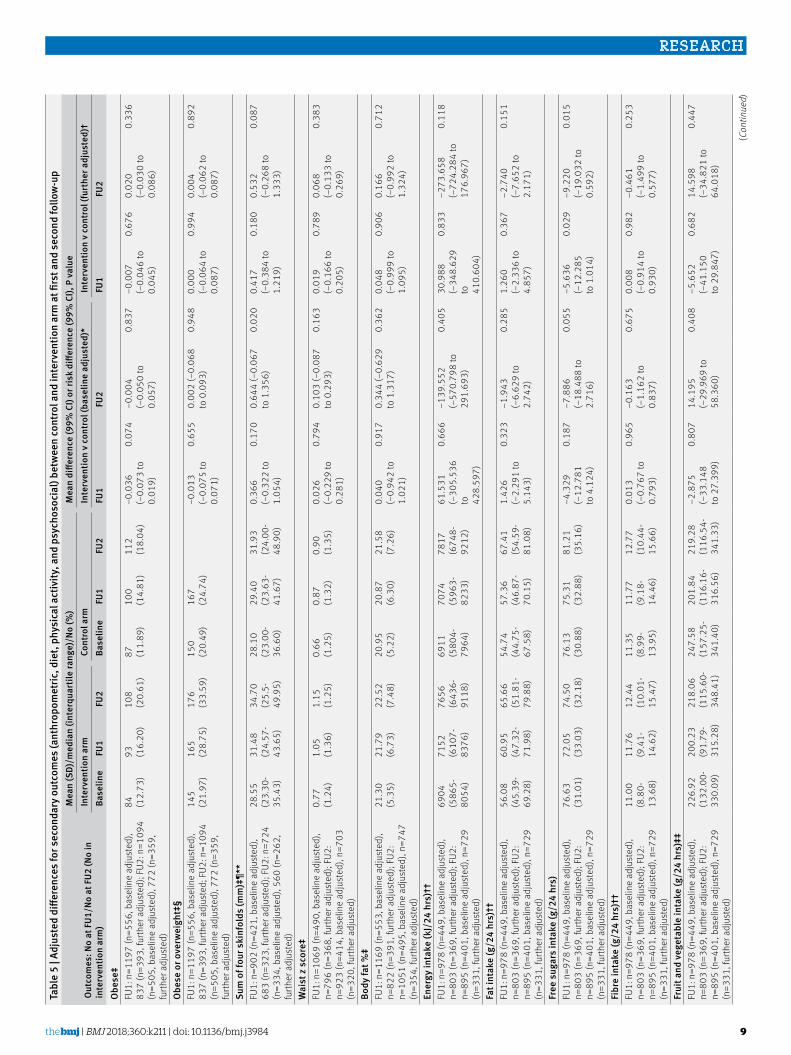
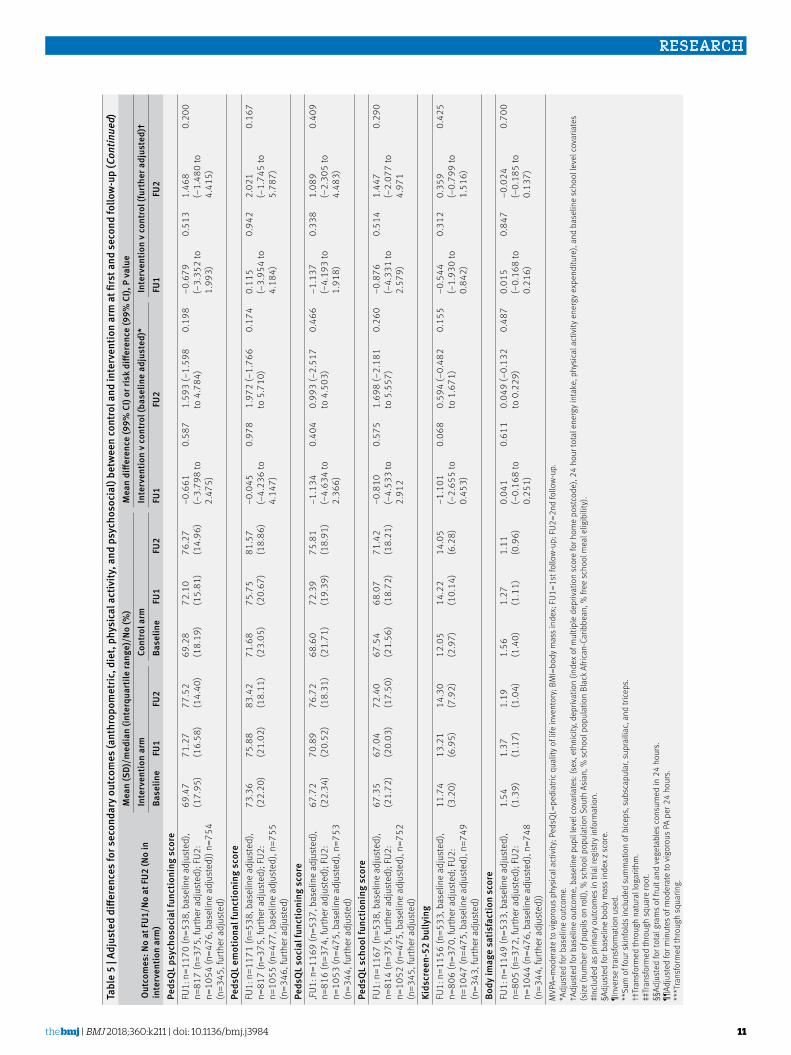
Secondary outcomesThe secondary outcomes are as reported in the trial protocol and trial registration information, unless stated otherwise, (table 5).
Anthropometric measurements—these are included as primary outcomes in trial registration information (see “Changes to methods from trial registration stage”). In the intervention arm compared with control arm, the baseline adjusted risk difference in the proportion of children who were overweight or obese was −0.013 (99% confidence interval −0.075 to 0.071, P=0.66) and 0.002 (−0.068 to 0.093, P=0.95) at 15 and 30 months, respectively. The mean difference in sum of skinfolds, waist circumference z score, and body fat percentage were all non-significant, but slightly favoured the control group.
Diet, physical activity, and blood pressure—the mean differences in total daily energy intake, physical activity energy expenditure, and systolic and diastolic blood pressures between groups were inconsistent in direction and statistically non-significant at both follow-ups.
Longer term clinical effectiveness—among group 1 school participants who were followed up at 39 months (488 pupils (246 controls), 27 schools (14 controls)), the mean BMI z score was lower in the intervention arm compared with control arm in the baseline adjusted model (mean difference −0.20, 99% confidence interval −0.46 to 0.05, P=0.04) and further adjusted models (−0.18; −0.39 to 0.03, P=0.03). We were not aware of any contextual or intervention delivery aspects that differed between the groups. To investigate why the intervention appeared more effective at this later time point, we undertook post hoc analysis to consider whether schools recruited in group 1 differed from those in group 2, both in characteristics (see appendix, table A1) and in outcomes at earlier time points (see appendix, table A2). This showed a noticeable imbalance in baseline adiposity between
Table 4 | Adjusted differences for body mass index (BMI) z score between control and intervention groups at first, second, and third follow-up
Follow-up No of participants (No in intervention arm)
Mean (SD) BMI z scores Mean difference (95% CI), P value
Intervention arm* Control arm†Intervention v control (baseline adjusted)‡
Intervention v control (further adjusted)§
15 months n=1197¶ (n=556) baseline adjusted; n=837¶ (n=393) further adjusted
0.34 (1.34) 0.23 (1.27) −0.075 (−0.183 to 0.033), 0.18
−0.077 (−0.191 to 0.037), 0.19
30 months n=1094¶ (n=505baseline adjusted; n=772¶ (n=359) further adjusted
0.42 (1.34) 0.31 (1.32) −0.027 (−0.137 to 0.083), 0.63
−0.042 (−0.163 to 0.080), 0.50
39 months n=467** (n=232baseline adjusted; n=345** (n=173) further adjusted
0.49 (1.37) 0.63 (1.22) −0.204 (−0.396 to −0.013), 0.04; (99% CI −0.456 to 0.048)
−0.177 (−0.386 to 0.033), 0.03; (99% CI −0.386 to 0.033)
*Baseline, all participants 0.23 (1.24); baseline, group 1 school participants only 0.29 (1.24).†Baseline, all participants 0.15 (1.20); baseline group 1 school participants only 0.28 (1.12).‡Adjusted for baseline outcome.§Adjusted for baseline outcome, baseline pupil level covariates: (sex, ethnicity, deprivation (index of multiple deprivation score for home postcode), 24 hour total energy intake, physical activity energy expenditure) and baseline school level covariates (size (number of pupils on roll), % school population South Asian, % school population black African-Caribbean, % free school meal eligibility).¶Includes group 1 and group 2 school participants.**Includes group 1 school participants only.
RESEARCH
the bmj | BMJ 2018;360:k211 | doi: 10.1136/bmj.j3984 9
Tabl
e 5
| Adj
uste
d di
ffere
nces
for s
econ
dary
out
com
es (a
nthr
opom
etric
, die
t, ph
ysic
al a
ctiv
ity, a
nd p
sych
osoc
ial)
betw
een
cont
rol a
nd in
terv
entio
n ar
m a
t firs
t and
sec
ond
follo
w-u
p
Out
com
es: N
o at
FU1/
No a
t FU2
(No
in
inte
rven
tion
arm
)
Mea
n (S
D)/m
edia
n (in
terq
uart
ile ra
nge)
/No
(%)
Mea
n di
ffere
nce
(99%
CI)
or ri
sk d
iffer
ence
(99%
CI),
P v
alue
Inte
rven
tion
arm
Cont
rol a
rmIn
terv
entio
n v
cont
rol (
base
line
adju
sted
)*In
terv
entio
n v
cont
rol (
furt
her a
djus
ted)
†Ba
selin
eFU
1FU
2Ba
selin
eFU
1FU
2FU
1FU
2FU
1FU
2O
bese
‡FU
1: n
=119
7 (n
=556
, bas
elin
e ad
just
ed),
837
(n=3
93, f
urth
er a
djus
ted)
; FU2
: n=1
094
(n=5
05, b
asel
ine
adju
sted
), 77
2 (n
=359
, fu
rther
adj
uste
d)
84
(12.
73)
93
(16.
20)
108
(20.
61)
87
(11.
89)
100
(14.
81)
112
(18.
04)
−0.0
36
(−0.
073
to
0.01
9)
0.07
4−0
.004
(−
0.05
0 to
0.
057)
0.83
7−0
.007
(−
0.04
6 to
0.
045)
0.67
60.
020
(−0.
030
to
0.08
6)
0.33
6
Obe
se o
r ove
rwei
ght‡
§FU
1: n
=119
7 (n
=556
, bas
elin
e ad
just
ed),
837
(n=3
93, f
urth
er a
djus
ted;
FU2
: n=1
094
(n=5
05, b
asel
ine
adju
sted
), 77
2 (n
=359
, fu
rther
adj
uste
d)
145
(21.
97)
165
(28.
75)
176
(33.
59)
150
(20.
49)
167
(24.
74)
−0.0
13
(−0.
075
to
0.07
1)
0.65
50.
002
(−0.
068
to 0
.093
)0.
948
0.00
0 (−
0.06
4 to
0.
087)
0.99
40.
004
(−0.
062
to
0.08
7)
0.89
2
Sum
of f
our s
kinf
olds
(mm
)‡¶*
*FU
1: n
=902
(n=4
21, b
asel
ine
adju
sted
), 68
3 (n
=323
, fur
ther
adj
uste
d); F
U2: n
=724
(n
=334
, bas
elin
e ad
just
ed),
560
(n=2
62,
furth
er a
djus
ted)
28.5
5 (2
3.30
-35
.43)
31.4
8 (2
4.57
-43
.65)
34.7
0 (2
5.5-
49.9
5)
28.1
0 (2
3.00
-36
.60)
29.4
0 (2
3.63
-41
.67)
31.9
3 (2
4.00
-48
.90)
0.36
6 (−
0.32
2 to
1.
054)
0.17
00.
644
(−0.
067
to 1
.356
)0.
020
0.41
7 (−
0.38
4 to
1.
219)
0.18
00.
532
(−0.
268
to
1.33
3)
0.08
7
Wai
st z
sco
re‡
FU1:
n=1
069
(n=4
90, b
asel
ine
adju
sted
), n=
796
(n=3
68, f
urth
er a
djus
ted)
; FU2
: n=
923
(n=4
14, b
asel
ine
adju
sted
), n=
703
(n=3
20, f
urth
er a
djus
ted)
0.77
(1
.24)
1.05
(1
.36)
1.15
(1
.25)
0.66
(1
.25)
0.87
(1
.32)
0.90
(1
.35)
0.02
6 (−
0.22
9 to
0.
281)
0.79
40.
103
(−0.
087
to 0
.293
)0.
163
0.01
9 (−
0.16
6 to
0.
205)
0.78
90.
068
(−0.
133
to
0.26
9)
0.38
3
Body
fat %
‡FU
1: n
=116
9 (n
=553
, bas
elin
e ad
just
ed),
n=82
2 (n
=391
, fur
ther
adj
uste
d); F
U2:
n=10
51 (n
=495
, bas
elin
e ad
just
ed),
n=74
7 (n
=354
, fur
ther
adj
uste
d)
21.3
0 (5
.35)
21.7
9 (6
.73)
22.5
2 (7
.48)
20.9
5 (5
.22)
20.8
7 (6
.30)
21.5
8 (7
.26)
0.04
0 (−
0.94
2 to
1.
021)
0.91
70.
344
(−0.
629
to 1
.317
)0.
362
0.04
8 (−
0.99
9 to
1.
095)
0.90
60.
166
(−0.
992
to
1.32
4)
0.71
2
Ener
gy in
take
(kJ/
24 h
rs)†
†FU
1: n
=978
(n=4
49, b
asel
ine
adju
sted
), n=
803
(n=3
69, f
urth
er a
djus
ted)
; FU2
: n=
895
(n=4
01, b
asel
ine
adju
sted
), n=
729
(n=3
31, f
urth
er a
djus
ted)
6904
(5
865-
8054
)
7152
(6
107-
8376
)
7656
(6
436-
9118
)
6911
(5
804-
7964
)
7074
(5
963-
8233
)
7817
(6
748-
9212
)
61.5
31
(−30
5.53
6 to
42
8.59
7)
0.66
6−1
39.5
52
(−57
0.79
8 to
29
1.69
3)
0.40
530
.988
(−
348.
629
to
410.
604)
0.83
3−2
73.6
58
(−72
4.28
4 to
17
6.96
7)
0.11
8
Fat i
ntak
e (g
/24
hrs)
††FU
1: n
=978
(n=4
49, b
asel
ine
adju
sted
), n=
803
(n=3
69, f
urth
er a
djus
ted)
; FU2
: n=
895
(n=4
01, b
asel
ine
adju
sted
), n=
729
(n=3
31, f
urth
er a
djus
ted)
56.0
8 (4
5.39
-69
.28)
60.9
5 (4
7.32
-71
.98)
65.6
6 (5
1.81
-79
.88)
54.7
4 (4
4.75
-67
.58)
57.3
6 (4
6.87
-70
.15)
67.4
1 (5
4.59
-81
.08)
1.42
6 (−
2.29
1 to
5.
143)
0.32
3−1
.943
(−
6.62
9 to
2.
742)
0.28
51.
260
(−2.
336
to
4.85
7)
0.36
7−2
.740
(−
7.65
2 to
2.
171)
0.15
1
Free
sug
ars
inta
ke (g
/24
hrs)
FU1:
n=9
78 (n
=449
, bas
elin
e ad
just
ed),
n=80
3 (n
=369
, fur
ther
adj
uste
d); F
U2:
n=89
5 (n
=401
, bas
elin
e ad
just
ed),
n=72
9 (n
=331
, fur
ther
adj
uste
d)
76.6
3 (3
1.01
)72
.05
(33.
03)
74.5
0 (3
2.18
)76
.13
(30.
88)
75.3
1 (3
2.88
)81
.21
(35.
16)
−4.3
29
(−12
.781
to
4.1
24)
0.18
7−7
.886
(−
18.4
88 to
2.
716)
0.05
5−5
.636
(−
12.2
85
to 1
.014
)
0.02
9−9
.220
(−
19.0
32 to
0.
592)
0.01
5
Fibr
e in
take
(g/2
4 hr
s)††
FU1:
n=9
78 (n
=449
, bas
elin
e ad
just
ed),
n=80
3 (n
=369
, fur
ther
adj
uste
d); F
U2:
n=89
5 (n
=401
, bas
elin
e ad
just
ed),
n=72
9 (n
=331
, fur
ther
adj
uste
d)
11.0
0 (8
.80-
13.6
8)
11.7
6 (9
.41-
14.6
2)
12.4
4 (1
0.01
-15
.47)
11.3
5 (8
.99-
13.9
5)
11.7
7 (9
.18-
14.4
6)
12.7
7 (1
0.44
-15
.66)
0.01
3 (−
0.76
7 to
0.
793)
0.96
5−0
.163
(−
1.16
2 to
0.
837)
0.67
50.
008
(−0.
914
to
0.93
0)
0.98
2−0
.461
(−
1.49
9 to
0.
577)
0.25
3
Frui
t and
veg
etab
le in
take
(g/2
4 hr
s)‡‡
FU1:
n=9
78 (n
=449
, bas
elin
e ad
just
ed),
n=80
3 (n
=369
, fur
ther
adj
uste
d); F
U2:
n=89
5 (n
=401
, bas
elin
e ad
just
ed),
n=72
9 (n
=331
, fur
ther
adj
uste
d)
226.
92
(132
.00-
330.
09)
200.
23
(91.
79-
315.
28)
218.
06
(115
.60-
348.
41)
247.
58
(157
.25-
341.
40)
201.
84
(116
.16-
316.
56)
219.
28
(116
.54-
341.
33)
−2.8
75
(−33
.148
to
27.
399)
0.80
714
.195
(−
29.9
69 to
58
.360
)
0.40
8−5
.652
(−
41.1
50
to 2
9.84
7)
0.68
214
.598
(−
34.8
21 to
64
.018
)
0.44
7
(Con
tinue
d)

RESEARCH
10 doi: 10.1136/bmj.j3984 | BMJ 2018;360:k211 | the bmj
Tabl
e 5
| Adj
uste
d di
ffere
nces
for s
econ
dary
out
com
es (a
nthr
opom
etric
, die
t, ph
ysic
al a
ctiv
ity, a
nd p
sych
osoc
ial)
betw
een
cont
rol a
nd in
terv
entio
n ar
m a
t firs
t and
sec
ond
follo
w-u
p (C
ontin
ued)
Out
com
es: N
o at
FU1/
No a
t FU2
(No
in
inte
rven
tion
arm
)
Mea
n (S
D)/m
edia
n (in
terq
uart
ile ra
nge)
/No
(%)
Mea
n di
ffere
nce
(99%
CI)
or ri
sk d
iffer
ence
(99%
CI),
P v
alue
Inte
rven
tion
arm
Cont
rol a
rmIn
terv
entio
n v
cont
rol (
base
line
adju
sted
)*In
terv
entio
n v
cont
rol (
furt
her a
djus
ted)
†Ba
selin
eFU
1FU
2Ba
selin
eFU
1FU
2FU
1FU
2FU
1FU
2≥5
por
tions
of f
ruit
and
vege
tabl
es§§
FU1:
n=9
78 (n
=449
, bas
elin
e ad
just
ed),
n=80
3 (n
=369
, fur
ther
adj
uste
d); F
U2:
n=89
5 (n
=401
, bas
elin
e ad
just
ed),
n=72
9 (n
=331
, fur
ther
adj
uste
d)
336
(59.
79)
244
(48.
13)
253
(55.
85)
405
(64.
80)
297
(49.
09)
317
(56.
41)
−0.0
14
(−0.
111
to
0.10
9)
0.75
30.
012
(−0.
090
to 0
.135
)0.
789
0.00
4 (−
0.07
5 to
0.
098)
0.90
00.
002
(−0.
096
to
0.12
2)
0.95
4
Phys
ical
act
ivity
ene
rgy
expe
nditu
re
(kJ/
kg/d
ay)
FU1:
n=7
24 (n
=335
, bas
elin
e ad
just
ed),
n=65
8 (n
=310
, fur
ther
adj
uste
d); F
U2:
n=57
1 (n
=253
, bas
elin
e ad
just
ed),
n=52
0 (n
=237
, fur
ther
adj
uste
d)
96.4
3 (2
3.16
)91
.70
(23.
71)
79.6
6 (2
2.26
)94
.08
(24.
38)
91.2
7 (2
5.42
)78
.60
(22.
43)
−0.8
66
(−6.
811
to
5.07
9)
0.70
80.
001
(−5.
745
to 5
.747
)0.
999
−1.7
62
(−7.
007
to
3.48
2)
0.38
7−0
.224
(−
5.34
4 to
4.
896)
0.91
0
Sede
ntar
y tim
e (h
rs/2
4 hr
s)FU
1: n
=720
(n=3
34, b
asel
ine
adju
sted
), n=
654
(n=3
10, f
urth
er a
djus
ted)
; FU2
: n=
575
(n=5
4, b
asel
ine
adju
sted
), n=
524
(n=2
39, f
urth
er a
djus
ted)
14.4
2 (1
.88)
14.0
1 (2
.12)
15.8
6 (1
.86)
14.5
7 (1
.78)
14.0
8 (2
.20)
15.7
3 (1
.94)
−0.0
45
(−0.
610
to
0.52
1)
0.83
90.
186
(−0.
443
to 0
.814
)0.
447
0.15
6 (−
0.38
4 to
0.
697)
0.45
60.
287
(−0.
368
to
0.94
1)
0.26
0
MVP
A tim
e (m
ins/
24 h
rs)†
†FU
1: n
=720
(n=3
34, b
asel
ine
adju
sted
), n=
654
(n=3
10, f
urth
er a
djus
ted)
; FU2
: n=
575
(n=2
54, b
asel
ine
adju
sted
), n=
524
(n=2
39, f
urth
er a
djus
ted)
57.9
1 (4
2.52
-85
.90)
62.0
7 (3
8.80
-10
2.97
)
40.7
9 (3
1.47
-57
.19)
59.4
7 (4
2.80
-81
.53)
59.8
0 (4
0.91
-96
.95)
44.3
6 (3
2.85
-67
.94)
−1.3
10
(−11
.843
to
9.2
24)
0.74
9−3
.332
(−
10.7
06 to
4.
042)
0.24
5−3
.939
(−
16.5
61
to 8
.682
)
0.42
1−4
.314
(−
12.6
97 to
4.
070)
0.18
5
Achi
evin
g ≥6
0 m
ins
MVP
A/24
hs¶
¶FU
1: n
=720
(n=3
34, b
asel
ine
adju
sted
), n=
654
(n=3
10, f
urth
er a
djus
ted)
; FU2
: n=
575
(n=2
54, b
asel
ine
adju
sted
), n=
524
(n=2
39, f
urth
er a
djus
ted)
228
(46.
44)
207
(52.
27)
70
(22.
80)
276
(49.
55)
234
(49.
79)
120
(30.
53)
0.04
1 (−
0.08
5 to
0.
207)
0.44
6−0
.068
(−
0.16
6 to
0.
096)
0.21
50.
005
(−0.
101
to
0.14
0)
0.91
1−0
.067
(−
0.16
5 to
0.
096)
0.21
9
Syst
olic
blo
od p
ress
ure
(mm
Hg)
FU1:
n=1
100
(n=5
13, b
asel
ine
adju
sted
), n=
778
(n=3
69, f
urth
er a
djus
ted)
; FU2
: n=
996
(n=4
47, b
asel
ine
adju
sted
), n=
771
(n=3
25, f
urth
er a
djus
ted)
95.6
7 (9
.04)
95.3
5 (8
.78)
96.9
8 (8
.30)
98.1
0 (1
0.06
)95
.29
(8.2
2)97
.75
(8.2
1)0.
624
(−17
25 to
2.
973)
0.49
40.
310
(−1.
528
to 2
.148
)0.
664
0.93
1 (−
1.30
7 to
3.
169)
0.28
40.
577
(−1.
431
to
2.58
4)
0.45
9
Dias
tolic
blo
od p
ress
ure
(mm
Hg)
FU1:
n=1
100
(n=5
13, b
asel
ine
adju
sted
), n=
778
(n=3
69, f
urth
er a
djus
ted)
; FU2
: n=
996
(n=4
47, b
asel
ine
adju
sted
), n=
771
(n=3
25, f
urth
er a
djus
ted)
62.1
8 (7
.99)
62.0
8 (7
.81)
63.2
9 (7
.46)
64.2
1 (8
.59)
62.1
9 (7
.43)
63.5
0 (7
.34)
0.33
5 (−
1.72
1 to
2.
392)
0.67
50.
482
(−1.
570
to 2
.533
)0.
545
0.94
5 (−
1.24
7 to
3.
137)
0.26
70.
517
(−1.
605
to
2.63
9)
0.53
0
Peds
QL
tota
l sco
re**
*FU
1: n
=117
1 (n
=538
, bas
elin
e ad
just
ed),
n=81
7 (n
=375
, fur
ther
adj
uste
d; F
U2:
n=10
55 (n
=477
, bas
elin
e ad
just
ed),
n=75
5 (n
=346
, fur
ther
adj
uste
d)
71.7
4 (6
0.87
-82
.61)
76.0
9 (6
5.22
-84
.78)
82.6
1 (7
1.74
-89
.13)
73.9
1 (6
0.87
-82
.61)
76.0
9 (6
5.22
-84
.78)
80.4
3 (7
1.74
-89
.13)
−0.6
30
(−4.
385
to
3.12
4)
0.66
51.
248
(−2.
301
to 4
.796
)0.
365
−0.4
37
(−4.
271
to
3.39
8)
0.76
91.
246
(−1.
815
to
4.30
7)
0.29
4
Peds
QL
phys
ical
func
tioni
ng s
core
FU1:
n=1
171
(n=5
38, b
asel
ine
adju
sted
), n=
817
(n=3
75, f
urth
er a
djus
ted;
FU2
: n=
1056
(n=4
76, b
asel
ine
adju
sted
), n=
754
(n=3
46, f
urth
er a
djus
ted)
73.0
6 (1
8.07
)77
.79
(16.
28)
83.7
1 (1
3.86
)74
.87
(17.
26)
78.8
6 (1
5.14
)84
.18
(12.
85)
−0.6
49
(−4.
006
to
2.70
8)
0.61
80.
118
(−3.
411
to 3
.646
)0.
932
−0.1
91
(−3.
498
to
3.11
6)
0.88
20.
704
(−2.
557
to
3.96
5)
0.57
8
(Con
tinue
d)
RESEARCH
the bmj | BMJ 2018;360:k211 | doi: 10.1136/bmj.j3984 11
Tabl
e 5
| Adj
uste
d di
ffere
nces
for s
econ
dary
out
com
es (a
nthr
opom
etric
, die
t, ph
ysic
al a
ctiv
ity, a
nd p
sych
osoc
ial)
betw
een
cont
rol a
nd in
terv
entio
n ar
m a
t firs
t and
sec
ond
follo
w-u
p (C
ontin
ued)
Out
com
es: N
o at
FU1/
No a
t FU2
(No
in
inte
rven
tion
arm
)
Mea
n (S
D)/m
edia
n (in
terq
uart
ile ra
nge)
/No
(%)
Mea
n di
ffere
nce
(99%
CI)
or ri
sk d
iffer
ence
(99%
CI),
P v
alue
Inte
rven
tion
arm
Cont
rol a
rmIn
terv
entio
n v
cont
rol (
base
line
adju
sted
)*In
terv
entio
n v
cont
rol (
furt
her a
djus
ted)
†Ba
selin
eFU
1FU
2Ba
selin
eFU
1FU
2FU
1FU
2FU
1FU
2Pe
dsQ
L ps
ycho
soci
al fu
nctio
ning
sco
reFU
1: n
=117
0 (n
=538
, bas
elin
e ad
just
ed),
n=81
7 (n
=375
, fur
ther
adj
uste
d); F
U2:
n=10
54 (n
=476
, bas
elin
e ad
just
ed))
n=75
4 (n
=345
, fur
ther
adj
uste
d)
69.4
7 (1
7.95
)71
.27
(16.
58)
77.5
2 (1
4.40
)69
.28
(18.
19)
72.1
0 (1
5.81
)76
.27
(14.
96)
−0.6
61
(−3.
798
to
2.47
5)
0.58
71.
593
(−1.
598
to 4
.784
)0.
198
−0.6
79
(−3.
352
to
1.99
3)
0.51
31.
468
(−1.
480
to
4.41
5)
0.20
0
Peds
QL
emot
iona
l fun
ctio
ning
sco
reFU
1: n
=117
1 (n
=538
, bas
elin
e ad
just
ed),
n=81
7 (n
=375
, fur
ther
adj
uste
d); F
U2:
n=10
55 (n
=477
, bas
elin
e ad
just
ed),
n=75
5 (n
=346
, fur
ther
adj
uste
d)
73.3
6 (2
2.20
)75
.88
(21.
02)
83.4
2 (1
8.11
)71
.68
(23.
05)
75.7
5 (2
0.67
)81
.57
(18.
86)
−0.0
45
(−4.
236
to
4.14
7)
0.97
81.
972
(−1.
766
to 5
.710
)0.
174
0.11
5 (−
3.95
4 to
4.
184)
0.94
22.
021
(−1.
745
to
5.78
7)
0.16
7
Peds
QL
soci
al fu
nctio
ning
sco
re,F
U1: n
=116
9 (n
=537
, bas
elin
e ad
just
ed),
n=81
6 (n
=374
, fur
ther
adj
uste
d); F
U2:
n=10
53 (n
=475
, bas
elin
e ad
just
ed),
n=75
3 (n
=344
, fur
ther
adj
uste
d)
67.7
2 (2
2.34
)70
.89
(20.
52)
76.7
2 (1
8.31
)68
.60
(21.
71)
72.3
9 (1
9.39
)75
.81
(18.
91)
−1.1
34
(−4.
634
to
2.36
6)
0.40
40.
993
(−2.
517
to 4
.503
)0.
466
−1.1
37
(−4.
193
to
1.91
8)
0.33
81.
089
(−2.
305
to
4.48
3)
0.40
9
Peds
QL
scho
ol fu
nctio
ning
sco
reFU
1: n
=116
7 (n
=538
, bas
elin
e ad
just
ed),
n=81
4 (n
=375
, fur
ther
adj
uste
d); F
U2:
n=10
52 (n
=475
, bas
elin
e ad
just
ed),
n=75
2 (n
=345
, fur
ther
adj
uste
d)
67.3
5 (2
1.72
)67
.04
(20.
03)
72.4
0 (1
7.50
)67
.54
(21.
56)
68.0
7 (1
8.72
)71
.42
(18.
21)
−0.8
10
(−4.
533
to
2.91
2
0.57
51.
698
(−2.
181
to 5
.557
)0.
260
−0.8
76
(−4.
331
to
2.57
9)
0.51
41.
447
(−2.
077
to
4.97
1
0.29
0
Kids
cree
n-52
bul
lyin
gFU
1: n
=115
6 (n
=533
, bas
elin
e ad
just
ed),
n=80
6 (n
=370
, fur
ther
adj
uste
d; F
U2:
n=10
47 (n
=475
, bas
elin
e ad
just
ed),
n=74
9 (n
=343
, fur
ther
adj
uste
d)
11.7
4 (3
.20)
13.2
1 (6
.95)
14.3
0 (7
.92)
12.0
5 (2
.97)
14.2
2 (1
0.14
)14
.05
(6.2
8)−1
.101
(−
2.65
5 to
0.
453)
0.06
80.
594
(−0.
482
to 1
.671
)0.
155
−0.5
44
(−1.
930
to
0.84
2)
0.31
20.
359
(−0.
799
to
1.51
6)
0.42
5
Body
imag
e sa
tisfa
ctio
n sc
ore
FU1:
n=1
149
(n=5
33, b
asel
ine
adju
sted
), n=
805
(n=3
72, f
urth
er a
djus
ted)
; FU2
: n=
1044
(n=4
76, b
asel
ine
adju
sted
), n=
748
(n=3
44, f
urth
er a
djus
ted)
)
1.54
(1
.39)
1.37
(1
.17)
1.19
(1
.04)
1.56
(1
.40)
1.27
(1
.11)
1.11
(0
.96)
0.04
1 (−
0.16
8 to
0.
251)
0.61
10.
049
(−0.
132
to 0
.229
)0.
487
0.01
5 (−
0.16
8 to
0.
216)
0.84
7−0
.024
(−
0.18
5 to
0.
137)
0.70
0
MVP
A=m
oder
ate
to vi
goro
us p
hysi
cal a
ctiv
ity; P
edsQ
L=pe
diat
ric q
ualit
y of l
ife in
vent
ory;
BM
I=bo
dy m
ass i
ndex
; FU1
=1st
follo
w-up
; FU2
=2nd
follo
w-up
.*A
djus
ted
for b
asel
ine
outc
ome.
†Adj
uste
d fo
r bas
elin
e ou
tcom
e, b
asel
ine
pupi
l lev
el co
varia
tes:
(sex
, eth
nici
ty, d
epriv
atio
n (in
dex o
f mul
tiple
dep
rivat
ion
scor
e fo
r hom
e po
stco
de),
24 h
our t
otal
ene
rgy i
ntak
e, p
hysi
cal a
ctiv
ity e
nerg
y exp
endi
ture
), an
d ba
selin
e sc
hool
leve
l cov
aria
tes
(size
(num
ber o
f pup
ils o
n ro
ll), %
sch
ool p
opul
atio
n So
uth
Asia
n, %
sch
ool p
opul
atio
n Bl
ack
Afric
an-C
arib
bean
, % fr
ee s
choo
l mea
l elig
ibili
ty).
‡Inc
lude
d as
prim
ary o
utco
mes
in tr
ial r
egist
ry in
form
atio
n.§A
djus
ted
for b
asel
ine
body
mas
s ind
ex z
scor
e.¶I
nver
se tr
ansf
orm
atio
n us
ed.
**Su
m o
f fou
r ski
nfol
ds in
clud
ed s
umm
atio
n of
bice
ps, s
ubsc
apul
ar, s
upra
iliac
, and
trice
ps.
††Tr
ansf
orm
ed th
roug
h na
tura
l log
arith
m.
‡‡Tr
ansf
orm
ed th
roug
h sq
uare
root
.§§
Adju
sted
for t
otal
gra
ms o
f fru
it an
d ve
geta
bles
cons
umed
in 2
4 ho
urs.
¶¶Ad
just
ed fo
r min
utes
of m
oder
ate
to vi
goro
us P
A pe
r 24
hour
s.**
*Tra
nsfo
rmed
thro
ugh
squa
ring.

RESEARCH
12 doi: 10.1136/bmj.j3984 | BMJ 2018;360:k211 | the bmj
arms in group 2 schools and baseline differences in ethnicity, deprivation, and adiposity between group 1 and group 2 schools. There was a significant interaction in the effect of the intervention on the primary outcome between groups (P=0.001 (first follow-up) and P=0.02 (second follow-up) in the partially adjusted model). Analysis of outcomes by school group showed a statistically significantly lower BMI z score in the intervention arm compared with control arm at first follow-up in group 1 schools (mean difference –0.23, 95% confidence interval −0.35 to −0.12, P<0.01 for baseline adjusted model), which was maintained through to the third follow-up (although no longer statistically significant at the 1% level). In contrast there was no significant difference between arms at any time point in group 2 schools (see appendix, table A2).
Harms—quality of life, as total score or subdomains, social acceptance, or dissatisfaction with body image did not differ significantly between arms at any time. Thus we found no evidence of harm from the intervention.
Subgroup and sensitivity analyses—all subgroup analyses (by ethnicity, sex, socioeconomic or weight status, and fidelity of implementation) and sensitivity analyses were consistent with the main analyses and did not change any conclusions (results not shown).
Process evaluation—detailed results from the process evaluation are reported separately.17-19 Briefly, the intervention was generally well implemented, although no school delivered all components completely as intended. The scores developed to represent overall fidelity of programme implementation show that just under half the schools (12/26) achieved at least 75% of the maximum possible score and only five schools failed to achieve at least 65% of that maximum. Teachers found the daily physical activity intervention component the most challenging to deliver, with only four of 26 schools (17%) achieving high implementation fidelity for that component and 58% of schools (15/26) allocated to the low implementation fidelity group. In contrast, 42% (11/26) and 65% (17/26) of schools achieved high implementation fidelity for the cooking workshop and Villa Vitality components, respectively, with classification to the low implementation fidelity group for 42% (11/26) (cooking workshop) and 27% (7/26) (Villa Vitality). However, despite some challenges to implementation, the interviews and focus groups indicated that the programme was often well received both by teachers19 and by parents and children (see box).20
discussionWe found no overall evidence of improvement in the primary outcomes of reduction in body mass index (BMI) z scores at 15 and 30 months after a childhood obesity prevention programme delivered through schools and targeting 6 and 7 year olds. However, confidence intervals did not exclude between arm differences in BMI z score of 0.125, thought to be
clinically important for prevention. The intervention did not have any effects on secondary anthropometric, behavioural, or clinical outcomes, and there were no differential effects in prespecified subgroups. A clinically significant difference in BMI z score in favour of the intervention was seen in the first cohort of schools recruited that had data available at 39 months. Subsequent post hoc analysis suggests this may have been a cohort effect, with evidence of effectiveness in group 1 schools at all time points but no effect seen in group 2 schools at any time point. The outcomes used to assess harm did not differ between the groups.
Strengths and weaknesses of this studyThe WAVES study is a large childhood obesity prevention trial within a socioeconomically and ethnically diverse population, with sufficient sample size to assess the primary outcome. Phased development of the 12 month multicomponent intervention was guided by the Medical Research Council framework for complex interventions,9 21 including a successful feasibility trial.10 The intervention comprised elements identified as promising in systematic reviews5 6 and incorporated a range of behaviour change techniques, including those associated with positive outcomes in previous childhood obesity prevention trials.22 Outcomes were assessed with mainly objective measurements, using validated instruments and standardised protocols. Loss to follow-up was relatively small, with 80% of pupils retained to the second follow-up, and loss of one school. A prespecified analysis plan took account of clustering, and the findings were robust to a range of sensitivity analyses. This was also one of few trials that undertook longer term follow-up (39 months) to assess sustainability of intervention effects. Comprehensive process evaluation (described in more detail elsewhere16) helped to contextualise the findings and to interpret the results.17
Nevertheless, there were also several limitations. Parental consent for study measurements being obtained for only 60% of eligible children could introduce selection bias; however, a pupil level comparison of demographic characteristics (sex, ethnicity, deprivation) between those with and those without consent did not show any major differences. The balancing algorithm to allocate schools was based on whole school (cluster) level data. However, within clusters, only children from one year group were included, and just over half of those consented to study measurements. There was notable baseline imbalance between arms in the group 2 cohort (with the intervention arm having greater adiposity than the control arm), which, despite the use of adjustment methods, may have attenuated the main results. Statistical adjustment assumes a common linear relation between covariates and outcome in all clusters, and misspecification of the model may lead to both under-adjustment and over-adjustment. Baseline imbalance is a known limitation of cluster trials and can best be overcome with recruitment of larger numbers
RESEARCH
the bmj | BMJ 2018;360:k211 | doi: 10.1136/bmj.j3984 13
of clusters. Although follow-up to 30 months was in all groups, longer term follow-up (to 39 months) was limited to a subset of participating schools. The Child And Diet Evaluation Tool (CADET) provided a quick, practical dietary assessment tool with relatively low respondent burden,24 25 resulting in useable data from approximately 85% of children at baseline (81% first follow-up, 82% second follow-up). However, estimates of dietary intake may not reflect habitual intake, there was a risk of misreporting,26 and there may have been seasonal variation27 between data collection periods. Usable data on physical activity were available for 76% of children at baseline (60% first follow-up, 52% second follow-up). These are similar to the rates achieved in other such studies.28
Comparison with other studiesOur results build on the findings of previous reviews and address limitations in previous childhood obesity prevention trials. Two systematic reviews suggested that there was moderate6 to strong5 evidence of effectiveness of school based interventions in preventing childhood obesity, although heterogeneity of interventions, variable design quality, and lack of longer term follow-up limit interpretation. A meta-analysis showed that the summary magnitude of effect on BMI z score compared with the control was −0.15 units,5 which is smaller than the effect size used for estimating sample size in our trial. Nevertheless, the WAVES study was larger than the 21 previous obesity prevention trials with low risk of bias included in the meta-analysis (n=9 to 574). Since the publication of the reviews, findings from another UK cluster randomised controlled trial, the Active for Life Year 5 (AFLY5) including more than 2000 children from 60 schools are available.28 The trial primarily attempted to influence activity levels and fruit and vegetable consumption, although it also reported on adiposity outcomes. The intervention was curriculum based, focusing on educational approaches rather than the more experiential skills based intervention in the WAVES study. In contrast with our trial, the target population was children at the end of the primary school years, when rates of obesity have already increased substantially, and included few children from minority ethnic groups and more deprived areas. Nevertheless, similar to our findings, there was no
evidence of an intervention effect on behavioural or weight outcomes at 12 months.
Interpretation of the findingsThe balance of components, intensity, and behaviour change strategies used to deliver the intervention may have contributed to the absence of evidence of effect on the primary outcomes in WAVES and other trials. Although fidelity of implementation for the WAVES study intervention programme was reasonably high overall, no school delivered all components completely per protocol, and a few schools failed to deliver some or all of the components. This may have attenuated any effect.29 In addition, owing to competing demands on teachers, components that required greater teacher input tended to be less well implemented and this was the main explanation for differences in fidelity between components. This suggests that delivery of a more intensive teacher led intervention in a school setting would not be feasible without additional resources. Educational and experiential interventions of longer duration that are embedded within a whole school setting are likely to be prohibitively costly and complex to evaluate using clinical trial methods. The intervention was developed on the basis of promising strategies in trials published before the feasibility study (about 10 years before the definitive trial). As a result, strategies such as those based on behavioural economics aimed at altering the social and physical environment were not included as part of the intervention. Although the findings from the feasibility study suggested the WAVES intervention was promising, intervention delivery for the trial and subsequent follow-up measurements took place some years later, during which time wider environmental changes might have diluted any effects. Researcher contact with schools during the feasibility study was also much greater, but this was not replicable in the definitive trial with a larger number of schools and would not be implementable outside of a trial setting. Methodological limitations with baseline imbalance may have also contributed to the observed findings with heterogeneity of effect between schools. However, even the cohort effect observed in group 1 schools was small, suggesting that childhood obesity prevention is unlikely to be achieved by schools alone. While school is an important setting for influencing children’s health behaviour, and delivery of knowledge and skills to support healthy lifestyles is one of its mandatory functions, wider influences from the family, community, media, and the food industry must also be considered. The qualitative data from teachers19 and parents,20 collected as part of our process evaluation, support the possibility that these wider influences have a greater effect than any school based intervention. A metasynthesis of qualitative studies exploring the role of primary schools in preventing childhood obesity highlighted the need for schools, parents, and government to work together to promote healthy lifestyles in children and to support activities in the school setting.30
Quotes about the programme∙ It was fantastic and combining the sport and the nutrition was brilliant (teacher)∙ There’s no doubt about it they’ve loved it, yeah . . . so it’s been really good for them
and that’s what it’s all about really isn’t it (teacher)∙ It’s good to have it reinforced I think from somebody other than your parents,
sometimes if your teacher says it, it’s true! (parent)∙ She’s willing to try more fruits and vegetables, that’s what I’m pleased with
probably more, before she was quite picky with what she’d have, but now she is willing to try new things (parent)
∙ I teached my mum how to cook it when we cooked in Aston Villa. And I chop a bit at home because I learned how to chop at Aston Villa (child)
∙ Because I’ve done my exercise I can think harder and try (child)

RESEARCH
14 doi: 10.1136/bmj.j3984 | BMJ 2018;360:k211 | the bmj
ConclusionsThe multicomponent WAVES study intervention, which was feasible to deliver and for which there was no evidence of harm, did not result in a statistically significant difference in BMI z score overall, and there was no evidence of effect on measured diet or physical activity levels in children. Although wider implementation of this intervention cannot be recommended for obesity prevention, the lower cost components could be considered by schools to fulfil their mandated responsibilities for education on health and wellbeing. Within the context of the wider evidence, it is likely that any effect of school based educational, motivational, and skill centred interventions on obesity prevention is small. Several community based interventions targeting wider environments have also been evaluated recently, using non-randomised experimental designs. Although a few of these have shown evidence of small effects and lower weight gain in children from intervention communities,31 32 the findings are not consistent33 and need further evaluation. Interventions based on behavioural economics such as nudge theory34 also merit further investigation. Even marginal effects may be important within a wider systems approach to obesity prevention, which incorporates multiple agencies and widespread policy change to support healthy behaviours.
AUTHOR AFFILIATIONS1Institute of Applied Health Research, University of Birmingham, Birmingham, UK2School of Clinical and Experimental Medicine, University of Birmingham; Birmingham, UK3Edinburgh Migration, Ethnicity and Health Research Group, Usher Institute of Population Health Sciences and Informatics, The University of Edinburgh, UK4Nutritional Epidemiology Group, School of Food Science and Nutrition, University of Leeds, Leeds, UK5Warwick CTU, University of Warwick, Warwick, UK6School of Sport, Exercise and Rehabilitation Sciences, University of Birmingham, Birmingham, UK7Cambridge MRC Epidemiology Unit, Cambridge, UK8Department of Sports Medicine, Norwegian School of Sport Sciences, Oslo, Norway9Birmingham Community Healthcare NHS Trust, Birmingham, UK10Services for Education, Birmingham, UK
The order of authorship is based on relative contributions for the first five authors (PA to EF) and last author (KKC). The remaining authors (TB to SP) are listed alphabetically.We thank the children, school staff, and parents who participated in the trial; the children, teachers, and parents who took part in interviews and focus groups as part of the process evaluation; the support of staff at Aston Villa football club in delivering the Villa Vitality programme; the study team, including Behnoush Mohammadpoor Ahranjani and Emma Popo who helped in overseeing the study measurements and data collection; the administrative team who facilitated the running of the project; the research staff who undertook the study measurements; and Robert Lancashire who developed the trial database and oversaw data management.The trial steering committee met annually and included: chair/statistician: Kelvin Jordan, Keele University; subject expert: Peter Whincup, St George’s, University of London; health economist: Louise Longworth, Brunel University; public representative: John Bennett, PHSE advisor; and investigators: Peymane Adab and Miranda Pallan, University of Birmingham.
Owing to the timelines of recruitment and outcome assessments, there was no opportunity for interim analyses, and the trial steering committee undertook the role of assessment of data quality and completion.Contributors: All WAVES study trial co-investigators contributed to the development of the design for the WAVES study trial and had contributed to the intervention development as part of the BEACHeS Study. PA wrote the first draft of the paper and all authors contributed to critical revisions. PA, MP, and KKC planned the overall design of the trial. ERL coordinated all aspects of the trial, oversaw data collection, collation, and cleaning, and contributed to data analysis. She also contributed to the first draft of the manuscript. EF contributed to the design of the trial and analysis plan, and AC advised on study instruments and undertook some of the analysis. JJD and KaH contributed to sampling, sample size estimation, and the statistical analysis plan. JM undertook data analysis, supervised by KaH and with support from ERL. UE advised on physical activity measurements and related methods and oversaw the preparation of the physical activity data. JEC advised on dietary assessment and related methods and oversaw the CADET data preparation. KiH led data collection and analysis of dietary data. JLD advised on some of the psychosocial assessment methods. TB, PG, and RB advised on clinical measurement processes. RB and PG advised on aspects related to ethnicity. AD advised on the physical activity intervention component. SP advised on school recruitment and approaches to keeping schools engaged. EM advised on the dietary intervention components. JP advised on process evaluation, and TG designed the detailed methods for this. TG and JLC contributed to data collection and undertook analysis and interpretation of the process evaluation. The final manuscript was read and approved by all authors. PA, ERL, and MP are guarantors.Funding: This study was funded by the National Institute for Health Research (NIHR) Health Technology Assessment Programme (project reference No 06/85/11). The funder had no role in study design, data collection, data analysis, data interpretation, or writing of the report. The corresponding author had full access to all the data in the study and had final responsibility for the decision to submit for publication. The University of Birmingham holds the relevant insurance policy for this study and acted as the main sponsor. The views and opinions expressed therein are those of the authors and do not necessarily reflect those of the Health Technology Assessment, NIHR, National Health Service, or the Department of Health. The funders have played no role in the design, collection, analysis, and interpretation of data, nor in the writing of the manuscript and in the decision to submit the manuscript for publication.Competing interests: All authors have completed the ICMJE uniform disclosure form at www.icmje.org/coi_disclosure.pdf and declare: no support from any organisation for the submitted work; no financial relationships with any organisations that might have an interest in the submitted work in the previous three years; no other relationships or activities that could appear to have influenced the submitted work.Ethical approval: The trial was approved by NHS Research Ethics Service Committee West Midlands, The Black Country (NHS REC No 10/H1202/69).Data sharing: Requests for access to data from the WAVES study should be addressed to the corresponding author at [email protected]. All the individual participant data collected during the trial (including the data dictionary) will be available, after deidentification, immediately after publication with no end date. The study protocol has been published. All proposals requesting data access will need to specify how it is planned to use the data, and all proposals will need approval of the trial co-investigator team before data release.Transparency: The guarantors (PA, ERL, and MP) affirm that the manuscript is an honest, accurate, and transparent account of the study bring reported; that no important aspects of the study have been omitted; and that any discrepancies from the study as planned (and, if relevant, registered) have been explained.This is an Open Access article distributed in accordance with the terms of the Creative Commons Attribution (CC BY 4.0) license, which permits others to distribute, remix, adapt and build upon this work, for commercial use, provided the original work is properly cited. See: http://creativecommons.org/licenses/by/4.0/.
1 World Health Organization. Commission on Ending Childhood Obesity. Report of the Commission on Ending Childhood Obesity. Geneva, 2016.
2 Serdula MK, Ivery D, Coates RJ, Freedman DS, Williamson DF, Byers T. Do obese children become obese adults? A review of the literature. Prev Med 1993;22:167-77. doi:10.1006/pmed.1993.1014

RESEARCH
No commercial reuse: See rights and reprints http://www.bmj.com/permissions Subscribe: http://www.bmj.com/subscribe
3 Withrow D, Alter DA. The economic burden of obesity worldwide: a systematic review of the direct costs of obesity. Obes Rev 2011;12:131-41. doi:10.1111/j.1467-789X.2009.00712.x.
4 Lifestyles Statistics Team HaSCIC. National Child Measurement Programme: England, 2014/15 school year, 2015.
5 Waters E, de Silva-Sanigorski A, Hall BJ, et al. Interventions for preventing obesity in children. Cochrane Database Syst Rev 2011;(12):CD001871.
6 Wang Y, Wu Y, Wilson RF, et al. Childhood obesity prevention programs: comparative effectiveness review and meta-analysis. Comparative effectiveness review No. 115. AHRQ Publication No. 13-EHC081-EF. Agency for Healthcare Research and Quality, 2013.
7 Campbell M, Fitzpatrick R, Haines A, et al. Framework for design and evaluation of complex interventions to improve health. BMJ 2000;321:694-6. doi:10.1136/bmj.321.7262.694.
8 Adab P, Pallan MJ, Lancashire ER, et al. A cluster-randomised controlled trial to assess the effectiveness and cost-effectiveness of a childhood obesity prevention programme delivered through schools, targeting 6-7 year old children: the WAVES study protocol. BMC Public Health 2015;15:488. doi:10.1186/s12889-015-1800-8.
9 Pallan M, Parry J, Cheng KK, Adab P. Development of a childhood obesity prevention programme with a focus on UK South Asian communities. Prev Med 2013;57:948-54. doi:10.1016/j.ypmed.2013.08.025
10 Adab P, Pallan MJ, Cade J, et al. Preventing childhood obesity, phase II feasibility study focusing on South Asians: BEACHeS. BMJ Open 2014;4:e004579. doi:10.1136/bmjopen-2013-004579.
11 Ford AL, Hunt LP, Cooper A, Shield JP. What reduction in BMI SDS is required in obese adolescents to improve body composition and cardiometabolic health?Arch Dis Child 2010;95:256-61. doi:10.1136/adc.2009.165340.
12 Kolsgaard MLP, Joner G, Brunborg C, Anderssen SA, Tonstad S, Andersen LF. Reduction in BMI z-score and improvement in cardiometabolic risk factors in obese children and adolescents. The Oslo Adiposity Intervention Study - a hospital/public health nurse combined treatment. BMC Pediatr 2011;11:47. doi:10.1186/ 1471-2431-11-47.
13 Carter B. Cluster size variability and imbalance in cluster randomized controlled trials. Stat Med 2010;29:2984-93. doi:10.1002/sim.4050.
14 Stata statistical software: Release 13. [program] StataCorp LP, 2013.15 Carpenter JR, Goldstein H, Kenward MG. REALCOM-IMPUTE software
for multilevel multiple imputation with mixed response types. J Stat Softw 2011;45:1-14doi:10.18637/jss.v045.i05.
16 Griffin TL, Pallan MJ, Clarke JL, et al, WAVES study trial investigators. Process evaluation design in a cluster randomised controlled childhood obesity prevention trial: the WAVES study. Int J Behav Nutr Phys Act 2014;11:112. doi:10.1186/s12966-014-0112-1.
17 Griffin TL, Clarke JL, Lancashire ER, Pallan MJ, Adab PWAVES study trial investigators. Process evaluation results of a cluster randomised controlled childhood obesity prevention trial: the WAVES study. BMC Public Health 2017;17:681. doi:10.1186/s12889-017-4690-0.
18 Griffin TL, Clarke JL, Lancashire ER, et al. Teacher experiences of delivering an obesity prevention programme (The WAVES study intervention) in a primary school setting. Health Educ J 2015;74. doi:10.1177/0017896914556907.
19 Clarke JL, Griffin TL, Lancashire ER, Adab P, Parry JM, Pallan MJ, WAVES study trial investigators. Parent and child perceptions of school-based obesity prevention in England: a qualitative study. BMC Public Health 2015;15:1224. doi:10.1186/s12889-015-2567-7.
20 Craig P, Dieppe P, Macintyre S, Michie S, Nazareth I, Petticrew M, Medical Research Council Guidance. Developing and evaluating complex interventions: the new Medical Research Council guidance. BMJ 2008;337:a1655. doi:10.1136/bmj.a1655
21 Martin J, Chater A, Lorencatto F. Effective behaviour change techniques in the prevention and management of childhood obesity. Int J Obes (Lond) 2013;37:1287-94. doi:10.1038/ijo.2013.107.
22 Cade JE, Frear L, Greenwood DC. Assessment of diet in young children with an emphasis on fruit and vegetable intake: using CADET--Child and Diet Evaluation Tool. Public Health Nutr 2006;9:501-8. doi:10.1079/PHN2005871
23 Christian MS, Evans CE, Nykjaer C, Hancock N, Cade JE. Measuring diet in primary school children aged 8-11 years: validation of the Child and Diet Evaluation Tool (CADET) with an emphasis on fruit and vegetable intake. Eur J Clin Nutr 2015;69:234-41. doi:10.1038/ejcn.2014.160.
24 Macdiarmid J, Blundell J. Assessing dietary intake: Who, what and why of under-reporting. Nutr Res Rev 1998;11:231-53. doi:10.1079/NRR19980017
25 Zaborskis A, Moceviciene R, Iannotti RJ. The influence of chronological period of data collection on differences in reported dietary intake among school-aged children surveyed in 39 countries. J Nutr Educ Behav 2014;46:359-69. doi:10.1016/j.jneb.2013.11.017
26 Kipping RR, Howe LD, Jago R, et al. Effect of intervention aimed at increasing physical activity, reducing sedentary behaviour, and increasing fruit and vegetable consumption in children: active for Life Year 5 (AFLY5) school based cluster randomised controlled trial. BMJ 2014;348:g3256. doi:10.1136/bmj.g3256.
27 Naylor P-J, Nettlefold L, Race D, et al. Implementation of school based physical activity interventions: a systematic review. Prev Med 2015;72:95-115. doi:10.1016/j.ypmed.2014.12.034.
28 Clarke J, Fletcher B, Lancashire E, Pallan M, Adab P. The views of stakeholders on the role of the primary school in preventing childhood obesity: a qualitative systematic review. Obes Rev 2013;14:975-88. doi:10.1111/obr.12058.
29 Vinck J, Brohet C, Roillet M, et al. Downward trends in the prevalence of childhood overweight in two pilot towns taking part in the VIASANO community-based programme in Belgium: data from a national school health monitoring system. Pediatr Obes 2016;11: 61-7. doi:10.1111/ijpo.12022.
30 Swinburn B, Malakellis M, Moodie M, et al. Large reductions in child overweight and obesity in intervention and comparison communities 3 years after a community project. Pediatr Obes 2014;9:455-62. doi:10.1111/j.2047-6310.2013.00201.x.
31 De Henauw S, Huybrechts I, De Bourdeaudhuij I, et al, IDEFICS consortium. Effects of a community-oriented obesity prevention programme on indicators of body fatness in preschool and primary school children. Main results from the IDEFICS study. Obes Rev 2015;16(Suppl 2):16-29. doi:10.1111/obr.12346.
32 Lycett K, Miller A, Knox A, et al. ‘Nudge’ interventions for improving children’s dietary behaviors in the home: A systematic review. Obes Med 2017;7:21-33. doi:10.1016/j.obmed.2017.06.001.
33 Cole TJ, Freeman JV, Preece MA. Body mass index reference curves for the UK, 1990. Arch Dis Child 1995;73:25-9. doi:10.1136/adc.73.1.25
34 Jackson LV, Thalange NKS, Cole TJ. Blood pressure centiles for Great Britain. Arch Dis Child 2007;92:298-303. doi:10.1136/adc.2005.081216.