effects of frequency and similarity neighborhoods
TRANSCRIPT

Drug Name Perception 1
Effects of Frequency and Similarity Neighborhoods
on Pharmacists’ Visual Perception of Drug Names
Bruce L. Lambert, Ph.D.a, b
Ken-Yu Chang, Ph.D.c
Prahlad Gupta, Ph.D.d
aDepartment of Pharmacy Administration bDepartment of Pharmacy Practice
University of Illinois at Chicago
cCenter for Pharmaceutical Appraisal and Outcomes Research
Abbott Laboratories
dDepartment of Psychology
University of Iowa
In Press, Social Science & Medicine
Short Title: Drug Name Perception
Address: Department of Pharmacy Administration,
833 S. Wood Street (M/C 871), Chicago, IL 60612-7231
Phone: 312-996-2411
Fax: 312-996-0868
Email: [email protected]
Word Count: 7277 (main body text)

Drug Name Perception 2
Abstract
To minimize drug name confusion errors, regulators, drug companies, and clinicians need
tools that help them predict which names are most likely to be involved in confusions. Two
experiments examined the effects of stimulus frequency (i.e., how frequently a target name is
prescribed), neighborhood frequency (i.e., how frequently prescribed are the “neighbors” of the
target name), and neighborhood density (how many names are within a fixed distance of the
target name) on the probability of pharmacists making an error in a visual perceptual
identification task. In both experiments, the task was to correctly identify a series of blurry drug
names after a three second presentation on a computer monitor. In the first experiment, 45
pharmacists viewed 160 typewritten names, incorrectly identifying 60.6% of them. Random
effects regression revealed a significant beneficial effect of stimulus frequency and a detrimental
effect of neighborhood density. Significant two-way interactions were observed between
stimulus frequency and neighborhood density and neighborhood frequency and neighborhood
density. In the second experiment, 37 pharmacists viewed 156 handwritten drug names,
incorrectly identifying 45.7%. Random effects regression revealed significant main effects of
stimulus frequency and neighborhood density. These were contained within a significant three-
way interaction: The interaction between stimulus frequency and neighborhood density was
present at high but not low neighborhood frequency. Objectively measurable frequency and
neighborhood characteristics have predictable effects on errors in pharmacists’ visual perception.
Organizations that coin and evaluate drug names, as well as hospitals, pharmacies, and health
systems, should consider these characteristics when assessing visual confusability.

Drug Name Perception 3
Keywords: drug name confusion, patient safety, frequency, similarity, neighborhood, visual
perception, pharmacists, medication errors

Drug Name Perception 4
INTRODUCTION
Recent estimates suggest that medical errors of all types may cause the death of between
44,000 and 98,000 hospitalized patients in the United States each year (Kohn, Corrigan, &
Donaldson, 2000). Errors involving medication cause the death of one person every day in the
U.S., and injure more than a million more each year (U.S. Food and Drug Administration, 2001).
Confusions between drug names that look and sound alike account for between 15% and 25% of
reported medication errors in the U.S. (U. S. Pharmacopeia, 1995; U. S. Pharmacopeia, 1996; U.
S. Pharmacopeia, 2001). Similarity between drug names can cause errors in short-term memory
as well as in visual and auditory perception (Brodell, Helms, KrishnaRao, & Bredle, 1997;
Lambert, Chang, & Lin, 2001b; Lambert, Chang, Lin, & Gupta, 2000; Lambert, Lin, Gandhi, &
Chang, 1999; Luce & Pisoni, 1998; Luce, 1959). This investigation examined the effect of
similarity and prescribing frequency on pharmacists’ ability to accurately identify blurry, briefly
presented, handwritten and typewritten drug names. Two research questions provided the
motivation for the experiments that follow:
RQ1: To what extent is a pharmacist’s ability to identify a target drug name
affected by the prescribing frequency of the target, the number of names similar to
the target, and the prescribing frequency of the similar names?
RQ2: To what extent do the characteristics in RQ1 have different effects
depending on whether the drug name is handwritten or typewritten?
THEORETICAL BACKGROUND
Activation-Competition Models of Visual Perception
The “interactive activation” framework has been very influential in development of
cognitive psychology theories of visual word recognition, following a seminal formulation of

Drug Name Perception 5
this approach by McClelland & Rumelhart (McClelland & Rumelhart, 1981; Rumelhart &
McClelland, 1982). In such a model, words are represented in memory as networks of nodes
connected by excitatory and inhibitory links. The nodes are typically arranged in a hierarchy of
levels. Lower level nodes detect particular letters. High level nodes detect particular words.
When a word stimulus is presented, the flow of activation is bottom-up from the feature level to
the letter level and eventually to the word level (see Figure 1 for a simplified schematic).
However, a crucial aspect of the interactivity within the system is that, as time passes, the letter-
level nodes can be reinforced via excitatory links from the word-level nodes, and vice versa.
Thus there is a “top-down” influence on processing, because word-level nodes contribute to the
activation of letter-level nodes. Another crucial aspect of this framework is that active nodes at a
particular level try to suppress the activations of other nodes at the same level, via inhibitory
connections. Thus nodes at a particular level “compete” to be active (Grainger & Dijkstra, 1996;
Grainger & Jacobs, 1996).
----------------------- Figure 1 about here -----------------------
This original formulation of the interactive activation theory did not aim to capture the
distributional statistics of word groups. That is, it did not precisely reflect the fact that a word
like “cat” has many similar words (which will therefore compete with it for activation at the
word level) whereas a word like “atrocity” has few similar words (and therefore less competition
at the word level), nor did it capture the frequencies of different words. Recent work has
extended the basic ideas of the interactive activation framework to creation of models that can
represent word frequency, and that can investigate how words in a “neighborhood” interact in
complex ways, leading sometimes to inhibition of each other, and sometimes to facilitation,

Drug Name Perception 6
under certain circumstances (Andrews, 1997; Dell, Schwartz, Martin, Saffran, & Gagnon, 1997;
Grainger & Jacobs, 1996; Jacobs & Grainger, 1994; Mathey, 2001; Perea & Rosa, 2000). The
following two sections summarize the observed effects of frequency and neighborhood
characteristics on a variety of word recognition tasks.
Frequency Effects on Visual Perception of Words
One of the oldest and most consistent finding in psycholinguistics is that word frequency
(normally defined as the frequency with which a word appears in print) enhances word
recognition. Nearly 50 years ago, Solomon and others showed that as word frequency increases,
the time needed to correctly identify a briefly presented word decreases (Howes & Solomon,
1951; Solomon & Postman, 1952). Similar effects have been repeatedly demonstrated in a
variety of related tasks, including lexical decision (i.e., time needed to decide whether a stimulus
is a word or nonsense string), perceptual identification (i.e., identifying a briefly presented or
degraded word), and naming (i.e., time needed to pronounce a visually presented word) (Balota,
1994; Grainger & Dijkstra, 1996; Grainger & Segui, 1990; Monsell, 1991; Whitlow &
Cebollero, 1989). Although this study focuses on visual perception, it is worth noting that
analogous frequency effects have been found for perceptual identification of auditorily presented
words as well (Luce, Pisoni, & Goldinger, 1990). The precise mechanism by which frequency
exerts its effects is still controversial. The main ideas are either (a) that high frequency word
nodes have higher resting activation levels and hence are quicker to exceed a recognition
threshold or (b) that frequency biases decision processes independent of activation levels
(Andrews, 1997; Grainger & Dijkstra, 1996; Grainger & Jacobs, 1996). Regardless of the precise
mechanism, it is clear that in perceptual identification tasks, more frequent words are identified
more quickly and accurately than less frequent words. This leads to our first hypothesis:

Drug Name Perception 7
Hypothesis 1: High frequency drug names will be identified more accurately than low
frequency drug names in a visual perceptual identification task.
Neighborhood Effects on the Visual Perception of Words
Another consistent finding is that word recognition is affected by the properties of a word’s
neighborhood (Andrews, 1997; Havens & Foote, 1963; Mathey, 2001; Perea & Rosa, 2000). In this
context, ‘neighborhood’ refers to the set of words that are within some similarity boundary of the
target word. The most common operational definition of orthographic (i.e., spelling) neighborhood is
the set of all words of the same length that share all but one letter in the same position as the target
word (Coltheart, Davelaar, Jonasson, & Besner, 1977). For example, in terms of this definition,
orthographic (i.e. written) neighbors of the word ‘dog’ include ‘cog’, ‘dig’, and ‘dot’. The set of
all such words differing in only one letter from ‘dog’ makes up the orthographic neighborhood of
dog. (As discussed below, this definition will prove to be too strict when working with drug names.)
Two specific features of a word’s neighborhood have received most of the experimental attention:
neighborhood frequency and neighborhood density (sometimes called neighborhood size or simply
N). Neighborhood frequency refers to how frequent the words in the neighborhood are. One
common operational definition is to assign neighborhood frequency the value 1 if at least one of
the neighbors has a higher frequency than the word itself, and to assign neighborhood frequency
a value of 0, otherwise (Andrews, 1997). Generally speaking, words with at least one higher
frequency neighbor are harder to recognize than words with no higher frequency neighbors
(Newbigging, 1961). In a recent review of 16 published papers that studied neighborhood effects on
a variety of tasks, Andrews notes that neighborhood frequency inhibited recognition in 14 of 23
experiments (Andrews, 1997). The effects were null in 5 experiments and facilitatory in 4
experiments (Andrews, 1997). In perceptual identification, the task most relevant to the current

Drug Name Perception 8
experiments, 3 out of 3 experiments found that neighborhood frequency inhibited perceptual
identification (Andrews, 1997; Carreiras, Perea, & Grainger, 1997; Grainger & Jacobs, 1996;
Grainger & Segui, 1990). This leads to our second hypothesis:
Hypothesis 2: Drug names with low neighborhood frequency will be identified more
accurately than names with high neighborhood frequency in a visual perceptual
identification task.
The effects of neighborhood density, on the other hand, depend on the task (Andrews, 1997).
For lexical decision and naming tasks, neighborhood density facilitates recognition. That is, words
with many neighbors are easier to name and recognize as true words than words with few neighbors.
In contrast, for the perceptual identification task that is our main focus, neighborhood density inhibits
performance. Under brief or degraded stimulus conditions, performance is slower and less accurate
for words with many neighbors than it is for words with few neighbors (Andrews, 1997; Carreiras et
al., 1997; Snodgrass & Mintzer, 1993). Thus, our third hypothesis is as follows:
Hypothesis 3: Drug names with low neighborhood density will be identified
more accurately than names with high neighborhood density in a visual perceptual
identification task.
EXPERIMENT 1
PERCEPTUAL IDENTIFICATION OF TYPEWRITTEN DRUG NAMES
Methods
Design
This experiment was designed to examine the effect of prescribing frequency,
neighborhood frequency and neighborhood density on the probability of a pharmacist making an
error in a visual perceptual identification task. Participants viewed a series of noise-masked,

Drug Name Perception 9
typewritten drug names as they were briefly presented on a computer monitor. The task was to
correctly identify the presented name by typing it into a provided text box. All experiments were
approved in advance by the local institutional review board, and all participants orally consented
to participate.
Participants
Forty-five licensed, practicing pharmacists participated in Experiment 1. Participants
were recruited from among the attendees at the 2000 annual meeting of the American
Pharmaceutical Association in Washington, DC. Individuals were not paid for their participation.
Stimulus Materials
One hundred sixty (160) three-syllable drug names were selected to fill the cells of a 2 x
2 x 2 stratified sampling design, where the strata were stimulus frequency (high/low),
neighborhood frequency (high/low), and neighborhood density (high/low) (see Figures 2-3 and
Tables 1-3). Names and prescribing frequencies were obtained from the drug databases
------------------------------------------ Figures 2-3 about here
------------------------------------------
contained within the U. S. National Ambulatory Medical Care Survey (NAMCS) and the U. S.
National Hospital Ambulatory Medical Care Survey (NHAMCS) for the years 1992-1996
(National Center for Health Statistics, 2001a; National Center for Health Statistics, 2001b).
NAMCS and NHAMCS surveys are based on a nationally representative sample of outpatient
physicians working in traditional outpatient offices (NAMCS) as well as hospital emergency
departments and outpatient clinics (NHAMCS). NAMCS surveys exclude anesthesiologists,
radiologists and pathologists. NHAMCS excludes federal, military, and Veterans Administration
Hospitals. Prescribing frequencies were based on national estimates derived by weighting raw

Drug Name Perception 10
frequencies to reflect the probabilistic sampling design of NAMCS and NHAMCS respectively.
Henceforth, when we refer to stimulus frequency, we are referring to the log10 of the five-year
(1992-1996) cumulative frequencies from the combined NAMCS and NHAMCS data.
Operational definitions of neighborhood, neighborhood frequency and
neighborhood density. Both neighborhood frequency and neighborhood density presume some
definition of neighborhood. As noted in the introduction, an orthographic neighborhood has
typically been defined as the set of words (of the same length) that differ from the target word by
only one letter in one position (Andrews, 1997). An equivalent way to describe this set of words
is that they have an “edit distance” of 1 from the word itself (Stephen, 1994). This definition has
most commonly been applied to single syllable, three-letter, consonant-vowel-consonant words.
This definition struck us as too restrictive because (a) most drug names are multisyllabic
(Lambert, Chang, & Lin, 2001a) and (b) because documented pairs of confusing names typically
differ by several letters in several positions (in fact the mean edit distance for more than 1000
reported confusing pairs was 4) (Lambert et al., 1999). Since the modal drug name in the U.S. is
three syllables, we chose to use three syllable names, and we extended the definition of
neighborhood to be any name that fell within an edit distance of 3 edits from the target name
(i.e., one letter insertion, deletion or substitution per syllable, a logical extension of the
traditional definition) (Lambert et al., 2001a; Lambert et al., 1999). Neighborhood frequency has
typically been defined as a dichotomous variable that was equal to one if the neighborhood
contained at least one word whose frequency was greater than the target word (Andrews, 1997).
We chose instead to define neighborhood frequency as the mean frequency of all the words in
the target word’s neighborhood. This definition reflected our belief that all of the names in a
neighborhood potentially compete with the target name, not just the most frequent name. Finally,

Drug Name Perception 11
neighborhood density was the number of names that fell within an edit distance of 3 from the
target name.
Examples. High log stimulus frequency (SF) names (i.e., those with log SF > 7) included
Ventolin®, Dyazide®, and Provera®. Low log SF names (log SF < 3) included Vistazine®,
Antispas®, and Protaphane®. Flexeril® is an example of a name from a sparse neighborhood: it
had no neighbors in the combined NAMCS/NHAMCS database. An example of a name from a
dense neighborhood is Dynabac®, whose neighbors included : Synalar®, Rynatan®, Dynapen®,
Dynacirc®, and Dynacin®. Another name from a high density neighborhood is Virilon®, whose
neighbors included: Verelan®, Uridon®, Trilion®, Miradon®, and Daricon®. Tables 1 and 2
together describe the frequency and neighborhood characteristics of the stimulus names.
Success of stratification. In cell-to-cell comparisons, sets of names at the same level of a
stratum (e.g., all names at high levels of stimulus frequency) did not differ statistically from one
another on their scores for that factor. Conversely, names from cells at different levels of a
sampling stratum did differ significantly from one another. All cell-to-cell comparisons were
based on Tukey’s Honestly Significant Difference. Table 2 gives descriptive statistics for
stimulus frequency, neighborhood frequency, and neighborhood density for all eight cells. Table
3 shows the correlation between stimulus frequency, neighborhood frequency and neighborhood
density.
------------------------------------------ Tables 1-3 about here
------------------------------------------
Stimulus degradation. The names were degraded (i.e., masked by noise) using the
degradation features built into the PsyScope® experiment program (Cohen, MacWhinney, Flatt,
& Provost, 1993). We used foreground degradation of 50% and background degradation of 10%.

Drug Name Perception 12
Foreground degradation randomly removes pixels from the foreground image. Background
degradation randomly adds black pixels to the background image. Overall, the effect resembles a
typewritten name that has been received through a fax machine with a dirty print cartridge that
was running out of ink. (It was not possible to capture a screen shot of the degraded stimuli as
they appeared within the PsyScope program, but interested individuals can reproduce the effect
precisely by using the freely available software and the specifications given above.)
Procedure
Individuals were approached in the exhibit halls and corridors of the convention center
and asked: (a) if they were currently a licensed, practicing pharmacist in the U.S. and (b) if they
were interested in participating in a study of drug name confusion. Those who agreed were
directed to a meeting room where the experiment was being conducted. Participants read a
consent form, filled out a brief demographic questionnaire, and then seated themselves in front of
a Macintosh computer with a 17-inch color monitor. The experiment began by presenting the
instructions on the computer screen. Participants were told that their task was to correctly
identify a series of briefly presented, blurry, typewritten drug names. Each trial began when the
participant pressed any key on the keyboard. A row of capital X’s then appeared at the center of
the screen in 36-point Times font. When the participant pressed any key, the X’s disappeared and
a noise-masked drug name appeared. Each name appeared for three seconds, with its first letter
capitalized, in the center of the screen in 36-point Times font. After three seconds, the name was
replaced by another row of capital X’s for 750 milliseconds. Finally, a text box appeared in
which the participant typed the name of the drug they thought they saw. Although participants
were allowed to leave a blank, they were encouraged to generate an answer (a guess) whenever

Drug Name Perception 13
possible. Participants were urged to check the spelling before proceeding. This process was
repeated until each of the 160 names had been presented.
Analysis Plan
The goal of our analysis was to determine the main effects of stimulus frequency,
neighborhood frequency, and neighborhood density on the probability of making an error visual
perceptual identification. We were also interested in any two- and three-way interactions
between the main effects. The independent variables were (a) stimulus frequency, a continuous
variable representing the log10 of the 5-year cumulative NAMCS/HAMCS frequency for each
name; (b) neighborhood frequency, a continuous variable representing the mean log frequency of
all names within an edit distance of 3 edits from the stimulus name; and (c) neighborhood
density, an ordinal variable representing the number of other drug names that can be found
within an edit distance of 3 edits of the stimulus name. The dependent variable was probability
of error, a dichotomous variable scored as 1 if the name was identified incorrectly, and 0 if the
name was identified correctly. The only control variable was trial, an ordinal variable
representing the sequential position of a name within the 160 trials.
Data were analyzed using MIXOR, a system for doing mixed effects, logistic regression
modeling of dichotomous and ordinal data. The mixed-effects logistic regression model
accommodates nesting of experimental conditions within subjects for a binary outcome and a
mixture of discrete and continuous covariates that can vary either at the level of the subject or the
experimental condition (Hedeker, 1999; Hedeker & Gibbons, 1994; Hedeker & Gibbons, 1996).
Our modeling strategy included multiple steps. First we centered all variables at their
mean values. The next step was to identify the correct scale for each independent and control
variable. We did this by separately plotting the log odds of error as a function of each

Drug Name Perception 14
independent or control variable. If these plots were linear, terms were entered as simple linear
terms. If the plot revealed an obvious nonlinearity, we selected a scale to fit the nonlinear form
of the function (Hosmer & Lemeshow, 1989; Selvin, 1996). In this case, we primarily considered
quadratic terms. Having identified the appropriate scale for each independent and control
variable, we used Kleinbaum’s method of backward elimination to decide which variables to
include in the final model (Kleinbaum, 1994). According to this method, the analyst begins with
a full model and then proceeds to eliminate as many terms as possible, using likelihood ratio
tests (analogous to partial F-tests in ordinary least squares regression) to decide which terms
contribute significantly to the model’s fit. Higher order terms (e.g., interaction terms, squared
terms) were eliminated first, then first-order terms. If a higher-order term was kept in the model
due to a significant likelihood ratio test, all lower order terms contained in the higher order term
were kept in the model as well, regardless of their z-score or likelihood ratio test (Kleinbaum,
1994).
The final step in our modeling strategy was to assess goodness-of-fit. Unlike the case of
ordinary least squares regression, where R2 provides a widely agreed-upon measure of fit, in
logistic regression, there is no consensus measure of goodness-of-fit (Hosmer & Lemeshow,
1989; Kleinbaum, 1994; Pedhazur, 1997; Selvin, 1996). Rather multiple measures are available.
For each model, we report two different indices of goodness-of-fit: classification accuracy and
Hosmer-Lemeshow’s C test based on deciles of risk. To calculate classification accuracy, we
imposed a threshold on predicted probability scores to generate classifications (e.g., if predicted
probability > 0.5, then classify as error). We selected, via systematic search, the threshold that
maximized overall accuracy. We reported sensitivity, specificity and overall accuracy at the
selected threshold (Hosmer & Lemeshow, 1989).
Drug Name Perception 15
For the Hosmer-Lemeshow test, we sorted observations into deciles of risk using their
predicted probability of error as the sort key. We then compared the observed and expected
number of errors and correct responses within each decile of risk (Hosmer & Lemeshow, 1989;
Selvin, 1996). Hosmer & Lemeshow’s C is a chi-square statistic with 8 degrees of freedom
(when deciles are used); the null hypothesis is that the data come from the same distribution (i.e.
that the model fits). Plots of predicted versus observed frequencies are provided for each
experiment. All statistical tests used alpha = 0.05.
Results and Discussion
Each of the forty-five participants responded to 160 stimuli, producing 7200 total
responses. The mean error rate for blurred, briefly presented typewritten stimuli was 60.6%
(4362/7200, std. dev. = 0.489). This error rate may seem unrealistically high compared to the
rates observed in real world practice settings. Because one subsidiary aim of our investigation
was to generate a large number of errors for subsequent analysis, we intentionally inflated the
overall error rate (in this experiment and the next) by increasing the amount of degradation and
decreasing exposure times. As a result, we now have a large database of actual errors that can be
examined in an effort to learn more about the way similarity is represented in the minds of
pharmacists. Results of the detailed analysis of errors are presented here only briefly, and a full
presentation will be published elsewhere.
On average, each participant incorrectly identified 97 of 160 names (range 51 to 145,
median = 95, mode = 99). Table 4 gives the error rate at each level of the independent variables.
Table 5 gives the parameter estimates and associated probabilities for the final random effect
logistic regression model (i.e., the model arrived at after following Kleinbaum’s backward
Drug Name Perception 16
elimination procedure). The model had sensitivity of 72.38%, specificity of 60.29%, and overall
accuracy of 67.61% when a predicted probability threshold of 0.55 was used for classification.
Figure 4 shows the fit between observed and predicted error frequencies at each decile of
risk. Although the fit appears to be fairly good, the Hosmer-Lemeshow C test on deciles of risk
showed evidence of lack of fit (X2(8) = 68.07, p = 0.01). In other words, the hypothesis that
predicted and observed distributions came from the same population was rejected. Our decision
not to include personal characteristics (e.g., age, gender, ethnicity, visual acuity, years of
experience, practice context) as predictors may account for some of the lack of fit. Imprecision in
the frequency data may also have contributed to lack of fit. In addition, the NAMCS/NHAMCS
databases that were used to compute neighborhood characteristics may not have accurately
represented each individual pharmacist’s personal lexicon. We return to these issues in the
Limitations section.
The model revealed a powerful main effect of stimulus frequency (b = -0.78, z = -25.29,
p<0.0000). As stimulus frequency increased, the log odds of error sharply decreased (see Figure
5). The effect of neighborhood density was also significant, although weaker than the stimulus
frequency effect (b = 0.10, z = 2.32, p<0.05). Names in high density neighborhoods were more
difficult to perceive than names in low density neighborhoods. These effects were contained
within a significant two-way interaction between stimulus frequency and neighborhood density
(b = -0.11, z = 3.68, p<0.001, see Figure 5). The beneficial effect of stimulus frequency on
perceptual accuracy was greater for names in high density neighborhoods than in low density
neighborhoods. Another way of describing the same interaction would be to say that the
detrimental effect of neighborhood density operates primarily on low frequency names. There
was also a significant interaction between neighborhood frequency and neighborhood density (b

Drug Name Perception 17
= 0.05, p<0.05). (This term had a non-significant z-score but a significant likelihood ratio test
when it was removed from the model. Thus it was retained.) At low levels of neighborhood
density, increasing neighborhood frequency reduced the error rate; whereas, at high levels of
neighborhood density, increasing neighborhood frequency increased the error rate (see Figure 6).
Finally, there was a weak but significant effect of trial (b = -0.001, z = -1.91, p < 0.05), with
accuracy increasing slightly as participants gained more experience with the task.
---------------------------------------------- Figures 4-7 and Tables 4-5 about here ----------------------------------------------
Error analysis. Detailed analysis of the errors revealed that there were 234 omission
errors and 4128 substitution errors. Of the 4128 substitution errors, 2623 (63.5%) were names of
other drugs (e.g., Indocin® instead of Indomed®, prednisone instead of Pramasone®). The
remaining 1505 (36.5%) substitution errors were spelling errors (e.g., Catapress instead of
Catapres®, Cyclogel instead of Cyclogyl®) or other non-drug responses (e.g., Alena instead of
Alfenta®, Seldene instead of Solatene®). Figure 7 shows the frequency distribution of substitution
errors at different edit distances.
Figure 7 shows that many substitution errors were within only one edit of the target
name, suggesting that these may have been typographical errors or misspellings rather than
misperceptions. In light of this possibility, we built another model assuming a correct response
was any response that fell within one edit of the target name. The model was essentially
unchanged except that a significant stimulus frequency by neighborhood frequency interaction
emerged with the more lenient scoring criterion (details not shown). Given the similarity of these
models, we will only interpret the initial model.

Drug Name Perception 18
Results supported Hypothesis 1. All other things being equal, high frequency drug names
(e.g., Dilantin®, Proventil®, Tagamet®) were perceived more accurately than low frequency
names (e.g., Hetrazan®, Protaphane®, Antispas®). This is an example of word frequency effect,
one of the oldest and most robust effects in all of psycholinguistics (Balota, 1994; Grainger &
Dijkstra, 1996; Grainger & Segui, 1990; Monsell, 1991; Whitlow & Cebollero, 1989). The
beneficial effects of frequency are presumably due to the higher resting activation of high
frequency names or to decisional biases that favor high frequency names when stimuli are
ambiguous or degraded. Hypothesis 2 was not supported, as there was no reliable main effect of
neighborhood frequency. Hypothesis 3 was supported; names in high density neighborhoods
were more likely to be misperceived than names in low density neighborhoods. For example, all
other things being equal, a name like Betadine®, with five neighbors in the NAMCS/NHAMCS
database, is more likely to be misperceived than a name like Cyclogyl®, which has only one
neighbor.
These main effects, however, must be interpreted in the context of the significant two-
way interactions between stimulus frequency and neighborhood density and between
neighborhood density and neighborhood frequency. For example, although the main effect of
neighborhood density is significant, examination of the interaction with stimulus frequency
reveals that density has its effects primarily on low frequency stimulus names. To understand
this effect, recall that the detrimental effects of density are due to competition between similar
names; whereas, the beneficial effects of stimulus frequency are due to high levels of resting
activation and/or decisional biases. The observed interaction between neighborhood density and
stimulus frequency can be explained by noting that the effects of density are of a much smaller
magnitude than the effects of stimulus frequency. For high stimulus frequency names, the

Drug Name Perception 19
detrimental effects of density, although operating, are overwhelmed by the beneficial effects of
stimulus frequency. Hence, the observed density effects obtain only at low stimulus frequency.
Concretely, competition from the five neighbors of a relatively low frequency name such as
Moderil® will make Moderil® vulnerable to misperception, but a high frequency name such as
Nolvadex® will be relatively unaffected by competition from its five neighbors.
A related explanation can be offered to account for the observed interaction between
neighborhood frequency and neighborhood density. In this case, neighborhood frequency
increases the error rate in high density neighborhoods but has the opposite effect in low density
neighborhoods. The more frequent a word is, the more perception is biased in its favor. Thus,
one can see neighborhood frequency as amplifying competitive density effects. In contrast,
stimulus frequency dampens such effects. If one considers two equally dense neighborhoods, the
one with higher frequency neighbors will create more competition with the stimulus word than
the one with low frequency neighbors, since the ability to compete is proportional to the
frequency of a neighbor. This is the effect described by the dotted line in Figure 6. In contrast,
neighborhood frequency has a small, almost negligible, beneficial effect on perceptibility among
names in low density neighborhoods. The small facilitatory effects of neighborhood frequency
may be due to increased bottom-up activation coming from neighbor words that share letters
with the stimulus word (Andrews, 1997; Zagar & Mathey, 2000). For example, a name like
Altoco®, which has four neighbors with high average prescribing frequency, will be more
vulnerable to competition than a name like Mantadil®, which has four relatively low frequency
neighbors.
The next experiment sought to replicate these results in the context of handwritten drug
names.

Drug Name Perception 20
EXPERIMENT 2
PERCEPTUAL IDENTIFICATION OF HANDWRITTEN DRUG NAMES
Methods
Design
The design of Experiment 2 was identical to that used in Experiment 1 except that in this
experiment, handwritten drug names were used as stimuli instead of typewritten names (Brodell
et al., 1997). This experiment also used a slightly different type of degradation (described
below).
Participants
Participants were 37 licensed, practicing, community pharmacists recruited from the
exhibit halls and corridors of the 2000 annual meeting of the National Community Pharmacists
Association in San Antonio, Texas. All participants were adults who consented to participate. All
procedures were approved by the local IRB.
Stimulus Materials
The stimulus materials were the same 160 names used in Experiment 1 (see Tables 1-3).
However, in this experiment, the names were handwritten by 5 practicing physicians from the
University of Illinois Hospital and Clinics. The physicians included one fourth-year psychiatry
resident, one senior attending physician specializing in occupational medicine, and three internal
medicine residents. Physicians were paid US$20 to write each of the 160 names on a multi-page
list. Although they were told that the names were to be used in a study of drug name confusion,
they were explicitly instructed to write in their normal manner—not to make any extra effort to
make their writing neat or legible. The actual handwriting samples used in the experiment were
randomly selected from the 5 sets of 160 names. The names were scanned on a Hewlett-Packard

Drug Name Perception 21
ScanJet ADF at 600 dpi and saved as TIFF files. Scanned images were then imported into Adobe
Photoshop®, saved in JPEG format, and degraded with Gaussian noise as well as vertical and
horizontal graining. The precise procedure for adding noise can be obtained from the authors.
(As in Experiment 1, the purpose of added degradation was to ensure that a large number of
errors would be generated for subsequent analysis.) Final images were 360 pixels wide and 150
pixels high with 144 pixels per inch resolution. Figure 8 shows examples of one drug name from
each of the five physicians. Due to a programming error, 4 names appeared twice in the
experiment (Mellaril®, Pancrease®, Restoril®, and Zefazone®) and 4 names never appeared
(Nolvadex®, Stelazine®, Acular®, and Brethancer®). Data from the second appearance of the
repeated names were deleted, and all subsequent analyses were based on 156 names.
------------------------------------------ Figure 8 about here
------------------------------------------
Procedure and Analysis Plan
We used the same procedure and analysis plan as in Experiment 1.
Results and Discussion
Thirty-seven participants each responded to 156 names, producing 5772 total responses.
The error rate was 45.7% (2637/5772). On average, each participant incorrectly identified 71 of
156 names (std. dev.=17.76, range, 44 to 131, median = 67). Detailed analysis of errors revealed
that there were 202 (7.7%) omission errors and 2435 (92.3) substitution errors. Of the 2435
substitution errors, 1148 (47.1%) involved spelling errors or non-drug names, and 1287 (52.9%)
involved other drug names. Figure 9 shows a histogram of edit distances for drug and non-drug
substitution errors. Table 6 gives the error rates at each level of the independent variables.

Drug Name Perception 22
--------------------------------------------- Figure 9-10 and Tables 6-7 about here ---------------------------------------------
The model had sensitivity of 63.37%, specificity of 69.51%, and overall accuracy of
66.70% when a predicted probability threshold of 0.45 was used for classification. Figure 10
shows the fit between observed and predicted error frequencies at each decile of risk. The
Hosmer-Lemeshow C test on deciles of risk led to the rejection of the hypothesis that the
observed and predicted distributions came from the same population (i.e., there was evidence of
lack of fit between model and data) (X2(8) = 89.79, p < 0.01). The lack of fit was likely due to
the same causes identified in Experiment 1.
--------------------------------------------- Figure 11 about here
---------------------------------------------
Table 7 gives the parameter estimates for the random effect logistic regression model.
There was a powerful main effect of stimulus frequency, with the log odds of error decreasing
sharply as stimulus frequency increased (b = -0.61, z = -18.47, p < 0.001). There was a
significant main effect of neighborhood density, with errors being more likely as density
increased (b = 0.19, z = 3.50, p < 0.001). The main effect of neighborhood frequency was not
significant (b = 0.096, z = 1.78, p > 0.05). There were significant two-way interactions between
stimulus frequency and neighborhood density and between stimulus frequency and neighborhood
frequency. These were contained within a significant three-way interaction between stimulus
frequency, neighborhood frequency, and neighborhood density (see Figure 11). By definition, a
three-way interaction occurs when a two-way interaction differs across levels of a third variable
(Keppel, 1991). In this case, stimulus frequency and neighborhood density interacted at high
neighborhood frequency but not at low neighborhood frequency. At high neighborhood

Drug Name Perception 23
frequency, stimulus frequency had a stronger dampening effect on names from high as opposed
to low density neighborhoods. At low neighborhood frequency, the effect of stimulus frequency
was the same regardless of neighborhood density. In other words, high prescribing frequency of
a target name is most protective against error in high frequency, high density neighborhoods,
where competition is fiercest. This is sensible since the ability to compete in perception is mostly
a function of frequency.
Results supported Hypothesis 1. All things being equal, common names (e.g., Ativan®)
were more accurately perceived than rare names (e.g., Protophane®). Hypothesis 2 was not
supported. The main effect of neighborhood frequency was not reliably greater than zero.
Hypothesis 3 was supported. Neighborhood density significantly increased the likelihood of
error, i.e., the more neighbors a name has, the harder that name is to correctly identify. One must
be cautious in interpreting the main effects, however, since they were contained within
significant two- and three-way interactions. The three-way interaction is still in need of
explanation.
At high neighborhood frequency, the interaction between stimulus frequency and
neighborhood density is the same as that which was observed for typewritten names, namely,
that the effect of stimulus frequency was greater on names from high as opposed to low density
neighborhoods. To put it another way, in high frequency neighborhoods, high neighborhood
density had detrimental effects on low frequency names but beneficial effects on high frequency
names. In low frequency neighborhoods, there was no such interaction. Instead, low frequency
names showed only the main effects of neighborhood density and stimulus frequency. Again we
interpret this as neighborhood frequency amplifying the effects of density. In low frequency
neighborhoods, there is a density effect, but because the neighbors are relatively rare names, they

Drug Name Perception 24
exert relatively little competitive inhibition on the target name—hence, the small main effect of
neighborhood density in low frequency neighborhoods. In contrast, neighborhoods that are dense
with high frequency names compete very strongly with the target name, creating the large
density effect, especially on rarely prescribed target names.
GENERAL DISCUSSION
Drug name confusions are a persistent source of medication errors and an ongoing threat
to patient safety. In spite of all that has been written and all the remedial steps that have been
taken recently, new pairs of confusing names continue to appear regularly (Institute for Safe
Medication Practices, 2002). One way to minimize the incidence of these errors is to equip
decision-makers in the pharmaceutical industry and the FDA with tools to make better name-
approval decisions. Such tools should be empirically validated and based on principles of human
factors engineering. When it comes to drug name confusion, one of the fundamental human
factors is visual perception (others are short-term memory and auditory perception).
The present work provides new evidence regarding what factors contribute to visual
misidentifications of drug names. Consistent with current theory in cognitive psychology, the
present results indicate that highly frequent drug names are less likely to be misperceived than
less frequent drug names. Also consistent with current theory, drug names that are similar to
many other drug names are more likely to be misperceived than drug names that are similar to
relatively few other drug names. These findings have important implications both for current
pharmaceutical practice and for the regulation of proposed new drug names. The implications are
not obvious, however, and in order to understand them, one must consider the ultimate goal of
those who might use the types of predictive models described above.

Drug Name Perception 25
The ultimate goal of decision-makers ought to be to minimize harm (i.e., to maximize
patient safety). Doing so involves more than just predicting the probability that a given name will
be misperceived, which is all we have done here. Harm is a function of the probability of error,
the number of opportunities for error and the severity of the consequences of an error:
Harm = Probability of Error X Number of Opportunities for Error X Severity of Each Error
Although our work clearly documents that rare names are more likely to be misidentified
than common names, it does not necessarily follow that rare names pose the most risk of harm.
For example, imagine Drug A is prescribed 1 million times per year and has a predicted
probability of error of 0.05. Imagine that Drug B is prescribed 10,000 times per year and has a
predicted probability of error of 0.5. Alone, the probabilities of error suggest that Drug B is 10
times more likely to be misidentified than Drug A. One might be tempted to conclude that Drug
B is therefore 10 times more hazardous, but this would be a misguided conclusion. Given these
hypothetical prescribing frequencies and error probabilities, one would predict 0.05 * 1 million =
50,000 errors for Drug A and 0.5 * 10,000 = 5,000 errors for Drug B. The arithmetic is simple,
but the implications are somewhat counter-intuitive. The drug with the lower probability of error
(the frequently prescribed Drug A) is likely to be involved in many more errors than the much
harder to perceive Drug B, by virtue of the much greater number of opportunities for error
involving Drug A. Even this is not the whole picture, because the severity of the consequences of
an error have not been factored in. Five thousand fatal errors would clearly cause more harm
than 50,000 mild allergic reactions.
The upshot of all this is that to make the drug name lexicon safer, one must focus on
harm reduction, and that harm reduction involves more than just the probability of error. It also
involves the number of opportunities for error and the amount of damage caused by each error. It

Drug Name Perception 26
is worth noting that, in most cases, harm is defined in terms of injury, disability, and death to
patients who get the wrong drug. But sometimes harm may be defined in terms of commercial
damages, lost sales, trademark infringement, or trademark dilution. Regulatory agencies like the
U. S. Food and Drug Administration are likely to use the former definition (injury) while drug
companies, the courts and other regulators like the U. S. Patent and Trademark Office may use
the latter definition (commercial harm). In neither case are valid and reliable measures for
quantifying the magnitude of harm very well developed. This is clearly an area where more work
needs to be done.
Comparison of Results for Handwritten and Typewritten Names
The main effects of stimulus frequency and neighborhood density in Experiment 2 were
in the same direction and of comparable magnitude as what was observed in Experiment 1. Thus,
the effects of stimulus frequency and neighborhood density appear, for the most part, to apply to
both handwritten and typewritten names. Similarly, the main effect of neighborhood frequency is
null for both handwritten and typewritten names. The results obtained with the handwritten
materials serve two important purposes. First, they serve as a partial replication of the results
obtained with typewritten materials, thus establishing the robustness of those results. Second,
they extend those results to the more realistic domain of handwritten stimuli of the kind that are
more likely to be encountered in everyday practice.
LIMITATIONS
Only pharmacists participated in these experiments. To strengthen generalizations about
other populations, experiments should be repeated using physicians, nurses, and lay people as
participants. The names used as stimuli were mostly 3-syllable brand names. Generalizing from
these results to generic names or names of different lengths may or may not be warranted. The

Drug Name Perception 27
type of stimulus degradation used, which combined degraded images with short presentation
times, may not perfectly simulate the real-world perceptual situation, where names may be more
or less degraded, handwriting may be better or worse, and pharmacists may spend more or less
time examining ambiguous names. The task used here may also be somewhat artificial in that we
encouraged participants to generate a guess whenever possible; whereas, in the real world, a
pharmacist would presumably seek verification of an ambiguous name rather than guessing.
Furthermore, the task took place in a quiet room, with none of the distractions that would be
present in the real world. No attempt was made to model variation that may have been due to a
participant’s age, years of experience, practice context, clinical specialty, or level of visual
acuity, nor were differences in the legibility of the handwritten names taken into account. The
absence of these variables may, in part, explain the lack of fit between observed and predicted
data. In addition, the lexicon used here included names only from the NAMCS and NHAMCS
databases. Limitations in the precision of NAMCS/NHAMCS frequency data may have affected
the precision of our frequency-based parameter estimates. Use of a different reference database
would alter the neighborhood characteristics of the stimulus names and the resulting
neighborhood effects. Finally, the observed error rates primarily reflect characteristics of the
experimental task such as the brief exposure duration and the nature and degree of stimulus
degradation. The absolute error rates observed here (45-60%) are perhaps an order of magnitude
higher than what one might expect in a real-world practice setting. Hence, interpretation of these
results should focus on the trends in error rates as a function of frequency and density, not on the
absolute error rates. To put it more formally, interpretations should focus on the slopes of the
models, not their y-intercepts.

Drug Name Perception 28
CONCLUSION
Pharmacists’ visual perception of briefly presented, blurry drug names is affected in
predictable ways by objectively measurable properties of names (e.g., prescribing frequency,
neighborhood frequency, and neighborhood density). All other things being equal, rare names
and names in high density neighborhoods are more likely to be misperceived than common
names and names from low density neighborhoods. The main effects of neighborhood frequency
are negligible, although this factor does interact in important ways with neighborhood density
and stimulus frequency (i.e., neighborhood frequency tends to amplify the effects of density).
The complex interactions observed for both handwritten and typewritten stimuli suggest that all
three factors must be simultaneously taken into account when assessing the visual intelligibility
or confusability of a drug name. Models such as the ones presented here, or refinements thereof,
can be used for this purpose. People responsible for coining and approving drug names can and
should consider the factors identified here when they make decisions. However, the models
presented here only pertain to the probability of error. In order to minimize harm, which ought to
be the goal of practitioners, industry, and government alike, one must also take into account the
number of opportunities for error and the severity of the consequences of each error. We hope to
have facilitated the process of harm reduction by offering insight into the factors that affect the
probability of error. Traditional pharmaceutical marketing techniques should be able to estimate
the number of opportunities for error (i.e., the prescribing frequency of a drug), and further work
is needed to quantify the harm associated with each error.

Drug Name Perception 29
Acknowledgements
This research was supported in part by the National Patient Safety Foundation and by the
Latiolais Leadership Fund of the Ohio State University. The authors acknowledge the assistance
of Bill Brewer, Mike Cohen, Gary Dell, Robert Gibbons, David Lambert, Eric Lambert, Robert
Lee, Swu-Jane Lin, Paul Luce, Susan Proulx, Don Rucker, and Gordon Schiff. We are also
indebted to the volunteer participants from the American Pharmaceutical Association and the
National Community Pharmacists Association. Parts of this research were reported at the 2000
Meeting of the American Association of Pharmaceutical Scientists and at the 2002 National
Patient Safety Foundation Research Symposium. Requests for reprints should be sent to Dr.
Lambert.
Drug Name Perception 30
References
Andrews, S. (1997). The effect of orthographic similarity on lexical retrieval: Resolving
neighborhood conflicts. Psychonomic Bulletin & Review, 4(4), 439-461.
Balota, D. A. (1994). Visual word recognition: The journey from features to meaning. In M. A.
Gernsbacher (Ed.), Handbook of psycholinguistics (pp. 303-358). San Diego, CA:
Academic Press.
Brodell, R. T., Helms, S. E., KrishnaRao, I., & Bredle, D. L. (1997). Prescription errors.
Legibility and drug name confusion. Archives of Family Medicine, 6, 296-298.
Carreiras, M., Perea, M., & Grainger, J. (1997). Effects of orthographic neighborhood in visual
word recognition: Cross-task comparisons. Journal of Experimental Psychology:
Learning, Memory, and Cognition, 23(4), 857-871.
Cohen, J. D., MacWhinney, B., Flatt, M., & Provost, J. (1993). PsyScope: A new graphic
interactive environment for designing psychology experiments. Behavioral Research
Methods, Instruments, and Computers, 25(2), 257-271.
Coltheart, M., Davelaar, E., Jonasson, J. T., & Besner, D. (1977). Access to the internal lexicon.
In S. Dornic (Ed.), Attention and Performance VI (pp. 535-555). New York, NY:
Academic Press.
Dell, G. S., Schwartz, M. F., Martin, N., Saffran, E. M., & Gagnon, D. A. (1997). Lexical access
in normal and aphasic speakers. Psychological Review, 104, 801-838.
Grainger, J., & Dijkstra, T. (1996). Visual word recognition: Models and experiments. In T.
Dijkstra & K. de Smedt (Eds.), Computational psycholinguistics (pp. 139-165). Bristol,
PA: Taylor & Francis.

Drug Name Perception 31
Grainger, J., & Jacobs, A. M. (1996). Orthographic processing in visual word recognition: A
multiple read-out model. Psychological Review, 103(3), 518-565.
Grainger, J., & Segui, J. (1990). Neighborhood frequency effects in visual word recognition: A
comparison of lexical decision and masked identification latencies. Perception &
Psychophysics, 47(191-198).
Havens, L. L., & Foote, W. E. (1963). The effect of competition on visual duration threshold and
its independence of stimulus frequency. Journal of Experimental Psychology, 65, 6-11.
Hedeker, D. (1999). MIXOR/MIXREG Website, [HTML page]. University of Illinois at Chicago.
Available: http://www.uic.edu/~hedeker/mix.html [1999, June 4].
Hedeker, D., & Gibbons, R. D. (1994). A random-effects ordinal regression model for multilevel
analysis. Biometrics, 933-944.
Hedeker, D., & Gibbons, R. D. (1996). MIXOR: a computer program for mixed-effects ordinal
regression analysis. Computer Methods and Programs in Biomedicine, 49, 157-176.
Hosmer, D. W., & Lemeshow, S. (1989). Applied logistic regression. New York: John Wiley &
Sons.
Howes, D. H., & Solomon, R. L. (1951). Visual duration threshold as a function of word
probability. Journal of Experimental Psychology, 41, 401-410.
Institute for Safe Medication Practices. (2002). ISMP Medication Safety Alert! (7(7)).
Huntingdon Valley, PA: Institute for Safe Medication Practices.
Jacobs, A. M., & Grainger, J. (1994). Models of visual word recognition---Sampling the state of
the art. Journal of Experimental Psychology: Human Perception and Performance, 20(6),
1311-1334.

Drug Name Perception 32
Keppel, G. (1991). Design and analysis: A researcher's handbook. Englewood Cliffs, NJ:
Prentice-Hall.
Kleinbaum, D. G. (1994). Logistic regression: a self-learning text. New York: Springer-Verlag.
Kohn, L. T., Corrigan, J., & Donaldson, M. S. (Eds.). (2000). To err is human: building a safer
health system. Washington, DC: Institute of Medicine.
Lambert, B. L., Chang, K. Y., & Lin, S. J. (2001a). Descriptive analysis of the drug name
lexicon. Drug Information Journal, 35, 163-172.
Lambert, B. L., Chang, K. Y., & Lin, S. J. (2001b). Effect of orthographic and phonological
similarity on false recognition of drug names. Social Science & Medicine, 52, 1843-1857.
Lambert, B. L., Chang, K.-Y., Lin, S.-J., & Gupta, P. (2000). Effect of prescribing frequency,
neighborhood frequency, and neighborhood density on pharmacists' visual perception of
drug names. PharmSci, 2, S-1276.
Lambert, B. L., Lin, S.-J., Gandhi, S. K., & Chang, K.-Y. (1999). Similarity as a risk factor in
drug name confusion errors: The look-alike (orthographic) and sound-alike
(phonological) model. Medical Care, 37(12), 1214-1225.
Luce, P. A., & Pisoni, D. B. (1998). Recognizing spoken words: The neighborhood activation
model. Ear & Hearing, 19(1), 1-36.
Luce, P. A., Pisoni, D. B., & Goldinger, S. D. (1990). Similarity neighborhoods of spoken words.
In G. T. M. Altmann (Ed.), Cognitive models of speech processing: Psycholinguistic and
computational perspectives (pp. 122-147). Cambridge, MA: MIT Press.
Luce, R. D. (1959). Individual choice behavior. New York: Wiley.
Mathey, S. (2001). L'influence du voisinage orthographique lors de la reconnaissance des mots
ecrits. Revue canadienne de psychologie experimentale, 55(1), 1-23.

Drug Name Perception 33
McClelland, J. L., & Rumelhart, D. E. (1981). An interactive activation model of context effects
in letter perception: Part I. An Account of basic findings. Journal of Experimental
Psychology: General, 114(159-188).
Monsell, S. (1991). The nature and locus of word frequency effects in reading. In D. Besner &
G. W. Humphreys (Eds.), Basic processes in reading: Visual word recognition (pp. 148-
197). Hillsdale, NJ: Erlbaum.
National Center for Health Statistics. (2001a). Ambulatory Health Care Data: NAMCS
Description, [Web page]. National Center for Health Statistics. Available:
http://www.cdc.gov/nchs/about/major/ahcd/namcsdes.htm [2001, May 31, 2001].
National Center for Health Statistics. (2001b). Ambulatory Health Care Data: NHAMCS
Description, [Web page]. National Center for Health Statistics. Available:
http://www.cdc.gov/nchs/about/major/ahcd/nhamcsds.htm [2001, May 31, 2001].
Newbigging, P. L. (1961). The perceptual reintegration of frequent and infrequent words.
Canadian Journal of Psychology, 15, 123-132.
Pedhazur, E. J. (1997). Multiple regression in behavioral research: Explanation and prediction.
New York: Harcourt Brace.
Perea, M., & Rosa, E. (2000). The effects of orthographic neighborhood in reading and
laboratory word identification tasks. Psicologica, 21, 327-340.
Rumelhart, D. E., & McClelland, J. L. (1982). An interactive activation model of context effects
in letter perception: Part II. The contextual ehnancement effect and some tests and
extensions of the model. Psychological Review, 89, 60-94.
Selvin, S. (1996). Statistical analysis of epidemiological data. New York: Oxford University
Press.

Drug
Name Perception 34
Snodgrass, J. G., & Mintzer, M. (1993). Neighborhood effects in visual word recognition:
Facilitatory or inhibitory? Memory and Cognition, 21(2), 247-266.
Solomon, R. L., & Postman, L. (1952). Frequency of usage as a determinant of recognition
threshold for words. Journal of Experimental Psychology, 43, 195-210.
Stephen, G. A. (1994). String searching algorithms. River Edge, NJ: World Scientific.
U. S. Pharmacopeia. (1995). USP Quality Review (49). Rockville, MD: U. S. Pharmacopeia.
U. S. Pharmacopeia. (1996). USP Quality Review. Rockville, MD: U. S. Pharmacopeia.
U. S. Pharmacopeia. (2001, March). USP Quality Review (76). U. S. Pharmacopeia. Available:
http://www.usp.org/reporting/review/qr76.pdfJuly 19, 2001].
U.S. Food and Drug Administration. (2001). Medication errors, [Web Page]. Available:
http://www.fda.gov/cder/handbook/mederror.htm [2001, April 23, 2001].
Whitlow, J. W., & Cebollero, A. (1989). The nature of word frequency effects in perceptual
identification. Journal of Experimental Psychology: Learning, Memory, and Cognition,
15(4), 643-656.
Zagar, D., & Mathey, S. (2000). When WORDS with higher-frequency neighbours become
words with no higher-frequency neighbour (or how to undress the neighborhood
frequency effect). In A. Kennedy, R. Radach, D. Heller, & J. Pynte (Eds.), Reading as a
perceptual process (pp. 23-46). New York, NY: Elsevier Science.

Drug Name Perception 35
F I R E
F I ER
fine
fare
file fire
wire
hire
Figure 1. Interactive activation model of visual word perception. Arrows represent excitatory links. Filled circles represent inhibitory links. See, e.g., McClelland and Rumelhart, 1981.
Letter Level
Word Level

Drug Name Perception 36
X
Low frequency neighbor
H igh frequency neighbor
Target name
Neighborhood radius
Figure 2. Schematic diagram of a drug name’s orthographic neighborhood. The size of the center X represents stimulus frequency (i.e., the prescribing frequency of the target name). The stars in the circle represent neighbors within a fixed neighborhood radius (e.g., 3 edits). The size of each star represents the prescribing frequency of that name. The ability to compete for perceptual identification increases as prescribing frequency increases. See text for details.

Drug Name Perception 37
1) High SF, High NF, High ND 2) High SF, Low NF, High ND
4) High SF, Low NF, Low ND
X
3) High SF, High NF, Low ND
X X
X
X
7) Low SF, High NF, Low ND 8) Low SF, Low NF, Low ND
X
5) Low SF, High NF, High ND 6) Low SF, Low NF, High ND
X X
Figure 3. Schematic diagram of 8 different combinations of stimulus frequency (SF), neighborhood frequency (NF) and neighborhood density (ND). These 8 combinations correspond to the 8 cells of the experimental design.

Drug Name Perception 38
Table 1. Stimulus names for Experiments 1 and 2
Cell Name SF NF ND 1 Trilafon 6.29 6.60 4 1 Rifampin 5.96 6.36 4 1 Depakene 5.69 6.15 4 1 Aclovate 6.15 6.12 3 1 Tobradex 6.82 6.94 3 1 Ocufen 5.85 6.49 4 1 Insulin 6.55 6.54 3 1 Betoptic 6.72 6.65 3 1 Lotensin 6.79 6.49 3 1 Zonalon 5.65 6.19 5 1 Librium 6.44 6.49 3 1 Metrogel 6.50 6.15 5 1 Adalat 6.54 6.31 5 1 Ativan 7.28 6.32 5 1 Nicotrol 5.91 6.88 3 1 calcium 6.32 6.61 5 1 Mellaril 6.66 6.64 3 1 Nolvadex 6.26 6.18 5 1 Loestrin 6.35 6.10 3 1 Anaprox 7.13 6.59 3 2 Robinul 5.81 5.22 3 2 Capozide 6.08 4.99 4 2 Topicort 6.51 4.71 3 2 Verelan 6.72 4.91 4 2 Enduron 5.69 4.13 4 2 Proventil 7.66 5.11 3 2 Imuran 6.47 5.24 3 2 Sinemet 6.63 4.67 3 2 Tetramune 6.72 4.64 3 2 Kenalog 6.87 5.16 5 2 Ventolin 7.62 5.19 4 2 Catapres 6.82 5.14 4 2 Clonidine 6.74 4.92 5 2 Pramasone 5.69 4.91 4 2 Dyazide 7.45 3.66 4 2 Dilantin 7.18 4.96 4 2 Duratuss 6.13 5.08 4 2 Tagamet 7.34 5.43 3 2 Deltasone 6.09 5.30 3 2 Serentil 5.76 4.77 4 3 Micronase 7.25 6.79 2 3 Wycillin 5.77 6.25 2 3 Prinivil 6.95 6.29 1

Drug Name Perception 39
Cell Name SF NF ND 3 Clozaril 5.91 6.24 2 3 Stelazine 6.29 6.08 2 3 Humibid 6.67 6.15 2 3 Florinef 5.99 6.03 2 3 Pancrease 5.78 7.16 1 3 Serevent 6.55 6.90 2 3 Acular 5.78 6.26 2 3 Restoril 6.81 6.72 2 3 Diprosone 5.84 6.32 2 3 Natalins 6.44 6.72 2 3 Naprosyn 7.51 6.06 2 3 Ambenyl 6.07 6.21 2 3 Skelaxin 6.38 6.29 1 3 Tegretol 6.99 6.51 2 3 Pondimin 6.25 6.34 2 3 Isordil 7.17 6.27 2 3 Vistaril 7.02 6.51 2 4 Reserpine 5.82 3.10 1 4 Dexedrine 5.99 3.86 2 4 Phentermine 6.40 3.82 1 4 Flexeril 7.28 4.36 1 4 Unasyn 5.74 3.64 2 4 Tolinase 5.96 5.23 2 4 Cyclogyl 6.32 3.84 1 4 Prazosin 5.99 5.06 1 4 Elimite 6.01 5.28 2 4 Nicoderm 6.09 4.28 2 4 Ocuflox 6.02 5.85 1 4 Provera 7.41 5.22 2 4 Pamelor 6.87 4.55 2 4 Tenormin 7.40 3.21 1 4 Bellergal 5.71 3.01 1 4 Depakote 6.69 5.50 2 4 Fosamax 5.97 4.25 1 4 Monopril 6.70 4.79 2 4 Inapsine 5.81 4.47 1 4 Fulvicin 5.85 4.72 1 5 Alfenta 5.13 6.14 3 5 Idenal 3.34 6.65 4 5 Trobicin 3.06 6.41 3 5 Desferal 5.19 6.71 3 5 Ketalar 4.93 6.35 4 5 Travasol 4.38 6.43 3 5 Activase 5.25 6.73 4 5 Solatene 4.34 6.07 3
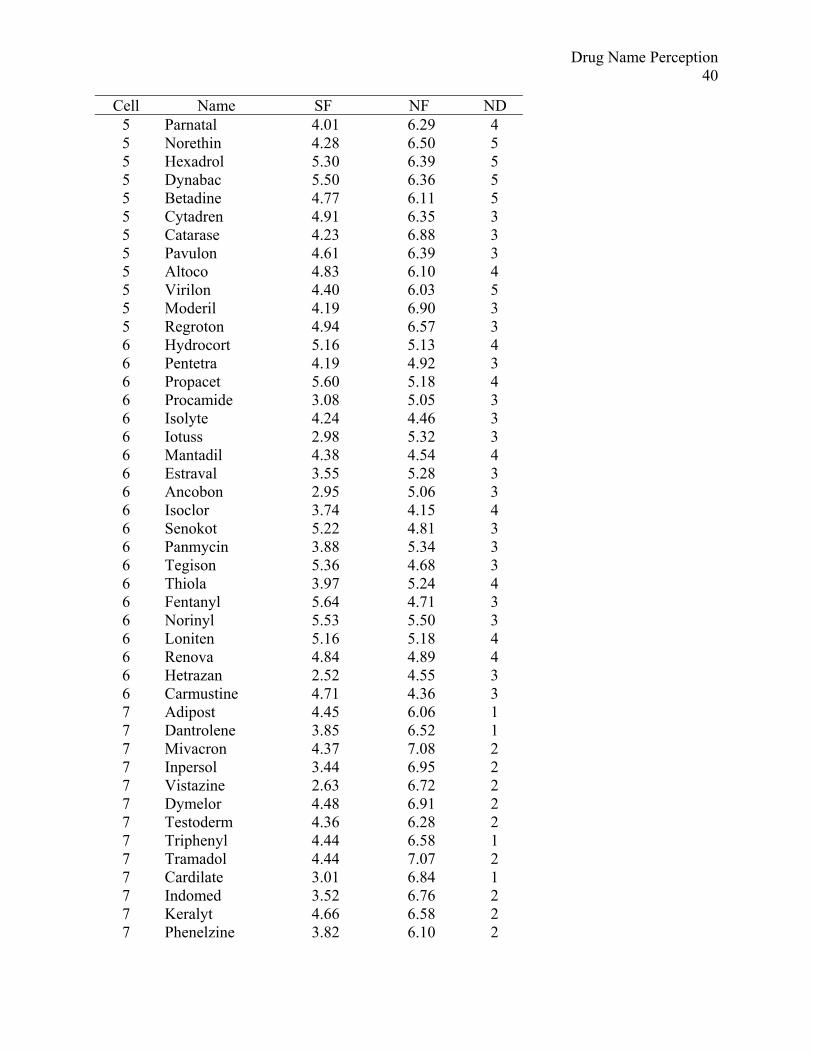
Drug Name Perception 40
Cell Name SF NF ND 5 Parnatal 4.01 6.29 4 5 Norethin 4.28 6.50 5 5 Hexadrol 5.30 6.39 5 5 Dynabac 5.50 6.36 5 5 Betadine 4.77 6.11 5 5 Cytadren 4.91 6.35 3 5 Catarase 4.23 6.88 3 5 Pavulon 4.61 6.39 3 5 Altoco 4.83 6.10 4 5 Virilon 4.40 6.03 5 5 Moderil 4.19 6.90 3 5 Regroton 4.94 6.57 3 6 Hydrocort 5.16 5.13 4 6 Pentetra 4.19 4.92 3 6 Propacet 5.60 5.18 4 6 Procamide 3.08 5.05 3 6 Isolyte 4.24 4.46 3 6 Iotuss 2.98 5.32 3 6 Mantadil 4.38 4.54 4 6 Estraval 3.55 5.28 3 6 Ancobon 2.95 5.06 3 6 Isoclor 3.74 4.15 4 6 Senokot 5.22 4.81 3 6 Panmycin 3.88 5.34 3 6 Tegison 5.36 4.68 3 6 Thiola 3.97 5.24 4 6 Fentanyl 5.64 4.71 3 6 Norinyl 5.53 5.50 3 6 Loniten 5.16 5.18 4 6 Renova 4.84 4.89 4 6 Hetrazan 2.52 4.55 3 6 Carmustine 4.71 4.36 3 7 Adipost 4.45 6.06 1 7 Dantrolene 3.85 6.52 1 7 Mivacron 4.37 7.08 2 7 Inpersol 3.44 6.95 2 7 Vistazine 2.63 6.72 2 7 Dymelor 4.48 6.91 2 7 Testoderm 4.36 6.28 2 7 Triphenyl 4.44 6.58 1 7 Tramadol 4.44 7.07 2 7 Cardilate 3.01 6.84 1 7 Indomed 3.52 6.76 2 7 Keralyt 4.66 6.58 2 7 Phenelzine 3.82 6.10 2

Drug
Name Perception 41
Cell Name SF NF ND 7 Donnagel 2.88 6.57 2 7 Nebupent 4.37 6.61 1 7 Surgicel 4.81 7.05 1 7 Maxiflor 4.83 6.46 1 7 Theovent 3.44 6.90 2 7 Benzonate 4.69 6.78 2 7 Flaxedil 4.36 7.28 1 8 Orinase 5.52 5.66 2 8 Polymox 5.40 3.14 1 8 Dobutrex 4.35 2.74 1 8 Humafac 4.57 4.42 1 8 Norcuron 4.96 3.12 1 8 Brethancer 4.71 5.53 0 8 Zefazone 4.13 4.81 2 8 Natabec 3.71 5.43 2 8 Ipecac 3.48 3.74 2 8 Regitine 5.13 5.64 2 8 Hydergine 5.55 3.81 2 8 Cefizox 5.19 3.99 2 8 Gaviscon 5.28 4.07 1 8 Pravastan 5.14 4.81 1 8 Nysolone 3.57 5.94 2 8 Bronkodyl 3.78 4.96 1 8 Esidrix 5.42 5.06 2 8 Antispas 2.43 5.30 2 8 Protaphane 2.21 2.82 1 8 Theodrine 4.14 3.89 1
Note. SF = log stimulus frequency. NF = log neighborhood frequency. ND = neighborhood
density.

High NF Low NF Variable Mean SD Min Max Mean SD Min Max
SF 6.39 0.45 5.65 7.28 6.60 0.64 5.69 7.66 NF 6.44 0.25 6.10 6.94 4.91 0.41 3.66 5.43 High ND
ND 3.80 0.89 3.00 5.00 3.70 0.66 3.00 5.00
SF 6.47 0.55 5.77 7.51 6.30 0.56 5.71 7.41 NF 6.40 0.31 6.03 7.16 4.40 0.82 3.01 5.85
High SF
Low ND
ND 1.85 0.37 1.00 2.00 1.45 0.51 1.00 2.00
SF 4.58 0.63 3.06 5.50 4.33 0.98 2.52 5.64 NF 6.42 0.26 6.03 6.90 4.92 0.37 4.15 5.50 High ND
ND 3.75 0.85 3.00 5.00 3.35 0.49 3.00 4.00
SF 4.04 0.67 2.63 4.83 4.43 0.99 2.21 5.55 NF 6.70 0.32 6.06 7.28 4.44 1.01 2.74 5.94
Low SF
Low ND
ND 1.60 0.50 1.00 2.00 1.45 0.60 0.00 2.00
Overall
Variable Mean SD Max Min SF 5.39 1.27 7.66 2.21 NF 5.58 1.07 7.28 2.74 ND 2.62 1.22 5.00 0.00
Table 2. Descriptive statistics for stimulus frequency, neighborhood frequency, and neighborhood density (n = 20 names per cell)
Drug Name Perception 42

Drug Name Perception 43
Table 3. Correlations between log stimulus frequency, log neighborhood frequency, and
neighborhood density for N = 160 drug names
SF NF
NF -0.040 -
ND 0.122 0.171*
* p < 0.05

Drug Name Perception 44
Table 4. Experiment 1: Error rates at various levels of stimulus frequency, mean neighborhood
frequency, and neighborhood density.
NF SF ND
High Low
High 0.47 0.43 High
Low 0.41 0.45
High 0.82 0.81 Low
Low 0.74 0.73
Variable High Low
SF 0.44 0.78
NF 0.61 0.60
ND 0.63 0.58

Drug Name Perception 45
Table 5. Experiment 1: Parameter estimates for random effects logistic regression model
predicting visual perception errors (typewritten names)
Variable Estimate S.E. Z
Intercept 0.9611 0.1263 7.6111**
SF -0.7841 0.0310 -25.2886**
NF 0.0600 0.0486 1.2327
ND 0.1024 0.0441 2.3223*
SF x ND -0.1061 0.0289 -3.6760**
NF x ND 0.0479 0.0283 1.6932
trial -0.0012 0.0007 -1.9128
Note. Terms were kept in the model if likelihood ratio tests of their removal were significant
and/or if a higher-level interaction involving a term was significant. In some cases, likelihood
ratio tests were significant at α = 0.05, but Z-scores (or Wald tests on the parameter estimates)
were not. In such cases, likelihood ratio tests are believed to be more reliable, and hence they
were used (Hosmer & Lemeshow, 1989; Kleinbaum, 1994).
* p < 0.05, ** p < 0.001
-2 log likelihood = 8249.801

Drug Name Perception 46
0
100
200
300
400
500
600
700
0% 10% 20% 30% 40% 50% 60% 70% 80% 90%
Decile
Freq
uenc
yPredictedObserved
Figure 4. Fit between predicted and observed number of errors at each decile of risk for
Experiment 1.

Drug Name Perception 47
0
0.2
0.4
0.6
0.8
1
1.2
0 2 4 6 8 10
Log SF
Erro
r Rat
eHigh NDLow ND
Figure 5. Interaction between stimulus frequency and neighborhood density in Experiment 1.
The solid line represents high neighborhood density. The dotted line represents low
neighborhood density.

Drug Name Perception 48
59.0%
57.6%
61.6%
64.2%
0.54
0.56
0.58
0.6
0.62
0.64
0.66
Low NF High NF
Erro
r Rat
e
Low NDHigh ND
Figure 6. Interaction between neighborhood frequency and neighborhood density in Experiment
1. The solid line represents high neighborhood density. The dotted line represents low
neighborhood density.

Drug Name Perception 49
0
100
200
300
400
500
600
700
1 2 3 4 5 6 7 8 9 >9
Edit Distance
Freq
uenc
yNon-DrugDrug
Figure 7. Histogram of edit distances for both types of substitution errors in Experiment 1. See
text for details.

Drug Name Perception 50
Figure 8. Examples of degraded handwritten names from five different physicians (from top to
bottom: Trilafon®, Unasyn®, Ventolin®, Solatene®, and Betadine®).

Drug Name Perception 51
050
100150200250300350400450
1 2 3 4 5 6 7 8 9 10
Edit Distance
Freq
uenc
yNon-DrugDrug
Figure 9. Histogram of edit distances for both types of substitution errors in Experiment 2. See
text for details.

Drug Name Perception 52
050
100150200250300350400450500
0% 10% 20% 30% 40% 50% 60% 70% 80% 90%
Decile
Freq
uenc
yPredictedObserved
Figure 10. Fit between predicted and observed number of errors at each decile of risk for
Experiment 2.

Drug Name Perception 53
Table 6. Experiment 2: Error rates at various levels of stimulus frequency, mean neighborhood
frequency, and neighborhood density.
NF SF ND
High Low
High 0.28 0.36 High
Low 0.28 0.31
High 0.68 0.61 Low
Low 0.59 0.52
Variable High Low
SF 0.31 0.60
NF 0.46 0.45
ND 0.48 0.43

Drug Name Perception 54
Table 7. Experiment 2: Parameter estimates for random effects logistic regression model
predicting visual perception errors (handwritten names)
Variable Estimate SE Z
Intercept 0.129 0.147 0.878
SF -0.612 0.033 -18.474*
NF 0.096 0.054 1.783
ND 0.186 0.053 3.495*
SF x NF -0.206 0.042 -4.886*
SF x ND -0.116 0.034 -3.423*
NF x ND 0.031 0.043 0.726
SF x NF x ND -0.144 0.024 -6.068*
* p < 0.001
-2 log likelihood = 6949.931

Drug Name Perception 55
00.10.20.30.40.50.60.70.80.9
1
2 3 4 5 6 7 8
Log SF
Erro
r Rat
e
Low ND High ND
00.10.20.30.40.50.60.70.80.9
1
2 3 4 5 6 7 8
Log SF
Erro
r Rat
e
Low ND High ND(a) High NF
(b) Low NF
Figure 11. Three-way interaction between SF, NF, and ND in Experiment 2. Solid lines represent
high ND. Dotted lines represent low ND. Panel (a) illustrates a two-way interaction between SF
and ND at high NF, but this interaction is not present at low NF (panel b).