effects of genetic selection and processing of soybeans
TRANSCRIPT

EFFECTS OF GENETIC SELECTION AND PROCESSING OF SOYBEANS AND
SOYBEAN MEAL ON NUTRITIONAL QUALITY
BY
JIN YOON
THESIS
Submitted in partial fulfillment of the requirements
for the degree of Master of Science in Animal Sciences
in the Graduate College of the
University of Illinois at Urbana-Champaign, 2012
Urbana, Illinois
Advisor:
Professor Hans-Henrik Stein

ii
ABSTRACT
Five experiments were conducted to study the effects of genetic selection and processing
of soybeans and soybean meal on nutritional quality when fed to pigs. The objectives of Exp. 1
and 2 were to determine standardized ileal digestibility (SID) of AA, and the DE and ME in de-
hulled conventional full fat soybeans (FFSB-CV), high-protein full fat soybeans (FFSB-HP),
and low-oligosaccharide full fat soybeans (FFSB-LO). Results indicate that the SID of most AA
in FFSB-LO is similar to values in FFSB-CV, but greater (P < 0.05) than values in FFSB-HP.
This may have been due to heat damage in FFSB-HP, which resulted in reduced AA digestibility
due to Maillard reaction. Results also indicate that there were no significant differences in DE
and ME among the 3 sources of FFSB. The objectives of Exp. 3 and 4 were to determine SID of
AA, and the DE and ME in expeller soybean meals (ESBM) produced from conventional
soybeans (ESBM-CV) and soybeans with low (ESBM-LT) or ultra-low (ESBM-ULT)
concentrations of trypsin inhibitor soybeans. Results indicate that the SID of all AA was greater
(P < 0.05) in SBM than in all the ESBM, therefore, it is not possible to use these low-trypsin
inhibitor beans in diets fed to pigs without heat treatment with only 7 to 12 units of trypsin
inhibitors. The results also indicate that the concentration of trypsin inhibitors does not seem to
affect energy concentration in the meals. The objective of Exp. 5 was to determine SID of AA in
4 sources of fermented soybean meal (FSBM). The results indicate that there are differences
among commercial sources of FSBM in the SID of most AA. Relatively low SID of most AA in
some sources of FSBM is most likely due to overheating during production of these ingredients,
resulting in Maillard reactions and subsequent destruction of Lys and reduction in AA
digestibility.

iii
Key words: amino acids, digestible energy, expeller soybeans, fermented soybean meal, full fat
soybeans, metabolizable energy, oligosaccharide, protein, trypsin inhibitor, pigs
iv
ACKNOWLEDGEMENTS
I would like to express my deepest and sincerest appreciation to everyone who has helped
me through past 2 years to grow up, complete this degree and wrap up this chapter of my life.
Your presence alone, as well as your numerous advices, has been a great help.
First of all, I would like to thank Dr. Hans Stein for letting me explore the world of swine
nutrition, more broadly swine industry. It was a new experience every time we visited other labs
at other schools, and numerous conferences and exhibitions.
I would like to also thank the present Stein Monogastric Nutrition Laboratory members:
Caroline Gonzalez, Neil Jaworski, Ana Arango, Oscar Rojas, Ferdinando Almeida, Tanawong
Maison, John Mathai, Jessica Lowell, Kelly Sotak, Shelby Curry, Diego Navarro, Chelsie Parr
Woongbi Kwon, Kate Horsman, Jen Roth, Dr. Rommel Sulabo, and HiDee Ekstrom. I would
also like to extend my thanks to the past lab members who helped me through this journey:
Diego Rodriguez, Dr. Minho Song, Dr. Sarah Cervantes-Pahm, Dr. Pedro Urriola, Dr. Dong
Yong Kil, and Dr. Beob Gyun Kim. In addition, I would like to thank Dr. Carl Parsons and Dr.
James Pettigrew for serving on my M. S. defense committee.
Last but not least, I would like to express my deepest gratitude to my loving parents,
Byung Nam Yoon and Jae Ryun Jung for all the sacrifices you have made to allow me to attend
schools in the United States, experience new things, and most importantly to become who I am
now.
v
TABLE OF CONTENTS
CHAPTER 1: INTRODUCTION ................................................................................................ 1
CHAPTER 2: SOYBEANS IN SWINE NUTRITION: LITERATURE REVIEW ................ 3
INTRODUCTION ....................................................................................................................... 3
PROCESSING OF SOYBEANS ................................................................................................ 3
ANTINUTRITIONAL FACTORS ............................................................................................. 5
NEW VARIETIES ...................................................................................................................... 9
FERMENTED SBM ................................................................................................................. 11
CONCLUSIONS ....................................................................................................................... 13
LITERATURE CITED ............................................................................................................. 14
TABLES .................................................................................................................................... 22
CHAPTER 3: AMINO ACID DIGESTIBILITY AND ENERGY CONCENTRATION
OF HIGH PROTEIN, LOW-OLIGOSACCHARIDE, AND CONVENTIONAL FULL
FAT, BUT DEHULLED, SOYBEANS FED TO GROWING PIGS ..................................... 24
ABSTRACT .............................................................................................................................. 24
INTRODUCTION ..................................................................................................................... 25
MATERIALS AND METHODS .............................................................................................. 26
RESULTS.................................................................................................................................. 31
DISCUSSION ........................................................................................................................... 33
LITERATURE CITED ............................................................................................................. 36

vi
TABLES .................................................................................................................................... 39
CHAPTER 4: AMINO ACID DIGESTIBILITY AND ENERGY CONCENTRATION
IN LOW-TRYPSIN INHIBITOR EXPELLER SOYBEAN MEAL FED TO
GROWING PIGS........................................................................................................................ 49
ABSTRACT .............................................................................................................................. 49
INTRODUCTION ..................................................................................................................... 50
MATERIALS AND METHODS .............................................................................................. 52
RESULTS.................................................................................................................................. 57
DISCUSSION ........................................................................................................................... 59
LITERATURE CITED ............................................................................................................. 63
TABLES .................................................................................................................................... 66
CHAPTER 5: AMINO ACID DIGESTIBILITY IN 4 SOURCES OF FERMENTED
SOYBEAN MEAL AND IN CONVENTIONAL SOYBEAN MEAL AND FISH MEAL
FED TO WEANLING PIGS ...................................................................................................... 83
ABSTRACT .............................................................................................................................. 83
INTRODUCTION ..................................................................................................................... 84
MATERIALS AND METHODS .............................................................................................. 85
RESULTS.................................................................................................................................. 89
DISCUSSION ........................................................................................................................... 91
LITERATURE CITED ............................................................................................................. 94
TABLES .................................................................................................................................... 97

vii
CHAPTER 6: CONCLUSION................................................................................................. 107

1
CHAPTER 1
INTRODUCTION
Soybean (Glycine max) is an oilseed crop produced in the United States and around the
world for both human and animal consumption. Most swine diets contain soybean products, most
commonly as soybean meal (SBM), to increase the dietary concentration of AA economically
because plant protein sources are usually cheaper than animal proteins. However, due to the
increasing price of soybeans and SBM, researchers are investigating ways to maximize the
nutritional quality in soybeans. Processing of soybeans is important and effective not only to
extract the oil for the human food industry, but also to produce SBM that contains nutrients that
are more digestible and utilizable for the animals.
Raw soybeans contain several antinutritional factors that can have adverse effects on the
performance and health of pigs. Adequate heating is essential to achieving the maximum
nutritional value of soybean products by reducing the concentration of heat-labile antinutritional
factors. In addition, exogenous enzyme supplementation with conventional SBM or further
processing of conventional SBM is ideal to reduce the concentration of heat-stable antinutritional
factors that could affect the performance of pigs, especially in young pigs.
A newer method of reducing these antinutritional factors in soybean products added to
swine diet is by using genetic selection in plant breeding to identify new varieties of soybeans
with lower concentration of antinutritional factors. Another way to reduce the concentration of
these antinutritional factors is fermentation, in which microbes ferment the substrates that are not
readily usable by pigs thereby reducing the concentration of the antinutritional factors.
Newer varieties of soybeans have been identified, as well as various methods of
producing further processed SBM. Therefore, the objectives of this thesis are:

2
1) To test the hypothesis that DE and ME, and SID of CP and AA are greater in de-
hulled FFSB produced from high-protein or low-oligosaccharide varieties of
soybeans than in conventional FFSB,
2) To test the hypothesis that DE and ME, and SID of CP and AA are greater in expeller
soybean meal produced from low or ultra-low trypsin inhibitor soybeans than in
conventional expeller soybean meal, and
3) To measure the AID and SID of CP and AA in 4 sources of fermented soybean meals
by weanling pigs and compare these values to AID and SID of CP and AA in
conventional soybean meal and in fish meal.

3
CHAPTER 2
SOYBEANS IN SWINE NUTRITION: LITERATURE REVIEW
INTRODUCTION
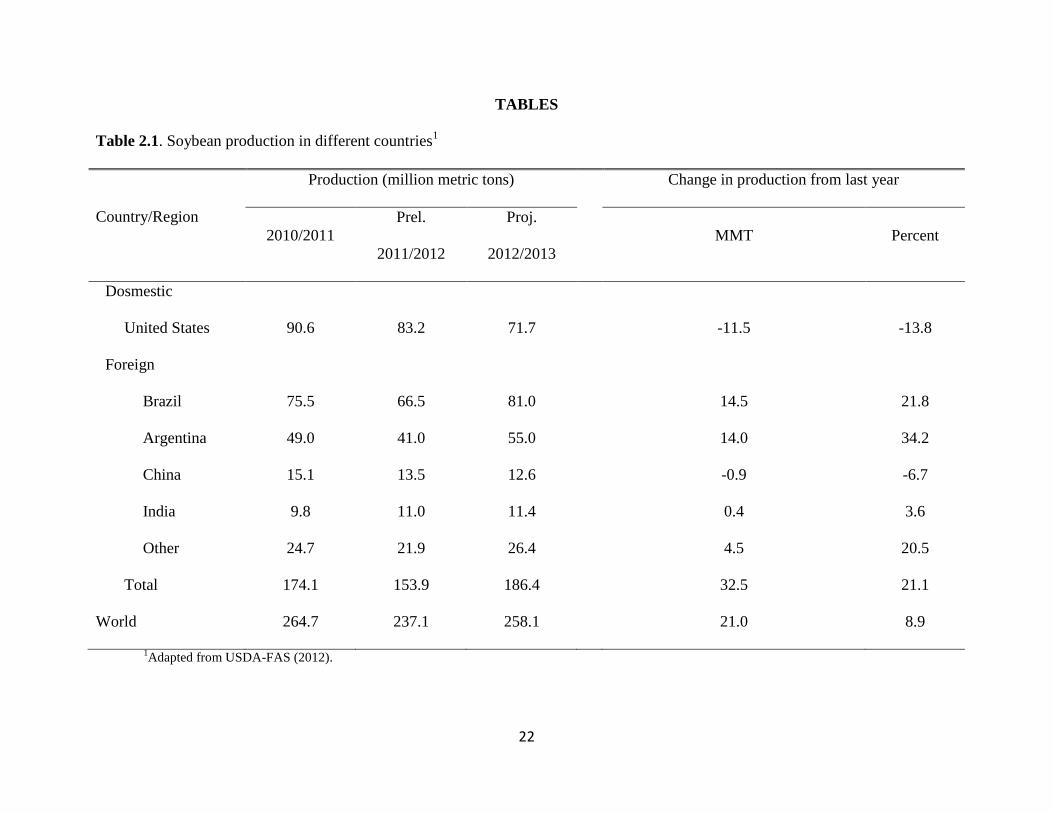
Soybean is major oilseed crop produced in the United States and around the world. The
major countries that produce soybeans are the United States, Brazil, Argentina, and China, in the
order of production yield (Table 2.1; USDA-FAS, 2012). Approximately 237 million metric tons
of soybeans were produced around the world in 2011 and approximately 35% were produced in
the United States (Table 2.1; USDA-FAS, 2012). Within the United States, approximately 55%
of soybeans produced are crushed and turned into soy oil and soybean meal (SBM; USDA-ERS,
2012). Soybean meal is used in livestock diets as a protein source because plant protein sources
are usually cheaper than animal proteins. However, the cost of soybean and SBM has been
steadily increasing in recent years and SBM price is projected to be in the range of $485-515
which is almost 3 times the price of SBM a decade ago (USDA-ERS, 2012). Due to the
increasing price of soybeans and SBM, researchers are investigating alternative protein-rich
crops; however, it is also important to discover ways to maximize the nutritional quality in
soybeans.
PROCESSING OF SOYBEANS
Soybean products added to swine diets are mostly byproducts of the human food
industry. Processing of soybeans is important and effective not only to extract the oil for the
human food industry, but also to produce SBM that contains nutrients that are more digestible
and utilizable for the animals. Different types of SBM are produced by different methods of oil
4
extraction from soybeans. Before the solvent extraction method was developed, mechanical
methods, such as hydraulic pressing or continuous screw pressing (expeller) were commonly
used (Nelson et al., 1987). Soybeans may be de-hulled before oil extraction to reduce the fiber
content and produce high protein SBM with 48-50% CP (Serrato, 1981). De-hulled SBM
contains more energy than non-de-hulled SBM (NRC, 2012), which is most likely due to the
lower fiber content. Moreover, de-hulled SBM has greater digestibility of AA than non-de-hulled
SBM (Kang et al., 2003). This has also been confirmed by a study where added soy hulls, which
mainly consist of fiber, decreased the digestibility of AA in SBM (Dilger et al., 2004). Therefore,
adding the de-hulling step during processing may produce SBM with greater concentration of
digestible nutrients (Table 2.2).
In the early days of oil extraction from soybeans, the mechanical extraction method was
commonly used. Using this method, soybeans are fed to screw presses to extract oil, and the
remnant is ground to make SBM expellers (Johnson, 2008). This produces SBM with a fat
content of approximately 6.6% (NRC, 2012). The solvent extraction method is now the
conventional method of extracting oil from soybeans, and oil is extracted from soybeans using a
solvent, usually hexane, and the remnant is ground to make solvent-extracted SBM (Johnson,
2008). This produces SBM with approximately 1.5% fat (NRC, 2012). Expeller SBM contains
more energy than solvent-extracted SBM due to a greater concentration of fat (Woodworth et al.,
2001). Therefore, different methods of processing soybeans can produce SBM with variable
nutritional value (Table 2.2). The mechanical extraction method is exclusively used in small
crushing plants or specialty soybean processing plants, either due to lower capital required to run
the plant and low throughput or to preserve the native characteristics of different varieties of
soybeans. Approximately 40 million metric ton of SBM was produced in the United States in

5
2011 (ASA, 2012), but mechanically extracted SBM accounts for less than 1% of all the SBM
produced in the United States (Ericson, 1995).
After solvent-extracted SBM became available in the early fifties, the corn-SBM diet was
developed and was quickly adopted by the United States swine industry (Becker et al., 1963). In
the early days, animal protein and fermentation products were used in swine diets because plant
ingredients lack vitamin B12, but as crystalline vitamin B12 became available, a diet composed of
only plant ingredients was possible (Baker, 2003). As the corn-SBM diet became the standard for
the swine industry, SBM became the most widely used plant protein source in swine diets.
Soybean meal is a valuable source of protein for feeding animals due to the high nutritional value
contributed by the AA composition of the protein (Liener, 1981). A method to compare protein
sources with respect to protein quality is to compare the Lys to CP ratio because Lys is the first
limiting AA in swine diets (Cromwell, 2000). Among the plant protein sources, soybean
products have the greatest Lys to CP ratio (Cromwell, 2000). Moreover, digestibility coefficients
for Lys in SBM tend to be greater than those in most other oilseed meals (Cromwell, 2000).
Another attractive quality of SBM as a protein and AA source is that SBM is relatively rich in
both Lys and Trp, whereas the cereal grains used in swine diets, especially corn, are relatively
low in Lys and Trp (Stein et al., 2008). Therefore, SBM has a good balance of AA that
complements the AA composition of cereal grains used in swine diets. This complementary
effect allows corn-SBM diet to meet all essential AA requirements of pigs (Baker, 2000).
ANTINUTRITIONAL FACTORS
Despite the favorable characteristics of SBM as a protein source for pigs, raw soybeans
contain several antinutritional factors that can have adverse effects on the performance and
6
health of pigs. These antinutritional factors can be categorized into 2 groups, heat-labile and
heat-stable antinutritional factors (Liener, 2000). Heat-labile antinutritional factors include
protease inhibitors, lectins, goitrogens, and antivitamins (Liener, 2000). Among the heat-labile
antinutritional factors, the most important in raw soybeans are protease inhibitors. These protease
inhibitors, also known as trypsin inhibitors, can be separated mainly into 2 types, Kunitz trypsin
inhibitors and Bowman-Birk inhibitors, and they reduce the activity of the pancreatic proteolytic
enzymes (Rackis, 1972). Although there are conflicting results regarding differences in heat
stability of Kunitz trypsin inhibitors and Bowman-Birk inhibitors, it is generally believed that
Bowman-Birk inhibitors are more heat stable than Kunitz trypsin inhibitors due to the stability of
Bowman-Birk inhibitors in heated aqueous solutions (Birk, 1961). Even before the currently
used processing methods were developed, it was shown that heat is required to achieve the full
nutritional potential of soybeans (Osborne and Mendel, 1917). Heating of the soybeans decreases
the concentration of trypsin inhibitors, which in turn increases AA digestibility and also
improves growth performance in pigs (Herkelman et al., 1992; Goebel and Stein, 2011).
Although heating is necessary to inactivate the heat-labile antinutritional factors in the soybeans,
excessive heat will decrease Lys concentration, the Lys to CP ratio, and the digestibility of CP
and AA due to Maillard reactions (Gonzalez-Vega et al., 2011). Therefore, adequate heating or
other methods of reducing the trypsin inhibitor concentration is essential to achieving the
maximum nutritional value of soybean products, but over-heating will reduce AA digestibility.
One way of reducing trypsin inhibitor concentrations in soybean products added to swine diet is
by using genetic selection in plant breeding to identify new low-trypsin inhibitor varieties of
soybeans (Goebel and Stein, 2011).

7
The heat-stable antinutritional factors in soybeans include oligosaccharides, phytate,
antigens, and others (Liener, 2000). Soybean oligosaccharides constitute approximately 5% of
the soybean DM (Karr-Lilienthal et al., 2005). Soybean oligosaccharides, which are mainly
raffinose and stachyose that cause flatulence in animals (Rackis, 1981), do not get eliminated by
traditional processing (Leske et al., 1993; Grieshop et al., 2003). Because pigs lack α-
galactosidase, the enzyme needed to cleave the α-1,6 glycosidic bond in oligosaccharides (Karr-
Lilienthal et al., 2005), pigs cannot digest oligosaccharides. Instead, oligosaccharides are
hydrolyzed by microbial fermentation in the intestinal tract (Choct et al., 2010). Bacterial
digestion of oligosaccharides leads to production of volatile fatty acids (Grieshop et al., 2000),
which are easily utilized by pigs. However, young pigs have a low capacity for fermentation;
therefore, feeding soybean products to young pigs will result in reduced growth rate and may
affect fecal consistency in weanling pigs (Liying et al., 2003). Due to the increasing fermentation
of nonstarch polysaccharides with increasing age of pigs by intestinal microflora (Choct et al.,
2010), oligosaccharides are not a concern for older pigs that easily ferment oligosaccharides.
Adding α-galactosidase to the diets may ameliorate the adverse effect on growth performance of
young pigs by increasing the digestibility of oligosaccharides, accompanied by increased
digestibility of GE and CP (Pan et al., 2002). However, this is not always the case because in
some cases, added α-galactosidase did not improve digestibility of oligosaccharides (Smiricky et
al., 2002). Therefore, there is a need for another method to reduce the concentration of
oligosaccharides in soybeans to reduce the unfavorable effect when fed to young pigs. One
method to reduce the concentration of dietary oligosaccharides in soybeans is to utilize low-
oligosaccharide varieties of soybeans, which have been selected using genetic selection (Hou et
al., 2009; Skoneczka et al., 2009). Another way to reduce the concentration of oligosaccharides

8
in SBM is by fermentation, in which microbes most commonly used in fermented SBM
production secretes α-galactosidase, thereby breaking down the oligosaccharides and use the
intermediate products as carbon sources for subsequent fermentation (Chen et al., 2010).
Another heat-stable antinutritional factor in soybeans is phytic acid, also known as
phytate. Like other plant ingredients used in swine diets, approximately two-thirds of the P in
soybeans is bound to the phytate molecule (Nelson et al., 1968). Phytate is the main storage form
of phosphate and inositol in most plants, and phytate bound P in soybeans and SBM is mostly
unavailable to swine (Erdman, 1979). Pigs do not secrete phytase, the enzyme necessary to
release the phosphate groups from the phytate complex, and phytate bound P is, therefore, poorly
utilized (Cromwell, 2000). As a consequence, commercial corn-SBM diets are often
supplemented with inorganic P to meet the P requirement of pigs and this results in large
amounts of P being excreted by pigs, which may result in pollution (Cromwell and Coffey,
1991). The negatively charged phosphate groups of phytic acid also bind to different cations
such as Ca, Mg, Fe, Zn, Cu, and Mn, which are nutritionally important for pigs (Rimbach et al.,
2008). One way to make the phytate bound P bioavailable to pigs is to add microbial phytase to
the diet. Microbially derived phytase from Aspergillus niger or Escherichia coli is effective in
improving the utilization of phytate bound P in corn and SBM by growing pigs, which in turn
reduces the need for supplementation of inorganic P to the diet and reduce the amount of P
excreted into the environment (Cromwell et al., 1993; Rojas and Stein, 2012). Mutant soybeans
with reduced phytate bound P and increased inorganic P with comparable concentration of total
P as conventional varieties have been identified (Wilcox et al., 2000). Use of low-phytate SBM
can improve P digestibility by approximately 40% compared with conventional SBM, which is
directly related to the phytate bound P concentration because most other nutrient concentration

9
were similar among the SBM varieties (Dilger and Adeola, 2006). Therefore, the usage of these
low-phytate varieties may reduce the need for inorganic P supplementation in diets and
consequently reduce the amount of P excreted from animals (Wilcox et al., 2000; Dilger and
Adeola, 2006).
NEW VARIETIES
New varieties of soybeans have been developed by genetic selection in plant breeding.
One of the new varieties of soybeans developed is a high-protein variety. Full fat high-protein
soybeans have greater concentration of CP and AA compared with conventional soybeans
(Cervantes-Pahm and Stein, 2008; Baker et al., 2010; Table 2.2). Likewise, SBM produced from
a high-protein variety of soybeans has greater concentration of CP and AA (Baker and Stein,
2009). The digestibility of most AA in high-protein full fat soybeans is comparable to that in
conventional full fat soybeans (Cervantes-Pahm and Stein, 2008; Baker et al., 2010). However,
due to the greater concentration of AA, high protein full fat soybeans contains more digestible
AA, which indicates that this new variety of soybeans may have a greater feeding value than
conventional soybeans (Cervantes-Pahm and Stein, 2008). Likewise, the digestibility of AA in
SBM produced from high-protein soybeans is similar to that in conventional SBM, which
indicates that there is a greater concentration of digestible AA in SBM produced from high-
protein soybeans compared with conventional soybeans (Baker and Stein, 2009). Soybean meal
produced from high-protein soybeans also contains more DE and ME than conventional SBM,
most likely due to the greater protein concentration in the high-protein SBM (Baker and Stein,
2009). Therefore, high-protein soybeans developed via genetic selection seems to be beneficial
to feed to pigs.

10
Another new variety of soybeans developed by genetic selection is low-oligosaccharide
soybeans. Low-oligosaccharide full fat soybeans contain less stachyose and raffinose compared
with conventional soybeans (Baker et al., 2010; Table 2.2). Likewise, SBM produced from low-
oligosaccharide soybeans contains less oligosaccharides than conventional SBM (Baker and
Stein, 2009). The digestibility of AA in low-oligosaccharide full fat soybeans and conventional
full fat soybeans is similar, which indicates that the digestibility of AA is not compromised in the
new variety of soybeans (Baker et al., 2010). However, the digestibility of AA in SBM produced
from low-oligosaccharide soybeans is greater than that in conventional SBM, most likely due to
the lower fiber content in low-oligosaccharide SBM compared with conventional SBM (Baker
and Stein, 2009). In another study, SBM produced from low-oligosaccharide soybeans had not
significantly different, but numerically higher, SID of AA compared with conventional SBM,
which indicates that SBM produced from low-oligosaccharide soybeans is at least as good a
source of digestible AA as conventional SBM (Jendza and Baidoo, 2012). Soybean meal
produced from low-oligosaccharide soybeans has concentrations of DE and ME that are
comparable to those in conventional SBM (Baker and Stein, 2009). Therefore, low-
oligosaccharide soybeans may be used in diets for young pigs without the adverse effects of
oligosaccharides that may reduce growth performance of young pigs.
Low-trypsin-inhibitor varieties of soybeans were also developed by genetic selections.
Low-trypsin-inhibitor soybeans contain less of trypsin inhibitors compared with conventional
soybeans (Herkelman et al., 1992; Goebel and Stein, 2011). Although low-trypsin-inhibitor
soybeans have considerably less trypsin inhibitor concentrations, they are not completely devoid
of trypsin inhibitors so heat treatment still reduces the concentration of trypsin inhibitors
(Herkelman et al., 1992; Goebel and Stein, 2011). Low-trypsin-inhibitor soybeans have greater

11
digestibility and retention of N than high-trypsin-inhibitor soybeans but dietary energy utilization
was similar (Cook et al., 1988). However, conventional SBM had greater N retention than low-
trypsin-inhibitor soybeans most likely due to low level of trypsin inhibitor and other
antinutritional factors present in low-trypsin-inhibitor soybeans (Cook et al., 1988). Raw low-
trypsin-inhibitor soybeans had greater digestibility of AA than raw conventional soybeans
(Herkelman et al., 1992; Goebel and Stein, 2011) and growth performance in pigs was improved
when pigs were fed raw low-trypsin-inhibitor soybeans instead of raw conventional soybeans
(Cook et al., 1988; Herkelman et al., 1992; Palacios et al., 2004). Therefore, low-trypsin-
inhibitor soybeans, developed using genetic selection, seem to be more beneficial to feed to pigs
than conventional soybeans when used without processing. However, to maximize performance
soybean products need to be heat treated to inactivate all trypsin inhibitors.
FERMENTED SBM
Further processing the conventional SBM may serve as another method to ameliorate the
negative effects of antinutritional factors in conventional SBM. One such method is fermentation
of conventional SBM. Fermented SBM is produced by bacterial and/or fungal fermentation of
conventional SBM (Chen et al., 2010). The concentrations of AA, CP, P, and other nutrients are
greater in fermented SBM than in conventional SBM, which is most likely due to removal of
sucrose and oligosaccharides during fermentation (Cervantes-Pahm and Stein, 2010; Rojas and
Stein, 2012). The trypsin inhibitor concentration in SBM is also reduced following fermentation
(Hong et al., 2004; Rojas and Stein, 2012). The peptide size in soybeans and conventional SBM
may be reduced following fermentation (Hong et al., 2004), but that is not always the case
(Cervantes-Pahm and Stein, 2010). Newly weaned pigs may benefit from the reduced peptide

12
size in fermented SBM, because they may have inadequate gastric enzyme secretion to
effectively initiate protein digestion (Lindemann et al., 1986; Hedemann and Jensen, 2004). It
has been observed that fermented SBM with appropriate crystalline AA supplementation can be
used in diets for young pigs as an alternative to animal protein sources fed to nursery pigs, such
as dried skim milk or plasma protein (Kim et al., 2010). Increasing the inclusion rate of
fermented SBM at the expense of conventional SBM improved feed efficiency, AA digestibility,
blood urea N, and total protein concentrations in blood (Cho et al., 2007), and improved growth
performance may be observed as well (Jones et al., 2010). The digestibility of AA in fermented
SBM is not different from the digestibility in conventional SBM, but fermented SBM contains
more digestible AA than conventional SBM because of the greater concentration of AA
(Cervantes-Pahm and Stein, 2010). Results of some studies have indicated that fermented SBM
increases growth performance and digestibilities of nutrients (Min et al., 2004; Kim et al., 2007).
Fermented SBM also has a greater digestibility of P than conventional SBM, which is most
likely due to the reduced concentration of phytate bound P (Rojas and Stein, 2012) and an
improved P availability, which is a result of hydrolysis of the phytate bonds during microbial
fermentation (Ilyas et al., 1995). Adding microbial phytase improves digestibilities of P in both
fermented SBM and conventional SBM (Rojas and Stein, 2012), which indicates that there are
residual phytate bound P that was converted to available P by the enzyme, even after the
fermentation process. Reduced incidence of diarrhea after weaning was also observed when
fermented SBM was used as a substitute for conventional SBM (Song et al., 2010). Therefore, a
well-controlled fermentation process may serve as an effective method to ameliorate the negative
effects of residual antinutritional factors in conventional SBM.

13
CONCLUSIONS
Soybean meal is a valuable and popular plant protein source in swine diets. This is due to
its exceptional AA composition that can complement cereal grains commonly used in swine
diets. Soybean meal, being a plant protein source, is cheaper than animal protein sources.
However, due to the increasing cost of soybeans and SBM, it is necessary to look for methods to
maximize the utilization of nutritional quality in soybeans. Soybeans in nature contain
antinutritional factors, such as trypsin inhibitor, oligosaccharides, and phytate, which can
negatively affect growth performance of pigs. To maximize the nutritional quality, concentration
of these antinutritional factors must be reduced. New varieties of soybeans, as well as different
processing methods, have been developed to reduce the antinutritional factors in soybeans and
SBM. Newer variety of soybeans and processing methods of SBM may provide more
economical use of soybeans and SBM in diets fed to swine.

14
LITERATURE CITED
ASA. 2012. Soy Stats. A Reference Guide to Important Soybean Facts and Figures. Am. Sotbean
Assoc., St. Louis, MO. http://www.soystats.com/2012/Default-frames.htm. Accessed Oct.
03, 2012.
Baker, D. H. 2000. Nutritional constraints to use of soy products by animals. Pages 1-12 in Soy
in Animal Nutrition. J. K. Drackley, ed. Federation of Animal Sciences Societies, Savoy,
IL.
Baker, D. H. 2003. D. E. (Gene) Becker and the evolution of the corn-soybean meal diet for pigs.
Pages 101-104 in Ill. Swine Res. Rpt. Univ. of Illinois, Urbana.
Baker, K. M., B. G. Kim, and H. H. Stein. 2010. Amino acid digestibility in conventional, high-
protein, or low-oligosaccharide varieties of full-fat soybeans and in soybean meal by
weanling pigs. Anim. Feed Sci. Technol. 162:66-73.
Baker, K. M., and H. H. Stein. 2009. Amino acid digestibility and concentration of digestible and
metabolizable energy in soybean meal produced from conventional, high-protein, or low-
oligosaccharide varieties of soybeans and fed to growing pigs. J. Anim. Sci. 87:2282-
2290.
Becker, D. E., A. H. Jensen, and B. G. Harmon. 1963. Balancing swine rations. Illinois Agr.
Coop. Ext. Serv. Circ. 866.
Birk, Y. 1961. Purification and some properties of a highly active inhibitor of trypsin and α-
chymotrypsin from soybeans. Biochimica et Biophysica Acta. 54:378-381.
Cervantes-Pahm, S. K., and H. H. Stein. 2008. Effect of dietary soybean oil and soybean protein
concentration on the concentration of digestible amino acids in soybean products fed to
growing pigs. J. Anim. Sci. 86:1841-1849.

15
Cervantes-Pahm, S. K., and H. H. Stein. 2010. Ileal digestibility of amino acids in conventional,
fermented, and enzyme-treated soybean meal and in soy protein isolate, fish meal, and
casein fed to weanling pigs. J. Anim. Sci. 88:2674-2683.
Chen, C. C., Y. C. Shih, P. W. S. Chiou, and B. Yu. 2010. Evaluating nutritional quality of single
stage- and two stage-fermented soybean meal. Asian-australas. J. Anim. Sci. 23:598-606.
Cho, J. H., B. J. Min, Y. J. Chen, J. S. Yoo, Q. Wang, J. D. Kim, and I. H. Kim. 2007. Evaluation
of FSP (Fermented Soy Protein) to replace soybean meal in weaned pigs: growth
performance, blood urea nitrogen and total protein concentrations in serum and nutrient
digestibility. Asian-australas. J. Anim. Sci. 20:1874-1879.
Choct, M., Y. Dersjant-Li, J. McLeish, and M. Peisker. 2010. Soy oligosaccharides and soluble
non-starch polysaccharides: A review of digestion, nutritive and anti-nutritive effects in
pigs and poultry. Asian-australas. J. Anim. Sci. 23:1386-1398.
Cook, D. A., A. H. Jensen, J. R. Fraley, and T. Hymowitz. 1988. Utilization by growing and
finishing pigs of raw soybeans of low Kunitz trypsin inhibitor content. J. Anim Sci.
66:1686-1691.
Cromwell, G. L. 2000. Utilization of soy products in swine diets. Pages 258-282 in Soy in
Animal Nutrition. J. K. Drackley, ed. Federation of Animal Sciences Societies, Savoy,
IL.
Cromwell, G. L., and R. D. Coffey. 1991. Phosphorus – a key essential nutrient, yet a possible
major pollutant – its central role in animal nutrition. Pages 133-145 in Biotechnology in
the Feed Industry. T. P. Lyons, ed. Alltech Techincal publications, Nicholasville, KY.

16
Cromwell, G. L., T. S. Stahly, R. D. Coffey, H. J. Monegue, and J. H. Randolph. 1993. Efficacy
of phytase in improving the bioavailability of phosphorus in soybean meal and corn-
soybean meal diets for pigs. J. Anim. Sci. 71:1831-1840.
Dilger, R. N., and O. Adeola. 2006. Estimation of true phosphorus digestibility and endogenous
phosphorus loss in growing pigs fed conventional and low-phytate soybean meals. J.
Anim. Sci. 84:627-634.
Dilger, R. N., J. S. Sands, D. Ragland, and O. Adeola. 2004. Digestibility of nitrogen and amino
acids in soybean meal with added soyhulls. J. Anim. Sci. 82:715-724.
Erdman, J. W., Jr. 1979. Oilseed phytates: Nutritional implications. J. Am. Oil Chem. Soc.
56:736-741.
Ericson, D. E. 1995. Overview of modern soybean processing and links between processes.
Pages 56-64 in Practical Handbook of Soybean Processing and Utilization. D. E. Ericson,
ed. AOCS Press, Champaign, IL.
Goebel, K. P., and H. H. Stein. 2011. Ileal digestibility of amino acids in conventional and low-
Kunitz soybean products fed to weanling pigs. Asian-australas. J. Anim. Sci. 24:88-95.
González-Vega, J. C., B. G. Kim, J. K. Htoo, A. Lemme, and H. H. Stein. 2011. Amino acid
digestibility in heated soybean meal fed to growing pigs. J. Anim. Sci. 89:3617-3625.
Grieshop, C. M., C. T. Kadzere, G. M. Clapper, E. A. Flickinger, L. L. Bauer, R. L. Frazier, and
G. C. Fahey, Jr. 2003. Chemical and nutritional characteristics of United States soybeans
and soybean meals. J. Agric. Food Chem. 51:7684-7691.
Grieshop, C. M., D. E. Reese, and G. C. Fahey, Jr. 2000. Nonstarch polysaccharides and
oligosaccharides in swine nutrition. Pages 107-130 in Swine Nutrition. A. J. Lewis and L.
L. Southern, ed. CRC Press, Boca Raton, FL.

17
Hedemann, M. S., and B. B. Jensen. 2004. Variations in enzyme activity in stomach and
pancreatic tissue and digesta in piglets around weaning. Arch. Anim. Nutr. 58:47-59.
Herkelman, K. L., G. L. Cromwell, T. S. Stahly, T. W. Pfeiffer, and D. A. Knabe. 1992.
Apparent digestibility of amino acids in raw and heated conventional and low-trypsin-
inhibitor soybeans for pigs. J. Anim. Sci. 70:818-826.
Hong, K. -J., C.-H. Lee, and S. W. Kim. 2004. Aspergillus oryzae GB-107 fermentation
improves nutritional quality of food soybeans and feed soybean meals. J. Med. Food
7:430-435.
Hou, A., P. Chen, J. Alloatti, D. Li, L. Mozzoni, B. Zhang, and A. Shi. 2009. Genetic variability
of seed sugar content in worldwide soybean germplasm collections. Crop Sci. 49:903-
912.
Ilyas, A., M. Hirabayasi, T. Matsui, H. Yano, F. Yano, T. Kikushima, M. Takebe, and K.
Hayakawa. 1995. A note on the removal of phytate in soybean meal using Aspergillus
usami. Asian-Australas. J. Anim. Sci. 8:135-138.
Jendza, J. A., and S. K. Baidoo. 2012. Standardized ileal digestibility of Illinois bundleflower,
low-oligosaccharide soybean meal and conventional soybean meal. J. Anim. Sci. 90
(Suppl. 3):309. (Abstr.)
Johnson, L. A. 2008. Oil recovery from soybeans. Pages 331-375 in Soybeans Chemistry,
Production, Processing, and Utilization. Johnson, A., P. J. White, P. J. White, and R.
Galloway, ed. AOCS Press, Urbana, IL.
Jones, C. K., J. M. DeRouchey, J. L. Nelssen, M. D. Tokach, S. S. Dritz, and R. D. Goodband.
2010. Effects of fermented soybean mela and specialty animal protein sources on nursery
pig performance. J. Anim. Sci. 88:1725-1732.

18
Kang, Y. F., D. F. Li, J. J. Xing, P. J. Mckinnon, and D. Y. Sun. 2003. Effect of de-hulling on
ileal amino acids digestibility of soybean meals fed to growing pigs. Asian-australas. J.
Anim. Sci. 16:928-938.
Karr-Lilienthal, L. K., C. T. Kadzere, C. M. Grieshop, and G. C. Fahey, Jr. 2005. Chemical and
nutritional properties of soybean carbohydrates as related to nonruminants: a review.
Livest. Prod. Sci. 97:1-12.
Kim, S. W., E. van Heugten, F. Ji, C. H. Lee, and R. D. Mateo. 2010. Fermented soybean meal
as a vegetable protein source for nursery pigs: I. Effects on growth performance of
nursery pigs. J. Anim. Sci. 88:214-224.
Kim, Y. G., J. D. Lohakare, J. H. Yun, S. Heo, and B. J. Chae. 2007. Effect of feeding levels of
microbial fermented soy protein on the growth performance, nutrient digestibility ad
intestinal morphology in weaned piglets. Asian-australas. J. Anim. Sci. 20:399-404.
Leske, K. L., C. J. Jevne, and C. N. Coon. 1993. Effect of oligosaccharide additions on nitrogen-
corrected true metabolizable energy of soy protein concentrate. Poult. Sci. 72:664-668.
Liener, I. E. 1981. Factors affecting the nutritional quality of soya products. J. Am. Oil Chem.
Soc. 58:406-415.
Liener, I. E. 2000. Non-nutritive factors and bioactive compounds in soy. Pages 13-45 in Soy in
Animal Nutrition. J. K. Drackley, ed. Federation of Animal Sciences Societies, Savoy,
IL.
Lindemann, M. D., S. G. Cornelius, S. M. El Kandelgy, R. L. Moser, and J. E. Pettigrew. 1986.
Effect of age, weaning and diet on digestive enzyme levels in the piglet. J. Anim. Sci.
62:1298-1307.

19
Liying, Z., D. Li, S. Qiao, E. W. Johnson, B. Li, P. A. Thacker, and I. K. Han. 2003. Effects of
stachyose on performance, diarrhea incidence and intestinal bacteria in weanling pigs.
Arch. Anim. Nutr. 57:1-10.
Min, B. J., J. W. Hong, O. S. Kwon, W. B. Lee, Y. C. Kim, I. H. Kim, W. T. Cho, and J. H. Kim.
2004. The effect of feeding processed soy protein on the growth performance and
apparent ileal digestibility in weanling pigs. Asian-australas. J. Anim. Sci. 17:1271-1276.
Nelson, A. I., W. B. Wijeratne, S. W. Yeh, T. M. Wei, and L. S. Wei. 1987. Dry extrusion as an
aid to mechanical expelling of oil from soybeans. J. Am. Oil Chem. Soc. 64:1341-1347.
Nelson, T. S., L. W. Ferrara, and N. L. Storer. 1968. Phytate phosphorus content of feed
ingredients derived from plants. Poult. Sci. 47:1372-1374.
NRC. 2012. Nutrient requirements of swine. 11th ed. National Academy Press, Washington
DC.
Osborne, T. B., and L. B. Mendel. 1917. The use of soybeans as food. J. Biol. Chem. 32:369-
387.
Palacios, M. F., R. A. Easter, K. T. Soltwedel, C. M. Parsons, M. W. Douglas, T. Hymowitz, and
J. E. Pettigrew. 2004. Effect of soybean variety and processing on growth performance of
young chicks and pigs. J. Anim. Sci. 82:1108-1114.
Pan, B., D. Li, X. Piao, L. Zhang, and L. Guo. 2002. Effect of dietary supplementation with α-
galactosidase preparation and stachyose on growth performance, nutrient digestibility and
intestinal bacterial populations of piglets. Arch. Anim. Nutr. 56:327-337.
Rackis, J. J. 1972. Biologically active components. Pages 158-202 in Soybeans: Chemistry and
Technology. Vol. I. A. K. Smith and S. J. Circle, ed. The AVI Publ. Co. Inc., Westport,
CT.

20
Rackis, J. J. 1981. Flatulence caused by soya and its control through processing. J. Am. Oil
Chem. Soc. 58:503-509.
Rimbach, G., J. Pallauf, J. Moehring, K. Kraemer, and A. M. Minihane. 2008. Effect of dietary
phytate and microbial phytase on mineral and trace element bioavailability – a literature
review. Curr. Top. Nutraceut. Res. 6:131-144.
Rojas, O. J., and H. H. Stein. 2012. Digestibility of phosphorus by growing pigs of fermented
and conventional soybean meal without and with microbial phytase. J. Anim. Sci.
90:1506-1512.
Serrato, A. G. 1981. Extraction of oil from soybeans. J. Am. Oil Chem. Soc. 58:157-159.
Skoneczka, J. A., M. A. Saghai Maroof, C. Shang, and G. R. Buss. 2009. Identification of
candidate gene mutation associated with low stachyose phenotype in soybean line
PI200508. Crop Sci. 49:247-255.
Smiricky, M. R., C. M. Grieshop, D. M. Albin, J. E. Wubben, V. M. Gabert, and G. C. Fahey, Jr.
2002. The influence of soy oligosaccharides on apparent and true ileal amino acid
digestibilities and fecal consistency in growing pigs. J. Anim. Sci. 80:2433-2441.
Song, Y. S., V. G. Pérez, J. E. Pettigrew, C. Martinez-Villaluenga, E. Gonzalez de Mejia. 2010.
Fermentation of soybean meal and its inclusion in diets for newly weaned pigs reduced
diarrhea and measures of immunoreactivity in the plasma. Anim. Feed Sci. Technol.
159:41-49.
Stein, H. H., L. L. Berger, J. K. Drackley, G.C. Fahey, Jr., D. C. Hernot, and C. M. Parsons.
2008. Nutritional properties and feeding values of soybeans and their coproducts. Page
613-660 in Soybeans: Chemistry, Production, Processing, and Utilization. Johnson, A., P.
J. White, and R. Galloway, ed. AOCS Press, Urbana, IL.

21
USDA-ERS. 2012. Oil Crops Outlook. OCS-12i. USDA Economic Research Service.
http://www.ers.usda.gov/media/905623/ocs12if.pdf. Accessed Oct. 05, 2012.
USDA-FAS. 2012. World Agricultural Production. Circular Series WAP 09-12. USDA Foreign
Agricultural Service. http://www.fas.usda.gov/psdonline/circulars/production.pdf.
Accessed Oct. 05, 2012.
Wilcox, J. R., G. S. Premachandra, K. A. Young, and V. Raboy. 2000. Isolation of high seed
inorganic P, low-phytate soybean mutants. Crop Sci. 40:1601-1605.
Woodworth, J. C., M. D. Tokach, R. D. Goodband, J. L. Nelssen, P. R. O’Quinn, D. A. Knabe,
and N. W. Said. 2001. Apparent ileal digestibility of amino acids and the digestible and
metabolizable energy content of dry extruded-expelled soybean meal and its effects on
growth performance of pigs. J. Anim. Sci. 79:1280-1287.
22
TABLES
Table 2.1. Soybean production in different countries1
Country/Region
Production (million metric tons) Change in production from last year
2010/2011
Prel.
2011/2012
Proj.
2012/2013
MMT Percent
Dosmestic
United States 90.6 83.2 71.7 -11.5 -13.8
Foreign
Brazil 75.5 66.5 81.0 14.5 21.8
Argentina 49.0 41.0 55.0 14.0 34.2
China 15.1 13.5 12.6 -0.9 -6.7
India 9.8 11.0 11.4 0.4 3.6
Other 24.7 21.9 26.4 4.5 20.5
Total 174.1 153.9 186.4 32.5 21.1
World 264.7 237.1 258.1 21.0 8.9
1Adapted from USDA-FAS (2012).

23
Table 2.2. Composition of soybeans and soybean meal (SBM)1
Item
FFSB2
ESBM2 SBM
2
FSBM2
Conventional HP3
LO3
De-hulled
Non-de-
hulled
De-hulled
Non-de-
hulled
DM, % 92.36 92.38 94.40 95.57 93.85 89.98 88.79 92.88
CP, % 37.56 42.77 39.30 45.13 44.56 47.73 43.90 54.07
Fat, % 20.18 15.59 17.70 6.64 5.69 1.52 1.24 2.30
GE, kcal/kg 5,227 5,306 5,282 4,710 4,692 4,256 4,257 4,533
Sucrose, % 6.42 4.75 5.80 - 7.10 4.30 7.63 0.00
Raffinose, % 0.77 0.85 0.10 - 0.77 3.78 0.90 0.00
Stachyose, % 3.89 4.01 1.40 - 4.88 7.33 4.32 0.00
1Adapted from NRC (2012), and Rojas and Stein (2012).
2FFSB = full fat soybeans, ESBM = expelled soybean meal, SBM = solvent-extracted soybean meal, and FSBM = fermented soybean meal.
3HP = high-protein, and LO = low-oligosaccharide.

24
CHAPTER 3
AMINO ACID DIGESTIBILITY AND ENERGY CONCENTRATION OF HIGH-
PROTEIN, LOW-OLIGOSACCHARIDE, AND CONVENTIONAL FULL FAT, BUT DE-
HULLED, SOYBEANS FED TO GROWING PIGS
ABSTRACT
Two experiments were conducted to determine AA and energy digestibility in full fat soybeans
(FFSB). Conventional (FFSB-CV; 43.5% CP and 24.1% crude fat), high-protein (FFSB-HP;
50.2% CP and 20.5% crude fat), and low-oligosaccharide (FFSB-LO; 46.8% CP and 21.1%
crude fat) varieties of FFSB were used. In Exp. 1, the standardized ileal digestibility (SID) of CP
and AA in the 3 ingredients was determined using 8 growing barrows (initial BW: 20.6 ± 1.1 kg)
that were equipped with a T-cannula in the distal ileum. All diets contained FFSB as the sole
source of AA. An N-free diet was used to determine basal endogenous losses of AA. The pigs
were allotted to a replicated 4 × 4 Latin square design with 4 periods and 4 diets. The mean AID
and the mean SID of indispensable AA were greater (P < 0.05) in FFSB-CV than in FFSB-HP,
but no difference were observed between FFSB-CV and FFSB-LO. The mean AID and SID of
dispensable AA and the mean AID and SID of all AA were greater (P < 0.05) in FFSB-CV than
in FFSB-HP, but values obtained for FFSB-LO were not different from the other 2 sources of
FFSB. In Exp. 2, the DE and ME in the 3 sources of FFSB were determined using 24 growing
barrows (initial BW: 28.3 ± 3.7 kg). A corn-based basal diet and 3 diets containing corn and 1
source of FFSB were formulated. Pigs were placed in metabolism cages and randomly allotted to
the 4 diets with 6 replicate pigs per diet. After a 5 d adaptation period, feces and urine were
collected for the next 5 d. The DE and ME in each source of FFSB were calculated using the

25
difference procedure. The concentrations of DE and ME in FFSB-CV, FFSB-HP, and FFSB-LO
were 4,495 and 4,192; 4,765 and 4,447; and 4,694 and 4,349 kcal/kg DM, respectively, but no
differences among the 3 sources of FFSB were observed. Results indicate that the SID of most
AA in FFSB-LO, but not in FFSB-HP, is similar to values in FFSB-CV, but significant
differences in DE and ME among the 3 sources of FFSB were not observed.
Key words: amino acids, energy, full fat soybeans, pigs
INTRODUCTION
Soybean meal (SBM) is the most commonly used protein source in swine diets in the
United States (Kohlmeier, 1990). However, soybeans contain several anti-nutritional factors, one
of which is oligosaccharides. Oligosaccharides are not digested in the small intestine of pigs, but
they are fermented by the residing bacteria (Hayakawa et al., 1990; Slominski, 1994). This
results in decreased digestibility of energy, reduced growth rate, and may affect fecal consistency
in weanling pigs (Liying et at., 2003). Therefore, the soybean industry has developed new
varieties of soybeans that have concentrations of oligosaccharides that are less than 0.5%,
whereas conventional soybeans contain 4 to 6% oligosaccharides, which are mainly raffinose
and stachyose (Grieshop et al., 2003). Research with low oligosaccharide extruded-expelled
SBM fed to growing pigs indicates that there is no difference in DE, ME, and standardized ileal
digestibility (SID) of AA between SBM produced from low oligosaccharide and conventional
varieties (Baker and Stein, 2009).
In addition to the low-oligosaccharide soybeans, high protein varieties of soybeans have
been selected. According to Cervantes-Pahm and Stein (2008), non-de-hulled high protein full
fat soybeans (FFSB-HP) has greater concentration of digestible CP and AA than non-de-hulled
26
conventional full fat soybeans (FFSB-CV) due to the greater concentration of CP and AA in
FFSB-HP. However, SID values for AA do not differ between FFSB-HP and FFSB-CV
(Cervantes-Pahm and Stein, 2008; Baker et al., 2010), and ME values of SBM are not different
between high protein and conventional varieties (Baker and Stein, 2009). There are, however, no
data on the SID of AA and on the DE and ME of FFSB that have been de-hulled, although most
soybeans are de-hulled prior to being used in diets fed to pigs.
Therefore, 2 experiments were conducted to test the hypothesis that DE and ME, and SID
of CP and AA are greater in de-hulled FFSB produced from high-protein or low-oligosaccharide
varieties of soybeans than in conventional FFSB. The objectives of the experiments were to
determine SID of CP and AA, and the DE and ME in de-hulled FFSB-CV, FFSB-HP, and low-
oligosaccharide full fat soybeans (FFSB-LO).
MATERIALS AND METHODS
General
The experimental protocols for these experiments were reviewed and approved by the
Institutional Animal Care and Use Committee at the University of Illinois. Two experiments
were conducted using the same batches of FFSB (Schillinger Genetics, Inc., Des Moines, IA).
The 3 sources of FFSB included FFSB-CV, FFSB-HP, and FFSB-LO (Table 3.1). All 3 sources
of FFSB were processed at Natural Products (Grinnell, IA) and roasted via microwave, then
ground to meal specification mesh. Pigs used in both experiments were sired by G performer
(Duroc × Pietrain) boars that were mated to Fertilis 25 (¾ Landrace ¼ Large White) females
(Genetiporc Inc., Alexandria, MN).
27
Amino Acid Digestibility, Exp. 1
Animals, Housing, and Experimental Design. Eight growing barrows were used in this
experiment. Pigs (initial BW: 20.6 ± 1.1 kg) had been surgically equipped with a T-cannula in
the distal ileum using procedures adapted from Stein et al. (1998). Pigs were housed in
individual pens with tri-bar stainless steel floors (1.2 × 1.5 m) in an environmentally controlled
room. Pigs were allowed to recover for a 7 d period following surgery and were then randomly
allotted to a replicated 4 × 4 Latin square design with 4 diets and 4 periods. A feeder and a nipple
drinker were installed in each pen.
Diets and Feeding. Four diets were formulated (Tables 3.2 and 3.3). Three of the diets
contained 1 of each source of FFSB and starch, sugar, and oil. The last diet was a N-free diet that
was used to calculate basal endogenous losses of AA and CP. Solka floc (4.0%), magnesium
oxide (0.1%), and potassium carbonate (0.4%) were added to the N-free diet to increase the
concentration of crude fiber, Mg, and K in the diet. Vitamins and minerals were included in all
diets to meet or exceed current requirement estimates (NRC, 1998). All diets also contained
0.4% chromic oxide as an indigestible marker. All pigs were fed once daily at 0600 h at a level
of 3 times the estimated maintenance energy requirement (i.e., 106 kcal of ME per kg0.75
; NRC,
1998). Water was available at all times throughout the experiment.
Data Recording and Sample Collection. Pig BW were recorded at the beginning and at the end
of each period and the amount of feed supplied each day was recorded. Each experimental period
lasted 7 d. The initial 5 d of each period were considered an adaptation period to the diet. On d 6
and 7, ileal digesta were collected for 8 consecutive h. A 225-mL plastic bag was attached to the
cannula barrel with a cable tie and digesta flowing into the bag was collected as described by
Stein et al. (1999). Bags were removed whenever they were filled with digesta, or at least once
28
every 30 min and immediately frozen at -20°C to prevent bacterial degradation of the AA in the
digesta. On the completion of 1 experimental period, animals were deprived of feed overnight
and the following morning, a new experimental diet was offered.
Chemical Analysis. At the conclusion of the experiment, ileal samples were thawed, mixed
within animal and diet, and a sub-sample was collected for chemical analysis. A sample of each
diet and of each source of FFSB was collected as well. Ileal samples were lyophilized and finely
ground prior to chemical analysis. All samples were analyzed in duplicate. Diets and ingredients
were analyzed for DM, CP, AA, and acid hydrolyzed ether extract (AEE). Ileal samples were
analyzed for DM, CP, and AA. Diets and ileal samples were analyzed for chromium, as well.
Dry matter was analyzed in a drying oven at 135ºC for 2 h (method 930.15; AOAC Int., 2007).
Crude protein was analyzed by the combustion method (method 990.03; AOAC Int., 2007) using
a Rapid N cube (Elementar Americas Inc., Mt. Laurel, NJ). For AA analysis, samples were
hydrolyzed with 6 N HCl for 24 h at 110ºC, then analyzed on a Hitichi Amino Acid Analyzer
(Model L8800, Hitachi High Technologies America, Inc., Pleasaton, CA) using ninhydrin for
postcolum derivatization and norleucine as the internal standard [method 982.30 E (a, b, c);
AOAC Int., 2007]. Acid hydrolyzed ether extract was analyzed by acid hydrolysis using 3N HCl
(Sanderson, 1986) followed by crude fat extraction with petroleum ether (method 2003.06;
AOAC Int., 2007) on a Soxtec 2050 automated analyzer (FOSS North America, Eden Prairie,
MN). Chromium was analyzed in diet and ileal samples using an inductive coupled plasma
atomic emission spectrometric method (method 990.08; AOAC Int., 2007). Ingredient samples
were also analyzed for GE using bomb calorimetry (Model 6300, Parr Instruments, Moline, IL),
ash (method 942.05; AOAC Int., 2007), Ca and P (method 975.03; AOAC Int., 2007), ADF

29
(method 973.18; AOAC Int., 2007), NDF (Holst, 1973), sucrose, stachyose, and raffinose
(Janauer and Englmaier, 1978), and trypsin inhibitors (method Ba 12-75; AOCS, 2006).
Calculations and Statistical Analysis. Apparent ileal digestibility (AID) values for CP and AA
in samples obtained from feeding the 3 diets containing FFSB were calculated. Because the
FFSB were the only feed ingredients contributing CP and AA to each diet, these digestibility
values also represent the digestibility values for each source of FFSB. AID values of AA were
calculated using equation [1] (Stein et al., 2007):
(
) (
) [1]
where AIDAA is the apparent ileal digestibility of an AA (%), AAdigesta is the concentration of that
AA in the ileal digesta DM, AAfeed is the AA concentration of that AA in the feed DM, Crfeed is
the chromium concentration in the feed DM, and Crdigesta is the chromium concentration in the
ileal digesta DM. The AID for CP will also be calculated using this equation.
The basal endogenous flow to the distal ileum of each AA was determined based on the
flow obtained after feeding the N-free diet using equation [2] (Stein et al., 2007):
(
) [2]
where IAAend is the basal ileal endogenous loss of an AA (mg per kg DMI). The basal ileal
endogenous loss of CP was determined using the same equation.
By correcting the AID for the IAAend of each AA, standardized ileal digestibility (SID)
values of AA were calculated using equation [3] (Stein et al., 2007):
[3]
where SIDAA is the SID value (%) of each AA. The SID for AA was also calculated using the
same equation.
30
The Proc UNIVARIATE procedure of SAS was used to identify outliers (SAS Institute
Inc., Cary, NC). Data were analyzed using the Proc MIXED procedure of SAS. An analysis of
variance was conducted with diet as fixed effects and pig and period as random effects. When
significant differences were detected, treatment means were separated using the Least Significant
Difference test in Proc MIXED. The pig was the experimental unit for all analyses and an alpha
value of 0.05 was used to assess significance among treatments.
Energy Digestibility, Exp. 2
Diets, Animals, and Experimental Design. Four diets were formulated (Table 3.4). Three of the
diets contained one of the sources of FFSB and corn. The last diet was a corn diet that did not
contain any FFSB. Corn and FFSB were the only sources of energy in these diets. Vitamins and
minerals were included in all diets to meet or exceed current requirement estimates (NRC, 1998).
A total of 24 growing barrows (initial BW: 28.3 ± 3.7 kg) was obtained from the Swine
Research Center. Pigs were placed in metabolism cages equipped with a feeder and a nipple
drinker. The experiment was conducted as a randomized complete block design with 4 diets and
6 replications per diet.
Feeding and Sample Collection. The quantity of feed provided per pig daily was calculated as 3
times the estimated requirement for maintenance energy (i.e., 106 kcal ME per kg0.75
; NRC,
1998) and divided into 2 equal meals that were fed at 0700 h and 0300 h. Water was available at
all times. The experiment lasted 12 d. The initial 5 d was considered an adaptation period to the
diet, while urine and fecal materials were collected during the next 5 d according to standard
procedures using the marker to marker approach (Adeola, 2001). Urine was collected in urine
buckets over a preservative of 40 mL of 6 N HCl. Fecal samples and 20% of the collected urine
were stored at -20ºC immediately after collection. At the conclusion of the experiment, urine

31
samples were thawed and mixed within animal and diet, and a subsample was collected for
chemical analysis.
Sample Analysis and Data Processing. Fecal samples were dried in a forced air oven and finely
ground prior to analysis. Fecal, urine, diet, and ingredient samples were analyzed in duplicate for
GE using a bomb calorimeter (Model 6300, Parr Instruments, Moline, IL). Diets and ingredients
were also analyzed for DM, CP, and AEE as explained for Exp. 1. Following chemical analysis,
total tract digestibility values were calculated for energy using procedures previously described
(Stein et al., 2004). The amount of energy lost in the feces and urine was calculated as well, and
the quantities of DE and ME in each of the 4 diets were calculated (Stein et al., 2004). The
amount of DE and ME that was contributed by corn to the 3 diets containing FFSB were then
subtracted from the amount of DE and ME in each of these diets. This allowed for the calculation
of the DE and ME in each source of FFSB, using the difference procedure (Adeola, 2001). Data
were analyzed as explained for Exp. 1 using the Proc MIXED of SAS (SAS Institute Inc., Cary,
NC).
RESULTS
Amino Acid Digestibility, Exp. 1
The AID and SID of CP were less (P < 0.05) in FFSB-HP than in FFSB-CV and FFSB-
LO (Table 3.5). The AID and SID of Arg, His, Met, and Trp were not different among
ingredients. The AID and SID of Ile, Leu, Lys, Phe, and Val were greater (P < 0.05) in FFSB-
CV than in FFSB-HP, but the AID and SID of these AA in FFSB-LO was not different from
values obtained for FFSB-CV and FFSB-HP. The AID and SID of Thr were less (P < 0.01) in
FFSB-HP than in FFSB-CV and FFSB-LO. The mean AID and the mean SID of indispensable

32
AA were greater (P < 0.05) in FFSB-CV than in FFSB-HP, but no difference were observed
between FFSB-CV and FFSB-LO.
The AID and SID of Ala, Gly, and Tyr were greater (P < 0.05) in FFSB-CV than in
FFSB-HP, but the AID and SID of these AA in FFSB-LO were not different from the other 2
sources of FFSB. The AID and SID of Asp, Cys, and Ser were less (P < 0.05) in FFSB-HP than
in FFSB-CV and FFSB-LO, but no difference between FFSB-CV and FFSB-LO were observed.
The AID and SID of Glu and Pro were not different among ingredients. The mean AID and SID
of dispensable AA and the mean AID and SID of all AA were greater (P < 0.05) in FFSB-CV
than in FFSB-HP, but values obtained for FFSB-LO were not different from the other 2 sources
of FFSB.
Energy Digestibility, Exp. 2
The intake of GE was less (P < 0.05) in pigs fed the corn diet than in pigs fed the FFSB-
CV, FFSB-HP, or the FFSB-LO diets (Table 3.6). Intake of GE was greater (P < 0.05) in pigs
fed the FFSB-CV diet than in pigs fed the FFSB-LO diet; however, the GE intake in pigs fed the
FFSB-HP diet was not different from that of pigs fed the FFSB-CV diet or the FFSB-LO diet.
Pigs fed the corn diet had less (P < 0.05) fecal excretion of GE than pigs fed the FFSB-CV,
FFSB-HP, or FFSB-LO diets. Fecal excretion of GE was greater (P < 0.05) for pigs fed the
FFSB-CV diet than for pigs fed the FFSB-LO diet, but fecal excretion of GE from pigs fed the
FFSB-HP diet was not different from that of pigs fed the FFSB-CV diet or the FFSB-LO diet.
Urine excretion of GE was not different among diets. The ATTD of GE was greater (P < 0.05)
for the corn diet than for the FFSB-CV diet, but the ATTD of GE for the FFSB-HP and FFSB-
LO diets was not different from that of the corn diet or the FFSB-CV diet. The DE and ME were
less (P < 0.05) in the corn diet than in the FFSB-CV, FFSB-HP, and FFSB-LO diets, but there

33
were no differences in DE and ME among the 3 FFSB diets. The DE and ME in corn were less
(P < 0.05) than in FFSB-CV, FFSB-HP, and FFSB-LO (Table 3.7), but there was no difference
in DE and ME among the 3 sources of FFSB; this was true when values were calculated on an
as-fed basis as well as on a DM-basis.
DISCUSSION
Amino Acid Digestibility, Exp. 1
Cervantes-Pahm and Stein (2008) used growing pigs to determine AA digestibility in
FFSB-CV and FFSB-HP. Baker et al. (2010) used weanling pigs to determine AA digestibility in
FFSB-CV, FFSB-HP, and FFSB-LO. The concentration of CP, AA, and fat in FFSB-CV, FFSB-
HP, and FFSB-LO used in current experiment were greater than the values reported by
Cervantes-Pahm and Stein (2008) and by Baker et al. (2010), which is likely due to the de-
hulling of the beans used in this experiment. However, the concentration of NDF was greater in
the FFSB used in this experiment compared with the beans used in previous experiments. We
have no explanation for this observation because de-hulling was expected to reduce the
concentration of NDF. The concentration of DM in FFSB used in the current experiment was
greater than the reported DM value of FFSB used in other experiments, which indicates that the
FFSB were extensively dried, which may result in heat damage. Heat damage in SBM reduces
AA concentration and digestibility due to Maillard reactions (Gonzalez-Vega et al., 2011). The
Lys to CP ratio for FFSB-CV used in this experiment (5.81%) was less than that from the
previous experiments (Cervantes-Pahm and Stein, 2008; Baker et al., 2010; 6.57% and 7.06%,
respectively). We observed lower AA digestibility values in FFSB-HP than FFSB-CV which was
not in accordance with previous studies which reported similar digestibility values for FFSB-HP

34
and FFSB-CV (Cervantes-Pahm and Stein, 2008; Baker et al., 2010). This may have been due to
the lower Lys to CP ratio for FFSB-HP used in the current experiment (5.67%), compared with
the Lys to CP ratio in FFSB-HP used in the previous experiments (Cervantes-Pahm and Stein,
2008; Baker et al., 2010; 5.89% and 6.5%, respectively). The Lys to CP ratio for FFSB-LO used
in the present experiment was 5.79% whereas the ratio was 6.5% in the FFSB-LO used by Baker
et al. (2010). Thus, for all the FFSB used in this experiment, Lys to CP ratios were less than that
observed in previous experiments. A reduced Lys to CP ratio indicates heat damage in the meals
(Gonzales-Vega et al., 2011), which in addition to the high DM concentration indicates that all
the FFSB used in this experiment were overheated and that some of the Lys was destroyed. This
over-heating also explains the low values for AID and SID of all AA that were calculated in this
experiment when compared with the values reported by Cervantes-Pahm and Stein (2008) and
Baker et al. (2010).The AID and SID values obtained from this experiment for FFSB-CV were
greater compared with NRC (2012), but the values for FFSB-HP and FFSB-LO were lower than
the values in NRC (2012). Severe heat damage to SBM results in reduced AID and SID of all
AA (Gonzalez-Vega et al., 2011), and data from this experiment indicate that this is also the case
for the AID and SID in FFSB.
Energy Digestibility, Exp. 2
The DE and ME for corn used in this experiment are in accordance with the values
reported by Baker and Stein (2009). However, FFSB-CV used in this experiment contained more
CP and fat than reported by NRC (1998, as wells as the values reported by NRC (2012). It was,
therefore, expected that the FFSB-CV used in current experiment would contain more DE and
ME compared with the DE and ME values reported by NRC (1998), as well as the values
reported by NRC (2012).

35
Baker and Stein (2009) reported that extruded-expelled SBM produced from high protein
soybeans had greater concentration of DE compared with extruded-expelled SBM produced from
low oligosaccharide or conventional varieties of soybeans. According to Baker and Stein (2009),
greater protein concentration in the high-protein meal was responsible for the greater DE and ME
concentration. However in the present experiment, we did not observe any difference in DE and
ME values among the different varieties of FFSB. This is most likely a consequence of the
reduced concentration of fat in the FFSB-HP and FFSB-LO that were used in this experiment
compared with FFSB-CV. Thus, it appears that the increased DE and ME that were expected for
FFSB-HP and FFSB-LO due to the greater concentration of CP in these beans were negated by
the greater concentration of fat in FFSB-CV.

36
LITERATURE CITED
Adeola, O. 2001. Digestion and balance techniques in pigs. Pages 903-916 in Swine Nutrition.
2nd
ed. A.J. Lewis and L. L. Southern, eds. CRC Press, Washington, DC.
AOAC International. 2007. Official Methods of Analysis of AOAC International. 18th
ed. Rev. 2.
W. Howitz, and G.W. Latimer, Jr., ed. AOAC Int., Gaithersburg, MD.
AOCS. 2006. Official Methods and Recommended Practices of the AOCS. 5th
ed. American Oil
Chemists’ Society. Urbana, IL.
Baker, K. M., and H. H. Stein. 2009. Amino acid digestibility and concentration of digestible and
metabolizable energy in soybean meal produced from conventional, high-protein, or low-
oligosaccharide varieties of soybeans and fed to growing pigs. J. Anim. Sci. 87:2282-
2290.
Baker, K. M., B. G. Kim, and H. H. Stein. 2010. Amino acid digestibility in conventional, high
protein, or low-oligosacchride varieties of full-fat soybeans and in soybean meal by
weanling pigs. Anim. Feed Sci. Technol. 162:66-73.
Cervantes-Pahm, S. K., and H. H. Stein. 2008. Effect of dietary soybean oil and soybean protein
concentration on the concentration of digestible amino acids in soybean products fed to
growing pigs. J. Anim. Sci. 86:1841-1849.
Gonzalez-Vega, J. C., B. G. Kim, J. K. Htoo, A. Lemme, and H. H. Stein. 2011. Amino acid
digestibility in heated soybean meal fed to growing pigs. J. Anim. Sci. 89:3617-3625.
Grieshop, C. M., C. T. Kadzere, G. M. Clapper, E. A. Flickinger, L. L. Bauer, R. L. Frazier, and
G. C. Fahey. 2003. Nutritional characteristics of United States soybeans and soybean
meals. J. Agric. Food Chem. 51:7684-7691.
Hayakawa, K., J. Mizutani, K. Wada, T. Masai, I. Yoshihara, and T. Mitsuoka. 1990. Effects of

37
soybean oligosaccharides on human faecal flora. Microb. Ecol. Health Dis. 3: 293-303.
Holst, D. O. 1973. Holst filtration apparatus for Van Soest detergent fiber analysis. J. AOAC.
56:1352–1356.
Janauer, G. A., and P. Englmaier. 1978. Multi-step time program for the rapid gas-liquid
chromatography of carbohydrates. J. Chromatogr. 153:539-542
Kohlmeier, R. H. 1990. World production, storage and utilization of various defatted animal and
vegetable mid-high protein meals. Pages 390-395 in Edible Fats and Oils Processing:
Basic Principles and Modern Practices: World Conference Proceedings. D. R. Erikson,
ed. American Oil Chemists’ Society, Champaign, IL.
Liying, Z., D. Li, S. Qiao, E. W. Johnson, B. Li, P. A. Thacker, and I. K. Han. 2003. Effects of
stachyose on performance, diarrhea incidence and intestinal bacteria in weanling pigs.
Arch. Anim. Nutr. 57:1-10.
NRC. 1998. Nutrient requirements of swine. 10th
ed. National Academy Press, Washington DC.
NRC. 2012. Nutrient requirements of swine. 11th
ed. National Academy Press, Washington DC.
Sanderson, P. 1986. A new method of analysis of feedingstuffs for the determination of crude
oils and fats. Pages 77-81 in Recent Advances in Animal Nutrition. W. Haresign and D. J.
A. Cole, ed. Butterworths, London, U.K.
Slominski, B. A. 1994. Hydrolysis of galactooligosaccharides by commercial preparations of α-
galactosidase and β-fructofuranosidase: Potential for use as dietary additives. J. Sci. Food
Agric. 65:323-330.
Stein, H. H., S. Aref, and R. A. Easter. 1999. Comparative protein and amino acid digestibilities
in growing pigs and sows. J. Anim. Sci., 77:1169-1179.

38
Stein, H. H., G. Benzoni, R. A. Bohlke, and D. N. Peters. 2004. Assessment of the feeding value
of South Dakota grown field peas (Pisum Sativum L) for growing pigs. J. Anim. Sci.
82:2568-2578.
Stein, H. H., B. Seve, M. F. Fuller, P. J. Moughan, and C. F. M. de Lange. 2007. Invited review:
Amino acid bioavailability and digestibility in pig feed ingredients: Terminology and
application. J. Anim. Sci. 85:172-180.
Stein, H. H., C. F. Shipley, and R. A. Easter. 1998. Technical Note: A technique for inserting a
T-cannula into the distal ileum of pregnant sows. J. Anim. Sci. 76:1433-1436.
39
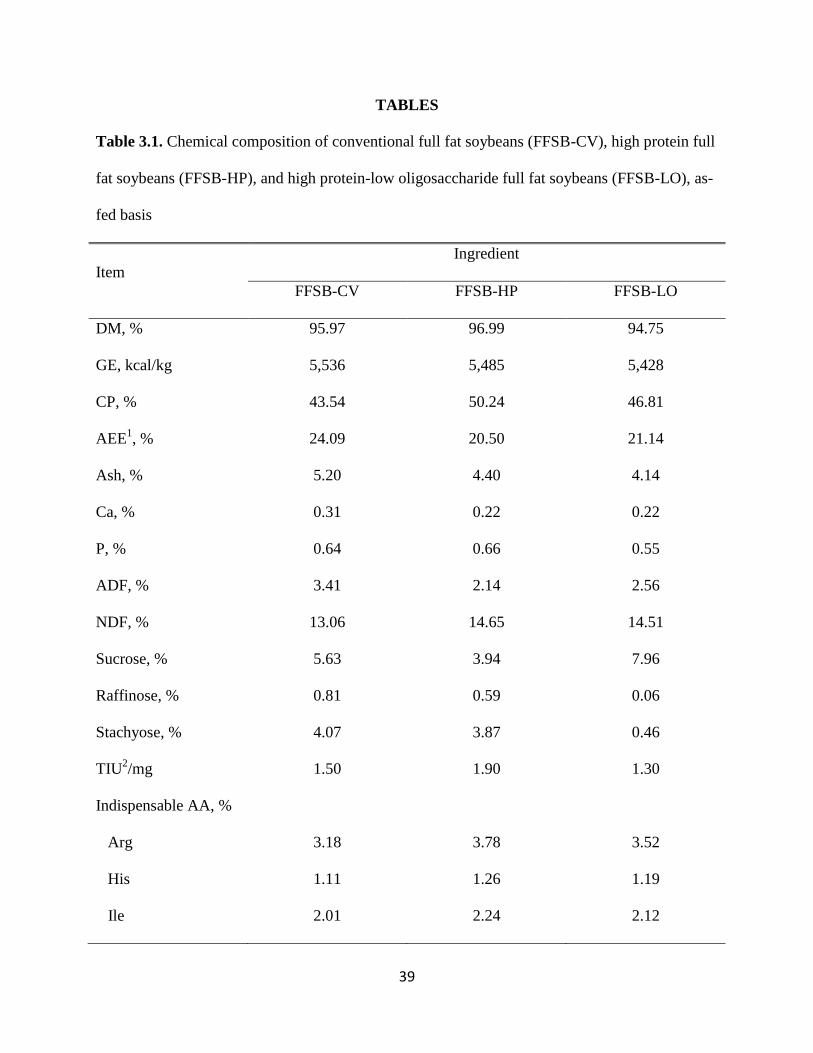
TABLES
Table 3.1. Chemical composition of conventional full fat soybeans (FFSB-CV), high protein full
fat soybeans (FFSB-HP), and high protein-low oligosaccharide full fat soybeans (FFSB-LO), as-
fed basis
Item
Ingredient
FFSB-CV FFSB-HP FFSB-LO
DM, % 95.97 96.99 94.75
GE, kcal/kg 5,536 5,485 5,428
CP, % 43.54 50.24 46.81
AEE1, % 24.09 20.50 21.14
Ash, % 5.20 4.40 4.14
Ca, % 0.31 0.22 0.22
P, % 0.64 0.66 0.55
ADF, % 3.41 2.14 2.56
NDF, % 13.06 14.65 14.51
Sucrose, % 5.63 3.94 7.96
Raffinose, % 0.81 0.59 0.06
Stachyose, % 4.07 3.87 0.46
TIU2/mg 1.50 1.90 1.30
Indispensable AA, %
Arg 3.18 3.78 3.52
His 1.11 1.26 1.19
Ile 2.01 2.24 2.12
40
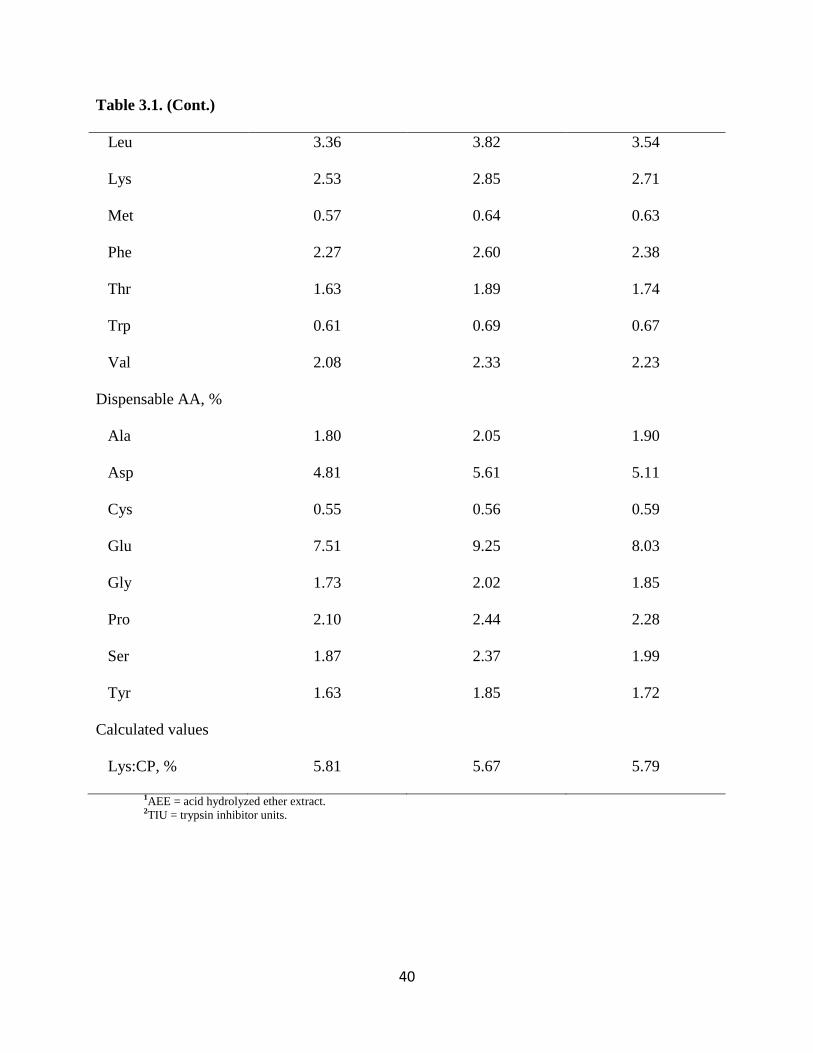
Table 3.1. (Cont.)
Leu 3.36 3.82 3.54
Lys 2.53 2.85 2.71
Met 0.57 0.64 0.63
Phe 2.27 2.60 2.38
Thr 1.63 1.89 1.74
Trp 0.61 0.69 0.67
Val 2.08 2.33 2.23
Dispensable AA, %
Ala 1.80 2.05 1.90
Asp 4.81 5.61 5.11
Cys 0.55 0.56 0.59
Glu 7.51 9.25 8.03
Gly 1.73 2.02 1.85
Pro 2.10 2.44 2.28
Ser 1.87 2.37 1.99
Tyr 1.63 1.85 1.72
Calculated values
Lys:CP, % 5.81 5.67 5.79
1AEE = acid hydrolyzed ether extract. 2TIU = trypsin inhibitor units.
41
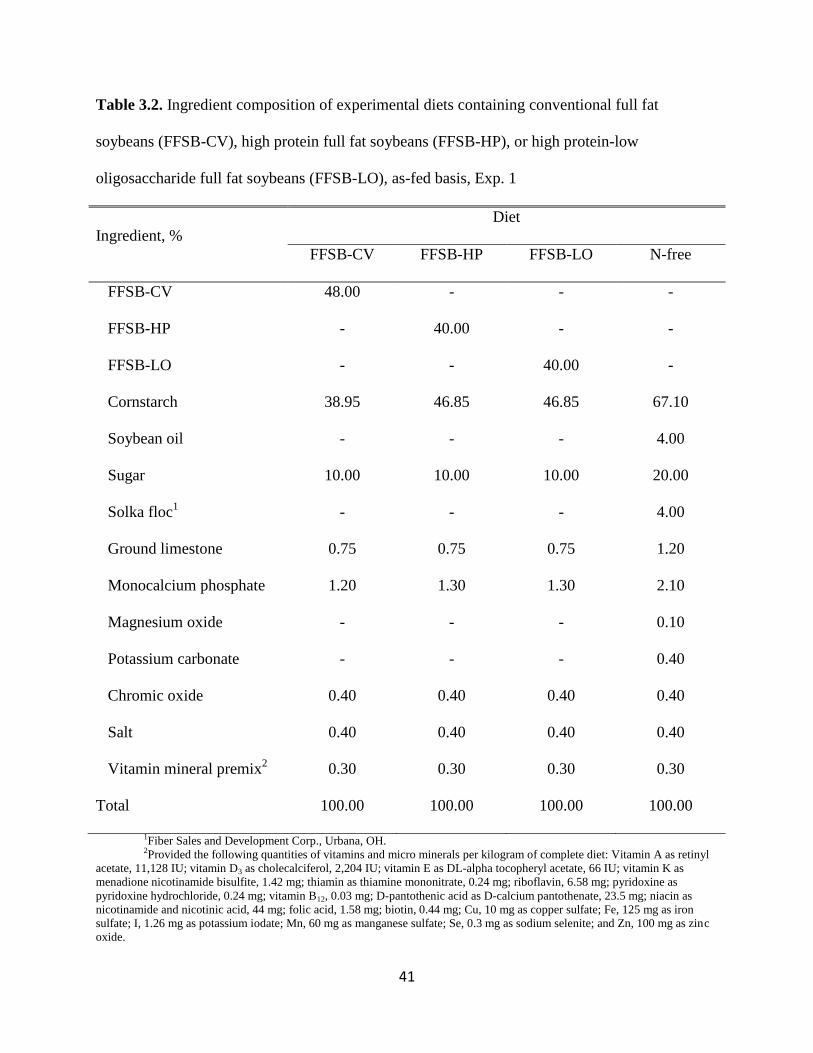
Table 3.2. Ingredient composition of experimental diets containing conventional full fat
soybeans (FFSB-CV), high protein full fat soybeans (FFSB-HP), or high protein-low
oligosaccharide full fat soybeans (FFSB-LO), as-fed basis, Exp. 1
Ingredient, %
Diet
FFSB-CV FFSB-HP FFSB-LO N-free
FFSB-CV 48.00 - - -
FFSB-HP - 40.00 - -
FFSB-LO - - 40.00 -
Cornstarch 38.95 46.85 46.85 67.10
Soybean oil - - - 4.00
Sugar 10.00 10.00 10.00 20.00
Solka floc1 - - - 4.00
Ground limestone 0.75 0.75 0.75 1.20
Monocalcium phosphate 1.20 1.30 1.30 2.10
Magnesium oxide - - - 0.10
Potassium carbonate - - - 0.40
Chromic oxide 0.40 0.40 0.40 0.40
Salt 0.40 0.40 0.40 0.40
Vitamin mineral premix2 0.30 0.30 0.30 0.30
Total 100.00 100.00 100.00 100.00
1Fiber Sales and Development Corp., Urbana, OH. 2Provided the following quantities of vitamins and micro minerals per kilogram of complete diet: Vitamin A as retinyl
acetate, 11,128 IU; vitamin D3 as cholecalciferol, 2,204 IU; vitamin E as DL-alpha tocopheryl acetate, 66 IU; vitamin K as
menadione nicotinamide bisulfite, 1.42 mg; thiamin as thiamine mononitrate, 0.24 mg; riboflavin, 6.58 mg; pyridoxine as
pyridoxine hydrochloride, 0.24 mg; vitamin B12, 0.03 mg; D-pantothenic acid as D-calcium pantothenate, 23.5 mg; niacin as
nicotinamide and nicotinic acid, 44 mg; folic acid, 1.58 mg; biotin, 0.44 mg; Cu, 10 mg as copper sulfate; Fe, 125 mg as iron
sulfate; I, 1.26 mg as potassium iodate; Mn, 60 mg as manganese sulfate; Se, 0.3 mg as sodium selenite; and Zn, 100 mg as zinc
oxide.

42
Table 3.3. Chemical composition of experimental diets containing conventional full fat soybeans
(FFSB-CV), high protein full fat soybeans (FFSB-HP), or high protein-low oligosaccharide full
fat soybeans (FFSB-LO), as-fed basis, Exp. 1
Item
Diets
FFSB-CV FFSB-HP FFSB-LO N-free
DM, % 94.59 94.37 94.14 93.58
CP, % 22.77 21.08 21.24 0.39
AEE1, % 11.15 8.18 8.70 1.77
Indispensable AA, %
Arg 1.54 1.54 1.51 0.01
His 0.54 0.52 0.51 0.00
Ile 0.97 0.95 0.88 0.01
Leu 1.66 1.59 1.54 0.03
Lys 1.25 1.19 1.17 0.02
Met 0.26 0.26 0.27 0.00
Phe 1.11 1.07 1.02 0.01
Thr 0.81 0.77 0.78 0.01
Trp 0.27 0.26 0.28 0.03
Val 1.01 0.99 0.92 0.01
Dispensable AA, %
Ala 0.90 0.87 0.85 0.02
Asp 2.42 2.34 2.27 0.02
Cys 0.26 0.24 0.27 0.01

43
Table 3.3. (Cont.)
Glu 3.83 3.81 3.63 0.04
Cly 0.86 0.86 0.82 0.01
Pro 1.04 1.03 0.99 0.02
Ser 0.93 0.88 0.90 0.01
Tyr 0.73 0.67 0.65 0.01
1AEE = acid hydrolyzed ether extract.

44
Table 3.4. Composition of experimental diets containing corn, conventional full fat soybeans
(FFSB-CV), high protein full fat soybeans (FFSB-HP), or high protein-low oligosaccharide full
fat soybeans (FFSB-LO), as-fed basis, Exp. 2
Ingredient, %
Diet
Corn FFSB-CV FFSB-HP FFSB-LO
Corn 97.20 63.20 69.10 67.60
FFSB-CV - 34.50 - -
FFSB-HP - - 28.50 -
FFSB-LO - - - 30.00
Ground limestone 1.10 1.00 1.05 1.05
Monocalcium phosphate 1.00 0.60 0.65 0.65
Salt 0.40 0.40 0.40 0.40
Vitamin mineral premix1 0.30 0.30 0.30 0.30
Total 100.00 100.00 100.00 100.00
Analyzed composition
DM, % 88.68 91.23 90.67 90.47
GE, kcal/kg 3,794 4,388 4,297 4,257
CP, % 7.60 21.64 20.48 20.12
AEE2, % 3.09 10.30 8.15 8.26
1Provided the following quantities of vitamins and micro minerals per kilogram of complete diet: Vitamin A as retinyl
acetate, 11,128 IU; vitamin D3 as cholecalciferol, 2,204 IU; vitamin E as DL-alpha tocopheryl acetate, 66 IU; vitamin K as
menadione nicotinamide bisulfite, 1.42 mg; thiamin as thiamine mononitrate, 0.24 mg; riboflavin, 6.58 mg; pyridoxine as
pyridoxine hydrochloride, 0.24 mg; vitamin B12, 0.03 mg; D-pantothenic acid as D-calcium pantothenate, 23.5 mg; niacin as
nicotinamide and nicotinic acid, 44 mg; folic acid, 1.58 mg; biotin, 0.44 mg; Cu, 10 mg as copper sulfate; Fe, 125 mg as iron
sulfate; I, 1.26 mg as potassium iodate; Mn, 60 mg as manganese sulfate; Se, 0.3 mg as sodium selenite; and Zn, 100 mg as zinc
oxide. 2AEE = acid hydrolyzed ether extract.
45
Table 3.5. Apparent ileal digestibility (AID) and standardized ileal digestibility (SID) of CP and AA in conventional full fat soybeans
(FFSB-CV), high protein full fat soybeans (FFSB-HP), and high protein-low oligosaccharide full fat soybeans (FFSB-LO) by growing
pigs, Exp. 11
Item
AID SID2
Ingredient Ingredient
FFSB-CV FFSB-HP FFSB-LO SEM P-value FFSB-CV FFSB-HP FFSB-LO SEM P-value
CP, % 74.91a
64.91b
70.63a
4.0 < 0.01 83.99a
74.70b
80.31a
4.0 < 0.01
Indispensable AA, %
Arg 87.51 81.26 84.92 3.3 0.14 91.58 85.32 89.04 3.3 0.14
His 83.73 76.97 80.26 3.2 0.06 87.08 80.44 83.78 3.2 0.07
Ile 80.81a
73.67b
76.63ab
3.6 0.03 84.39a
77.32b
80.57ab
3.6 0.04
Leu 81.78a
74.59b
78.47ab
3.4 0.03 85.14a
78.10b
82.08ab
3.4 0.03
Lys 83.11a
76.54b
80.06ab
3.2 0.04 86.38a
79.97b
83.54ab
3.2 0.04
Met 80.98 75.31 79.28 3.4 0.06 84.45 78.77 82.60 3.4 0.06
Phe 82.53a
75.46b
78.97ab
3.5 0.04 85.59a
78.63b
82.29ab
3.5 0.04
Thr 75.80a
68.28b
73.27a
3.4 < 0.01 82.71a
75.53b
80.41a
3.4 < 0.01

46
Table 3.5. (Cont.)
Trp 81.36 76.59 81.69 2.6 0.07 85.20 80.57 85.37 2.6 0.09
Val 77.45a
70.21b
72.93ab
3.9 0.03 82.88a
75.74b
78.86ab
3.9 0.04
Mean 81.98a
75.18b
78.85ab
3.4 0.04 85.98a
79.29b
83.07ab
3.4 0.04
Dispensable AA, %
Ala 74.34a
66.44b
69.55ab
4.1 0.02 81.82a
74.16b
77.44ab
4.1 0.03
Asp 80.52a
73.35b
78.32a
3.3 0.02 83.64a
76.57b
81.63a
3.3 0.02
Cys 73.73a
66.62b
73.62a
3.4 < 0.01 80.52a
73.96b
80.13a
3.4 0.01
Glu 85.33 79.32 82.64 2.9 0.06 87.90 81.89 85.34 2.9 0.06
Gly 65.93a
55.05b
60.41ab
5.9 0.02 86.79a
75.86b
82.18ab
5.9 0.02
Pro 34.39 11.11 25.76 17.5 0.19 103.90 81.14 98.45 17.5 0.18
Ser 81.23a
74.82b
80.14a
2.9 0.02 86.01a
79.85b
85.05a
2.9 0.03
Tyr 82.23a
74.61b
78.19ab
3.4 0.01 86.26a
78.89b
82.59ab
3.4 0.02
Mean 76.19a
67.50b
72.71ab
4.3 0.03 87.45a
79.01b
84.55ab
4.3 0.03
Total 78.87a
71.04b
75.54ab
3.8 0.03 86.77a
79.14b
83.86ab
3.8 0.03
a-bMeans within a row lacking a common superscript letter are different (P < 0.05). 1Data are the least square means of 8 observations per treatment. 2 Values for SID were calculated by correcting the values for apparent ileal digestibility for the basal ileal endogenous losses. Basal ileal endogenous losses were
determined from pigs fed the N-free diet as (g/kg of DMI) as CP, 21.85; Arg, 0.66; His, 0.19; Ile, 0.37; Leu, 0.59; Lys, 0.43; Met, 0.10; Phe, 0.36; Thr, 0.59; Trp, 0.11; Val, 0.58;
Ala, 0.71; Asp, 0.80; Cys, 0.19; Glu, 1.04; Gly, 1.90; Pro, 7.64; Ser, 0.47; Tyr, 0.30.
47
Table 3.6. Daily energy balance and apparent total tract digestibility (ATTD) of energy of experimental diets containing corn, or corn
and conventional full fat soybeans (FFSB-CV), high protein full fat soybeans (FFSB-HP), or high protein-low oligosaccharide full fat
soybeans (FFSB-LO), as-fed basis, Exp. 21
Item
Diet
Corn FFSB-CV FFSB-HP FFSB-LO SEM P-Value
GE intake, kcal/d 4,399c
4,976a
4,966ab
4,852b
128.67 < 0.01
GE in feces, kcal/d 560c
850a
723ab
703b
47.01 < 0.01
GE in urine, kcal/d 119 189 186 192 23.25 0.11
ATTD of GE, % 87.25a
82.98b
85.43ab
85.43ab
0.91 0.02
DE in diet, kcal/kg 3,311b
3,641a
3,671a
3,637a
38.69 < 0.01
ME in diet, kcal/kg 3,208b
3,474a
3,510a
3,467a
45.80 < 0.01
a-cMeans within a row lacking a common superscript letter are different (P < 0.05). 1Data are the least square means of 6 observations per treatment.

48
Table 3.7. Concentration of energy in corn, conventional full fat soybeans (FFSB-CV), high protein full fat soybeans (FFSB-HP), and
high protein-low oligosaccharide full fat soybeans (FFSB-LO), Exp. 21
Item
Ingredient
Corn FFSB-CV FFSB-HP FFSB-LO SEM P-Value
DE, kcal/kg 3,406b
4,314a
4,622a
4,448a
121.15 < 0.01
ME, kcal/kg 3,300b
4,023a
4,313a
4,121a
143.66 <0.01
DE, kcal/kg DM 3,864b
4,495a
4,765a
4,694a
126.46 < 0.01
ME, kcal/kg DM 3,744b
4,192a
4,447a
4,349a
150.25 < 0.01
a-bMeans within a row lacking a common superscript letter are different (P < 0.05). 1Data are the least square means of 6 observations per treatment.
49
CHAPTER 4
AMINO ACID DIGESTIBILITY AND ENERGY CONCENTRATION IN LOW-
TRYPSIN INHIBITOR EXPELLER SOYBEAN MEAL FED TO GROWING PIGS
ABSTRACT
Two experiments were conducted to determine AA and energy digestibility in expeller
soybean meal (ESBM). Three sources of ESBM were produced from conventional (ESBM-CV),
low trypsin inhibitor (ESBM-LT), and ultra-low trypsin inhibitor (ESBM-ULT) soybeans using
cold pressing procedure. Approximately 50% of each source was roasted via a heated thermal
screw (ESBM-CV-H, ESBM-LT-H, and ESBM-ULT-H, respectively), whereas 50% was used
without used without heating. A source of conventional soybean meal (SBM) was also used. In
Exp. 1, the standardized ileal digestibility (SID) of CP and AA in the 7 ingredients was
determined using 8 growing barrows (initial BW: 21.8 ± 1.2 kg) that were equipped with a T-
cannula in the distal ileum. All diets contained ESBM or SBM as the sole source of AA. A N-
free diet was used to determine basal endogenous losses of AA. Pigs were allotted to an 8 × 8
Latin square design with 8 periods and 8 diets. The SID of CP and all AA were greater (P <
0.01) in SBM than in all the ESBM. The SID of CP and all AA was less (P < 0.01) in ESBM-CV
compared with ESBM-LT and ESBM-ULT, but all values for ESBM-ULT were greater (P <
0.01) than the values for ESBM-LT. For most AA, ESBM-CV-H and ESBM-LT-H had greater
(P < 0.01) AID and SID values ESBM-CV and ESBM-LT. In contrast, the AID and SID values
for AA were not different in the ESBM-ULT-H compared with the ESBM-ULT. In Exp. 2, the
DE and ME in the 7 sources of ESBM and SBM were determined using 48 growing barrows
(initial BW: 36.3±3.2 kg). A corn-based basal diet and 7 diets containing corn and 1 source of

50
ESBM or SBM were formulated. Pigs were placed in metabolism cages and randomly allotted to
the 8 diets. After a 5 d adaptation period, feces and urine were collected for 5 d. The DE and ME
in each source of ESBM and SBM were calculated using the difference procedure. The
concentration of DE and ME in ESBM-CV, ESBM-LT, ESBM-ULT, ESBM-CV-H, ESBM-LT-
H, ESBM-ULT-H, and SBM were 4,519 and 4,086; 4,962 and 4,430; 4,652 and 4,359; 4,495 and
4,494; 4,674 and 4,305; 4,826 and 4,494; and 4,427 and 4,006 kcal/kg DM, respectively. The DE
of both the cold pressed and the heated sources of ESBM-ULT and ESBM-LT were greater (P <
0.01) than the DE of SBM. The DE was greater (P < 0.01) in ESBM-LT than in ESBM-ULT, but
there was no difference between ESBM-LT-H and ESBM-ULT-H. The ME in ESBM-ULT and
ESBM-LT-H were greater (P < 0.01) than in corn, and ESBM-LT and ESBM-ULT-H had a
greater (P < 0.01) ME than ESBM-CV and SBM. Therefore, it is not possible to use these low-
trypsin beans in diets fed to pigs without heat treatment, even with only 7 to 12 units of trypsin
inhibitors. Results of this research also indicate that the only negative effects of trypsin inhibitors
is the reduction in AA digestibility because energy digestibility does not seem to be affected by
the presence of trypsin inhibitors in the meals.
Key words: amino acids, expeller soybean meal, pigs, soybean meal, trypsin inhibitors
INTRODUCTION
Soybeans contain trypsin inhibitors (Rackis, 1972) that are detrimental to protein
digestion in monogastric animals (Rackis et al., 1979; Combs et al., 1967; Herkelman et al.,
1993). It is, therefore, established that soybean products need to be heat treated prior to use in
diets for monogastric animals because heat treatment destroys the trypsin inhibitors in the meals,
and AA digestibility in heat treated soybean products is much greater than in unheated products

51
(Goebel and Stein, 2011). The most commonly fed source of soybean products for monogastric
animals is soybean meal (SBM), which is heat treated in the form of toasting after the oil has
been extracted. Soybean meal, therefore, usually has a low concentration of trypsin inhibitors
(i.e., less than 4 trypsin inhibitor units). In contrast, unheated SBM usually contains more than 35
trypsin inhibitor units.
Selection of soybeans with low concentrations of trypsin inhibitors has resulted in newer
soybean varieties that contain less trypsin inhibitor units than conventional soybeans. It was
recently demonstrated that the standardized ileal digestibility (SID) of AA in soybeans
containing 23 trypsin inhibitor units is greater than in conventional soybeans that contain 35
trypsin inhibitor units, but SID values of AA in the low-trypsin soybeans were not as high as in
SBM containing 3 trypsin inhibitor units (Goebel and Stein, 2011). However, additional
selection for varieties with low concentrations of trypsin inhibitors has resulted in identification
of soybean varieties containing only 7 or 12 trypsin inhibitor units. It is believed that these low
levels of trypsin inhibitors will result in further increases in the SID of AA compared with
conventional soybeans, but that hypothesis has not yet been experimentally verified. It is also not
known how the concentration of trypsin inhibitors in soybeans influences the digestibility of
energy and the concentration of DE and ME.
Therefore, 2 experiments were conducted to test the hypothesis that SID of CP and AA
are greater in expeller soybean meal (ESBM) produced from soybeans with low or ultra-low
concentration of trypsin inhibitors than in ESBM produced from conventional soybeans, without
affecting DE and ME negatively. The objective of these experiments is to determine the SID of
CP and AA, and the DE and ME in ESBM produced from conventional soybeans, or soybeans
with low or ultra- low concentrations of trypsin inhibitors.

52
MATERIALS AND METHODS
General
The experimental protocols for these experiments were reviewed and approved by the
Institutional Animal Care and Use Committee at the University of Illinois. Two experiments
were conducted using the same batches of ESBM (Schillinger Genetics, Inc., Des Moines, IA).
The 3 sources of ESBM were produced from a conventional source of soybeans (ESBM-CV), a
source of soybeans with a low concentration of Kunitz and Bowman-Birk trypsin inhibitors
(ESBM-LT), and a source of soybeans with an ultra-low concentration of trypsin inhibitors
(ESBM-ULT; Table 4.1). All 3 sources of soybeans were defatted using a cold pressing
procedure through a Kern Kraft S40 and then ground twice for meal specification.
Approximately 50% of each source of soybeans were run back through a heated thermal screw to
achieve a roasting effect (ESBM-CV-H, ESBM-LT-H, and ESBM-ULT-H, respectively; Table
4.1). A source of conventional SBM was also used in the experiment. Pigs used in both
experiments were sired by G performer (Duroc × Pietrain) boars that were mated to Fertilis 25
(¾ Landrace ¼ Large White) females (Genetiporc Inc., Alexandria, MN).
Amino Acid Digestibility, Exp. 1
Animals, Housing, and Experimental Design. Eight growing barrows were used in this
experiment. Pigs (initial BW: 21.8 ± 1.2 kg) were surgically equipped with a T-cannula in the
distal ileum using procedures adapted from Stein et al. (1998). Pigs were housed in individual
pens (1.5 × 1.2 m) with fully slatted floors in an environmentally controlled room. Pigs were
allowed to recover for a 7 d period following surgery. Pigs were then randomly allotted to an 8 ×
53
8 Latin square design with 8 diets and 8 periods. A feeder and a nipple drinker were installed in
each pen.
Diets and Feeding. Eight diets were formulated (Tables 4.2 and 4.3). Seven of the diets
contained 1 of each source of SBM and starch, sugar, and oil. The last diet was a N-free diet that
was used to calculate basal endogenous losses of AA and CP. Solka floc (4.0%), magnesium
oxide (0.1%), and potassium carbonate (0.4%) were added to the N-free diet to increase the
concentration of crude fiber, and to prevent deficiency of Mg and K in the diet, respectively.
Vitamins and minerals were included in all diets to meet or exceed current requirement estimates
(NRC, 1998). All diets also contained 0.4% chromic oxide as an indigestible marker. All pigs
were fed once daily at 0700 h at a level of 3 times the estimated maintenance energy requirement
(i.e., 106 kcal of ME per kg0.75
; NRC, 1998). Water was available at all times throughout the
experiment.
Data Recording and Sample Collection. Pig BW were recorded at the beginning and at the end
of each period and the amount of feed supplied each day was recorded. Each experimental period
lasted 7 d. The initial 5 d of each period were considered an adaptation period to the diet. On d 6
and 7, ileal digesta were collected for 8 consecutive h. A 225-mL plastic bag was attached to the
cannula barrel with a cable tie and digesta flowing into the bag were collected as described by
Stein et al. (1999). Bags were removed whenever they were filled with digesta, or at least once
every 30 min, and immediately frozen at -20°C to prevent bacterial degradation of AA in the
digesta.
Chemical Analysis. At the conclusion of the experiment, ileal samples were thawed, mixed
within animal and diet, and a sub-sample was collected for chemical analysis. A sample of each
diet and of each source of SBM was collected as well. Ileal samples were lyophilized and finely

54
ground prior to chemical analysis. All samples were analyzed in duplicate. Diets and ingredients
were analyzed for DM, CP, and AA. Ileal samples were analyzed for DM, CP, and AA. Diets
and ileal samples were analyzed for chromium, as well. Dry matter was analyzed in a drying
oven at 135ºC for 2 h (method 930.15; AOAC Int., 2007), CP was analyzed by combustion
method (method 990.03; AOAC Int., 2007) using a Rapid N cube (Elementar Americas Inc., Mt.
Laurel, NJ). For AA analysis, samples were hydrolyzed with 6 N HCl for 24 h at 110ºC, then
analyzed on a Hitichi Amino Acid Analyzer (Model L8800, Hitachi High Technologies America,
Inc., Pleasaton, CA) using ninhydrin for postcolum derivatization and norleucine as the internal
standard [method 982.30 E (a, b, c); AOAC Int., 2007]. Chromium was analyzed in diet and ileal
samples using an inductive coupled plasma atomic emission spectrometric method (method
990.08; AOAC Int., 2007). Ingredient samples were analyzed for GE using bomb calorimeter
(Model 6300, Parr Instruments, Moline, IL), ash (method 942.05; AOAC Int., 2007), Ca and P
(method 975.03; AOAC Int., 2007), ADF (method 973.18; AOAC Int., 2007), NDF (Holst,
1973), sucrose, stachyose, and raffinose (Janauer and Englmaier, 1978), and trypsin inhibitors
(method Ba 12-75; AOCS, 2006). Ingredient samples were also analyzed for acid-hydrolyzed
ether extract by acid hydrolysis using 3N HCl (Sanderson, 1986) followed by crude fat extraction
with petroleum ether (method 2003.06; AOAC Int., 2007) on a Soxtec 2050 automated analyzer
(FOSS North America, Eden Prairie, MN).
Calculations and Statistical Analysis. Apparent ileal digestibility (AID) values for CP and AA
in samples obtained from feeding the 7 diets containing SBM were calculated. Because SBM
was the only feed ingredient contributing CP and AA in each diet, these digestibility values also
represent the digestibility values for each source of SBM. AID values of AA were calculated
using equation [1] (Stein et al., 2007):
55
(
) (
) [1]
where AIDAA is the apparent ileal digestibility of an AA (%), AAdigesta is the concentration of that
AA in the ileal digesta DM, AAfeed is the AA concentration of that AA in the feed DM, Crfeed is
the chromium concentration in the feed DM, and Crdigesta is the chromium concentration in the
ileal digesta DM. The AID for CP will also be calculated using this equation.
The basal endogenous flow to the distal ileum of each AA was be determined based on
the flow obtained after feeding the N-free diet using equation [2] (Stein et al., 2007):
(
) [2]
where IAAend is the basal ileal endogenous loss of an AA (mg per kg DMI). The basal ileal
endogenous loss of CP was determined using the same equation.
By correcting the AID for the IAAend of each AA, standardized ileal digestibility (SID)
values of AA were calculated using equation [3] (Stein et al., 2007):
[3]
where SIDAA is the SID value (%) of each AA. The SID for AA was also calculated using the
same equation.
The Proc UNIVARIATE procedure of SAS was used to identify outliers (SAS Institute
Inc., Cary, NC). Data were analyzed using the Proc MIXED procedure of SAS. An analysis of
variance was conducted with diet as fixed effects and pig and period as random effects. When
significant differences were detected, treatment means were separated using the Least Significant
Difference test in Proc MIXED. The pig was the experimental unit for all analyses and an alpha
value of 0.05 was used to assess significance among treatments.

56
Energy Digestibility and Concentration, Exp. 2
Diets, Animals, and Experimental Design. Eight diets were formulated (Tables 4.4 and 4.5).
Seven of the diets contained 1 of the SBM and corn. The last diet was a corn diet that did not
contain any SBM. Corn and SBM were the exclusive sources of energy for these diets. Vitamins
and minerals were included in all diets to meet or exceed current requirement estimates (NRC,
1998).
A total of 48 growing barrows (initial BW: 36.3±3.2 kg) was obtained from the Swine
Research Center. Pigs were placed in metabolism cages equipped with a feeder and a nipple
drinker. The experiment was conducted as a randomized complete block design with 8 diets and
6 replications per diet.
Feeding and Sample Collection. The quantity of feed provided per pig daily was calculated as 3
times the estimated requirement for maintenance energy (i.e., 106 kcal ME per kg0.75
; NRC,
1998) and divided into 2 equal meals that were fed at 0700 h and 0400 h. Water was available at
all times. The experiment lasted 12 d. The initial 5 d was considered an adaptation period to the
diet, while urine and fecal materials were collected during the next 5 d according to standard
procedures using the marker to marker approach (Adeola, 2001). Urine was collected in urine
buckets over a preservative of 40mL of 6 N HCl. Fecal samples and 20% of the collected urine
were stored at -20ºC immediately after collection. At the conclusion of the experiment, urine
samples were thawed and mixed within animal and diet, and a subsample was taken for chemical
analysis.
Sample Analysis and Data Processing. Fecal samples were dried in a forced air oven and finely
ground prior to analysis. Fecal, urine, diet, and ingredient samples were analyzed in duplicate for
GE using bomb calorimeter (Model 6300, Parr Instruments, Moline, IL). Diets and ingredients

57
were also analyzed for DM, CP, and AEE as explained for Exp. 1. Following chemical analysis,
total tract digestibility values were calculated for energy using procedures previously described
(Stein et al., 2004). The quantities of energy lost in the feces and urine were calculated as well,
and the DE and ME in each of the 8 diets were calculated (Stein et al., 2004). The amounts of
DE and ME that were contributed by corn to the 7 diets containing SBM were then subtracted
from the DE and ME in each of these diets. This allowed for the calculation of the DE and ME in
each source of SBM, using the difference procedure as described by Adeola (2001). Data were
analyzed as explained for Exp. 1 using the PROC MIXED procedure of SAS (SAS Institute Inc.,
Cary, NC).
RESULTS
Amino Acid Digestibility, Exp. 1
The AID and SID of CP and all AA were greater (P < 0.01) in SBM than in all the
expeller meals (Tables 4.6 and 4.7). Among the cold pressed meals, the ESBM-CV had less (P <
0.01) AID and SID of CP and all AA compared with ESBM-LT and ESBM-ULT, but all values
for ESBM-ULT were greater (P < 0.01) than the values for ESBM-LT.
The AID and SID of CP was not different in the heat treated sources of ESBM-CV,
ESBM-LT, and ESBM-ULT compared with the cold pressed sources. However, for most AA,
the heat treated ESBM-CV and ESBM-LT had greater (P < 0.01) AID and SID values than the
cold pressed. In contrast, the AID and SID values for AA were not different in the heat treated
ESBM-ULT compared with the cold pressed source of ESBM-ULT.

58
Energy Digestibility, Exp. 2
The intake of GE was less (P < 0.01) in pigs fed the SBM diet than in pigs fed the
ESBM-LT, ESBM-CV-H, and ESBM-LT-H diets; however, the intake of GE in pigs fed the
diets containing the cold-pressed sources of ESBM-CV, ESBM-ULT, and ESBM-ULT H was
not different from the intake of the diets in which the heated sources of these meals were used
(Table 4.8). Fecal excretion of GE and the ATTD of GE were not different among diets. Urine
excretion of GE was greater (P < 0.01) from pigs fed the ESBM-LT diet than from pigs fed the
ESBM-ULT diet, but pigs fed the corn diet had the least (P < 0.01) urine excretion of GE. Diet
DE values were greater (P < 0.01) for diets containing cold pressed ESBM-LT or heated ESBM-
ULT or ESBM-LT compared with diets containing cold pressed ESBM-CV, SBM, or corn. The
ME was greater (P < 0.01) in the diet containing heated ESBM-LT than in the diets containing
ESBM-CV (cold pressed or heated), SBM, or corn, and the diets containing heat treated ESBM-
CV also had a greater (P < 0.01) ME than diets containing corn or SBM.
The DE in both the cold pressed and the heated sources of ESBM-ULT and ESBM-LT
were greater than in corn and SBM both on a DM-basis and on an as-fed basis (Table 4.9). On an
as-fed basis, ESBM-CV also had greater (P < 0.01) DE than corn and SBM, and on a DM-basis,
the ESBM-CV had a greater DE than corn. On an as-fed basis, there were no differences
between ESBM-ULT and ESBM-LT, regardless of the processing procedure used. However, on
a DM basis, ESBM-LT had a greater (P < 0.01) DE than ESBM-ULT, but that was not the case
for the heated sources of ESBM-LT and ESBM-ULT.
Values for ME on an as-fed basis were greater (P < 0.01) for ESBM-LT and ESBM-
ULT-H than in ESBM-CV, SBM, and corn, and the ME of the heated ESBM-CV was also
greater than in corn and SBM, whereas the ME of cold pressed ESBM-CV was greater (P <

59
0.01) only compared with corn. When calculated on a DM basis, the ME in ESBM-ULT and
ESBM-LT-H were greater (P < 0.01) than in corn, but only cold pressed ESBM-LT and heated
ESBM-ULT had a greater (P < 0.01) ME than ESBM-CV and SBM.
DISCUSSION
Composition
The concentration of CP and fat in conventional SBM was close to expected values
compared with previous experiments (Goebel and Stein, 2011; Baker et al., 2010) in which
toasted conventional SBM has been used. However, the concentration of Lys was less in the
source of SBM used in this experiment than in previous experiments. The concentration of fat in
all the expeller SBM used in this experiment was greater than in conventional SBM, which was
expected because mechanical extraction is less efficient in fat removal compared with hexane
extraction. In terms of trypsin inhibitor concentration, measured in TIU/mg, ESBM-CV was
greater than any other SBM, which is in agreement with values from Goebel and Stein (2011).
The TIU value in conventional SBM was low as expected, due to the toasting that is used after
hexane extraction. Trypsin inhibitor concentrations in the cold pressed ESBM-ULT and ESBM-
LT were much less than in ESBM-CV, which clearly indicates that the genetic selection for low
trypsin inhibitor concentrations in soybeans was successful in reducing trypsin inhibitor
concentrations. However, the trypsin inhibitor concentrations in the heated sources of ESBM-
CV, ESBM-ULT, and ESBM-LT were not reduced as much as expected compared with values
for the cold-pressed sources of these meals. It was expected that the heat treatment would result
in TIU values that were close to the value in SBM as was achieved in our previous experiment

60
(Goebel and Stein, 2011). The fact that the TIU values were not reduced by the heat treatment
indicates that the heat treatment was insufficient to inactivate the trypsin inhibitors in the meals.
Amino Acid Digestibility, Exp. 1
The SID of AA and CP in conventional SBM was close to what was expected from
previous experiments (Goebel and Stein, 2011; Baker et al., 2010). The SID of AA and CP in
ESBM-CV was very low due to the high concentration of trypsin inhibitors. The SID of AA and
CP in ESBM-ULT and ESBM-LT was much greater than that of ESBM-CV. This observation
clearly indicates that the genetic selection for reduced concentration of trypsin inhibitors in these
meals has been successful. However, the fact that the SID values of all AA were less in the cold-
pressed sources of both ESBM-ULT and ESBM-LT compared with SBM also demonstrates that
the concentration of trypsin inhibitors in these meals, although much less than in conventional
cold-pressed meal, is not sufficiently reduced to completely negate the negative effects of trypsin
inhibitors on AA digestibility. Although the reduction in the total concentration of trypsin
inhibitors is impressive and only 7 TIU were measured in the cold pressed source of ESBM-
ULT, this level was able to suppress the SID of most AA by 10 to 20 percentage units compared
with the SID of the same AA in SBM. It is, therefore, necessary that the level of trypsin
inhibitors be further reduced if the ULT beans are to be used without heat treatment in the
feeding of pigs. It is, however, surprising that a level of only 7 units of trypsin inhibitors was
able to reduce the SID of AA as much as observed in this experiment. It is, therefore, possible
that the trypsin inhibitors that are left in the LT and the ULT beans are the most inhibiting
trypsin inhibitors, and that the inhibitors that have been eliminated from these beans are the least
inhibitive. However, further research is needed to verify this hypothesis.

61
The fact that the heat treatment of the ESBM was insufficient to reduce the trypsin
inhibitors in the beans prevents us from making a direct comparison between cold-pressed and
adequately heated sources of the same meals. We are, therefore, only able to compared the LT
and ULT meals to conventional toasted SBM.
Energy Digestibility, Exp. 2
The values for DE and ME of corn and conventional SBM that were determined in this
experiment were close to what was expected, which is in agreement with many previous
experiments (NRC, 1998; Baker and Stein, 2009). The DE and ME for all the ESBM-ULT and
ESBM-LT, whether with or without heat treatment, were greater than the DE and ME for
conventional SBM. This was most likely due to much greater concentration of fat in the expeller
SBM than in conventional SBM. The greater DE and ME for ESBM-ULT and ESBM-LT
compared with ESBM-CV were also likely a consequence of the greater concentration of fat in
these meals. The DE and ME values were not affected by trypsin inhibitor concentration in this
experiment. However, trypsin inhibitor levels and fat concentrations were confounded, which
prevents us from making conclusions about the influence of trypsin inhibitors on DE and ME.
Conclusions
Newly selected varieties of soybeans have greatly reduced concentrations of trypsin
inhibitors compared with conventional soybeans. The meal from these low-trypsin inhibitor
varieties contain only 7 to 12 units of trypsin inhibitors, which is believed to reduce or negate the
negative impact of trypsin inhibitors in conventional soybeans. However, results of this present
research indicated that although the SID of AA in low-trypsin inhibitor SBM is much greater
than in un-heated conventional SBM, values are still 10 to 20 percentage units less than the
values obtained for toasted SBM. It is therefore not possible to use these low-trypsin beans in

62
diets fed to pigs without heat treatment. Results of this research also indicated that the only
negative effects of trypsin inhibitors is the reduction in AA digestibility because energy
digestibility does not seem to be affected by the presence of trypsin inhibitors in the meals.
63
LITERATURE CITED
Adeola, L. 2001. Digestion and balance techniques in pigs. Pages 903-916 in Swine Nutrition. A.
J. Lewis, and L. L. Southern, ed. CRC Press, Washington, DC. Swine Nutrition, 2nd
ed.
CRC Press, N. Y.
AOAC International. 2007. Official Methods of Analysis. 18th
ed. Rev 2. W. Howitz, and G. W.
Latimer, Jr., ed. Association of Official Analytical Chemists International, Gaithersburg,
MD.
AOCS. 2006. Official Methods and Recommended Practices of AOCS. 5th
ed. American Oil
Chemists’ Society. Urbana, IL.
Baker, K. M., B. G. Kim, and H. H. Stein. 2010. Amino acid digestibility in conventional, high-
protein, or low-oligosacchride varieties of full-fat soybeans and in soybean meal by
weanling pigs. Anim. Feed Sci. and Technol. 162:66-73.
Baker, K. M., and H. H. Stein. 2009. Amino acid digestibility and concentration of digestible and
metabolizable energy in soybean meal produced from conventional, high-protein, or low-
oligosaccharide varieties of soybeans and fed to growing pigs. J. Anim. Sci. 87:2282-
2290.
Combs, G. E., R. G. Conness, T. H. Berry, and H. D. Wallace. 1967. Effect of raw and heated
soybeans on gain, nutrient digestibility, plasma amino acids and other blood constituents
of growing swine. J. Anim. Sci. 26:1067-1071.
Goebel, K. P., and H. H. Stein. 2011. Digestibility of amino acids in conventional and low-
Kunitz soybean products fed to weanling pigs. Asian-Aust. J. Anim. Sci. 24:88-95.

64
Herkelman, K. L., G. L. Cromwell, A. H. Cantor, T. S. Stahly, and T. W. Pfeiffer. 1993. Effects
of heat treatment on the nutritional value of conventional and low trypsin inhibitor
soybeans for chicks. Poultry Sci. 72:1359-1369.
Janauer, G. A., and P. Englmaier. 1978. Multi-step time program for the rapid gas-liquid
chromatography of carbohydrates. J. Chromatogr. 153:539-542
NRC. 1998. Nutrient requirements of swine. 10th
ed. National Academy Press, Washington DC.
Rackis, J. J. 1972. Biologically active components. Pages 158-202 in Soybeans: Chemistry and
technology. Vol 1, Proteins. A. K. Smith, and S. J. Circle, ed. The AVI Publ. Co. Inc.,
Westport, CT.
Rackis, J. J., J. E. Mcgee, M. R. Gumbmann, and A. N. Booth. 1979. Effects of soy proteins
containing trypsin inhibitors in long term feeding studies in rats. J. Am. Oil. Chem. Soc.
56:162-168.
Sanderson, P. 1986. A new method of analysis of feedingstuffs for the determination of crude
oils and fats. Pages 77-81 in Recent Advances in Animal Nutrition. W. Haresign and D. J.
A. Cole, ed. Butterworths, London, U.K.
Stein, H. H., S. Aref, and R. A. Easter. 1999. Comparative protein and amino acid digestibilities
in growing pigs and sows. J. Anim. Sci. 77:1169-1179.
Stein, H. H., G. Benzoni, R. A. Bohlke, and D. N. Peters. 2004. Assessment of the feeding value
of South Dakota grown field peas (Pisum Sativum L) for growing pigs. J. Anim. Sci.
82:2568-2578.
Stein, H. H., B. Seve, M. F. Fuller, P. J. Moughan, and C. F. M. de Lange. 2007. Invited review:
Amino acid bioavailability and digestibility in pig feed ingredients: Terminology and
application. J. Anim. Sci. 85:172-180.

65
Stein, H. H., C. F. Shipley, and R. A. Easter. 1998. Technical Note: A technique for inserting a
T-cannula into the distal ileum of pregnant sows. J. Anim. Sci. 76:1433-1436.

66
TABLES
Table 4.1. Chemical composition of expeller soybean meal (ESBM) produced from unheated conventional soybeans (ESBM-CV),
unheated ultra-low trypsin inhibitor soybeans (ESBM-ULT), unheated low trypsin inhibitor soybeans (ESBM-LT), heated
conventional soybeans (ESBM-CV-H), heated ultra-low trypsin inhibitor soybeans (ESBM-ULT-H), heated low trypsin inhibitor
soybeans (ESBM-LT-H), and toasted and defatted 47.5% soybean meal (SBM), as-fed basis
Item
Ingredient
ESBM-CV ESBM-ULT ESBM-LT ESBM-CV-H ESBM-ULT-H ESBM-LT-H SBM
DM, % 92.46 94.09 92.20 97.54 93.91 96.60 87.41
GE, kcal/kg 4,797 4,661 4,873 4,647 4,925 5,182 4,155
CP, % 42.97 45.55 42.51 47.41 44.44 45.67 47.22
AEE1, % 11.87 7.89 11.16 7.16 6.18 9.91 1.81
Ca, % 0.32 0.30 0.25 0.30 0.34 0.26 0.40
P, % 0.57 0.56 0.47 0.54 0.62 0.50 0.72
ADF, % 7.35 6.84 5.71 7.50 6.82 6.44 4.81
NDF, % 9.37 9.89 7.99 11.24 10.00 10.15 8.77
Sucrose, % 5.27 5.48 5.73 5.51 5.79 6.85 6.16

67
Table 4.1. (Cont.)
Raffinose, % 0.78 0.68 0.65 0.89 0.77 0.93 0.93
Stachyose, % 4.77 4.36 4.03 4.76 4.76 4.76 5.17
TIU2/mg 36.00 7.70 12.40 21.80 7.50 9.10 2.90
Indispensable AA, %
Arg 3.00 3.27 3.11 3.16 2.97 3.18 3.16
His 1.15 1.25 1.17 1.22 1.14 1.18 1.16
Ile 1.89 2.01 1.84 1.98 1.85 1.90 2.00
Leu 3.12 3.37 3.12 3.32 3.09 3.24 3.41
Lys 2.68 2.82 2.63 2.84 2.56 2.66 2.82
Met 0.54 0.56 0.53 0.58 0.52 0.54 0.61
Phe 2.05 2.28 2.04 2.17 2.01 2.11 2.17
Thr 1.57 1.67 1.58 1.69 1.53 1.61 1.73
Trp 0.61 0.66 0.59 0.68 0.65 0.65 0.72
Val 1.97 2.14 1.94 2.07 1.99 2.03 2.10

68
Table 4.1. (Cont.)
Dispensable AA, %
Ala 1.73 1.86 1.72 1.85 1.71 1.77 1.92
Asp 4.48 4.76 4.44 4.75 4.36 4.57 4.85
Cys 0.56 0.54 0.54 0.60 0.49 0.54 0.63
Glu 7.35 7.86 7.39 7.73 7.14 7.55 7.78
Gly 1.77 1.85 1.72 1.87 1.71 1.77 1.87
Ser 1.86 1.88 1.87 1.96 1.68 1.84 1.97
Tyr 1.50 1.67 1.51 1.59 1.49 1.55 1.64
1AEE = acid hydrolyzed ether extract. 2TIU = trypsin inhibitor units.

69
Table 4.2. Ingredient composition of experimental diets containing expeller soybean meal (ESBM) produced from unheated
conventional soybeans (ESBM-CV), unheated ultra-low trypsin inhibitor soybeans (ESBM-ULT), unheated low trypsin inhibitor
soybeans (ESBM-LT), heated conventional soybeans (ESBM-CV-H), heated ultra-low trypsin inhibitor soybeans (ESBM-ULT-H),
heated low trypsin inhibitor soybeans (ESBM-LT-H), and toasted and defatted 47.5% soybean meal (SBM), as-fed basis, Exp. 1
Ingredient, %
Diet
ESBM-CV ESBM-ULT ESBM-LT ESBM-CV-H ESBM-ULT-H ESBM-LT-H SBM N-Free
ESBM-CV
40.00 - - - - - - -
ESBM-ULT
- 40.00 - - - - - -
ESBM-LT
- - 40.00 - - - - -
ESBM-CV-H
- - - 40.00 - - - -
ESBM-ULT-H
- - - - 40.00 - - -
ESBM-LT-H
- - - - - 40.00 - -
SBM
- - - - - - 40.00 -
Cornstarch 43.20 43.20 43.20 43.20 43.20 43.20 43.20 67.85
Soybean oil 3.60 3.60 3.60 3.60 3.60 3.60 3.60 4.00
Sugar 10.00 10.00 10.00 10.00 10.00 10.00 10.00 20.00

70
Table 4.2. (Cont.)
Solka floc1
- - - - - - - 4.00
Ground
limestone
1.00 1.00 1.00 1.00 1.00 1.00 1.00 0.85
Monocalcium
phosphate
1.10 1.10 1.10 1.10 1.10 1.10 1.10 1.70
Magnesium
oxide
- - - - - - - 0.10
Potassium
carbonate
- - - - - - - 0.40
Chromic oxide 0.40 0.40 0.40 0.40 0.40 0.40 0.40 0.40
Salt 0.40 0.40 0.40 0.40 0.40 0.40 0.40 0.40
Vitamin
mineral
premix2
0.30 0.30 0.30 0.30 0.30 0.30 0.30 0.30

71
Table 4.2. (Cont.)
Total 100.00 100.00 100.00 100.00 100.00 100.00 100.00 100.00
1Fiber Sales and Development Corp., Urbana, OH.
2Provided the following quantities of vitamins and micro minerals per kilogram of complete diet: Vitamin A as retinyl acetate, 11,128 IU; vitamin D3 as cholecalciferol,
2,204 IU; vitamin E as DL-alpha tocopheryl acetate, 66 IU; vitamin K as menadione nicotinamide bisulfite, 1.42 mg; thiamin as thiamine mononitrate, 0.24 mg; riboflavin, 6.58
mg; pyridoxine as pyridoxine hydrochloride, 0.24 mg; vitamin B12, 0.03 mg; D-pantothenic acid as D-calcium pantothenate, 23.5 mg; niacin as nicotinamide and nicotinic acid, 44
mg; folic acid, 1.58 mg; biotin, 0.44 mg; Cu, 10 mg as copper sulfate; Fe, 125 mg as iron sulfate; I, 1.26 mg as potassium iodate; Mn, 60 mg as manganese sulfate; Se, 0.3 mg as
sodium selenite; and Zn, 100 mg as zinc oxide.
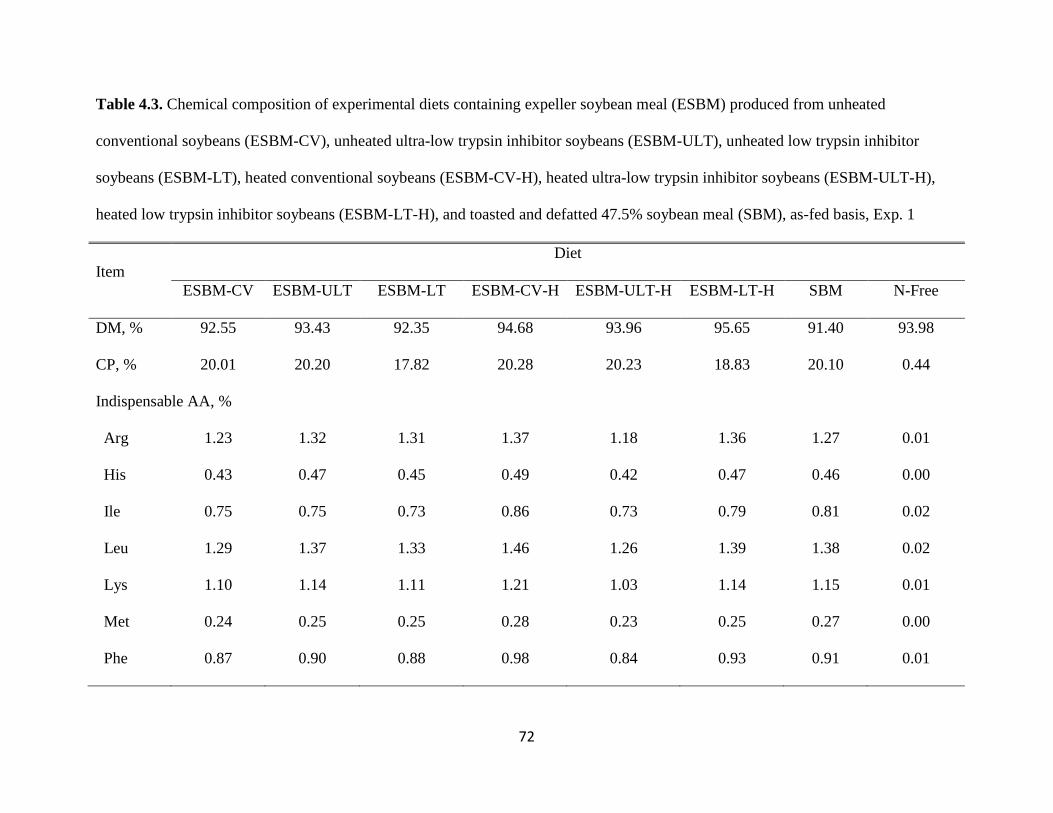
72
Table 4.3. Chemical composition of experimental diets containing expeller soybean meal (ESBM) produced from unheated
conventional soybeans (ESBM-CV), unheated ultra-low trypsin inhibitor soybeans (ESBM-ULT), unheated low trypsin inhibitor
soybeans (ESBM-LT), heated conventional soybeans (ESBM-CV-H), heated ultra-low trypsin inhibitor soybeans (ESBM-ULT-H),
heated low trypsin inhibitor soybeans (ESBM-LT-H), and toasted and defatted 47.5% soybean meal (SBM), as-fed basis, Exp. 1
Item
Diet
ESBM-CV ESBM-ULT ESBM-LT ESBM-CV-H ESBM-ULT-H ESBM-LT-H SBM N-Free
DM, % 92.55 93.43 92.35 94.68 93.96 95.65 91.40 93.98
CP, % 20.01 20.20 17.82 20.28 20.23 18.83 20.10 0.44
Indispensable AA, %
Arg 1.23 1.32 1.31 1.37 1.18 1.36 1.27 0.01
His 0.43 0.47 0.45 0.49 0.42 0.47 0.46 0.00
Ile 0.75 0.75 0.73 0.86 0.73 0.79 0.81 0.02
Leu 1.29 1.37 1.33 1.46 1.26 1.39 1.38 0.02
Lys 1.10 1.14 1.11 1.21 1.03 1.14 1.15 0.01
Met 0.24 0.25 0.25 0.28 0.23 0.25 0.27 0.00
Phe 0.87 0.90 0.88 0.98 0.84 0.93 0.91 0.01

73
Table 4.3. (Cont.)
Thr 0.65 0.70 0.67 0.73 0.63 0.70 0.69 0.01
Trp 0.21 0.25 0.21 0.26 0.22 0.21 0.23 0.03
Val 0.78 0.81 0.78 0.90 0.77 0.84 0.86 0.01
Dispensable AA, %
Ala 0.75 0.79 0.77 0.84 0.73 0.79 0.79 0.02
Asp 1.91 2.03 1.98 2.15 1.83 2.06 2.03 0.02
Cys 0.24 0.23 0.24 0.27 0.21 0.23 0.26 0.00
Glu 3.01 3.21 3.16 3.35 2.94 3.26 3.12 0.06
Gly 0.74 0.77 0.75 0.83 0.71 0.78 0.77 0.01
Ser 0.80 0.87 0.85 0.89 0.75 0.86 0.81 0.01
Tyr 0.57 0.56 0.58 0.63 0.54 0.58 0.60 0.01
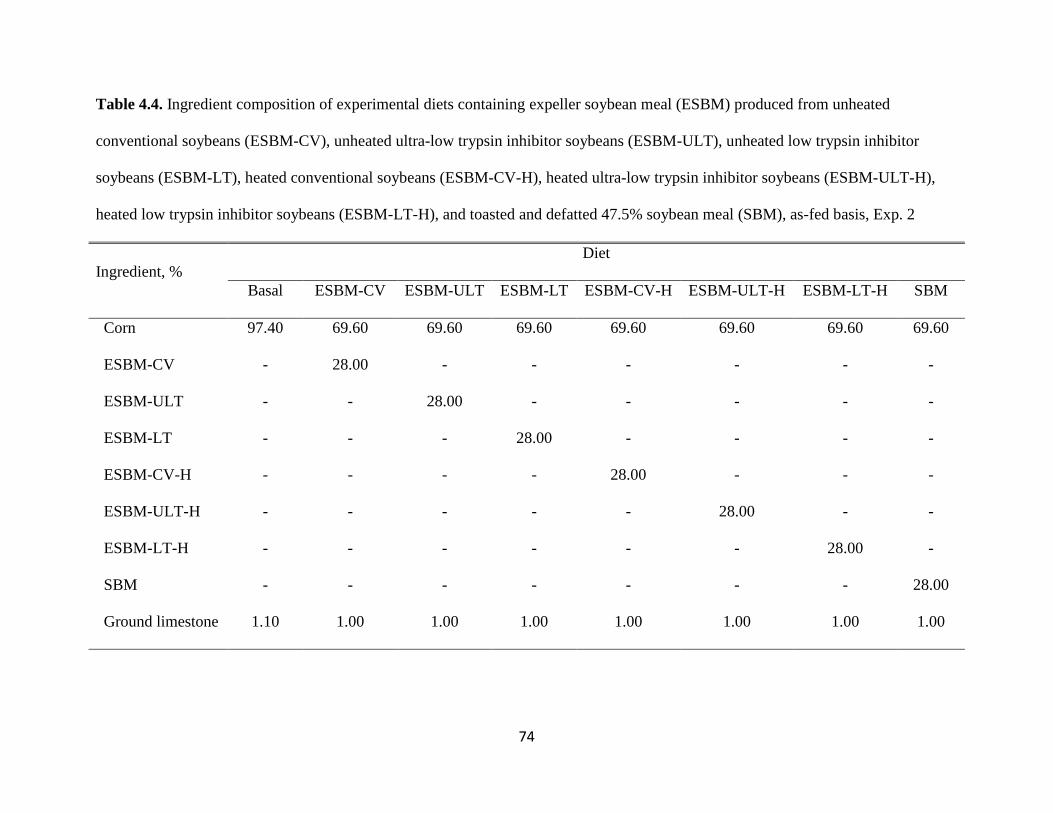
74
Table 4.4. Ingredient composition of experimental diets containing expeller soybean meal (ESBM) produced from unheated
conventional soybeans (ESBM-CV), unheated ultra-low trypsin inhibitor soybeans (ESBM-ULT), unheated low trypsin inhibitor
soybeans (ESBM-LT), heated conventional soybeans (ESBM-CV-H), heated ultra-low trypsin inhibitor soybeans (ESBM-ULT-H),
heated low trypsin inhibitor soybeans (ESBM-LT-H), and toasted and defatted 47.5% soybean meal (SBM), as-fed basis, Exp. 2
Ingredient, %
Diet
Basal ESBM-CV ESBM-ULT ESBM-LT ESBM-CV-H ESBM-ULT-H ESBM-LT-H SBM
Corn 97.40 69.60 69.60 69.60 69.60 69.60 69.60 69.60
ESBM-CV
- 28.00 - - - - - -
ESBM-ULT
- - 28.00 - - - - -
ESBM-LT
- - - 28.00 - - - -
ESBM-CV-H
- - - - 28.00 - - -
ESBM-ULT-H
- - - - - 28.00 - -
ESBM-LT-H
- - - - - - 28.00 -
SBM
- - - - - - - 28.00
Ground limestone 1.10 1.00 1.00 1.00 1.00 1.00 1.00 1.00
75
Table 4.4. (Cont.)
Monocalcium
phosphate
0.80 0.70 0.70 0.70 0.70 0.70 0.70 0.70
Salt 0.40 0.40 0.40 0.40 0.40 0.40 0.40 0.40
Vitamin mineral
Premix1
0.30 0.30 0.30 0.30 0.30 0.30 0.30 0.30
Total 100.00 100.00 100.00 100.00 100.00 100.00 100.00 100.00
1Provided the following quantities of vitamins and micro minerals per kilogram of complete diet: Vitamin A as retinyl acetate, 11,128 IU; vitamin D3 as cholecalciferol,
2,204 IU; vitamin E as DL-alpha tocopheryl acetate, 66 IU; vitamin K as menadione nicotinamide bisulfite, 1.42 mg; thiamin as thiamine mononitrate, 0.24 mg; riboflavin, 6.58
mg; pyridoxine as pyridoxine hydrochloride, 0.24 mg; vitamin B12, 0.03 mg; D-pantothenic acid as D-calcium pantothenate, 23.5 mg; niacin as nicotinamide and nicotinic acid, 44
mg; folic acid, 1.58 mg; biotin, 0.44 mg; Cu, 10 mg as copper sulfate; Fe, 125 mg as iron sulfate; I, 1.26 mg as potassium iodate; Mn, 60 mg as manganese sulfate; Se, 0.3 mg as
sodium selenite; and Zn, 100 mg as zinc oxide.
76
Table 4.5. Chemical composition of experimental diets containing expeller soybean meal (ESBM) produced from unheated
conventional soybeans (ESBM-CV), unheated ultra-low trypsin inhibitor soybeans (ESBM-ULT), unheated low trypsin inhibitor
soybeans (ESBM-LT), heated conventional soybeans (ESBM-CV-H), heated ultra-low trypsin inhibitor soybeans (ESBM-ULT-H),
heated low trypsin inhibitor soybeans (ESBM-LT-H), and toasted and defatted 47.5% soybean meal (SBM), as-fed basis, Exp. 2
Item
Diet
Basal ESBM-CV ESBM-ULT ESBM-LT ESBM-CV-H ESBM-ULT-H ESBM-LT-H SBM
DM, % 89.06 90.23 90.80 90.08 91.61 91.65 91.83 89.36
GE, kcal/kg 3,750 4,040 4,027 4,085 4,028 4,096 4,115 3,891
CP, % 7.76 18.49 19.04 18.42 19.92 19.16 19.15 19.79
AEE1, % 3.17 5.69 4.75 5.79 4.77 5.94 6.29 3.07
1AEE = acid hydrolyzed ether extract.

77
Table 4.6. Apparent ileal digestibility (AID) of CP and AA in expeller soybean meal (ESBM) produced from unheated conventional
soybeans (ESBM-CV), unheated ultra-low trypsin inhibitor soybeans (ESBM-ULT), unheated low trypsin inhibitor soybeans (ESBM-
LT), heated conventional soybeans (ESBM-CV-H), heated ultra-low trypsin inhibitor soybeans (ESBM-ULT-H), heated low trypsin
inhibitor soybeans (ESBM-LT-H), and toasted and defatted 47.5% SBM, Exp. 11
Item
Ingredient
ESBM-CV ESBM-ULT ESBM-LT ESBM-CV-H ESBM-ULT-H ESBM-LT-H SBM SEM P-Value
CP, % 30.36e
64.82b
41.77d
39.52d
62.08b
52.71c
74.70a
4.00 < 0.01
Indispensable AA, %
Arg 36.93e
77.67b
63.17c
53.58d
72.19b
72.60b
89.17a
3.60 < 0.01
His 32.90f
74.37b
58.31d
50.34e
70.08bc
68.25c
83.73a
3.28 < 0.01
Ile 25.78d
64.64b
43.72c
47.30c
61.02b
58.25b
82.33a
3.70 < 0.01
Leu 26.33e
66.15b
45.85d
46.43d
60.64bc
58.75c
82.05a
3.64 < 0.01
Lys 33.47f
74.60b
57.25d
51.90e
69.12c
66.97c
83.31a
2.97 < 0.01
Met 34.02e
72.30b
57.50d
52.27d
68.67bc
65.07c
83.39a
2.89 < 0.01
Phe 27.68d
66.43b
46.49c
47.63c
61.30b
59.99b
82.48a
3.77 < 0.01
Thr 29.92e
63.54b
45.41d
46.68d
59.37bc
57.04c
74.56a
3.23 < 0.01

78
Table 4.6. (Cont.)
Trp 37.96d
70.85b
53.61c
53.79c
66.81b
57.29c
82.97a
2.92 < 0.01
Val 26.18d
63.01b
42.99c
46.20c
58.89b
56.66b
79.90a
3.51 < 0.01
Mean 30.43e
69.44b
51.28d
49.25d
64.50bc
62.68c
82.73a
3.35 < 0.01
Dispensable AA, %
Ala 29.39d
62.77b
45.32c
43.68c
46.63b
56.84b
74.03a
3.72 < 0.01
Asp 34.35e
70.07b
52.45d
50.52d
64.42bc
63.58c
79.22a
3.24 < 0.01
Cys 16.84e
57.70b
33.41d
38.48d
54.50b
46.38c
70.42a
3.73 < 0.01
Glu 42.54e
74.68b
60.97c
54.65d
71.51b
70.42b
80.96a
2.85 < 0.01
Gly 10.44d
49.83ab
27.18c
24.79c
43.24b
40.71b
59.51a
6.35 < 0.01
Ser 38.63e
70.86b
54.55d
52.21d
64.80c
64.89c
81.85a
2.92 < 0.01
Tyr 32.89e
67.03b
50.34d
51.02d
64.05bc
60.78c
82.40a
3.46 < 0.01
Mean 33.28e
38.84b
52.26d
49.39d
64.18bc
62.38c
77.77a
3.49 < 0.01
Total 31.90e
69.13b
51.79d
49.32d
64.33bc
62.53c
80.20a
3.73 < 0.01
a-fMeans within a row lacking a common superscript letter are different (P < 0.05). 1Data are the least square means of 8 observations per treatment.

79
Table 4.7. Standardized ileal digestibility (SID) of CP and AA in expeller soybean meal (ESBM) produced from unheated
conventional soybeans (ESBM-CV), unheated ultra-low trypsin inhibitor soybeans (ESBM-ULT), unheated low trypsin inhibitor
soybeans (ESBM-LT), heated conventional soybeans (ESBM-CV-H), heated ultra-low trypsin inhibitor soybeans (ESBM-ULT-H),
heated low trypsin inhibitor soybeans (ESBM-LT-H), and toasted and defatted 47.5% SBM, Exp. 11
Item
Ingredient
ESBM-CV ESBM-ULT ESBM-LT ESBM-CV-H ESBM-ULT-H ESBM-LT-H SBM SEM P-Value
CP, % 39.53e
73.99b
52.04d
48.78d
71.29b
62.78c
83.72a
4.00 < 0.01
Indispensable AA, %
Arg 41.37e
81.84b
67.33c
57.66d
76.89b
76.75b
93.42a
3.60 < 0.01
His 36.82f
78.00b
62.05d
53.87e
74.16bc
71.96c
87.35a
3.28 < 0.01
Ile 30.28d
69.18b
48.33c
51.31c
65.71b
62.66b
86.44a
3.70 < 0.01
Leu 30.32e
69.94b
49.71d
50.04d
64.78bc
62.58c
85.73a
3.64 < 0.01
Lys 37.39f
78.42b
61.13d
55.55e
73.37bc
70.88c
87.01a
2.97 < 0.01
Met 38.24e
76.39b
61.54d
55.97d
73.15bc
69.26c
87.10a
2.89 < 0.01
Phe 31.39d
70.05b
50.15c
51.00c
65.20b
63.58b
85.98a
3.77 < 0.01
Thr 37.91e
71.03b
53.13d
53.96d
67.74bc
64.70c
81.98a
3.23 < 0.01

80
Table 4.7. (Cont.)
Trp 42.79d
74.94b
58.42c
57.77c
71.48b
62.27c
87.32a
2.92 < 0.01
Val 31.34d
68.02b
48.14c
50.78c
64.20b
61.61b
84.52a
3.51 < 0.01
Mean 35.00e
73.81b
55.74d
53.38d
69.29bc
67.09c
86.96a
3.35 < 0.01
Dispensable AA, %
Ala 38.10d
71.12b
53.79c
51.65c
65.72b
65.39b
82.20a
3.72 < 0.01
Asp 38.23e
73.76b
56.18d
54.05d
68.53bc
67.29c
82.82a
3.24 < 0.01
Cys 24.46e
65.73b
41.02d
45.41d
63.35b
54.60c
77.37a
3.73 < 0.01
Glu 45.87e
77.83b
64.13c
57.71d
74.97b
73.59b
84.13a
2.85 < 0.01
Gly 29.55d
68.38ab
46.00c
42.23c
63.47b
59.45b
77.66a
6.35 < 0.01
Ser 43.95e
75.80b
59.55d
57.11d
70.56c
70.00c
87.04a
2.92 < 0.01
Tyr 37.41e
71.67b
54.77d
55.20d
68.88bc
65.37c
86.64a
3.46 < 0.01
Mean 39.11e
74.42b
57.87d
54.73d
70.33bc
68.03c
83.29a
3.49 < 0.01
Total 37.12e
74.12b
56.84d
54.07d
69.82bc
67.57c
85.09a
3.41 < 0.01
a-fMeans within a row lacking a common superscript letter are different (P < 0.05). 1Data are the least square means of 8 observations per treatment.

81
Table 4.8. Daily energy balance and apparent total tract digestibility (ATTD) of energy of experimental diets containing corn, or corn
and expeller soybean meal (ESBM) produced from unheated conventional soybeans (ESBM-CV), unheated ultra-low trypsin inhibitor
soybeans (ESBM-ULT), unheated low trypsin inhibitor soybeans (ESBM-LT), heated conventional soybeans (ESBM-CV-H), heated
ultra-low trypsin inhibitor soybeans (ESBM-ULT-H), heated low trypsin inhibitor soybeans (ESBM-LT-H), and toasted and defatted
47.5% SBM, as-fed basis, Exp. 21
Item
Diet
Corn
ESBM-
CV
ESBM-
ULT
ESBM-
LT
ESBM-
CV-H
ESBM-
ULT-H
ESBM-
LT-H
SBM SEM P-Value
GE intake, kcal/d 5,350c
5,772ab
5,763ab
5,850a
5,893a
5,760ab
5,938a
5,575bc
167.54 < 0.01
GE in feces, kcal/d 696 768 674 681 734 694 750 681 34.65 0.39
GE in urine, kcal/d 97.92c
228ab
180b
266a
211ab
194ab
214ab
221ab
26.51 < 0.01
ATTD of GE, % 86.96 86.65 88.29 88.40 88.30 87.86 87.34 87.73 0.57 0.19
DE in diet, kcal/kg 3,261d
3,500b
3,556ab
3,611a
3,557ab
3,599a
3,594a
3,413c
22.98 < 0.01
ME in diet, kcal/kg 3,192e
3,339cd
3,429ab
3,424ab
3,380bc
3,463a
3,445ab
3,261de
30.55 < 0.01
a-eMeans within a row lacking a common superscript letter are different (P < 0.05). 1Data are the least square means of 6 observations per treatment.
82
Table 4.9. Concentration of energy in corn and expeller soybean meal (ESBM) produced from unheated conventional soybeans
(ESBM-CV), unheated ultra-low trypsin inhibitor soybeans (ESBM-ULT), unheated low trypsin inhibitor soybeans (ESBM-LT),
heated conventional soybeans (ESBM-CV-H), heated ultra-low trypsin inhibitor soybeans (ESBM-ULT-H), heated low trypsin
inhibitor soybeans (ESBM-LT-H), and toasted and defatted 47.5% SBM, Exp. 21
Item
Diet
Corn
ESBM-
CV
ESBM-
ULT
ESBM-
LT
ESBM-
CV-H
ESBM-
ULT-H
ESBM-
LT-H
SBM SEM P-Value
DE, kcal/kg 3,348d
4,179b
4,377ab
4,575a
4,384ab
4,532a
4,515a
3,869c
78.42 < 0.01
ME, kcal/kg 3,277e
3,778cd
4,101ab
4,084ab
3,926bc
4,220a
4,158ab
3,501de
106.17 < 0.01
DE, kcal/kg DM 3,867e
4,519cd
4,652bc
4,962a
4,495cd
4,826ab
4,674bc
4,427d
83.80 < 0.01
ME, kcal/kg DM 3,785d
4,086bcd
4,359ab
4,430a
4,025cd
4,494a
4,305abc
4,006cd
113.52 < 0.01
a-eMeans within a row lacking a common superscript letter are different (P < 0.05). 1Data are the least square means of 6 observations per treatment.

83
CHAPTER 5
AMINO ACID DIGESTIBILITY IN 4 SOURCES OF FERMENTED SOYBEAN MEAL
AND IN CONVENTIONAL SOYBEAN MEAL AND FISH MEAL FED TO WEANLING
PIGS
ABSTRACT
An experiment was conducted to determine the apparent and standardized ileal digestibility (AID
and SID, respectively) of AA in 4 sources of fermented soybean meal (FSBM) and to compare
these values with the AID and SID of AA in conventional soybean meal (SBM) and fish meal.
The 4 sources of FSBM included FSBM-A, FSBM-B, FSBM-C, and FSBM-D. The conventional
SBM was obtained from the same batch of SBM that was used to produce FSBM-A. The AA
digestibility in each of the 6 protein containing ingredients was determined using 14 weanling
barrows (initial BW: 10.8 kg ± 3.4 kg) that were equipped with a T-cannula in the distal ileum.
Seven diets were formulated. Six diets contained each source of FSBM, SBM, or fish meal as the
sole source of AA and an N-free diet was used to determine basal endogenous losses of AA. Pigs
were allotted to a replicated 7 × 5 Youden square design with 7 diets and 5 periods. Results
indicated that the SID of CP was greater (P < 0.01) in FSBM-C than in FSBM-A, FSBM-B,
SBM, and fish meal, but not different from the SID of CP in FSBM-D. The SID of CP was
greater (P < 0.01) in FSBM-D than in FSBM-A, SBM, and fish meal, but not different from the
SID of CP in FSBM-B. The SID of CP was not different among FSBM-A, FSBM-B, SBM, and
fish meal. The SID of Lys was greater (P < 0.01) in FSBM-C, FSBM-D, and fish meal than in
FSBM-A and FSBM-B, but not different from SBM, but greater (P < 0.01) in SBM than in
FSBM-A. The SID of Lys was also greater (P < 0.01) in FSBM-B than in FSBM-A. The SID of
84
most other indispensable AA was greater (P < 0.05) in FSBM-C than in FSBM-A, FSBM-B,
SBM, and fish meal and the SID of most AA in FSBM-D was greater than in SBM. However,
for most indispensable AA other than Lys, no differences among FSBM-A, FSBM-B, and fish
meal were observed. The SID of the mean of indispensable AA, the mean of the dispensable AA
and for all AA also followed this trend. The Lys:CP ratio was less in FSBM-A and FSBM-B than
in FSBM-C, FSBM-D, and conventional SBM, which indicates that FSBM-A and FSBM-B were
heat damaged during production. It is, therefore, likely that the reason for the relatively low SID
of most AA in FSBM-A and FSBM-B is that the heat used during production of these ingredients
resulted in Maillard reactions and subsequent destruction of Lys and reduction in AA
digestibility.
Key words: amino acids, fermented soybean meal, fish meal, pigs, soybean meal
INTRODUCTION
Conventional soybean meal (SBM) is not well tolerated by young pigs due to the
transient hypersensitivity and allergic reactions caused by the antigens in SBM (Li et al., 1990).
Soybean meal also contains oligosaccharides that can cause decreased digestibility of energy and
reduced growth rate, and may negatively affect fecal consistency in weanling pigs (Liying et at.,
2003). To avoid the allergic reactions caused by SBM in young pigs, animal proteins such as fish
meal are used in starter diets instead of SBM. However, fermentation of conventional SBM can
reduce the concentration of oligosaccharides and possibly the concentration of antigens (Hong et
al., 2004; Cervantes-Pahm and Stein, 2010).
There are several procedures for producing fermented soybean meal (FSBM). These
include enzymatic fermentation and bacterial and/or fungal fermentation, which are used to
85
reduce the concentrations of trypsin inhibitors, oligosaccharides, and other anti-nutritional
components in conventional SBM. One source of FSBM is produced using a proprietary
enzymatic procedure that involves treatment of conventional de-hulled SBM with a mixture of
enzymes and yeast (Goebel and Stein, 2011b). Other fermented SBM products are produced by
bacterial and/or fungal fermentation of conventional SBM, but different bacteria or mixtures of
bacteria are used in the production of these ingredients. Aspergillus oryzae, Bacillus subtilis, and
Lactobacilus acidophilus are examples of bacteria that may be used in the production of FSBM.
Previous research with FSBM has mainly used FSBM-C or FSBM-D. Values for the
apparent ileal digestibility (AID) and the standardized ileal digestibility (SID) of CP and AA in
FSBM-C and FSBM-D have been reported (Cervantes-Pahm and Stein, 2010). However, there
are no data for FSBM-B and FSBM-A and there are no comparative data for the AID and SID of
AA in different sources of FSBM. Therefore, an experiment was conducted to measure the AID
and SID of CP and AA by weanling pigs in 4 sources of FSBM and to compare these values to
the digestibility of CP and AA in conventional SBM and in fish meal.
MATERIALS AND METHODS
General
The experimental protocol for this experiment was reviewed and approved by the
Institutional Animal Care and Use Committee at the University of Illinois. Four sources of
FSBM, 1 source of conventional SBM, and 1 source of fish meal were used in the experiment
(Table 5.1). The 4 sources of FSBM included FSBM-A, FSBM-B, FSBM-C, and FSBM-D.
Conventional SBM and FSBM-A were sourced from the same batch of SBM. Fish meal
(Menhaden Select) was sourced from Omega Protein, Houston, TX. Pigs used in the experiment

86
were sired by G Performer boars (Duroc × Pietrain) that were mated to Fertilis 25 (¾ Landrace,
¼ Large White) females (Genetiporc Inc., Alexandria, MN).
Animals, Housing, and Experimental Design
Fourteen weanling barrows were used in the experiment. Pigs (initial BW: 10.8 kg ± 3.4
kg) had been surgically equipped with a T-cannula in the distal ileum using a procedure adapted
from Stein et al. (1998). Pigs were housed in individual pens with tri-bar stainless steel floors
(1.2 × 1.5 m) in an environmentally controlled room. Pigs were allowed to recover for a 7 d
period following surgery and were then randomly allotted to a replicated 7 × 5 Youden square
design with 7 diets and 5 periods. A feeder and a nipple drinker were installed in each pen.
Diets and Feeding
Seven diets were formulated (Tables 5.2 and 5.3). Six of the diets contained 1 source of
FSBM, conventional SBM, or fish meal and starch, sugar, and oil. The last diet was a N-free diet
that was used to calculate basal endogenous losses of AA and CP. Solka floc (4.0%), magnesium
oxide (0.1%), and potassium carbonate (0.4%) were added to the N-free diet to increase the
concentration of crude fiber, and to prevent deficiency of Mg and K in the diet, respectively.
Vitamins and minerals were included in all diets to meet or exceed current requirement estimates
(NRC, 1998). All diets also contained 0.4% chromic oxide as an indigestible marker. All pigs
were fed once daily at 0700 h at a level of 3 times the estimated maintenance energy requirement
(i.e., 106 kcal of ME per kg 0.75; NRC, 1998). Water was available at all times throughout the
experiment.
Data Recording and Sample Collection
Pig BW were recorded at the beginning and at the end of each period and the amount of
feed supplied each day was recorded. Each experimental period lasted 7 d. The initial 5 d of each

87
period were considered an adaptation period to the diet. On d 6 and 7, ileal digesta were
collected for 8 consecutive h. A 225-mL plastic bag was attached to the cannula barrel with a
cable tie and digesta flowing into the bag were collected as described by Stein et al. (1999). Bags
were removed whenever they were filled with digesta, or at least once every 30 min and
immediately frozen at -20°C to prevent bacterial degradation of the AA in the digesta. On the
completion of 1 experimental period, animals were deprived of feed overnight and the following
morning, a new experimental diet was offered.
Chemical Analysis
At the conclusion of the experiment, ileal samples were thawed, mixed within animal and
diet, and a sub-sample was collected for chemical analyses. A sample of each diet and of each
source of FSBM, SBM, and fish meal was collected as well. Ileal samples were lyophilized and
finely ground prior to chemical analysis. All samples were analyzed in duplicate. Diets,
ingredients, and ileal samples were analyzed for DM, CP, and AA. Diets and ileal samples were
analyzed for chromium as well. Samples were analyzed for DM in a drying oven at 135ºC for 2 h
(Method 930.15; AOAC Int., 2007). Crude protein was analyzed by the combustion method
(Method 990.03; AOAC Int., 2007) using a Rapid N cube apapratus (Elementar Americas Inc.,
Mt. Laurel, NJ). Amino acids were analyzed on an amino acid analyzer using ninhydrin for
postcolum derivatization and norleucine as the internal standard. Prior to analysis, samples were
hydrolyzed with 6 N HCl for 24 h at 110ºC [Method 982.30 E (a, b, c); AOAC Int., 2007].
Chromium was analyzed using an inductive coupled plasma atomic emission spectrometric
method (Method 990.08; AOAC Int., 2007). Ingredient samples were also analyzed for trypsin
inhibitors (method Ba 12-75; AOCS, 2006), ADF (Method 973.18; AOAC Int., 2007), NDF
(Holst, 1973), P and Ca (Method 975.03; AOAC Int., 2007), and for sucrose, stachyose, and

88
raffinose (Janauer and Englmaier, 1978). Ingredient samples were also analyzed for acid-
hydrolyzed ether extract by acid hydrolysis using 3N HCl (Sanderson, 1986) followed by crude
fat extraction with petroleum ether (method 2003.06; AOAC Int., 2007) on a Soxtec 2050
automated analyzer (FOSS North America, Eden Prairie, MN).
Calculations and Statistical Analysis
Apparent ileal digestibility values for CP and AA in samples obtained from feeding the 6
diets containing FSBM, SBM, or fish meal were calculated. Because the FSBM, SBM, and fish
meal were the only feed ingredients contributing CP and AA to each diet, these digestibility
values also represent the digestibility values for each source of FSBM, SBM, and fish meal. AID
values of AA were calculated using equation [1] (Stein et al., 2007):
(
) (
) [1]
where AIDAA is the apparent ileal digestibility of an AA (%), AAdigesta is the concentration of that
AA in the ileal digesta DM, AAfeed is the AA concentration of that AA in the feed DM, Crfeed is
the chromium concentration in the feed DM, and Crdigesta is the chromium concentration in the
ileal digesta DM. The AID for CP will also be calculated using this equation.
The basal endogenous flow to the distal ileum of each AA was determined based on the
flow obtained after feeding the N-free diet using equation [2] (Stein et al., 2007):
(
) [2]
where IAAend is the basal ileal endogenous loss of an AA (mg per kg DMI). The basal ileal
endogenous loss of CP was determined using the same equation.
By correcting the AID for the IAAend of each AA, SID values of AA were calculated
using equation [3] (Stein et al., 2007):
89
[3]
where SIDAA is the SID value (%) of each AA. The SID for AA was also calculated using the
same equation.
The Proc UNIVARIATE procedure of SAS was used to identify outliers (SAS Institute
Inc., Cary, NC). Data were analyzed using the Proc MIXED procedure of SAS. An analysis of
variance was conducted with diet as fixed effects and pig and period as random effects. When
significant differences were detected, treatment means were separated using the Least Significant
Difference test in Proc MIXED. The pig was the experimental unit for all analyses and an alpha
value of 0.05 was used to assess significance among treatments.
RESULTS
The AID of CP was greater (P < 0.05) in FSBM-C than in FSBM-A, FSBM-B, SBM, and
fish meal, but not different from the AID in FSBM-D (Table 5.4). The AID of CP was greater (P
< 0.05) in FSBM-D than in SBM and fish meal, but not different from FSBM-A and FSBM-B.
There was no difference in the AID of CP among FSBM-A, FSBM-B, SBM, and fish meal. The
AID of Lys was greater (P < 0.05) in FSBM-D than in FSBM-A, FSBM-B, and SBM, but not
different from FSBM-C and fish meal and the AID of Lys was greater (P < 0.05) in FSBM-C
and fish meal than in FSBM-A and FSBM-B, but not different from SBM. The AID of Lys was
also greater (P < 0.05) in SBM than in FSBM-A, but not different from FSBM-B and the AID of
Lys was greater (P < 0.05) in FSBM-B than in FSBM-A. The AID of the mean of indispensable
AA was greater (P < 0.05) in FSBM-C than in FSBM-A, FSBM-B, SBM, and fish meal, but not
different from FSBM-D. The AID of the mean of indispensable AA was also greater (P < 0.05)
in FSBM-D than in FSBM-A, SBM, and fish meal, but not different from FSBM-B, but the AID

90
was greater (P < 0.05) in FSBM-B than in SBM and not different from FSBM-A and fish meal.
The AID of the mean of the indispensable AA was also greater (P < 0.05) in FSBM-A than in
SBM, but not different from fish meal and no difference between fish meal and SBM was
observed. The AID of the mean of dispensable AA was greater (P < 0.05) in FSBM-C than in
FSBM-A, FSBM-B, SBM, and fish meal, but not different from FSBM-D. The AID of the mean
of dispensable AA was also greater (P < 0.05) in FSBM-D than in SBM and fish meal, but not
different from FSBM-A and FSBM-B. The AID of the mean of dispensable AA was greater (P <
0.05) in FSBM-A than in fish meal, but not different from FSBM-B and SBM and no difference
among FSBM-B, SBM, and fish meal was observed.
The AID of all AA was greater (P < 0.05) in FSBM-C than in FSBM-A, FSBM-B, SBM,
and fish meal, but not different from FSBM-D and the AID was greater (P < 0.05) in FSBM-D
than in FSBM-B, SBM, and fish meal, but not different from FSBM-A. The AID of all AA was
also greater (P < 0.05) in FSBM-A than in fish meal, but not different from FSBM-B and SBM,
but no difference among FSBM-B, SBM, and fish meal was observed.
The SID of CP was greater (P < 0.05) in FSBM-C than in FSBM-A, FSBM-B, SBM, and
fish meal, but not different from FSBM-D, and the SID of CP was greater (P < 0.05) in FSBM-D
than in FSBM-A, SBM, and fish meal, but not different from FSBM-B (Table 5.5). The SID of
CP was not different among FSBM-A, FSBM-B, SBM, and fish meal. The SID of Lys was
greater (P < 0.05) in FSBM-C, FSBM-D, and fish meal than in FSBM-A and FSBM-B, but not
different from SBM, but greater (P < 0.01) in SBM than in FSBM-A. The SID of Lys was also
greater (P < 0.05) in FSBM-B than in FSBM-A. The SID of most other indispensable AA was
greater (P < 0.05) in FSBM-C than in FSBM-A, FSBM-B, SBM, and fish meal and the SID of
most AA in FSBM-D was greater than in SBM. However, for most indispensable AA other than

91
Lys, no differences among FSBM-A, FSBM-B, and fish meal were observed. The SID of the
mean of indispensable AA, the mean of the dispensable AA and for all AA also followed this
trend.
DISCUSSION
All ingredients had DM concentration greater than 90%, except conventional SBM at
87%, which is in accordance with previous experiments (Hong et al., 2004; Cervantes-Pahm and
Stein, 2010; Kim et al., 2010). The concentration of CP in the 4 sources of FSBM varied among
sources with FSBM-A, FSBM-B, FSBM-C, and FSBM-D containing 57.52, 53.16, 58.08, and
56.83%, respectively. Most of the FSBM used in this experiment contained slightly more CP
than the sources used in previous experiments (Hong et al., 2004; Cervantes-Pahm and Stein,
2010; Kim et al., 2010). Conventional SBM contained 49.95% CP and fish meal contained
61.69% CP. The fat concentration among the 4 sources of FSBM ranged between 0.7 and 2.0%,
whereas conventional SBM contained 2.13% fat and fish meal contained 8.01% fat. The ash
concentration among different sources of FSBM was fairly similar at 6 to 7%, whereas fish meal
contained 23.10% ash. The concentrations of sucrose, oligosaccharide, and trypsin inhibitors
were less in each of the 4 sources of FSBM than in conventional SBM. This observation is in
accordance with previous research that indicated that the fermentation process, whether
enzymatic or bacterial, reduces the antinutritional factors in conventional SBM (Hong et al.,
2004; Cervantes-Pahm and Stein, 2010).
The SID of AA in the conventional SBM that was used in this experiment was less than
what has been observed in previous experiments using weanling pigs (Baker et al., 2010;
Cervantes-Pahm and Stein, 2010). The main reason for this observation is most likely that this

92
particular source of SBM was not correctly heat treated following solvent extraction, which is
indicated by the high concentration of Trypsin inhibitors. A concentration of trypsin inhibitors
greater than 4 per mg is believed to reduce AA digestibility (Goebel and Stein, 2011a) and the
concentration of trypsin inhibitors in the sample used in this experiment was almost twice this
level. It is, therefore, not surprising that the SID of most AA in the SBM was less than what has
been previously reported.
The fish meal that was used in the experiment contained more ash and less CP and AA
than most other sources of fish meal (NRC, 2012). Fish meal is produced from defatted and
dehydrated fish and offal from the fish industry including fish bones from the fish filet industry.
The high ash content in the fish meal used in this experiment indicates that the concentration of
fish bones was greater compared with products used in previous experiments, which also
explains the reduced concentration of CP and AA. The SID of most AA in the fish meal used in
this experiment was, however, in good agreement with data from previous experiments (NRC,
2012).
The SID of AA in FSBM-C was in agreement with data from a previous experiment
(Cervantes-Pahm and Stein, 2010), and the SID of AA in FSBM-D is close to values reported by
Rojas and Stein (2011). The reason for the increased SID of indispensable AA in FSBM-C and
FSBM-D compared with the other feed ingredients is most likely that the process used to
produce these 2 ingredients does not destroy any AA via overheating.
The SID of Lys was more variable among the different sources of FSBM than the SID of
other AA. The reason for this observation is most likely that FSBM-A and FSBM-B were heat
damaged during production. It is generally believed that a Lys:CP ratio above 6.0% is indicative
of non-heat damaged SBM, whereas a ratio less than 6.0% indicates that the sample was heat

93
damaged and that the Maillard reaction destroyed some of the Lys (Gonzalez-Vega et al., 2011).
The low Lys:CP ratio in FSBM-A and FSBM-B indicates that overheating damaged some of the
Lys during production of these meals. This is specifically true for FSBM-A. In contrast, the
Lys:CP ratio in FSBM-C and FSBM-D were greater than 6.0%, which indicates that these meals
were not heat damaged. Maillard reactions will primarily destroy Lys and reduce the SID of Lys,
but the SID of other AA will also be negatively affected by the Maillard reaction (Gonzalez-
Vega et al., 2011). This is most likely the reason why the SID of most AA in FSBM-A and
FSBM-B were less than in FSBM-C and FSBM-D. The SID of Lys was more negatively affected
than the SID of other AA, which further indicates that FSBM-A and FSBM-B were heat
damaged.
Conclusions
Results of this experiment confirm that fermentation reduces the concentration of
sucrose, oligosaccharides, and trypsin inhibitors in SBM. Results also confirm that AA in
FSBM-C and FSBM-D are well digested by young pigs. However, it appears that the particular
batches of FSBM-A and FSBM-B that were used in this experiment were overheated during
fermentation or drying, which resulted in reduced digestibilities of AA in these meals. The SID
of AA in the conventional SBM that was used in this experiment was less than what has been
reported from previous experiments, which is likely a result of a relatively high concentration of
trypsin inhibitors in the source of SBM that was used.
94
LITERATURE CITED
AOAC International. 2007. Official Methods of Analysis. 18th
ed. Rev. 2. W. Howitz, and G.W.
Latimer, Jr., ed. Association of Official Analytical Chemists International, Gaithersburg,
MD.
AOCS. 2006. Official Methods and Recommended Practices of AOCS. 5th
ed. Association of Oil
Chemists’ Society. Urbana, IL.
Baker, K. M., B. G. Kim, and H. H. Stein. 2010. Amino acid digestibility in conventional, high
protein, or low oligosaccharide varieties of full-fat soybeans and in soybean meal by
weanling pigs. Anim. Feed Sci. Technol. 162:66-73.
Cervantes-Pahm, S. K., and H. H. Stein. 2010. Ileal digestibility of amino acids in conventional,
fermented, and enzyme-treated soybean meal and in soy protein isolate, fish meal, and
casein fed to weanling pigs. J. Anim. Sci. 88:2674-2683.
Goebel, K. P., and H. H. Stein. 2011a. Ileal digestibility of amino acids in conventional and low-
Kunitz soybean products fed to weanling pigs. Asian-Austr. J. Anim. Sci. 24:88-95.
Goebel, K. P., and H. H. Stein. 2011b. Phosphorus and energy digestibility of conventional and
enzyme treated soybean meal fed to weanling pigs. J. Anim. Sci. 89:764-772
Gonzalez-Vega, J. C., B. G. Kim, J. K. Htoo, A. Lemme, and H. H. Stein. 2011. Amino acid
digestibility in heated soybean meal fed to growing pigs. J. Anim. Sci. 89:3617-3625.
Holst, D. O. 1973. Holst filtration apparatus for Van Soest detergent fiber analysis. J. AOAC.
56:1352–1356.
Hong, K. J., C. H. Lee, and S. W. Kim. 2004. Aspergillus oryzae GB-107 fermentation improves
nutritional quality of food soybeans and feed soybeanmeals. J. Med. Food 7:430-436.
Janauer, G. A., and P. Englmaier. 1978. Multi-step time program for the rapid gas-liquid
95
chromatography of carbohydrates. J. Chromatogr. 153:539-542.
Kim, S. W., E. van Heughten, F. Ji, C. H. Lee, and R. D. Mateo. 2010. Fermented soybean meal
as a vegetable protein source for sursery pigs: I. Effects on growth performance of
nursery pigs. J. Anim. Sci. 88:214-224.
Li, D. F., J. L. Nelssen, P. G. Reddy, F. Blecha, J. D. Hancock, G. L. Allee, R. D. Goodband, and
R. D. Klemm. 1990. Transient hypersensitivity to soybean meal in the early weaned pig.
J. Anim. Sci. 68:1790-1799.
Liying, Z., D. Li, S. Qiao, E. W. Johnson, B. Li, P. A. Thacker, and I. K. Han. 2003. Effects of
stachyose on performance, diarrhea incidence and intestinal bacteria in weanling pigs.
Arch. Animal. Nutri. 57:1-10.
NRC. 1998. Nutrient requirements of swine. 10th
ed. National Academy Press, Washington DC.
NRC. 2012. Nutrient requirements of swine. 11th
ed. National Academy Press, Washington DC.
Rojas, O. J., and H. H. Stein. 2011. Phosphorus and amino acid digestibility in fermented and
conventional soybean meal fed to weanling pigs. J. Anim. Sci. 89(E-Suppl. 2):99 (Abstr.)
Sanderson, P. 1986. A new method of analysis of feeding stuffs for the determination of crude
oils and fats. Pages 77-81in Recent Advances in Animal Nutrition. W. Haresign and D. J.
A. Cole, eds. Butterworths, London, U.K.
Stein, H. H., S. Aref, and R. A. Easter. 1999. Comparative protein and amino acid digestibilities
in growing pigs and sows. J. Anim. Sci., 77:1169-1179.
Stein, H. H., B. Seve, M. F. Fuller, P. J. Moughan, and C. F. M. de Lange. 2007. Invited review:
Amino acid bioavailability and digestibility in pig feed ingredients: Terminology and
application. J. Anim. Sci. 85:172-180.

96
Stein, H. H., C. F. Shipley, and R. A. Easter. 1998. Technical Note: A technique for inserting a
T-cannula into the distal ileum of pregnant sows. J. Anim. Sci. 76:1433-1436.

97
TABLES
Table 5.1. Chemical composition of FSBM-A, FSBM-B, FSBM-C, FSBM-D, soybean meal
(SBM), and fish meal, as-fed basis
Item
Ingredient
FSBM-A FSBM-B FSBM-C FSBM-D SBM Fish meal
DM, % 90.92 92.25 92.79 91.51 87.75 91.64
CP, % 57.52 53.16 58.08 56.83 49.95 61.69
AEE1, % 1.17 0.71 1.68 1.86 2.13 8.01
Ca, % 0.36 0.30 0.30 0.33 0.28 7.41
P, % 0.71 0.67 0.76 0.74 0.64 3.98
Ash, % 7.38 6.27 6.29 6.56 5.73 23.10
ADF, % 4.12 4.95 4.42 5.50 4.24 -
NDF, % 18.87 10.27 19.67 7.83 8.65 -
Sucrose, % 0.00 1.46 0.00 0.00 4.19 0.00
Raffinose, % 0.00 0.40 0.00 0.00 0.70 0.00
Stachyose, % 0.00 1.15 0.00 0.00 1.89 0.00
TIU2/mg ND
3 ND
3 1.01 1.60 7.80 ND
3
Indispensable AA, %
Arg 3.81 3.66 4.13 3.85 3.67 3.48
His 1.44 1.34 1.45 1.38 1.29 1.24
Ile 2.72 2.46 2.76 2.63 2.34 2.47
Leu 4.48 4.11 4.53 4.42 3.90 4.13
Lys 3.28 3.16 3.66 3.46 3.17 4.28

98
Table 5.1. (Cont.)
Met 0.81 0.73 0.74 0.79 0.69 1.70
Phe 2.93 2.73 3.05 2.95 2.57 2.32
Thr 2.16 2.00 2.16 2.15 1.92 2.29
Trp 0.80 0.64 0.85 0.79 0.60 0.53
Val 2.89 2.45 2.93 2.80 2.53 2.84
Dispensable AA, %
Ala 2.52 2.36 2.55 2.49 2.21 3.88
Asp 6.42 5.98 6.55 6.34 5.71 5.15
Cys 0.79 0.72 0.71 0.80 0.68 0.47
Glu 10.32 9.27 10.22 9.63 9.23 7.41
Gly 2.41 2.24 2.41 2.43 2.12 4.71
Ser 2.51 2.22 2.44 2.59 2.31 1.94
Tyr 1.98 1.84 2.04 1.97 1.77 1.78
Calculated values
Lys:CP, % 5.70 5.94 6.30 6.08 6.34 6.93
1AEE = acid-hydrolyzed ether extract.
2TIU = trypsin inhibitor units.
3ND = not detected.

99
Table 5.2. Ingredient composition of experimental diets containing FSBM-A, FSBM-B, FSBM-C, FSBM-D, soybean meal (SBM), or
fish meal, as-fed basis
Ingredient, %
Diet
FSBM-A FSBM-B FSBM-C FSBM-D SBM Fish meal N-free
FSBM-A 35.00 - - - - - -
FSBM-B - 38.00 - - - - -
FSBM-C - - 35.00 - - - -
FSBM-D - - - 35.00 - - -
SBM - - - - 40.00 - -
Fish meal - - - - - 32.00 -
Cornstarch
38.30 35.30 38.30 38.30 33.30 46.90 67.50
Soybean oil 3.00 3.00 3.00 3.00 3.00 - 4.00
Sugar 20.00 20.00 20.00 20.00 20.00 20.00 20.00
Solka floc1 - - - - - - 4.00
Ground limestone 1.30 1.30 1.30 1.30 1.30 - 0.50
Monocalcium phosphate 1.30 1.30 1.30 1.30 1.30 - 2.40

100
Table 5.2. (Cont.)
Magnesium oxide - - - - - - 0.10
Potassium carbonate - - - - - - 0.40
Chromic oxide 0.40 0.40 0.40 0.40 0.40 0.40 0.40
Salt 0.40 0.40 0.40 0.40 0.40 0.40 0.40
Vitamin mineral premix2 0.30 0.30 0.30 0.30 0.30 0.30 0.30
Total
100.00 100.00 100.00 100.00 100.00 100.00 100.00
1Fiber Sales and Development Corp., Urbana, OH.
2Provided the following quantities of vitamins and micro minerals per kilogram of complete diet: Vitamin A as retinyl acetate, 11,128 IU; vitamin D3 as cholecalciferol,
2,204 IU; vitamin E as DL-alpha tocopheryl acetate, 66 IU; vitamin K as menadione nicotinamide bisulfite, 1.42 mg; thiamin as thiamine mononitrate, 0.24 mg; riboflavin, 6.58
mg; pyridoxine as pyridoxine hydrochloride, 0.24 mg; vitamin B12, 0.03 mg; D-pantothenic acid as D-calcium pantothenate, 23.5 mg; niacin as nicotinamide and nicotinic acid, 44
mg; folic acid, 1.58 mg; biotin, 0.44 mg; Cu, 10 mg as copper sulfate; Fe, 125 mg as iron sulfate; I, 1.26 mg as potassium iodate; Mn, 60 mg as manganese sulfate; Se, 0.3 mg as
sodium selenite; and Zn, 100 mg as zinc oxide.

101
Table 5.3. Chemical composition of experimental diets containing FSBM-A, FSBM-B, FSBM-C, FSBM-D, soybean meal (SBM), or
fish meal, as-fed basis
Item
Diet
FSBM-A FSBM-B FSBM-C FSBM-D SBM Fish meal N-free
DM, % 93.29 93.70 93.64 93.32 92.70 93.54 93.11
CP, % 20.21 20.10 20.20 20.34 16.99 19.86 0.38
Indispensable AA, %
Arg 1.29 1.44 1.31 1.32 1.06 1.09 0.01
His 0.49 0.53 0.46 0.48 0.37 0.39 0.00
Ile 0.89 0.95 0.83 0.89 0.67 0.78 0.01
Leu 1.54 1.64 1.41 1.56 1.15 1.32 0.03
Lys 1.12 1.25 1.18 1.22 0.94 1.45 0.02
Met 0.26 0.27 0.23 0.27 0.20 0.53 0.00
Phe 1.00 1.07 0.98 1.00 0.77 0.75 0.02
Thr 0.76 0.81 0.71 0.76 0.57 0.73 0.01
Trp 0.25 0.25 0.26 0.26 0.19 0.18 0.04

102
Table 5.3. (Cont.)
Val 0.96 1.03 0.91 0.97 0.67 0.87 0.00
Dispensable AA, %
Ala 0.87 0.96 0.83 0.89 0.65 1.25 0.03
Asp 2.22 2.40 2.12 2.24 1.69 1.09 0.01
Cys 0.29 0.29 0.24 0.27 0.21 0.15 0.01
Glu 3.61 3.78 3.38 3.45 2.68 2.40 0.05
Gly 0.83 0.90 0.79 0.86 0.63 1.51 0.02
Ser 0.93 0.93 0.87 0.90 0.66 0.60 0.01
Tyr 0.63 0.68 0.60 0.63 0.48 0.49 0.01
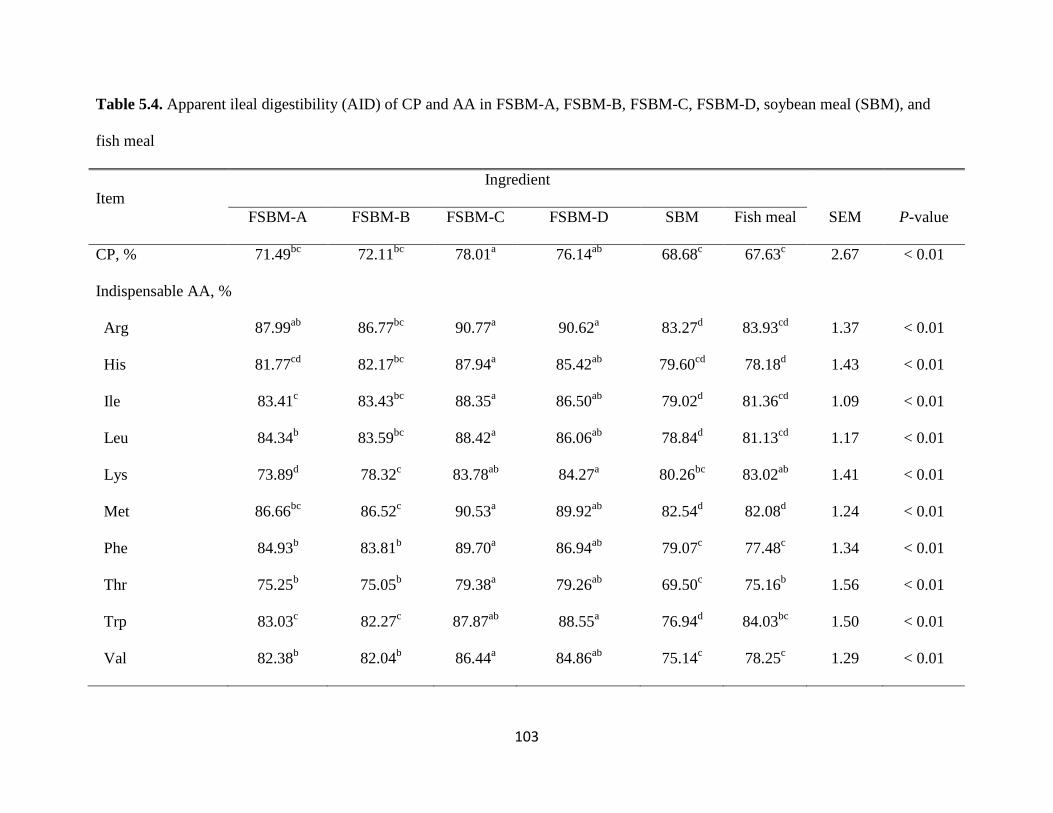
103
Table 5.4. Apparent ileal digestibility (AID) of CP and AA in FSBM-A, FSBM-B, FSBM-C, FSBM-D, soybean meal (SBM), and
fish meal
Item
Ingredient
FSBM-A FSBM-B FSBM-C FSBM-D SBM Fish meal SEM P-value
CP, % 71.49bc
72.11bc
78.01a
76.14ab
68.68c
67.63c
2.67 < 0.01
Indispensable AA, %
Arg 87.99ab
86.77bc
90.77a
90.62a
83.27d
83.93cd
1.37 < 0.01
His 81.77cd
82.17bc
87.94a
85.42ab
79.60cd
78.18d
1.43 < 0.01
Ile 83.41c
83.43bc
88.35a
86.50ab
79.02d
81.36cd
1.09 < 0.01
Leu 84.34b
83.59bc
88.42a
86.06ab
78.84d
81.13cd
1.17 < 0.01
Lys 73.89d
78.32c
83.78ab
84.27a
80.26bc
83.02ab
1.41 < 0.01
Met 86.66bc
86.52c
90.53a
89.92ab
82.54d
82.08d
1.24 < 0.01
Phe 84.93b
83.81b
89.70a
86.94ab
79.07c
77.48c
1.34 < 0.01
Thr 75.25b
75.05b
79.38a
79.26ab
69.50c
75.16b
1.56 < 0.01
Trp 83.03c
82.27c
87.87ab
88.55a
76.94d
84.03bc
1.50 < 0.01
Val 82.38b
82.04b
86.44a
84.86ab
75.14c
78.25c
1.29 < 0.01

104
Table 5.4. (Cont.)
Mean 82.32c
82.36bc
87.17a
86.08ab
78.80d
80.01cd
1.31 < 0.01
Dispensable AA, %
Ala 74.56bc
75.19bc
80.45a
78.44ab
70.26c
71.99c
2.29 < 0.01
Asp 79.56b
78.44bc
83.57a
85.03a
75.98c
71.37d
1.46 < 0.01
Cys 64.93bc
68.79ab
73.47a
73.92a
68.88ab
60.62c
2.38 < 0.01
Glu 80.42b
77.70b
86.65a
82.49ab
79.06b
77.58b
2.05 < 0.01
Gly 59.51a
56.78a
64.42a
64.43a
45.57b
68.08a
4.78 < 0.01
Ser 84.16a
83.78a
85.54a
84.52a
78.40b
70.65c
1.91 < 0.01
Tyr 87.55a
85.94a
89.16a
88.16a
80.15b
76.98b
1.25 < 0.01
Mean 78.00bc
76.58bcd
83.18a
80.42ab
73.87cd
71.50d
2.18 < 0.01
Total AA, % 80.15bc
79.30cd
85.06a
84.16ab
76.41cd
75.65d
1.67 < 0.01
a-dMeans within a row lacking a common superscript letter are different (P < 0.05). 1Data are the least square means of 10 observations per treatment.

105
Table 5.5. Standardized ileal digestibility (SID) of CP and AA in FSBM-A, FSBM-B, FSBM-C, FSBM-D, soybean meal (SBM), and
fish meal1, 2
Item
Ingredient
FSBM-A FSBM-B FSBM-C FSBM-D SBM Fish meal SEM P-value
CP, % 81.77c
84.38bc
90.20a
88.21ab
80.83c
80.02c
2.67 < 0.01
Indispensable AA, %
Arg 93.50ab
91.72bc
96.21a
96.01a
89.93c
90.46bc
1.37 < 0.01
His 86.34b
86.72b
93.17a
90.41a
85.61b
84.35b
1.43 < 0.01
Ile 88.00b
87.89bc
93.45a
91.25a
85.07c
86.79bc
1.09 < 0.01
Leu 88.78bc
87.95bc
93.50a
90.63ab
84.76d
86.55cd
1.17 < 0.01
Lys 78.80c
82.89b
88.63a
88.95a
86.08ab
86.96a
1.41 < 0.01
Met 91.44bc
90.39c
95.07a
93.77ab
88.72c
84.05d
1.24 < 0.01
Phe 89.26b
88.02bc
94.29a
91.42ab
84.67cd
83.47d
1.34 < 0.01
Thr 83.77c
83.58c
89.10a
88.32ab
80.79c
84.60bc
1.56 < 0.01
Trp 88.44b
87.83bc
93.22a
93.87a
84.02c
91.74ab
1.50 < 0.01
Val 87.86bc
87.37bc
92.47a
90.50ab
82.95d
84.56cd
1.29 < 0.01

106
Table 5.5. (Cont.)
Mean 87.51b
87.63b
93.05a
91.64a
85.50b
86.02b
1.31 < 0.01
Dispensable AA, %
Ala 84.27b
84.03b
90.67a
87.94ab
83.18bc
78.77c
2.29 < 0.01
Asp 83.80b
82.15b
87.76a
88.98a
81.51b
76.71c
1.46 < 0.01
Cys 73.43c
77.52bc
84.01a
83.26ab
80.54ab
77.46bc
2.38 < 0.01
Glu 83.83b
81.12b
90.47a
86.23ab
83.64b
82.96b
2.05 0.01
Gly 79.79
75.57
85.81
84.01
72.12
79.26
4.78 0.09
Ser 89.67ab
89.77ab
91.94a
90.68a
86.13b
79.92c
1.91 < 0.01
Tyr 92.06ab
90.37b
94.18a
92.93ab
86.03c
83.12d
1.25 < 0.01
Mean 84.12bc
83.16bc
90.58a
87.48ab
82.03c
79.61c
2.18 < 0.01
Total AA, % 85.83b
85.25b
91.73a
90.49a
83.86b
82.70b
1.67 < 0.01
a-dMeans within a row lacking a common superscript letter are different (P < 0.05). 1Data are the least square means of 10 observations per treatment. 2 Values for SID were calculated by correcting the values for apparent ileal digestibility for the basal ileal endogenous losses. Basal ileal endogenous losses were
determined from pigs fed the N-free diet as (g/kg of DMI) as CP, 22.26; Arg, 0.76; His, 0.24; Ile, 0.44; Leu, 0.73; Lys, 0.59; Met, 0.13; Phe, 0.46; Thr, 0.69; Trp, 0.15; Val, 0.56;
Ala, 0.91; Asp, 1.01; Cys, 0.26; Glu, 1.32; Gly, 1.80; Ser, 0.55; Tyr, 0.30.

107
CHAPTER 6
CONCLUSION
The standardized ileal digestibility (SID) of most AA in de-hulled low-oligosaccharide
full fat soybeans (FFSB-LO), but not in de-hulled high-protein full fat soybeans (FFSB-HP), is
similar to values in de-hulled conventional full fat soybeans (FFSB-CV), which was most likely
due to heat damage. In addition, no significant differences in DE and ME among the 3 sources of
FFSB were observed, which is most likely due to the negation of greater concentration of CP in
FFSB-HP and FFSB-LO by greater concentration of fat in FFSB-CV.
It is not possible to use the low-trypsin inhibitor soybeans without heat treatment, even
with only 7 to 12 units of trypsin inhibitors. It is also concluded that the only negative effects of
trypsin inhibitors is the reduction in AA digestibility because energy digestibility does not seem
to be affected by the presence of trypsin inhibitors in the meals.
Fermentation reduces the concentration of sucrose, oligosaccharides, and trypsin
inhibitors in SBM. Amino acids in only 2 sources of fermented soybean meal (FSBM) used in
the experiment are well digested by young pigs. It appears that the particular batches of other 2
sources of FSBM that were used were overheated during fermentation or drying, which resulted
in reduced digestibilities of AA in these meals.
Therefore, it is concluded that genetic selection in plant breeding could affect the
nutritional quality of soybeans and soybean meal. However, it is also concluded that processing
of soybeans and soybean meal may be more of an importance for the quality of finished product
when fed to pigs.