effects of multi-directional displacement paths on …
TRANSCRIPT

Structural Eng. /Earthquake Eng., JSCE, Vol. 17, No. 1, 69s-85s, 2000 April (J. Struct. Mech. Earthquake Eng., JSCE, No. 647/ I-51)
EFFECTS OF MULTI-DIRECTIONAL DISPLACEMENT
PATHS ON THE CYCLIC BEHAVIOUR OF
RECTANGULAR HOLLOW STEEL COLUMNS
Eiichi WATANABE', Kunitomo SUGIURA2 and Walter 0. OYAWA3
1 Fellow of JSCE, Dr. Eng., Ph. D., Professor, Deptt of Civil Engrg., Kyoto University
(Yoshida-Honmachi, Sakyo-ku, Kyoto, 606-8501, Japan) 2 Member of JSCE, Ph. D., Assoc. Professor, Dept. of Civil Engrg. Systems, Kyoto University, Kyoto, 606-8501
(Yoshida-Honmachi, Sakyo-ku, Kyoto, 606-8501, Japan) 3 Student member of JSCE, M. Sc. (Eng.), Graduate Student, Dept. of Civil Engrg., Kyoto University, Kyoto, 606-8501
(Yoshida-Honmachi, Sakyo-ku, Kyoto, 606-8501, Japan)
The unprecedented damage to steel structures during the Hyogo-ken Nanbu Earthquake not only
prompted the revision of the Japanese seismic code but also emphasized the need for a comprehensive
understanding of seismic response, which in reality is complex and multi-directional, as opposed to the
conventionally assumed urn-directional approach. Thus, this experimental study investigated the effects of
multi-directional load histories on the response of tubular columns widely used in the construction of
elevated highways and building structures. Test results indicate that, in comparison with uniaxial
displacement paths, multi-directional displacement patterns lead to significant degradation of stiffness,
strength and ductility of tubular columns.
Key Words: biaxial bending, non proportional loading, cyclic behaviour, strength, ductility
1. INTRODUCTION
Bridge piers and building columns in Japan have
predominantly been constructed of steel, mostly thin-walled box columns of the cantilever type'. Although these steel structures have performed adequately during the past moderate earthquakes, their vulnerability to severe seismic loads was sadly exposed during the 1995 Hyogo-ken Nanbu Earthquake. The high intensity of this earthquake, one of the largest ever experienced in the world in terms of response spectral value at natural periods of 0. 7-2 seconds, resulted in extensive damage to major infrastructure including, most shockingly, steel bridge structures. During this great earthquake, rectangular hollow steel piers designed according to 1973 or 1980 specification with usually high width to thickness ratio, developed local buckling at web and flange
plates even though they were stiffened by longitudinal
stiffeners and diaphragms. The buckling of the constituent plates may have caused sudden decrease of
bearing capacity in lateral direction after the peak
strength resulting in reduced energy dissipation, and also deterioration of the bearing capacity in the
vertical direction. Further still, the increase in out-of-plane deformations of the stiffened plates
resulted in the corners of the cross-section loosing their straightness, finally causing cracks and
rupture56).
The Hyogo-ken Nanbu Earthquake highlighted the complexity of earthquake excitation and response of
structures, prompting the immediate revision of the Japanese seismic design provisions. Accordingly, the
seismic codes for road and railway bridges have been revised, most recent being that of highway bridges in
December 1996 which has adopted a limit state design
approach which considers elasto-plastic ductility of structures in designing for seismic intensity level
79(69S)

similar to that of the Hyogo-ken Nanbu Earthquake').However, these code revisions only stipulate key requirements for new construction, reconstruction and repair, hence need to be validated and refined by in-depth research findings in order to assure the safety of structures.
A gaping omission from the design codes, not only in Japan but also elsewhere in the world, is the lack of consideration of effects of multi-directional seismic motion. It is a universally accepted fact that earthquake response of structures is complex and random, and is likely to include at least a biaxial lateral response in oblique directions9),10). Further still, it has been recognized that the conventional two dimensional nonlinear dynamic analysis in one lateral direction under constant vertical load or capacity design check performed separately in two orthogonal directions (uniaxial flexure) or superposition of response in the two orthogonal directions analyzed independently, fails to capture some very important features of the actual three dimensional response such as the coupled inelastic response in two lateral directions, and the torsional effects induced by lack of symmetry even under uni-directional seismic motions). As a matter of fact, structural response observed during recent earthquakes has linked some failures to bi-directional load effects, with the most memorable failure being that of the columns of the Imperial County Services building damaged during the 1979 Imperial Valley Earthquake18)19)
Hence, in-depth understanding of the inelastic load-deformation behaviour of rectangular hollow steel columns under cyclic multi-directional load histories is obviously important in seeking enhanced resistance of highway, bridge and building structures to severe seismic excitation and to appraise previous over-simplifications in design. This paper presents experimental response of columns subjected to several types of multi-directional displacement paths.
2. EXPERIMENTATION
(1) Outline of experimental program Studies were conducted on nine identical hollow
steel box columns modeling bridge piers, tested as cantilever columns under constant axial load and each subjected to a different lateral displacement history. The test specimens were fabricated as thin-walled rectangular hollow steel box columns with rounded comers and of size B=15Omm, D=100mm, t=4. 2lmm, length L=881mm and effective height h=853mm as shown in Fig. 1. To prevent cross-sectional distortions
during tests, diaphragms of about 6. 38mm thickness were welded at three spaced locations along the length of the specimens, on the outside since it was not
practically possible to weld on the inside. The test variable investigated i. e. lateral
displacement histories, included cyclic loading in a designated X-direction parallel to the longer side of the box section, a Y-direction parallel to the shorter side of the box section, a linear direction inclined in the Cartesian X-Y axes, a rectangular direction in the X-Y axes, a circular direction in the X-Y axes, a diamond shaped direction in the X-Y axes, and a plus sign shaped direction also in the X-Y axes. In addition, monotonic tests in the X and Y directions were conducted. In testing, each column specimen was subjected to a
constant axial load simulating the weight of superstructure of magnitude P=0. 2P, where P1, is the axial yield load, and lateral cyclic loads in the desired loading path. The displacement paths were of incremental amplitudes namely fractions and multiples of the predicted uniaxial yield displacement 5, , 0 caused by lateral load in the respective X, Y directions, and for each displacement amplitude three cycle tests i. e. three cycles of gradual loading and unloading were conducted. Table 1 gives details of the test program.
Fig. 1 Dimensions of a test specimen (units in mm)
(a) Elevation
(b) Box section
8o(70s)

The uniaxial yield displacement (8y0) for the case of zero axial load was predicted from the equation below, for each of the respective X, Y directions;
S)=Hh313ESI (1)
where the corresponding yield load (H0) is given as
H)o=M o/h=c IJ(Zth) (2)
and M, = yield moment due to lateral load, I= sectional moment of inertia, Zt = distance to extreme fibre from the centre of gravity, h = effective height of specimen, c=yield strength of steel, and ES = modulus of elasticity of steel. Calculated values were
(Syo)x=5. 73mm, (Ho)x=38KN, (byo)Y=8. 58mm and (Ho)Y =30KN.
Table 1 Loading and cycling histories
* Monotonic tests in the X and Y directions for specimens S-Uxm and S-UYm, respectively, were also conducted
8I(7Is)

(2) Selection of paths and cycling histories For a column considered to be in a loaded space
frame, the structural elements are subjected to the concurrent action of two pairs of bending moments and lateral force, axial force and torsion. Among these six components, Takizawa, et al.15) pointed out that the most significant are the two components which correspond to anti-symmetric distribution of bending moments along the member axis, under constant axial force, without torsion. Accordingly, this study selected lateral load histories or paths for investigation. The selected paths were approximate envelopes of several recorded seismic motions of past earthquakes e. g. Hyogo-ken Nanbu and Tokachi-oki Earthquakes (see Fig. 2). It is acknowledged that actual seismic motion is rather complicated and random, however the paths selected represent the gross characteristics of these complex motions, hence a worthy and valid representation essential for structural analysis and design. Similar paths have also been identified by
previous researchers mainly working in the line of reinforced concrete structuresl The cycling history adopted i. e. 3 cycles at each amplitude was as
per the recommendations of European standards, whereupon the amplitudes were factors and multiples of the yield displacement with the initial closer values of 1/2, 1 and 2/- being implemented in order
to capture currently used biaxial yield surfaces, at 450 inclination as is illustrated in Fig. 3.
(3) Test setup and loading A newly developed multi-directional structure
testing system with servo-controlled hydraulic actuators, jointly developed by Kyoto University and Shimadzu Corporation of Japan, was used in testing the specimens (see Fig, 4). This new six-degree-of-freedom testing system has nine hydraulic actuators (only some are shown in Fig. 4 for clarity), fitted with in-built load cells and LVDTs, with the ability to apply linear or coupling loads in six directions, viz, linear loads along each of the X Y-Z axes as well as rotational moments about each of the X-Y-Z axes. All the actuators have a capacity of 10 tonnes, with the exception of the vertical actuator in the Z direction, which has a capacity of 50 tonnes in compression and 30 tonnes in tension. In addition, the stroke is +1-100mm and the rotation is also +/-10. 3(degree).
A specimen for test, having four strain gages pasted at the corners of each of the plates forming the box, was securely clamped within the loading head and reaction frame of the testing system by bolting on to
the end plates. Angle plates for holding external linear variable displacement transducers (LVDT) were then securely fixed at appropriate rigid parts of the specimen, subsequent to which a total of six LVDTs were fixed and alligned accordingly. Out the six LVDTS, two were for displacement measurement in the lateral X and Y directions, and the remaining four were for the determination of curvature in the most stressed bottom portion of the specimen. Prior
Fig. 2 Seismic motion recorded during the Hyogoken-Nanbu and
Tokachi-oki Earthquakes
(a) Kobe record
(b) Hachinohe record
Fig. 3 Displacement paths similar to likely biaxial yield surfaces
82(72s)

check-up tests on the system indicated that in-built transducers in the actuators had accrued errors emanating from gaps and rotations in machine joints, hence the external LVDTs gave the required displacements.
After fixing and setting-up the specimen in the testing machine, lateral cyclic loads in the relevant displacement path and cycling history, under constant axial force, was applied quasi-statically through displacement control as ordered by computer. In each cycle, the load was applied gradually until the
pre-determined maximum displacement and then unloaded, followed by a similar process in the opposite direction. As testing progressed, load and displacement readings were intermittently recorded using a computer, and testing ended when load resistance of the specimen deteriorated to a level near zero, as indicated by on-line computer monitoring, and further confirmed by the observed damage on the specimen. A special and important feature noted for this testing
system was the simultaneous control of all the nine actuators as loading progressed. Particulary, various settings had to be implemented to ensure that erratic loading was not imposed by the redundant actuators.
(4) Material properties Fundamental material properties for the steel were
determined from tensile tests on strips cut from different parts of the plates forming the steel box. Further, compressive stub column test on a short box section was conducted, while monitoring the variations in load, central strains in the planes and overall axial shortening.
Fig. 5 and Table 2 provide the determined material
properties and typical stress-strain curves for both tensile coupon test and the compressive stub column test. The abbreviations as, sS, and vs stand for the ultimate strength, yield strain and Poisson's ratio of steel, respectively. From the Fig. 5, a sudden divergence of the two graphs occurs as the inelastic range is approached. This is a clear case of difference in failure mode; the stub column has premature failure instigated by buckling of the plates forming the box, as was observed during the test. On the other hand the tensile strips attain their expected deformation characteristics and do not exhibit a definite yield
plateau as is usually observed for mild steel. Fracture failure of the tensile strips is instigated by necking. As
given by both Table 2 and Fig. 5 the strength and ductility of thin-walled structural members under tension is considerably higher than the compressive strength and ductility, clearly demonstrating the
potential catastrophic effect of inelastic local plate buckling. The buckling of the plates appeared in the form of two wider opposite plates folding outwards, and the other two narrower plates folding inwards. When the strength of a structural member deteriorates by local a buckling, the deformation of the member is localized in the local buckling zone, implying that the member has a limited plastic deformation capacity. Since contemporary steel structures are characterized by the use of thin plates susceptible to local buckling, current design codes emphasize that due consideration must be given to local plate buckling, as well as the coupled interaction with global member buckling22). Ordinarily, the local buckling strength of stub-columns, as determined from simple compression test, is the basis for the evaluation of coupled strength against local and overall buckling23). The stub test
presents the most extreme condition for local buckling and the post local buckling behaviour, from which fairly conservative estimates may be drawn. At
present, several approximate methods exist for the determination of the local. buckling strength of stub-columns, some of which express the strength as a function of the width-thickness ratio or plate slenderness parameter (R), defined as;
(3)
where a E = elastic buckling stress, b-the plate width,
t=plate thickness, E, =modulus of elasticity,
v=Poisson's ratio and k-the buckling coefficient (4 for
Fig. 4 Multi-directional testing system, with a total of 9 actuators (only 5 are shown for clarity)
83(73s)

a simply supported plate). In this study, the width-thickness ratio parameter (R) was found to be 0. 53 for the narrower plates and 0. 79 for the wider
plates. Another important design parameter in the design of box-section columns, accounting for global instability, is the column slenderness ratio, given as;
(4)
where r is the radius of gyration of the cross-section. The column slenderness ratio for the tested specimens was 0. 555 for the weaker axis and 0. 405 for the stronger axis.
(5) Residual stresses and initial deformations In recognition of the likely effects of initial
imperfections on structural behaviour, it was deemed necessary to assess the extent and distribution of residual stresses in the column specimens, as well as initial out-of-plane deformations. Residual stress determination was by the sectioning method which involved pasting electrical resistance strain gages spaced 10mm apart circumferentially around a box section specimen and taking initial strain readings, following which steel strips containing each of the
pasted strain gages were cut out of the box section and strains measured again for each of the individual strips. Initial out-of-plane deformations were measured in the two principal axes of the test specimens directly by vernier calipers.
The distribution of residual stresses, determined as the product of modulus of elasticity and the difference between pre-cutting and post-cutting strain readings, is shown in Fig. 6. The pattern depicted is one of low tensile residual stresses at the corners or junctions, and moderate compressive stresses distributed over the central portion of each plate. Compressive residual stresses have an average value of about 0. 28a, with a maximum, which is about 0. 83.. The highest tensile residual stress is only 0. 16.. In approximating initial out-of-plane deformations (a), it was found that the deformations emanating from the longitudinal axis are negligible. However the deformations emanating from the lateral axes were measurable, giving a maximum at the centre of 0. 575mm and 0. 400mm from the two lateral axes, respectively. These two values correspond to t1/b=1/261 and 1/250, respectively, and are within the permissible fabrication tolerance of alb=1/1504.
Table 2 Steel material properties
*Strain at the peak
* *Limit of proportionality
Table 3 Sectional properties
Fig. 5 Typical tensile and compressive Stress-strain curves
for steel strip and stub column, respectively
Fig. 6 Distribution of residual stresses
84(745)

3. RESULTS AND DISCUSSIONS
(1) Hysteretic response The normalized load-displacement curves of the
tested columns, normalized with lateral yield load
(H) and displacement at yield (6) calculated from equations (1) and (2), are presented in Figs. 7-13. The arrow mark pinpoints the ultimate normalized horizontal load. In addition, a summary of the hysteretic response at ultimate points is given in Table 4, which shows the ultimate strength in the designated X and Y directions as well as ductility measure
(u) defined as; m= 6m/8, (5)
a = Sa/6y (6)
where 8m and 6a are the displacements corresponding to the maximum lateral load and its displacement amplitude respectively.
A glance at Figs. 7 and 8 for the uniaxial loading conditions shows that specimen S-UX has higher normalized ultimate and ductility than S-UY as would be expected since loading in the X-direction is resisted with the narrower plates of lower slenderness
parameter (R). A ductility of 1. 62 and 1. 37 are recorded for S-UX and S-UY, respectively. Whereas S-UX could be loaded up to 3 cycles in cycling amplitude 36, x, S-UY could only be loaded up to 1 cycle in cycling amplitude 38, E after which the resistance degenerated towards negative resistance, implying self-unloading of the column. The monotomc loading graphs plotted show a lower ultimate strength, but higher ductility when compared to cyclic loading.
The effects of biaxial load histories are illustrated by comparing Figs. 9, 10, 11, 12 and 13, for either the X component series or the Y component series. A severe reduction in strength and ductility of columns subjected to biaxial loading, when compared to uniaxial loading is promptly recognized especially for the Y component response. Although the uniaxially loaded columns had ultimate strengths above 1. OH0, the biaxially loaded columns had reduced ultimate strengths as low as 0. 68H0 for Y component response. This attests to the coupling effects between the two transverse directions X and Y under biaxial loading. It is interpreted that biaxial loading induces stresses simultaneously in all the four plates forming the steel box section in a similar mode i. e. they are all flange
plates subjected to the extreme stresses at any loading instant. When the maximum stress is attained in the two opposite biaxially loaded slender plates, it would seem that plastic flow occurs whereby additional
stress is redistributed to the other orthogonal plates, which also degrade rapidly due to previously accrued stress. Thus the disintegration of any one plate adversely affects the other plates. The coupling or biaxial effect is most intense in the post ultimate state where a severe softening gradient is noted particularly for the Y component. For example, although the uniaxial response could progress up to a cycling amplitude of 36 with some resistance, the biaxial
paths had positive load resistance only up to 26, E and any attempt to proceed beyond this point resulted in self unloading of the specimen.
Considering only the biaxially loaded columns, it is noted that the response is not uniform indicating that the structural resistance of columns is displacement-path sensitive. The most severe strength and ductility reduction occurs for the biaxial-linear
path (S-BL) and the biaxial-square path (S-BS) where the Y component strength reduces to about 0. 7H0 from about 1. OH, and the ductility reduces to about 1. 0 from 1. 5. It is thought that the severity of S-BL in terms of strength reduction emanates from the in-phase similarity (zero time lag) of the cycling histories of the X and Y components, ensuring that the maximum displacement amplitude always occurs simultaneously for both the X and Y components. In other words, whenever the X displacement increases the Y displacement also increases proportionally, and vice-versa. The other biaxial paths have antagonistic X and Y displacements i. e. they have out-of-phase or time lag difference between the cycling histories of the X and Y components implying that when e. g. the X displacement is increasing the Y displacement is constant, resulting in the attainment of maximum loads at different times for the X and Y components in the elastoplastic state. The severity of these paths will depend on the continuous change of loading directions, causing severe strength degradation. The severity of S-BS could also be attributed to its being the longest
path at each displacement amplitude and also having the largest resultant amplitude among all the paths, since it engulfs or encloses all the other paths. Its hysteretic shapes stand out uniquely from the others with sudden drops or increments in load when the path moves in the direction of the other orthogonal plate.
The biaxial-circular path (S-BC) path is also one of the severest paths and has hysteretic curves that are not very smooth i. e. they have some minor kinks or
jolts, which are caused by the many ramp waves used in the loading program to simulate a circular motion of the test specimen. At each change of ramp wave, elastic unloading takes place, while the testing machine maintains the prescribed displacement for
85(755)
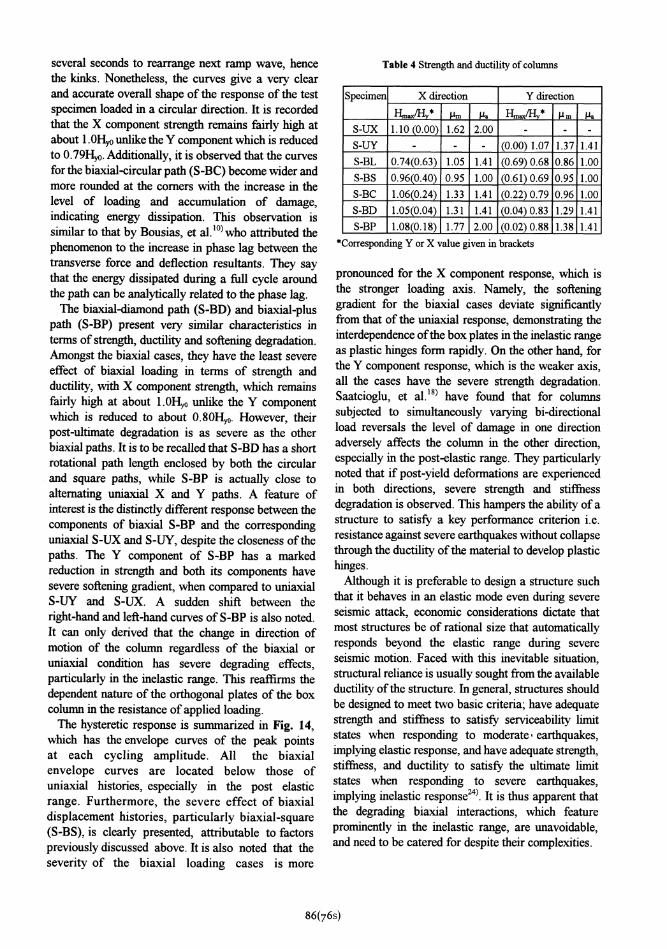
several seconds to rearrange next ramp wave, hence the kinks. Nonetheless, the curves give a very clear and accurate overall shape of the response of the test specimen loaded in a circular direction. It is recorded that the X component strength remains fairly high at about 1. OH unlike the Y component which is reduced to 0. 79H. Additionally, it is observed that the curves for the biaxial-circular path (S-BC) become wider and more rounded at the corners with the increase in the level of loading and accumulation of damage, indicating energy dissipation. This observation is similar to that by Bousias, et al. 10 who attributed the
phenomenon to the increase in phase lag between the transverse force and deflection resultants. They say that the energy dissipated during a full cycle around the path can be analytically related to the phase lag.
The biaxial-diamond path (S-BD) and biaxial-plus
path (S-BP) present very similar characteristics in terms of strength, ductility and softening degradation. Amongst the biaxial cases, they have the least severe effect of biaxial loading in terms of strength and ductility, with X component strength, which remains fairly high at about I. OH, unlike the Y component which is reduced to about 0. 80H 0. However, their
post-ultimate degradation is as severe as the other biaxial paths. It is to be recalled that S-BD has a short rotational path length enclosed by both the circular and square paths, while S-BP is actually close to alternating uniaxial X and Y paths. A feature of interest is the distinctly different response between the components of biaxial S-BP and the corresponding uniaxial S-UX and S-UY, despite the closeness of the
paths. The Y component of S-BP has a marked reduction in strength and both its components have severe softening gradient, when compared to uniaxial S-UY and S-UX. A sudden shift between the right-hand and left-hand curves of S-BP is also noted. It can only derived that the change in direction of motion of the column regardless of the biaxial or uniaxial condition has severe degrading effects,
particularly in the inelastic range. This reaffirms the dependent nature of the orthogonal plates of the box column in the resistance of applied loading.
The hysteretic response is summarized in Fig. 14, which has the envelope curves of the peak points at each cycling amplitude. All the biaxial envelope curves are located below those of uniaxial histories, especially in the post elastic range. Furthermore, the severe effect of biaxial displacement histories, particularly biaxial-square
(S-BS), is clearly presented, attributable to factors previously discussed above. It is also noted that the severity of the biaxial loading cases is more
pronounced for the X component response, which is the stronger loading axis. Namely, the softening
gradient for the biaxial cases deviate significantly from that of the uniaxial response, demonstrating the interdependence of the box plates in the inelastic range as plastic hinges form rapidly. On the other hand, for the Y component response, which is the weaker axis, all the cases have the severe strength degradation. Saatcioglu, et al. g have found that for columns subjected to simultaneously varying bi-directional load reversals the level of damage in one direction adversely affects the column in the other direction, especially in the post-elastic range. They particularly noted that if post-yield deformations are experienced in both directions, severe strength and stiffness degradation is observed. This hampers the ability of a structure to satisfy a key performance criterion i. e. resistance against severe earthquakes without collapse through the ductility of the material to develop plastic hinges. Although it is preferable to design a structure such that it behaves in an elastic mode even during severe seismic attack, economic considerations dictate that most structures be of rational size that automatically responds beyond the elastic range during severe seismic motion. Faced with this inevitable situation, structural reliance is usually sought from the available ductility of the structure. In general, structures should be designed to meet two basic criteria; have adequate strength and stiffness to satisfy serviceability limit states when responding to moderate earthquakes, implying elastic response, and have adequate strength, stiffness, and ductility to satisfy the ultimate limit states when responding to severe earthquakes, implying inelastic response24. It is thus apparent that the degrading biaxial interactions, which feature
prominently in the inelastic range, are unavoidable, and need to be catered for despite their complexities.
Table 4 Strength and ductility of columns
Corresponding Y or X value given in brackets
86(76s)

Fig. 7 Uniaxial-X direction (S-UX) Fig. 8 Uniaxial Y direction (S-UY)
Fig. 9 Normalized lateral load-displacement response in Biaxial-Linear direction (S-BL)(a) X component (a) Y component
Fig. 10 Normalized lateral load-displacement response in Biaxial-Square direction (S-BS)(a) X component (a) Y component
Fig. 11 Normalized lateral load-displacement response in Biaxial-Circular direction (S-BC)
(a) X component (a) Y component
87(775)

(2) Buckling deformations The effects of the different loading histories
investigated could also be observed visually as testing progressed, in the form of local plate buckling deformations as given in Photo 1. The
earliest visible buckling was detected for S-BS at a
cycling amplitude of 1 S o third cycle soon followed by
S-BL at a cycling amplitude of 2 / byo first cycle and
S-BC at a cycling amplitude of 2 / 6, o second cycle.
S-BD and S-BP buckled at the same cycling amplitude
Fig. 12 Normalized lateral load-displacement response in Biaxial-Diamond direction (S-BD)(a) X component (b) Y component
Fig. 13 Normalized lateral load-displacement response in Biaxial-Plus direction (S-BP)(a) X component (b) Y component
Fig. 14 Envelope curves(a) X component (b) Y component
88(78s)
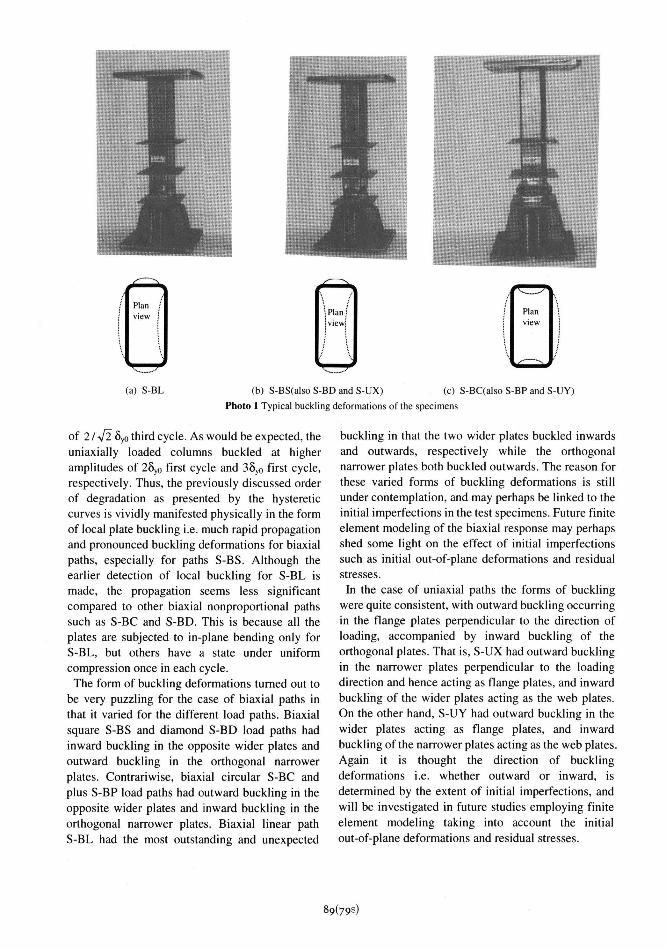
of 2/J SyO third cycle. As would be expected, the uniaxially loaded columns buckled at higher amplitudes of 2Syo first cycle and 3Syo first cycle, respectively. Thus, the previously discussed order of degradation as presented by the hysteretic curves is vividly manifested physically in the form of local plate buckling i. e. much rapid propagation and pronounced buckling deformations for biaxial paths, especially for paths S-BS. Although the earlier detection of local buckling for S-BL is made, the propagation seems less significant compared to other biaxial nonproportional paths such as S-BC and S-BD. This is because all the
plates are subjected to in-plane bending only for S-BL, but others have a state under uniform compression once in each cycle. The form of buckling deformations turned out to
be very puzzling for the case of biaxial paths in that it varied for the different load paths. Biaxial square S-BS and diamond S-BD load paths had inward buckling in the opposite wider plates and outward buckling in the orthogonal narrower plates. Contrariwise, biaxial circular S-BC and plus S-BP load paths had outward buckling in the opposite wider plates and inward buckling in the orthogonal narrower plates. Biaxial linear path S-BL had the most outstanding and unexpected
buckling in that the two wider plates buckled inwards
and outwards, respectively while the orthogonal
narrower plates both buckled outwards. The reason for
these varied forms of buckling deformations is still
under contemplation, and may perhaps be linked to the
initial imperfections in the test specimens. Future finite
element modeling of the biaxial response may perhaps
shed some light on the effect of initial imperfections
such as initial out-of-plane deformations and residual
stresses.
In the case of uniaxial paths the forms of buckling
were quite consistent, with outward buckling occurring
in the flange plates perpendicular to the direction of
loading, accompanied by inward buckling of the
orthogonal plates. That is, S-UX had outward buckling
in the narrower plates perpendicular to the loading
direction and hence acting as flange plates, and inward
buckling of the wider plates acting as the web plates.
On the other hand, S-UY had outward buckling in the
wider plates acting as flange plates, and inward
buckling of the narrower plates acting as the web plates.
Again it is thought the direction of buckling
deformations i. e. whether outward or inward, is
determined by the extent of initial imperfections, and
will be investigated in future studies employing finite
element modeling taking into account the initial
out-of-plane deformations and residual stresses.
Photo 1 Typical buckling deformations of the specimens
(a) S-BL (b) S-BS(also S-BD and S-UX) (c) S-BC(also S-BP and S-UY)
89(79s)

(3)Load paths vis-a-vis displacement paths Figs. 15 to 19 present the normalized load paths as
well as the normalized displacement paths for the biaxial loading cases tested. To enable comparison of biaxial response with currently adopted design strength criteria, the load paths have two types of commonly utilized yield surfaces (linear and circular) imposed on them.
These yield surfaces or ultimate surfaces have been established from past experimental studies, mainly on reinforced concrete sections, and are derived from the general form below21;
(7)
where My is the yield moment and y is the shape factor. The parameter a has been generally recognized to lie between 1.0 and 2.0, depending on the magnitude of axial compression. If the axial compression is small, interaction curve for initial
yielding may be idealized as a straight line with a being taken as 1.0 (also letting y=1). If the axial compression is high, idealization as an ellipse is more appropriate with a limiting value of a equal to 2. 0 for reinforced concrete sections, but is approximately 2. 0 for steel section without local buckling, particularly for the ultimate state.
A comparison between the load response and the applied deflection paths promptly reveals a
pronounced difference in shape and form. The flow of the load path is quite haphazard and inconsistent with the smooth-flowing displacement path. For example, S-BL displacement path is inclined at 45, but the load path shifts from linear inclination in the elastic range to trapezoidal shape in the inelastic range, with the peaks being rotated approximately 22. 5 from the original path. Change of shape and rotation of the load path is also recorded for S-BS which approaches a diamond shape, S-BC which approaches a square or diamond shape with rounded corners, S-BD which retains its diamond shape albeit a squeezed or pinched one and S-BP which very interestingly has a shape which is best encompassed by a diamond shape. It would seem that as loading progresses towards the inelastic range, the force components become out of phase and increasingly lag on each. The probable cause could be the non-concurrent yielding or buckling, compounded with unpredictable inelastic flow in each of the two principal axes of loading. Bousias et al. 10 have also recorded the inconsistent flow
between load and displacement paths, and particularly emphasized on the rotation of the load path. They speculate that the rotational behaviour, which implies that the displacement vector always trails the force vector, is advantageous because it leads to increased energy dissipation when compared to the uncoupled response in the two transverse directions. In relation to the yield paths, the Figures show that all the load paths seem to be better enclosed by the circular yield surface,
probably due to the presence of a constant axial load of 0. 2Py.
In consideration of the two limiting failure paths, i. e. the initial yield and plastic interactions, Fig. 20 has been drawn representing the resultant and summed responses for each displacement cycling amplitude, respectively as indicated on the axis label. The resultant response represents equation (7) with a=2, while the summed response is when a=1. This is an attempt to quantify the biaxial responses in a manner, which could facilitate correlation with the uniaxial response. A clear distinction is evident between Fig. 20(a) and Fig. 20(b), in that while the resultant response presents a reasonable comparison of biaxial and uniaxial curves in terms of strength and its degradation, the summed response shows significant differences between the uniaxial cases and the biaxial cases. Furthermore, it also can be seen that the severe strength degradation for the nonproportional biaxial displacement histories, e. g., S-BS, S-BC and S-BD is well distinguished from others. Accordingly, it would be desirable to adopt a=2 for strength and ductility evaluation of multi-axial loading situations, particularly in terms of effective load and effective displacement in the multiaxial load-displacement space.
(4) Energy absorption capacity With the world-wide trend towards unified limit state
design codes for structures, the assessment of structural reliability for various limit states is becoming increasingly important, highlighting the urgent task for engineers to clarify the limit states under cyclic and dynamic loading by rational testing procedures. Although the classical static strength of structures remains an important design criterion with regard to external loads of frequent occurrence, the robustness and survival of structures under rare extreme loads such as strong earthquakes demand high-energy absorption capacity and ductility25),26). In this context, several formulae have been proposed to define ductility of structures27. However, it has been pointed out that the inelastic performance of a structure is highly sensitive to the displacement history, hence resulting in varied ductility indexes. More so, evaluation made separately
90(80S)

Fig. 15 Path in the multiaxial space (S-BL)(a) Load path (b) Displacement path
Fig. 16 Path in the multi-axial space (S-BS)(a) Load path (b) Displacement path
Fig. 17 Path in the multiaxial space (S-BC)(a) Load path (b) Displacement path
Fig. 18 Path in the multiaxial space (S-BD)(a) Load path (b) Displacement path
91(8 is)

in X and Y directions may not be good enough, as discussed in the previous section. In view of this, a more objective measure of the inelastic performance of a structure has been established, in the form of normalized cumulative energy absorption per cycle, E, defined as;
E=)(gu)1 =)((f1 M/Ee) (8)
where p =1 Hy8yp
and Ek = energy absorption in cycle k of a test, and
i=1 to 2 represents X and Y directions. At present, Design Specifications of Highway
Bridges prescribes that the seismic performance of RC bridge piers in large earthquakes should be
evaluated by checking the horizontal load-carrying
capacity of RC bridge piers based on the energy constancy law that elasto-plastic energy and elastic input energy become equivalent in the limit state.
In this study, the normalized energy absorption
per cycle at the each of the cycling amplitudes have been evaluated and presented in Fig. 21. The two different effective displacement amplitudes in the multiaxial space discussed previously are utilized for comparison. Again, it can be understood that the resultant of displacement amplitude is better measure to clarify the energy absorption characteristics for the multiaxial loading conditions, less variation.
Biaxial-square history (S-BS) shows the worst response in that it has the least energy absorption per cycle. This implies least resistance to cyclic loading. It is followed by biaxial-diamond history (S-BD), possibly biaxial-circular (S-BC). In contradistinction, biaxial-linear (S-BL) history, which was recorded to have the lowest resultant of loads, shows a surprisingly high-energy absorption, even higher than that of the uniaxial history. Biaxial-circular (S-BC) which was also recorded to have one of the severest load-deflection responses turns out to have the higher initial energy absorption, which may be due to response lag of load corresponding to the applied displacement.
Fig. 19 Path in the multiaxial space (S-BP)(a) Load path (b) Displacement path
Fig. 20 Resultants and summations of load-displacement response
(a) Summation; a=1 (b) Resultant ; a=2
92(82s)

The different characteristics derived from the energy absorption-amplitude curves and load-deflection curves re-affirms the objective nature of energy absorption assessment, hence it's overriding suitability. Whereas load-deflection response largely picks out specific points of interest, the energy absorption-amplitude response summarizes the response in a cycle.
It is also observed in Fig. 21 that energy absorption increases beyond the expected displacement amplitude at the peak load, a condition reported by other researchers28),29) who found out that the absorbed quantity of energy continues to increase even after the maximum strength, and it becomes a maximum near the point where the strength deteriorates till an order of the yield strength.
4. CONCLUSIONS
The main conclusion drawn from this experimental study is that, in comparison with uniaxial displacement paths, biaxial displacement
paths cause more extensive degradation of column stiffness, strength and ductility, in each of the two transverse directions considered separately.
From energy absorption concept, which provides a more objective assessment, biaxial-square (S-BS) displacement history was the severest since it had the least energy absorption capacity as well as it had the severest strength degradation. On the other hand, from the load-deflection response in the component directions, the lowest resultant of strength was given in the biaxial-linear (S-BL).
It is particularly noted that biaxial effects are
more prominent in the inelastic range. In light of these experimental observations, adequate inclusion of the effects of biaxial loading in structural design would seem prudent, in order to satisfy two basic criteria of seismic design; namely high stiffness at working loads and high ductility and energy dissipation in the inelastic range. This calls for the accumulation of database and formulation of realistic analytical equations representative of the actual multi-axial response of structures subjected to strong seismic motion.
The future direction of this study is to utilize the experimental results in FEM analytical modeling, by which further studies e. g. parametric studies, will be conducted. The FEM modeling in conjunction with experimental results will facilitate the quantification of biaxial response, taking into consideration the local buckling characteristics, in the form of biaxial interaction curves suitable for design purposes or in the form of simplified analytical expressions relating the X and Y strength components into a unified scalar quantity. Such quantification will consider factors influencing the biaxial resistance of columns e. g. combinations of slenderness parameters and shape of cross section. Additionally, the severe post-ultimate state degradation caused by complex biaxial loading may be quantified in the form of post-ultimate ductility corresponding to
post-ultimate load level of e. g. 95% of the ultimate strength, and finally including a magnified safety factor for ductility-based seismic design.
ACKNOWLEDGEMENTS: This research was partly financed by Grant-in-Aid for Scientific Research (C)
(No. 10650462) from the Ministry of Education, Science, Sports and Culture.
Fig. 21 Normalized energy absorption per cycle(a) Summation; a=1 (b) Resultant; a=2
93(83S)

REFERENCES1) Structural Stability Design: Steel and composite
Structures, edited by Fukumoto, Y., Elsevier Science, Oxford, pp. 1-7, 1997.
2) Watanabe, E. and Oyawa, W. O. : Lessons from the 1995 Great Hanshin-Awaji Earthquake: Performance of
concrete and steel bridge structures, J. Civil Engrg.,
JKUAT, Nairobi, Vol. 2, pp. 40-64, 1996. 3) Japan Road Association: Specification for highway
bridges: V Earthquake-resistant design, 1980 (in Japanese).
4) Japan Road Association: Specif cation for highway
bridges: II Steel bridges, 1973 (in Japanese). 5) Usami, T. and Ge, H. B. : Cyclic behaviour of thin-walled
steel structures-numerical analysis, J. Thin-Walled Structures, Vol. 32(1-3), pp. 41-80, 1998.
6) Goto, Y., Wang, Q. and Obata, M. : FEM analysis for hysteretic behaviour of thin-walled columns, J. Struct.
Eng., ASCE, Vo1. 124(11), pp. 1290-1301, 1998.
7) Kawashima, K. and Unjoh, S. : Impact of Hanshin/Awaji earthquake on seismic design and seismic strengthening
of highway bridges, J. Struct. Mech., JSCE, pp. 1-30, 1997.
8) Japan Road Association: Specification for highway bridges: V Earthquake-resistant design, 1996 (in
Japanese).
9) Wong, Y., Paulay, T. and Nigel Priestley, J. N. : Response of circular reinforced concrete columns to
multi-directional seismic attack, ACI struct. J., Vol. 90(2), pp. 180-191, 1993.
10) Bousias, S. N., Verzeletti, G., Fardis, N. and Gutierrez,
E. : Load-Path effects in column biaxial bending with axial force, J. Engrg. Mech., ASCE, Vol. 121(5),
596-605, 1995. 11) Sfakianakis, M. G, and Fardis, M. N. : Bounding surface
model for cyclic biaxial bending of RC sections, J. Engrg. Mech., ASCE, Vol. 117(12), pp. 2748-2769, 1991.
12) Sfakianakis, M. G. and Fardis, M. N. : RC Column model for inelastic response analysis in 3D, J. Engrg. Mech.,
ASCE, Vo1. 117(12), pp. 2770-2787, 1991.
13) Zahn, F. A., Park, R., and Priestley, M. J. N. : Strength and ductility of square reinforced concrete column section
subjected to biaxial bending, ACI Struct. J., Vol. 56(2),
pp. 123-131, 1989. 14) Watanabe, E., Sugiura, K., and Kitane, Y. :
Three-dimensional response of bridge systems subjected
to strong ground motions, J. Struct. Eng., JSCE, Vol. 43A, pp. 897-906, 1997.
15) Takizawa, H. and Aoyama, H. : Biaxial effects in modeling
earthquake response of R/C structures, Int. J. Earthq. Engrg.
Struct Dyn, Vol. 4(6), pp. 523-552, 1976. 16) Umehara, H. and Jirsa, JO. : Short rectangular RC columns
under bi-directional loadings, J. Struct. Eng., ASCE, Vol.
110(3), pp. 605-618, 1984. 17) Zeris, C. A. and Mahin, S. A. : Behaviour of reinforced concrete
structures subjected to biaxial excitation, J. Struct. Eng.,ASCE, Vol. 117(9), pp. 2657-2673, 1991.
18) Saatcioglu, M. and Ozcebe, G. : Response of reinforced
concrete columns to simulated seismic loading, ACI Struct. J., Vol. 86(1), pp. 3-12, 1989.
19) Kreger, ME. and Sozen, MA. : Seismic response of imperial county services building in 1979, J. Struct. Eng., ASCE, Vol.
115(12), pp. 3095-3111, 1989.
20) ECCS: Study on Design of Steel Building in Earthquake Zones, ECCS-Technical Committee 1, 1986.
21) Kong, F. K. and Evans, R. H. : Reinforced and prestressed concrete, 3rd ed., Chapman and Hall, London, 1987.
22) Usami, T. and Fukumoto, Y. : Local and overall buckling of welded box columns, J. Struct. Eng., ASCE, pp. 525-542,
1982. 23) Usami, T., Coupled instability, Structural Stability Design;
steel and composite structures, edited by Fukumoto, Y.,
Elsevier Science, Oxford, pp. 315-335, 1997. 24) Park, R. : Capacity design of ductile RC building structures for
earthquake resistance, Struct. Eng., Vol. 70(16), pp. 279-289,
1992. 25) Sugiura, K., Cyclic buckling and impact strength, Structural
Stability Design; steel and composite structures, edited by Fukumoto, Elsevier Science, Oxford, pp. 337-382, 1997.
26) Usami, T. and Ge, H. : Ductility of concrete-filled steel box columns under cyclic loading, J. Struct. Eng., ASCE, Vol.
120(7), pp. 2021-2040, 1994. 27) Interim Guidelines and new technologies for seismic design of
steel structures, Committee on New Technology for Steel Structures (CNTSS), JSCE, edited by Usami, T., July 1996(in
Japanese).
28) Nishikawa, K., Yamamoto, S., Natori, T., Terao, K., Yasunami, H. and Terada, M. : Retrofitting for seismic
upgrading of steel bridge columns, Engineering Structures, Vol. 20(4-6), pp. 540-551, 1998.
29) Sueda, A., Yasunami, H. Mizutani, S. Kobaysashi, Y., and Nakagawa, T. : Study on ductility of steel pier under cyclic
loading, Proc. of the 5rh international colloquium on stability and ductility of steel structures, pp. 237-244, 1997.
(Received September 14, 1999)
94(84S)

鋼 角形断 面柱 の繰 り返 し挙動 に及 ぼす水平2方 向変位 履歴 の影 響 につい て
渡 邊英 一 ・杉 浦邦征・Walter O. OYAWA
本研究では, 3次元地震動に対する構造物の安全性を議論する上で不可欠な繰り返し弾塑性挙動に及ぼす水平2方 向載荷の影響に関して実験的な検討を行った. 対象構造物としては, 鋼製中空長方形断面
橋脚柱を取り上げ, 上部構造の自重を考慮した鉛直力と水平地震動を想定した水平2方 向力を橋脚柱頭に作用させ, その強度と変形能を明らかにした. なお, 水平力は, 水平2方 向に変位制御で与え, 1方
向変位履歴, 2方向比例変位履歴, 4種 類の非比例変位履歴を考慮した. 実験結果から, 非比例変位履歴により, 剛性, 強度および変形能が著しく低減することが明らかになった.
95(85s)