effects of partial pressure of oxygen on...
TRANSCRIPT

1
EFFECTS OF PARTIAL PRESSURE OF OXYGEN ON THE STABILITY OF AXIAL, OXY-
COAL, TURBULENT DIFFUSION FLAMES
Topical Report Task 8
July 31st, 2009
Co-operative Agreement: DE-FC26-06NT42808
Reporting Period: July 1, 2006 to May 31, 2009
Prepared for:
U.S. Department of Energy,
National Energy Technology Laboratory (NETL)
Prepared by
Jingwei Zhang and Jost O.L. Wendt
Department of Chemical Engineering and
Institute for Clean and Secure Energy,
University of Utah, Salt Lake City, UT 84108
Email: [email protected]
2
DISCLAIMER
This report was prepared as an account of work sponsored by an agency of the United States Government. Neither the United States Government nor any agency thereof, nor any of their employees, makes any warranty, express or implied, or assumes any legal liability or responsibility for the accuracy, completeness, or usefulness of any information, apparatus, product, or process disclosed, or represents that its use would not infringe privately owned rights. Reference herein to any specific commercial product, process or service by trade name, trademark, manufacturer, or otherwise does not necessarily constitute or imply its endorsement, recommendation, or favoring by the Unites States Government or any agency thereof. The views and opinions of authors expressed herein do not necessarily state or reflect those of the United States Government or any agency thereof.

3
ABSTRACT Oxy-fuel combustion of pulverized coal with flue gas recirculation is potentially one of the few technologies that may allow CO2 sequestration technologies to be applied to existing coal-fired boilers. One issue of interest is to understand and predict the effects of the near-burner zone environment consisting of O2 and CO2 (instead of N2). The purpose of this research is to better understand the effect of partial pressure of O2 (PO2) on flame stability, which becomes another degree of freedom not present during air combustion. The data obtained were designed to form an experimental basis for validation of coal-jet ignition models. These models can play a useful role in predicting flame attachment and flame stability for retrofit of oxy-coal combustion into existing boilers. Type 0 axial flames, which can be accurately characterized, are chosen to represent the near-burner zones of tangentially fired furnaces or cement kilns, where burner swirl is absent. This topical report describes:
the design attributes of a 100 kW test oxy-fuel combustor, together with an ancillary O2 and CO2 supply system. One challenge that was satisfactorily resolved was the steady feeding of 2 – 5 kg/hr coal into an axial burner to produce Type 0 axial turbulent diffusion flames in a steady enough fashion to allow quantification of the data.
the methodology developed to quantify flame stand-off distance, flame length, and flame luminosity using image processing techniques.
the results showing the effect of PO2 in secondary O2/CO2 stream on flame stability, flame length and flame luminosity at the same adiabatic flame. temperature comparing with O2/N2 environment.
the results showing the effect of PO2 in the primary (transporting) stream on the axial flame stand-off distance. Statistical studies, including probability distribution function (PDF) data, on the flame stand-off distance, are provided to quantify this effect.
The results indicated that flame stand-off distance is not a continuous variable, and attachment/detachment passes through a sudden transition. In addition, the secondary stream preheat plays an important role on the coal ignition. Primary PO2 has a first-order effect on flame stability and axial coal jet ignition.

4
Contents
CONTENTS .................................................................................................................................... 4
EXCUTIVE SUMMARY ............................................................................................................... 5
OBJECTIVES ................................................................................................................................. 6
SCOPE ............................................................................................................................................ 6
BACKGROUND ............................................................................................................................ 8
Single coal particle ignition mechanism ................................................................................... 9
Near-burner phenomena studies and flame stability ............................................................... 11
Pollutant reduction during oxy-coal combustion .................................................................... 12
EXPERIMENTAL METHODS.................................................................................................... 13
Design and construction of the new experimental furnace ..................................................... 13
Preliminary screening tests to validate the equipment and operating envelope under air firing conditions ................................................................................................................................ 19
Incorporation of O2 supply and once through CO2 to allow for oxy-firing conditions ......... 25
Establishment of steady coal feeding conditions through coal feeder modifications ............. 26
Development of photo-imaging technique to allow quantification of flame stability ............ 30
Screening tests of photo-imagining techniques with a view to determining effect of secondary PO2 on flame length and flame luminosity ............................................................................ 34
Final studies on effects of PO2 in the primary coal jet on flame stand-off distance, and other data for simulation studies ...................................................................................................... 39
CONCLUSIONS........................................................................................................................... 51
ACKNOWLEDGMENT............................................................................................................... 51
LIST OF FIGURES ...................................................................................................................... 51
LIST OF TABLES ........................................................................................................................ 53
REFERENCES ............................................................................................................................. 54
NOMENCLATURE ....................................................................................................................57
5
EXCUTIVE SUMMARY
The purpose of this research is to better understand and to scale the effect of partial pressures of O2 and CO2, two additional degrees of freedom for oxy-coal combustion, on coal jet ignition and flame stability in the near-burner zone. A novel methodology is developed to quantify the flame stability and flame length by introducing an image processing technique. In addition, the experiment is designed to provide data for simulation validation studies that can be used to predict how air fired combustors may be retrofitted to oxy-coal. Specifically the objective is to explore effects of the partial pressure of O2 and CO2 on coal jet flame stability, which is quantified by stand-off distance, the distance between burner tip and the base of the detached flame. The experiments are carried out in a 100 kW pilot-scale laboratory furnace outfitted with a coaxial, zero swirl burner and arrays of electrically heated panels in the burner zone in order to control variations in near-burner heat loss. The design of the combustor is described in detail. Currently, fresh, once-through CO2 (rather than flue gas recycle), and O2 streams are introduced into the burner. The furnace has visual access to the burner zone through quartz windows, and this allows for optical measurements. Data consist, in part, of sequences of photo-images of the flame. A special complementary metal–oxide–semiconductor (CMOS) sensor based camera, which is more sensitive to the near infrared wavelength, is employed to capture quantitative information on Type 0 axial turbulent diffusion flame shapes. This information is subsequently analyzed to yield statistical data with error quantification, of flame stand-off distance as functions of variations of various operational parameters, including systematic variations of partial oxygen pressure in both transport and secondary oxidant streams. These analyses are used to determine the effect of oxygen partial pressure in both transport and secondary stream on coal jet ignition and flame stability. This work has led to the following conclusions:
• Systematic measurements of axial flame stand-off distance versus primary O2 concentration (PO2) have been obtained, together with uncertainty quantification.
• Flame lift-off distance is not a continuous variable and attachment/detachment appears to pass through a sudden transition.
• Secondary stream preheat plays a critical role in coal ignition. However primary PO2 has a dominant effect on flame stability and axial coal jet ignition.
6
OBJECTIVES
Oxy-coal combustion, in which air is replaced by an O2/ CO2 mixture, is one of the technologies that may allow CO2 sequestration technologies to be applied to existing coal-fired boilers. One issue of interest is to understand and predict the effects of inlet oxidant mixture composition, now consisting of O2 and CO2 instead of O2 and N2, on flame stability. The objectives of the research presented here are:
1. to better understand, the effects of partial pressure of O2 in the coal transport jet, on axial coal jet ignition and flame stability;
2. to contribute to validated, turbulent diffusion coal flame simulations that predict the effects on flame stability of conversion from air fired to oxy-fired conditions in existing units.
Furthermore, although the well defined axial flame type under consideration here was chosen because of its simplicity and suitability for simulation, it does have direct practical relevance to certain industrial oxy-coal combustion configurations, such as tangentially fired boilers and cement kilns. Therefore, this work comprises the first steps towards understanding the stability of turbulent oxy-coal flames in general.
SCOPE
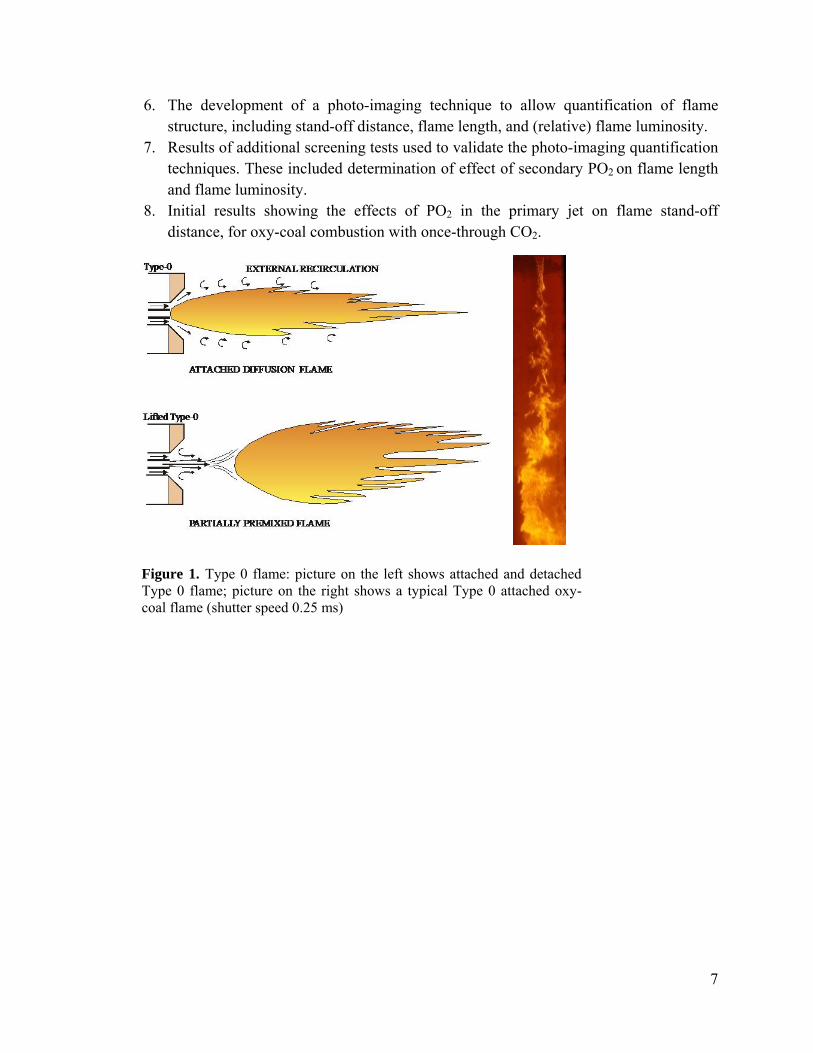
One measure of coal jet flame stability is the stand-off distance, the distance between burner tip and the base of a detached flame. To explore how oxygen partial pressure (PO2) of the oxidant streams may affect this parameter, experiments have been completed in a newly designed and constructed 100 kW pilot-scale laboratory furnace. These experiments employed a well-defined pulverized coal (PC) axial turbulent diffusion flame similar to those depicted on Figure 1. These relatively simple, zero swirl, axial flames (designated here as Type 0 flames) are better defined for companion simulation studies, and may also have similarities to practical flames in cement kilns and in tangentially fired boilers.
The scope of this Topical Report encompasses the following:
1. A brief exposition of background material relevant to this project. 2. The design and construction of the new 100kW oxy-fuel combustor (OFC), the co-
axial jet burner, and supporting piping and instrumentation created for this project. 3. Results of screening experiments, using air, performed to validate this new facility
under essentially conventional combustion conditions. 4. Engineering details on the incorporation of the O2 and CO2 supply system provided
by Praxair, Inc. 5. A description of necessary modifications to the coal feeder to allow sufficiently
steady coal feeding conditions for flame stability studies, at coal feed rates of 2-5 kg/h.
7
6. The development of a photo-imaging technique to allow quantification of flame structure, including stand-off distance, flame length, and (relative) flame luminosity.
7. Results of additional screening tests used to validate the photo-imaging quantification techniques. These included determination of effect of secondary PO2 on flame length and flame luminosity.
8. Initial results showing the effects of PO2 in the primary jet on flame stand-off distance, for oxy-coal combustion with once-through CO2.
Figure 1. Type 0 flame: picture on the left shows attached and detachedType 0 flame; picture on the right shows a typical Type 0 attached oxy-coal flame (shutter speed 0.25 ms)

8
BACKGROUND
Global warming, one of the largest environmental challenges of our time, is due to increased carbon dioxide levels in the atmosphere [1]. The world currently depends on the use of fossil fuels, especially coal, for its energy supply, and will continue to do so for a long time. According to the Kyoto Protocol, by 2008-2012, Annex I countries must reduce their greenhouse gas emissions by a collective average of 5% below their 1990 levels. One approach to diminish CO2 emissions into the atmosphere is to capture the carbon emissions from fossil fuel combustion units and sequester them deep in the earth. This is carbon capture and sequestration (CCS). In post combustion process, CO2 capture requires absorption into and subsequent regeneration of an absorbent, usually a solution. Another CCS process currently under consideration involves burning coal with relatively pure oxygen, together with recycled flue gases, to produce a highly concentrated (up to 95% CO2) flue gas stream, suitable for immediate compression to a supercritical state and subsequent transportation and sequestration. This is oxy-fuel combustion, one of the promising technologies to reduce CO2 emissions, and one that has attracted world-wide attention[1, 2, 3, 4].
Sarofim et al (2004) have summarized the major scientific questions on oxy-coal combustion in PC furnace with CO2 recycle in terms of the following issues:
1. Can we predict heat transfer profile, fouling, slagging, ash partitioning and char burnout under oxy-coal combustion conditions?
2. Can we predict ignition/kinetic/aerodynamic interactions here at the burner? 3. How much residual N2, NO, Hg, SO2, trace metals etc. can be removed with the CO2 to be
sequestered? 4. From where shall the recycled flue gases be taken? Should they be extracted from the flue
gas after ash removal, after H2O removal, or after SO2 removal, or after any combination of these three?
This work focuses on the second question, related to ignition. To study the coal jet ignition and flame stability, it is very important to understand both the chemistry (such as, single coal particle ignition mechanisms, kinetics rates of char oxidation, and so on) and the aerodynamics (such as mixing, particle trajectories and flow patterns) occurring in the near-burner zone. It is also of interest to study the NOx formation under oxy-coal combustion conditions, because measurements of NOx are achieved with little extra effort as by-products of this work, and because NOx from coal flames is sensitive to flame attachment and flame jet aerodynamics. Therefore this literature review summarizes the previous studies on: 1) coal particle ignition mechanism; 2) near-burner phenomena studies and flame stability; 3) pollutant formation under oxy-coal combustion conditions.
9
Single coal particle ignition mechanism
To understand coal jet ignition, it is useful first to study ignition of a single coal particle. Over the last decade, there have been numerous studies of coal particle ignition mechanisms [5-20]. Essenhigh et al. [8] completed a classical review on coal particle ignition mechanisms in 1980. Both homogenous, gas phase ignition(GI), and heterogeneous (HI) mechanisms have been proposed to describe the ignition process [8-15]. The greatest controversy lies on which mechanism is controlling: devolatilization followed by gas phase ignition (first proposed by Faraday) or gas/solid reaction (whole coal ignition). The heterogeneous reaction involves the direct attack of oxygen on the whole coal particle, not just char, and also removes material, which would otherwise be expelled as volatiles [8]. In the GI mechanism the initial step is pyrolysis and subsequent ignition of the volatiles (Faraday mechanisms), followed by (heterogeneous) ignition of the char. The heterogeneous mechanism neglects the influence of volatile matter and depends on heat generation by combustion on the coal surface (either externally or internally), whereas the homogeneous mechanism involves the combustion of evolved volatile matter in the vicinity of the particle with its heating by conduction from the volatile flame. [11]
Wall and Gururajan [10, 11 ] applied analyses of both heterogeneous and homogenous mechanisms to data obtained in their study and showed that:
1. Although a flame sheet model for the ignition of a single particle by a homogeneous mechanism predicts the observed particle size dependence of the ignition temperature, it fails to predict the observed oxygen concentration dependence [11].
2. Analysis of the ignition temperature data (at temperatures ranging from 650K-1200K and particle sizes less than 500 ) to determine the reactivity of coal or char, requires a) the assumption of heterogeneous ignition, b) an assumption on the nature of the product of combustion (generally CO2 rather than CO), and c) the reaction order with respect to oxygen (if experiments were not preformed over a range of oxygen partial pressures) [10].
3. When both surface oxidation (heterogeneous mechanism) and volatile combustion (homogeneous mechanism) are considered to occur simultaneously, surface oxidation dominates the ignition behavior (as far as ignition temperature is concerned) of only small particles, or at high oxygen concentrations [11].
Sun [15] suggested that when weight loss occurs before ignition, it can be assumed that pyrolysis occurs first, so that ignition is homogeneous. On the other hand, when ignition occurs before or at almost same time as weight loss, ignition can be assumed to be heterogeneous. It is possible that both heterogeneous reaction and pyrolysis occur simultaneously. However, at the early stage of pyrolysis it is likely that the volatile matter evolved cannot attain the flammability limit. In this case it is more likely that the ignition of coal particles occurs earlier than the ignition of volatile matter and also that the heterogeneous reaction removes material, which would otherwise be expelled as volatiles [8]. This situation suggests the HI mechanism. In 1979, Juntgen [8] drew a map of ignition regimes as a function of heating rate and particle size, and
10
suggested that if coal particle size is larger than 100 and heating rate lower than 100 K/s, GI mechanism should be applied; otherwise HI is more favored [8].
Many criteria, such as temperature, pyrolysis rate, local gas phase combustible concentration, local gas phase reaction rate, local gas phase heat release rate, local gas phase heating rate [10,11,15], and spatial concentration distribution of combustibles, have been developed to define the ignition of coal particles.
The increased coal particle temperature was found to be controlled by the following factors:
1. Heat transfer from the ambient gas. 2. Radiative heat transfer from the chamber’s walls. Before ignition the temperature of these
walls was low and radiation effects on ignition temperature can be assumed to be negligible [10-12].
3. Heat generated by chemical reaction. 4. Heat loss when the temperature of the particles was higher than that of the ambient gas and
chambers’ walls.
From these results and others in the literature, numerous factors, such as coal properties, particularly particle size and volatile content [7-9, 15], heating rate [8, 15], oxygen concentration [5, 6, 12, 15], pressure [15-17] and nature of the gas flow surrounding the particle[5, 6, 13] may all impact coal ignition.
Zhang, et al, [18-20] developed a moving flame front (MFF) model and an improved moving flame front (IMFF) model, taking into account the effect of CO oxidizing in the boundary layer around the particle and the influence of the finite rate heterogeneous reduction of CO2 during combustion of a carbon particle. This model has better agreement with the experimental data compared with the traditional single-film model. It is applicable to the burnout of coal char particles in a practical PC flame.
With the exception of the recent work of Molina and Shaddix [5, 6], most studies have not considered the effect of elevated levels of CO2, as present in oxy-coal combustion systems, on the ignition of coal particles. The different properties of CO2 in comparison to N2 have been shown to cause differences in flame and furnace operation parameters such as ignition time and gas temperature profiles [21]. Molina and Shaddix used a combination of particle statistics and one color pyrometry to measure the particle temperature and CH radical chemiluminescence as a tool for the detection of flame sheet and ignition regions [5, 6]. Single particle imaging, shows that the substitution of N2 by CO2 increases the time required for ignition. It also shows that the temperature and size of the diffusion flame of soot cloud that surrounds the particle are lower and larger respectively when CO2 is used instead of N2, due to the fact that N2 has a higher thermal diffusivity than CO2. They also quantified the characteristic devolatilization time and ignition time and found that ignition occurs at higher oxygen concentrations, and that the presence of CO2 retards coal and char ignition, but has a negligible effect on the duration of devolatilization.
11
An understanding of coal particle ignition mechanisms can help elucidate the detailed kinetics near a coal particle when that is ignited. However, another point should be always kept in mind, namely that the particles injected always contain a size distribution. Therefore, the experimental data results from a range of oxidation rates. Thus, the assumption of a single particle size cannot explain some aspects of the experimental results (e.g., the “curvature” of the burn-off curve) and may lead to significant deviations in calculated kinetics parameters. Only Ballester and Jimenez took the particle size distribution into account [7].
Nearburner phenomena studies and flame stability
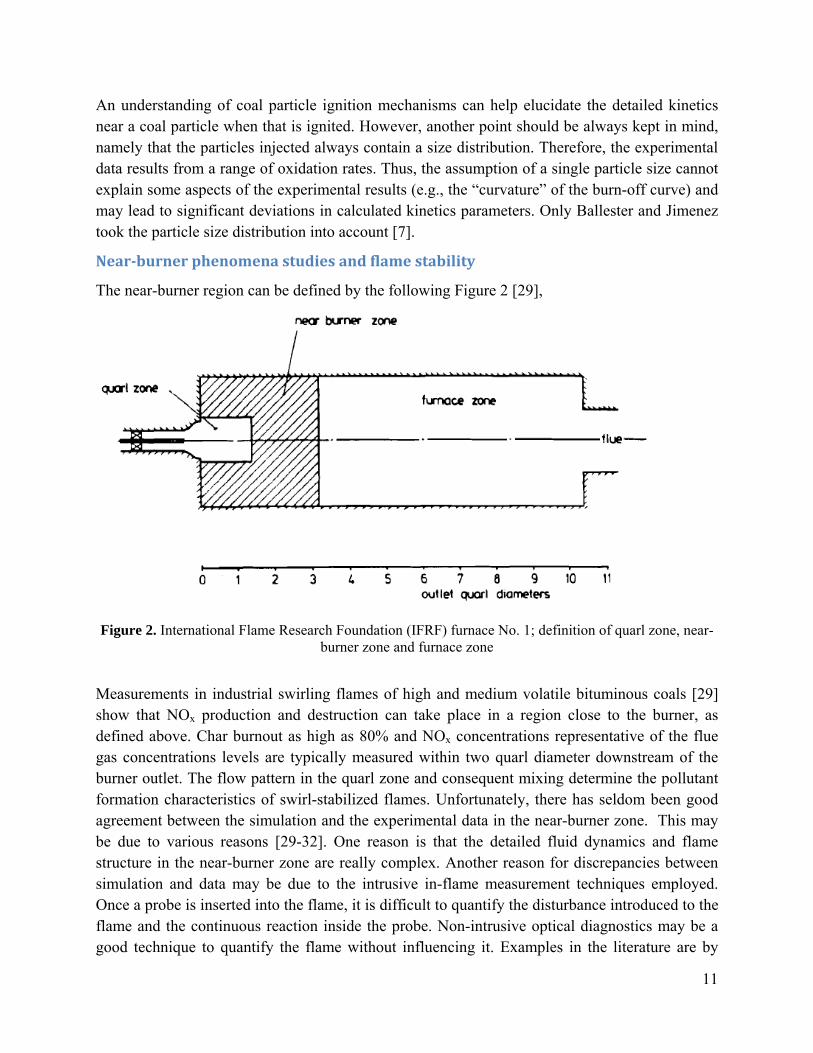
The near-burner region can be defined by the following Figure 2 [29],
Figure 2. International Flame Research Foundation (IFRF) furnace No. 1; definition of quarl zone, near-burner zone and furnace zone
Measurements in industrial swirling flames of high and medium volatile bituminous coals [29] show that NOx production and destruction can take place in a region close to the burner, as defined above. Char burnout as high as 80% and NOx concentrations representative of the flue gas concentrations levels are typically measured within two quarl diameter downstream of the burner outlet. The flow pattern in the quarl zone and consequent mixing determine the pollutant formation characteristics of swirl-stabilized flames. Unfortunately, there has seldom been good agreement between the simulation and the experimental data in the near-burner zone. This may be due to various reasons [29-32]. One reason is that the detailed fluid dynamics and flame structure in the near-burner zone are really complex. Another reason for discrepancies between simulation and data may be due to the intrusive in-flame measurement techniques employed. Once a probe is inserted into the flame, it is difficult to quantify the disturbance introduced to the flame and the continuous reaction inside the probe. Non-intrusive optical diagnostics may be a good technique to quantify the flame without influencing it. Examples in the literature are by

12
Olivani, et al. [34], who used PIV (particle image velocimetry) and LDV (laser Doppler velocimetry) to obtain a comprehensive analysis of the velocity field, and optical still photography for the detection of flame front and main visible flames [34]. From the point of view in the simulation side, the accuracy of the model could not be definitively established due to a lack of detailed measurements in the near-burner region of the combustor and an incomplete understanding of the devolatilization and char combustion of the chosen coal [27]. Another example of the complexity in turbulent jets in the near-burner region is given by Budilarto [35] and Budilarto and Sinclair [36], who suggested that coal ignition sub-model should capture observations that smaller particles preferentially migrate to the jet edge due to turbulent eddies, while larger particles keep travelling in the center of coal jet due to the inertia.
Flame stability, is often quantified as a function of many parameters, such as swirl number, stoichiometry, coal loading, temperature, and coal type [29, 30, 32, 33]. Flame stability can also be described by the attachment or detachment in the experiments. Stand-off distance (also called Lift-off distance), is a parameter to describe the flame stability. When stand-off distance is zero, it means the flame is attached and stable. For unstable detached flames, stand-off distance is usually defined in the experiments as the distance from the burner tip to the base of the flame. Truelove et al, [30] suggested the flame stand-off is taken as the distance at which three percent of the coal mass is devolatilized for prediction purposes. The stability limits of a non-premixed burner arrangement are quantified as a function of swirl number, quarl length, burner confinement and mixtures of pulverized solid fuel and natural gas. Most scientists focused on the above parameters which influence the flame stability. But few studies considered the effect of oxygen partial pressure, which becomes another degree of freedom in oxy-coal combustion. Axelbaum’s group at Washington University [40] reported that an increase in O2 concentration improves flame stability while replacing N2 with CO2 results in reduced flame stability. They characterize flame stability by the primary oxidizer Reynolds number at flame blow off (Type I PC flames). They found the air-fired flame and the 30% O2/70% CO2 flame have similar blow-off velocity limits. The flame with 6% O2 in the primary oxidizer and 35% O2 in the secondary oxidizer also has comparable blow-off velocity limits suggesting the potential for reduced NOx due to the removal of O2 from the high temperature region of the flame without sacrificing flame stability [40].
Pollutant reduction during oxycoal combustion
The reduction of SOx and NOx in oxy-coal combustion has been reported by many scientists [21-28]. Most of the studies were done either in lab scale or pilot scale furnaces.
Under oxy-coal combustion conditions, because N2 is absent, theoretically there is no thermal NOx formation. Fuel NOx is dominant. Liu and Okazaki [23] reported that the conversion ratio from fuel-N to exhaust NO was automatically reduced to less than about one fourth of conventional PC, mainly due to the reduction (or reburning) of recycled NO into the combustion zone. The detailed mechanisms were also discussed by Okazaki and Ando [25]. Ogden and Wendt studied the flame attachment and NOx emissions using oxygen enrichment for Type 0 PC
13
flame [38, 39]. Liu et al. [21] found air/oxidant staging is a very effective method in reducing NOx emissions for both coal combustion in air and coal combustion in 30% O2/70% CO2. Croiset and Thambimuthu [25] from CANMET compared the coal combustion in once-through O2/CO2 mixtures and experiments with recycled flue gas. They found that combustion with recycled flue gas leads to lower NOx emission rate than for once-through combustion in O2/CO2 mixtures, with also agreed with the results of [25,26]. Hu and Kobayashi et al [22] discussed the effect of temperature on NOx emissions in the presence of recycled flue gas. Increasing the temperature in the presence of excess oxidants will accelerate the oxidation of fuel nitrogen components to NO; on the other hand, at higher temperature, volatiles are predicted to be more rapidly evolved and hence will have a higher average concentration in the early stage of combustion, resulting in fuel rich zones for enhanced NO reduction to N2. NO reduction by char is also enhanced at higher temperature due to the increased rates of reaction, although it provides only a marginal contribution to the total NO reduction. Therefore the net results depend on the combustion conditions and the coal type [22].
EXPERIMENTAL METHODS
Design and construction of the new experimental furnace
A new 100 kW down-fired, oxy-coal combustion furnace (OFC) was designed and constructed to allow for the systematic investigation of near-burner aerodynamics of axial diffusion flames using a mixture of oxygen/carbon dioxide to replace the combustion air. It has heated walls and quartz windows for optical access that permit flame detachment studies and future optical diagnostics (Figure 3). The new furnace will simulate the environments experienced by PC jet flames in certain boilers (such as tangentially fired units) and will provide for the systematic control of burner momentum and velocity variables, as well as wall temperatures. The furnace consists of an oxy-fuel combustion chamber, followed by downstream section with controlled temperature cooling to simulate practical furnace conditions. It allows stabilization of axial Type 0 (no swirl) PC diffusion flames, through the use of heated walls, and variations of oxygen content of transport and secondary air streams. It also represents those typical of existing tangentially fired boilers or cement kilns. The time-temperature history, for combustion with air, represents that of existing boilers.
14
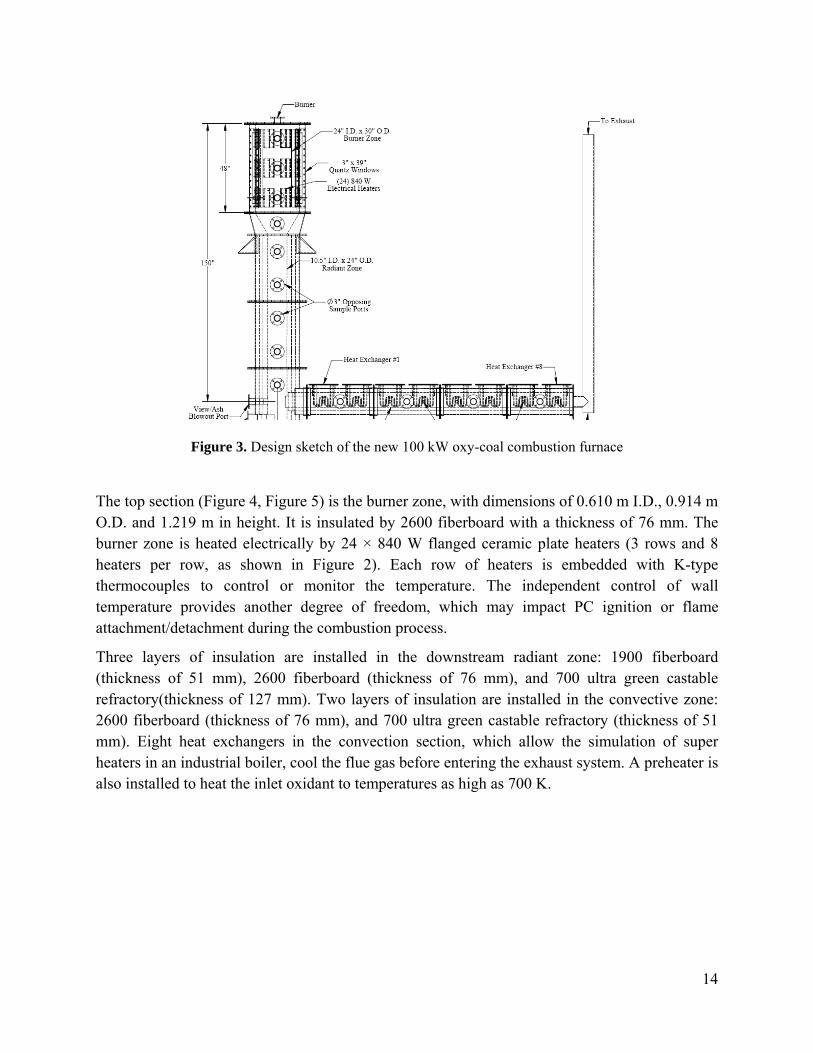
Figure 3. Design sketch of the new 100 kW oxy-coal combustion furnace
The top section (Figure 4, Figure 5) is the burner zone, with dimensions of 0.610 m I.D., 0.914 m O.D. and 1.219 m in height. It is insulated by 2600 fiberboard with a thickness of 76 mm. The burner zone is heated electrically by 24 × 840 W flanged ceramic plate heaters (3 rows and 8 heaters per row, as shown in Figure 2). Each row of heaters is embedded with K-type thermocouples to control or monitor the temperature. The independent control of wall temperature provides another degree of freedom, which may impact PC ignition or flame attachment/detachment during the combustion process.
Three layers of insulation are installed in the downstream radiant zone: 1900 fiberboard (thickness of 51 mm), 2600 fiberboard (thickness of 76 mm), and 700 ultra green castable refractory(thickness of 127 mm). Two layers of insulation are installed in the convective zone: 2600 fiberboard (thickness of 76 mm), and 700 ultra green castable refractory (thickness of 51 mm). Eight heat exchangers in the convection section, which allow the simulation of super heaters in an industrial boiler, cool the flue gas before entering the exhaust system. A preheater is also installed to heat the inlet oxidant to temperatures as high as 700 K.
15
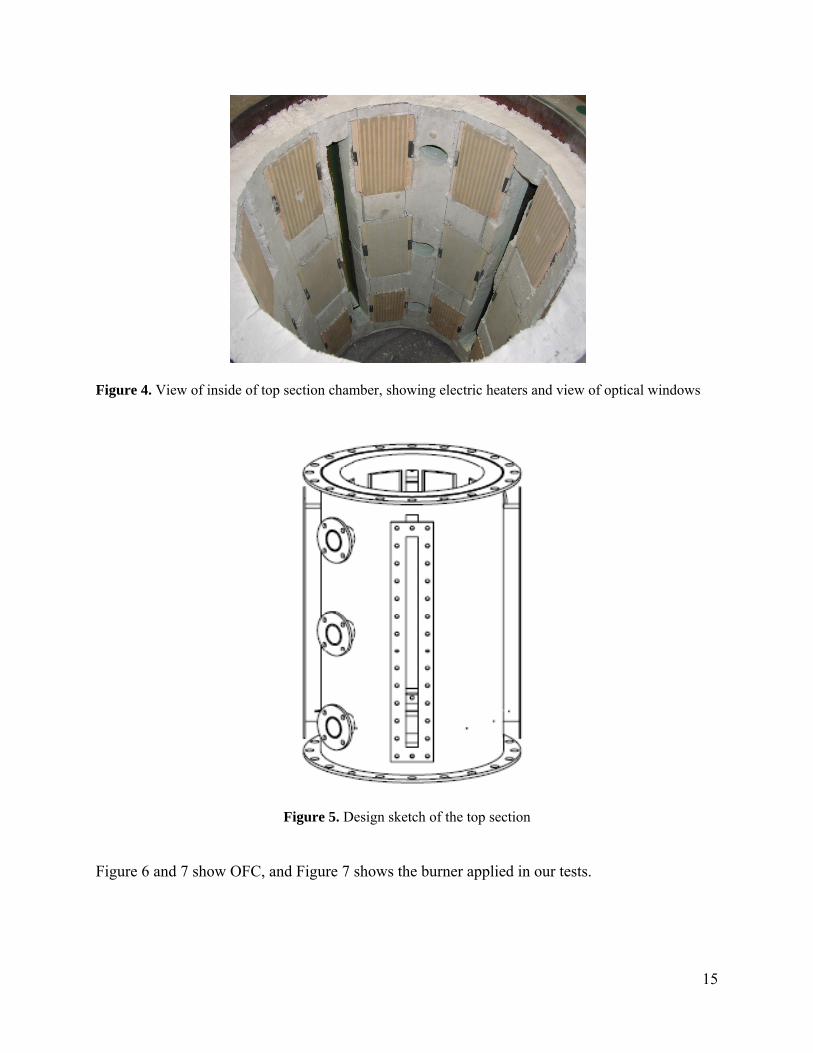
Figure 4. View of inside of top section chamber, showing electric heaters and view of optical windows
Figure 5. Design sketch of the top section
Figure 6 and 7 show OFC, and Figure 7 shows the burner applied in our tests.

16
Figure 6. OFC constructed in University of Utah. Left: top section when burning NG; Right: a whole view
Figure 7. OFC constructed in University of Utah. Left: a picture of the furnace during the test; right: a burner applied
17
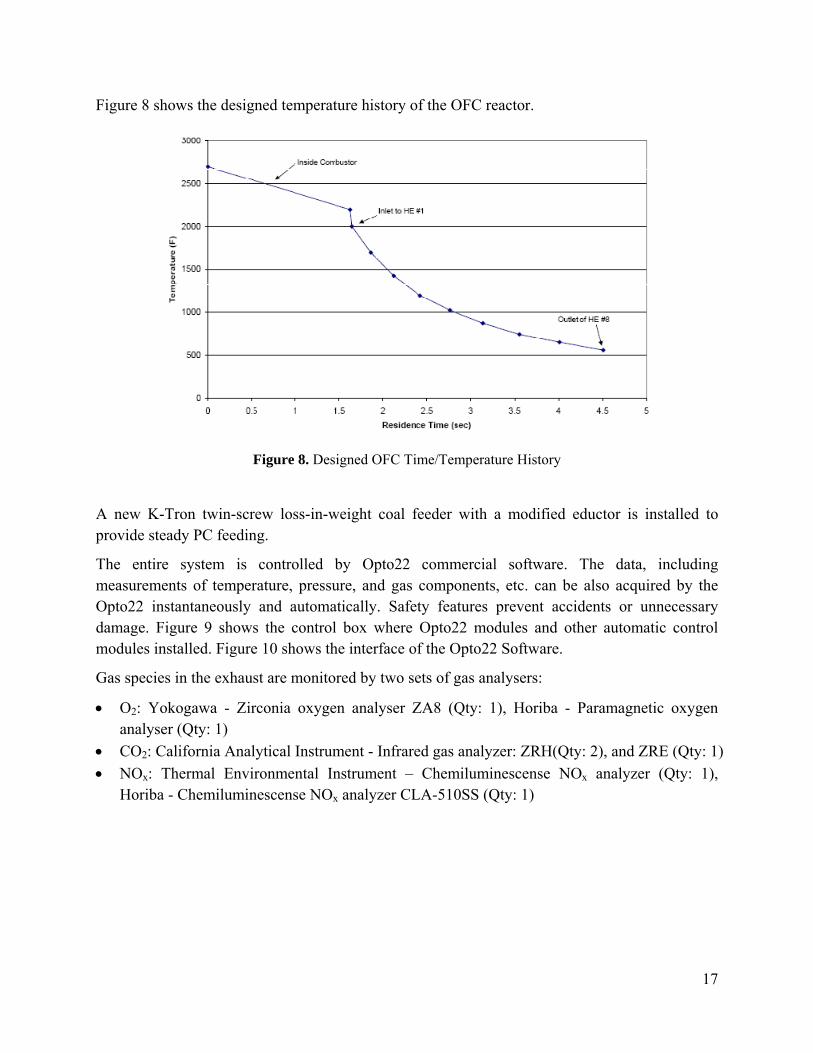
Figure 8 shows the designed temperature history of the OFC reactor.
Figure 8. Designed OFC Time/Temperature History
A new K-Tron twin-screw loss-in-weight coal feeder with a modified eductor is installed to provide steady PC feeding.
The entire system is controlled by Opto22 commercial software. The data, including measurements of temperature, pressure, and gas components, etc. can be also acquired by the Opto22 instantaneously and automatically. Safety features prevent accidents or unnecessary damage. Figure 9 shows the control box where Opto22 modules and other automatic control modules installed. Figure 10 shows the interface of the Opto22 Software.
Gas species in the exhaust are monitored by two sets of gas analysers:
O2: Yokogawa - Zirconia oxygen analyser ZA8 (Qty: 1), Horiba - Paramagnetic oxygen analyser (Qty: 1)
CO2: California Analytical Instrument - Infrared gas analyzer: ZRH(Qty: 2), and ZRE (Qty: 1)
NOx: Thermal Environmental Instrument – Chemiluminescense NOx analyzer (Qty: 1), Horiba - Chemiluminescense NOx analyzer CLA-510SS (Qty: 1)

18
Figure 9. Opto22 Control box
Figure 10. An Opto22 commercial software interface to control our oxy-coal combustor and to acquire the data

19
Preliminary screening tests to validate the equipment and operating envelope under air firing conditions The new oxy-coal combustor was characterized by gas combustion initially. Figure 11 shows a natural gas flame. Characteristic times for the reactor to reach steady state (Table 1), temperature profiles (Tables 2 and 3), and measured exhaust components, including NOx (Tables 4 and 5) have been obtained for various natural gas combustion conditions. These results can help to understand the characteristics of the reactor. The effect of variations in the wall temperature was also investigated (Table 3). Wall temperatures can be adjusted as an independent variable, using the electric heaters in the burner chamber wall, and comprises another degree of freedom for controlling the jet ignition process in the combustor.
Figure 11. A natural flame applied to characterize the combustor
Table 1. Time required to reach steady state under different natural gas firing rates Change of condition
Depart from Destination Time needed (hours)
Room temperature 16.1 kW, SR=1.50 12 16.1 kW, SR=1.50 16.1 kW, SR=1.15 1 Flame off, T = 783 K 29.9 kW, SR=1.50 5 29.9 kW, SR=1.50 29.9 kW, SR=1.15 2 29.9 kW, SR=1.15 38.4 kW, SR=1.47 2 38.4 kW, SR=1.47 38.4 kW, SR=1.15 2 38.4 kW, SR=1.15 31.4 kW, SR=1.50 5 31.4 kW, SR=1.50 16.1 kW, SR=1.50 6

20
The results shown in Table 1 suggest that the design was successful, and the furnace materials performed well, such that unsteady thermal behavior did not last for unreasonably long times. Table 2 shows how wall and gas temperatures, with heaters off, depend on firing rate. Top, mid and bottom refer to 16.5 cm, 57.2 cm, and 97.8 cm, respectively, away from the burner face in the axial direction. They all represent the gas temperatures close to the wall. Table 3 shows effects of external heating at the furnace walls on the measured wall temperatures and measured gas temperatures, at a firing rate of 40.2 kW and a stoichiometric ratio (SR) of 1.15.
Table 2. Typical wall and gas temperatures at different firing rates. Firing rate ( kW )
S.R. Gas Temperature (K) Wall Temperature (K) top middle bottom top middle bottom
17.0 1.15 1001 1004 1005 31.7 1.15 1170 1179 1209 1099/1100 1103 1013/983 41.3 1.13 1231 1240 1266 1169/1169 1172 1089/106617.6 1.50 963 964 985 907/909 905 790/753 31.7 1.50 1118 1125 1155 1051/1052 1051 950/928 33.1 1.50 1129 1136 1166 1061/1063 1061 955/928 41.6 1.72 1139 1145 1174 1071/1073 1067 959/963 31.7 0.89 1186 1195 1223 1125/1125 1129 1062/1027
Table 3. Effect of wall heating on measured gas and wall temperatures at a firing rate of 40.2 kW, and
SR =1.15. Conditions Gas Temperatures (K) Wall Temperatures (K)
top middle bottom top middle bottom Without wall heated 1263 1274 1305 1185 1191 1114 Wall heated to 1200 K 1293 1306 1338 1214 1221 1198 Wall heated to 1228 K 1304 1318 1351 1228 1233 1226 Wall heated to 1255 K 1324 1337 1370 1257 1256 1255 Wall heated to 1283 K 1345 1357 1388 1285 1284 1284 Wall heated to 1311 K 1365 1376 1405 1311 1312 1312
Table 4. Exhaust components measured in the end of convection zone when burning natural gas.
Components 16.1 kW SR = 1.11
39.3 kW SR = 1.13
29.5 kW SR = 1.17
31.4 kW SR = 1.50
O2 (v%) 2.8 2.8 3.6 8.7 CO2 (v%) 9.8 9.9 9.4 6.5 CO (ppm) 7 1 1 1 NO (ppm) 65 71.7 70.4 43.8
Table 5. Calculated (from mass balance) values of O2 and CO2 when burning natural gas.
Components SR = 1.11 SR = 1.13 SR = 1.15 SR = 1.17 SR = 1.50 O2 (v%) 2.28 2.64 2.99 3.32 7.47 CO2 (v%) 10.59 10.39 10.19 10.00 7.64
21
Table 4 shows exhaust gas measurements at the end of convection zone when burning natural gas. NO emissions are similar to what might be expected for unpreheated gas flames and consist of only thermal NO (from N2 fixation). Table 4 shows calculated O2 and CO2 values for the same conditions measured and reported in Table 5. The comparison suggests that there may be a very slight leak of air either into the system, or into the sampling line, due to the slightly negative operating pressure of the reactor.
These natural gas tests showed that data gleaned from this furnace had good reproducibility. The system reached a steady thermal state fairly rapidly, and the allowable load that kept wall temperatures below the electric heater danger point was determined. The reactor is well-designed and well-built. It is also well-insulated to prevent heat loss and well-sealed to prevent leaking.
The next step of preliminary tests involved firing PC with air or oxygen enhanced air. Temperature profiles, exhaust components, and flame stand-off distances were measured during the tests. According to the temperature history, in order to protect wall heaters, coal firing rate started at 4.3 lb/hr (1.95 kg/hr). Wall temperature plays an important role in PC ignition. Moreover, increasing wall temperatures also helps with the flame attachment. For the conditions of 1.95 kg/hr coal feeding rate, S.R. of 1.15, and wall temperatures fixed at 1366 K, the corresponding gas temperatures are (from top to bottom at the same locations as noted in Table 3): 1393 K, 1400 K, and 1405 K. The typical exhaust components (at air-fired condition) measured are: O2 2.88 v%, CO2 15.97 v%, CO 17 ppm, NO 363 ppm, and NO2 21 ppm. Comparing with the calculated results for exhaust components based on measured feed rates (O2 2.78 v%, CO2 16.27 v%), the mass balance is enclosed.
Systematic experimental tests were performed to understand the effect of partial pressure of oxygen (PO2) in secondary stream on coal jet ignition under an oxy-enhanced environment. During the tests the following parameters were fixed:
S.R. = 1.15 = 0.15 primary air + 1.00 secondary air
Coal feeding rate = 1.95 kg/hr
Wall temperature = 1361 K
Secondary stream preheat temperature = 589 K
The following parameters are varied: velocities of both primary air and secondary air, especially the ratios of primary stream velocity (vp) vs. secondary air velocity (vs) to test the burner design.
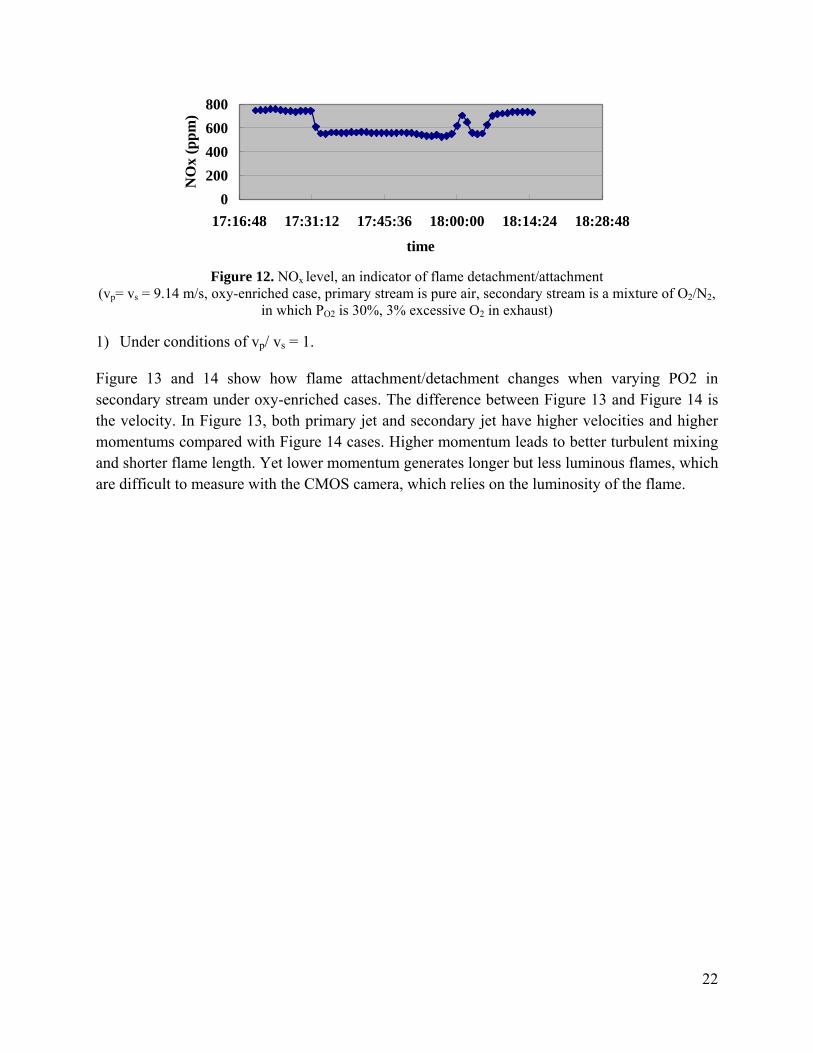
During the tests, gas species in the exhaust are monitored to ensure the mass balance of the reaction. NOx, as an indicator of flame attachment or mixing process, is measured to help monitor the stability of the flame. For instance, Figure 12 shows how NOx concentration drops and rises, when flame turns from detached to attached, then detached again.
22
Figure 12. NOx level, an indicator of flame detachment/attachment (vp= vs = 9.14 m/s, oxy-enriched case, primary stream is pure air, secondary stream is a mixture of O2/N2,
in which PO2 is 30%, 3% excessive O2 in exhaust)
1) Under conditions of vp/ vs = 1.
Figure 13 and 14 show how flame attachment/detachment changes when varying PO2 in secondary stream under oxy-enriched cases. The difference between Figure 13 and Figure 14 is the velocity. In Figure 13, both primary jet and secondary jet have higher velocities and higher momentums compared with Figure 14 cases. Higher momentum leads to better turbulent mixing and shorter flame length. Yet lower momentum generates longer but less luminous flames, which are difficult to measure with the CMOS camera, which relies on the luminosity of the flame.
0
200
400
600
800
17:16:48 17:31:12 17:45:36 18:00:00 18:14:24 18:28:48
time
NO
x (p
pm
)

23
Figure 13. Different flame shape under different PO2 in secondary stream when vp= vs = 9.14 m/s. (a – 30% O2 in secondary stream; b – 24% O2 in secondary stream; c – 21% O2 in secondary stream; d - 30% O2 in secondary stream; e – 21% O2 in secondary stream) Primary streams are all air and secondary streams are
mixtures of O2 and N2.
2) Under conditions of vp/ vs = 0.5 (vp = 4.57 m/s; vs = 9.14 m/s).
Detached flames are always observed when primary jet momentum is higher than secondary jet momentum, it is difficult for secondary oxidant to diffuse to the primary coal jet to help ignition in the near-burner zone. Therefore, the coal jet must travel a longer time to be well mixed with the secondary oxidant.
24
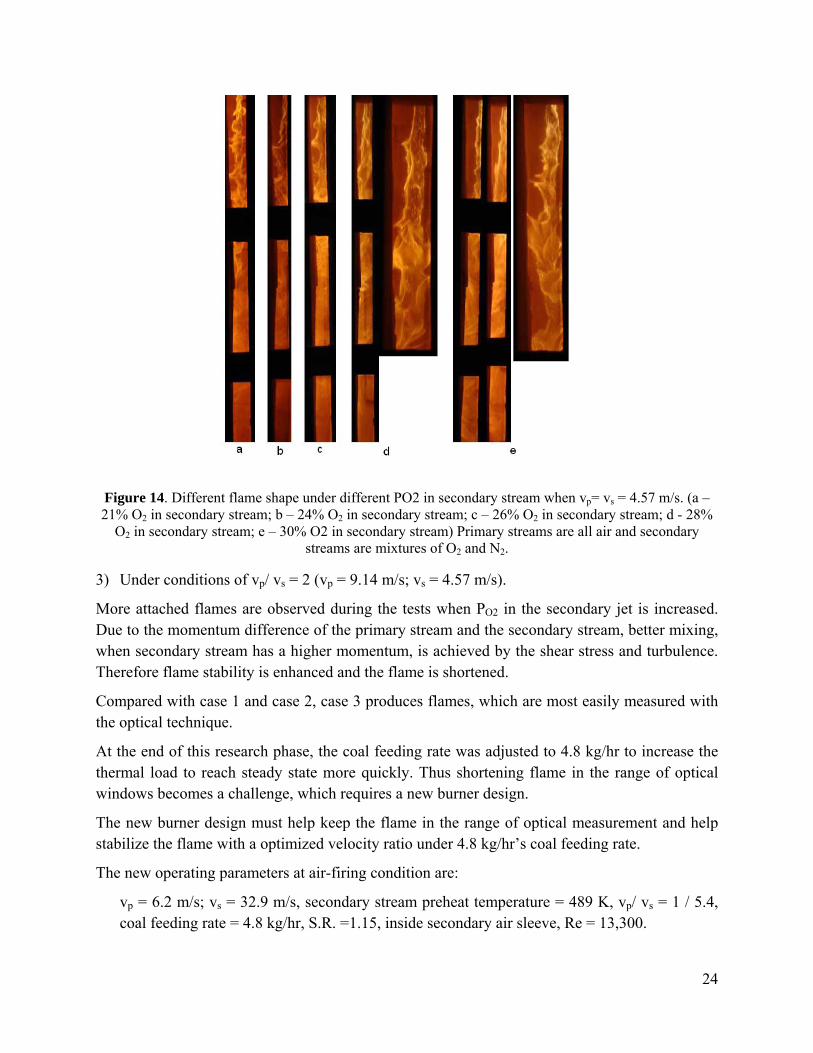
Figure 14. Different flame shape under different PO2 in secondary stream when vp= vs = 4.57 m/s. (a – 21% O2 in secondary stream; b – 24% O2 in secondary stream; c – 26% O2 in secondary stream; d - 28%
O2 in secondary stream; e – 30% O2 in secondary stream) Primary streams are all air and secondary streams are mixtures of O2 and N2.
3) Under conditions of vp/ vs = 2 (vp = 9.14 m/s; vs = 4.57 m/s).
More attached flames are observed during the tests when PO2 in the secondary jet is increased. Due to the momentum difference of the primary stream and the secondary stream, better mixing, when secondary stream has a higher momentum, is achieved by the shear stress and turbulence. Therefore flame stability is enhanced and the flame is shortened.
Compared with case 1 and case 2, case 3 produces flames, which are most easily measured with the optical technique.
At the end of this research phase, the coal feeding rate was adjusted to 4.8 kg/hr to increase the thermal load to reach steady state more quickly. Thus shortening flame in the range of optical windows becomes a challenge, which requires a new burner design.
The new burner design must help keep the flame in the range of optical measurement and help stabilize the flame with a optimized velocity ratio under 4.8 kg/hr’s coal feeding rate.
The new operating parameters at air-firing condition are:
vp = 6.2 m/s; vs = 32.9 m/s, secondary stream preheat temperature = 489 K, vp/ vs = 1 / 5.4, coal feeding rate = 4.8 kg/hr, S.R. =1.15, inside secondary air sleeve, Re = 13,300.
25
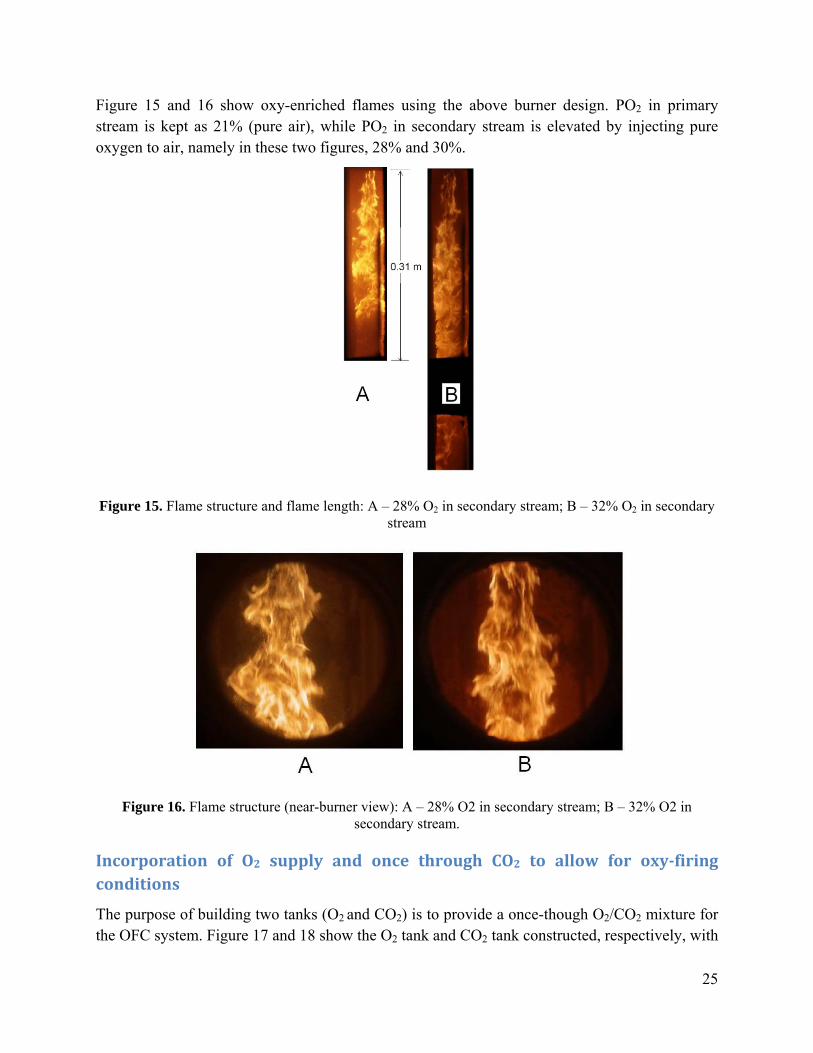
Figure 15 and 16 show oxy-enriched flames using the above burner design. PO2 in primary stream is kept as 21% (pure air), while PO2 in secondary stream is elevated by injecting pure oxygen to air, namely in these two figures, 28% and 30%.
Figure 15. Flame structure and flame length: A – 28% O2 in secondary stream; B – 32% O2 in secondary stream
Figure 16. Flame structure (near-burner view): A – 28% O2 in secondary stream; B – 32% O2 in secondary stream.
Incorporation of O2 supply and once through CO2 to allow for oxyfiring conditions
The purpose of building two tanks (O2 and CO2) is to provide a once-though O2/CO2 mixture for the OFC system. Figure 17 and 18 show the O2 tank and CO2 tank constructed, respectively, with

26
the help of Praxair Inc. As shown in figure 22, a large vaporizer was constructed to vaporize the liquid oxygen. To accomplish this research phase, two years of effort and much professional staff time were required.
Figure 17. Praxair O2 tank (capacity: 6,000 gallon)
Figure 18. Praxair CO2 tank 3 (capacity: 400 gallon)
Establishment of steady coal feeding conditions through coal feeder modifications
Coal feeding is a critical factor in this research. Unsteady feeding can cause the following problems:
27
1) Coal feeding is not uniform.
2) The flame fluctuates heavily because of the poor feeding, instead of the nature of turbulent coal flame itself.
3) The gas components in exhaust vary due to the coal feed pulsing. PC is difficult to fully combust. Oxygen concentration measured in the exhaust does not agree with the calculated one.
4) Flame stability studies cannot be carried on due to the large error introduced by the unsteady coal feeding.
To ensure a steady PC feeding, numerous technical details are summarized here:
1) Any large pressure drop in the primary coal jet line downstream of coal feeder should be avoided.
2) Vibration of eductor can help improve the coal feeding. However it is not viable when the eductor is attached to a loss-in-weight coal feeder because vibration is harmful for the loss-in-weight function, which monitors the mass loss on the scale and adjust the feeding instantaneously and automatically.
3) The selection of the coal feeder should match its optimum working range. A PC feeder works best at 40% to 60% motor’s range. In general, 1000 rpm is the best choice for uniform feeding. However higher rpms can cause PC stick in the feeder outlet. Therefore 1000 rpm is the optimal for motor speed.
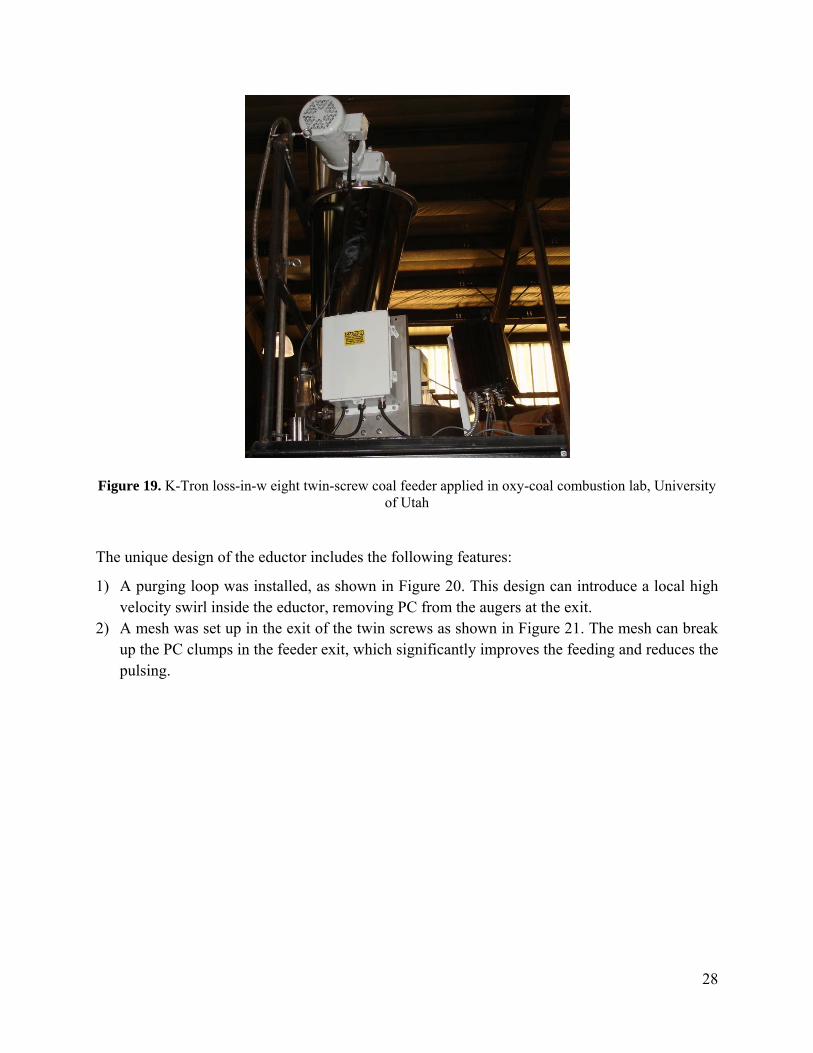
4) A twin-screw loss-in-weight feeder (Figure 19) works better than a single-screw non-loss-in-weight feeder.
5) An agitator installed in the hopper can prevent bridging when feeding coal. 6) An optimized design of an eductor.
28
Figure 19. K-Tron loss-in-w eight twin-screw coal feeder applied in oxy-coal combustion lab, University of Utah
The unique design of the eductor includes the following features:
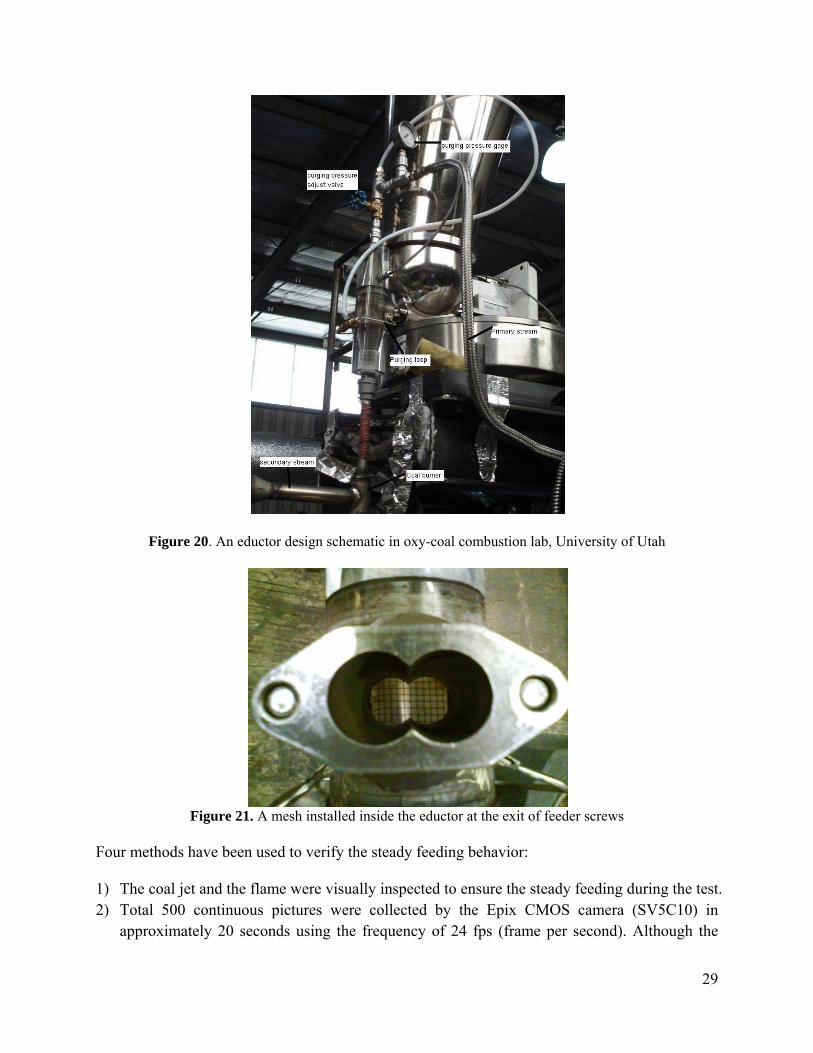
1) A purging loop was installed, as shown in Figure 20. This design can introduce a local high velocity swirl inside the eductor, removing PC from the augers at the exit.
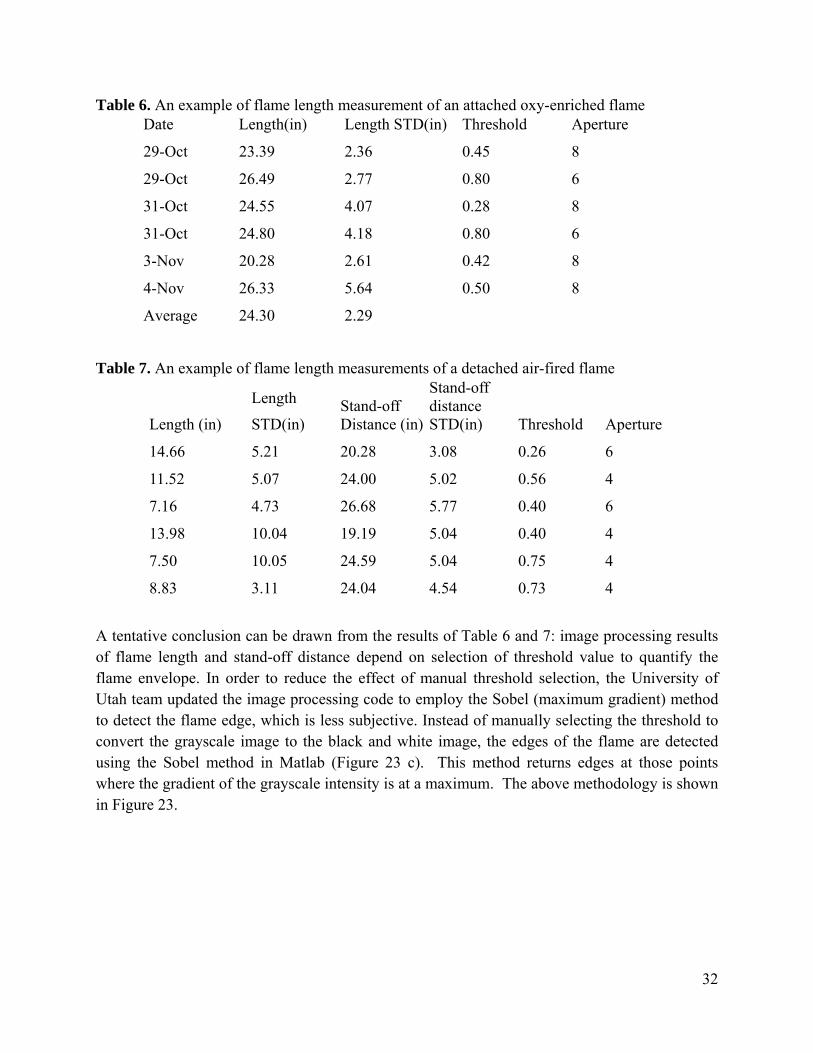
2) A mesh was set up in the exit of the twin screws as shown in Figure 21. The mesh can break up the PC clumps in the feeder exit, which significantly improves the feeding and reduces the pulsing.
29
Figure 20. An eductor design schematic in oxy-coal combustion lab, University of Utah
Figure 21. A mesh installed inside the eductor at the exit of feeder screws
Four methods have been used to verify the steady feeding behavior:
1) The coal jet and the flame were visually inspected to ensure the steady feeding during the test. 2) Total 500 continuous pictures were collected by the Epix CMOS camera (SV5C10) in
approximately 20 seconds using the frequency of 24 fps (frame per second). Although the

30
fluctuating nature of the flame is observed in the pictures, the relatively steady flame shape was also captured in each picture, which indicates steady feeding behavior.
3) O2, CO2, and NOx level in the exhaust were all monitored during the test. Mass balance was obtained. The O2 level matched the results of theoretical calculation and was always steady under different running conditions.
4) Loss-on-ignition (LOI) ash samples were collected during the combustion, and a high conversion rate of the carbon is always observed, which shows full combustion of coal particles, and which will not be expected during the unsteady feeding process.
Development of photoimaging technique to allow quantification of flame stability
A special CMOS sensor based camera, which is more sensitive to the near infrared wavelength (response: 1.4 V/lux-sec (550nm)), captures Type 0 axial turbulent diffusion flame shape for statistical studies of stand-off distance at different operational parameters, such as systematic variations of partial oxygen pressure in both transport and secondary oxidant stream. Statistical analysis is used to understand the effect of oxygen partial pressure in both the transport and the secondary stream on coal jet ignition and flame stability. Ultimately the statistics help to generate PDFs, which can be used to evaluate the experiment precision and to validate simulation models.
Because inserting a probe in the near-burner zone influences Type 0 PC flame and coal jet ignition, detailed 2D temperature profiles and gas component concentrations are difficult to measure. Therefore, to quantify the flame stability, novel optical measurements and an image processing technique have been developed.
The image processing work began with comparing XCAP-standard commercial software package of EPIX Inc. and MatLab code developed in house. Figure 22 shows the comparison of the results from the different codes. All the pictures have been rotated 90 degrees from the real down-fired orientation (left represents the top, while right represents the bottom). The top picture is over exposed on purpose to test the codes under extreme conditions. The middle picture shows the result of the first version MatLab code developed by oxy-coal combustion group in University of Utah. The bottom one shows the result by using Epix XCAP-standard software from the camera manufacture. The results show that even under extreme conditions, both the MatLab code and XCAP-standard commercial software can quantify the flame envelope reasonably well. Due to the unfriendly interface and limited ability to process large image sets of XCAP-standard, the University of Utah team developed their own MatLab code.

31
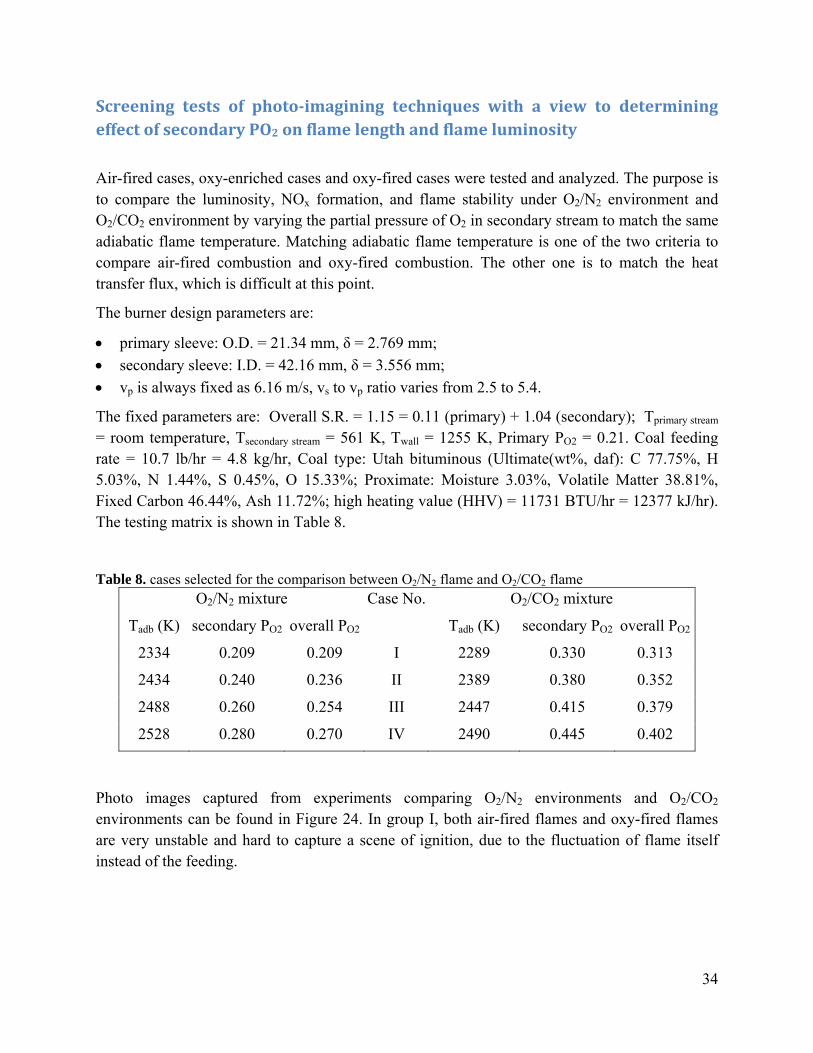
Figure 22. Results of image processing using MatLab and XCAP. Table 6 shows an example of flame length measurement of an attached oxy-enriched flame, with PO2 in secondary stream = 0.28. Table 7 shows an example of stand-off distance and flame length measurements of a detached air-fired flame. In both tables, length means the luminous zone length, while STD represents standard deviation of the measurements. Threshold values range between 0 and 1, and these were manually selected.
32
Table 6. An example of flame length measurement of an attached oxy-enriched flame Date Length(in) Length STD(in) Threshold Aperture
29-Oct 23.39 2.36 0.45 8
29-Oct 26.49 2.77 0.80 6
31-Oct 24.55 4.07 0.28 8
31-Oct 24.80 4.18 0.80 6
3-Nov 20.28 2.61 0.42 8
4-Nov 26.33 5.64 0.50 8
Average 24.30 2.29
Table 7. An example of flame length measurements of a detached air-fired flame
Length (in)
Length
STD(in) Stand-off Distance (in)
Stand-off distance STD(in) Threshold Aperture
14.66 5.21 20.28 3.08 0.26 6
11.52 5.07 24.00 5.02 0.56 4
7.16 4.73 26.68 5.77 0.40 6
13.98 10.04 19.19 5.04 0.40 4
7.50 10.05 24.59 5.04 0.75 4
8.83 3.11 24.04 4.54 0.73 4
A tentative conclusion can be drawn from the results of Table 6 and 7: image processing results of flame length and stand-off distance depend on selection of threshold value to quantify the flame envelope. In order to reduce the effect of manual threshold selection, the University of Utah team updated the image processing code to employ the Sobel (maximum gradient) method to detect the flame edge, which is less subjective. Instead of manually selecting the threshold to convert the grayscale image to the black and white image, the edges of the flame are detected using the Sobel method in Matlab (Figure 23 c). This method returns edges at those points where the gradient of the grayscale intensity is at a maximum. The above methodology is shown in Figure 23.

33
Figure 23. Procedures of flame image processing: (a) original image, (b) image converted to grayscale, (c) edge detection using the Sobel method, (d) image converted to black and white using the threshold calculated from the Sobel method, (e) measurement of image statistics: stand-off distance (if any), flame length, and intensity within flame envelope.
During the PC ignition process, the sequences of images of flames are taken by a CMOS sensor based camera with at least 24 fps. Then all the images are analyzed by the MatLab code. This code can automatically analyze the following parameters: a) average intensity of the whole image b) average intensity within the flame envelope c) visible flame length(luminous zone) d) mean stand-off distance e) stand-off distance in the centerline f) total area of the flame g) number of blobs h) flame width at different locations
34
Screening tests of photoimagining techniques with a view to determining effect of secondary PO2 on flame length and flame luminosity
Air-fired cases, oxy-enriched cases and oxy-fired cases were tested and analyzed. The purpose is to compare the luminosity, NOx formation, and flame stability under O2/N2 environment and O2/CO2 environment by varying the partial pressure of O2 in secondary stream to match the same adiabatic flame temperature. Matching adiabatic flame temperature is one of the two criteria to compare air-fired combustion and oxy-fired combustion. The other one is to match the heat transfer flux, which is difficult at this point.
The burner design parameters are:
primary sleeve: O.D. = 21.34 mm, δ = 2.769 mm;
secondary sleeve: I.D. = 42.16 mm, δ = 3.556 mm;
vp is always fixed as 6.16 m/s, vs to vp ratio varies from 2.5 to 5.4.
The fixed parameters are: Overall S.R. = 1.15 = 0.11 (primary) + 1.04 (secondary); Tprimary stream = room temperature, Tsecondary stream = 561 K, Twall = 1255 K, Primary PO2 = 0.21. Coal feeding rate = 10.7 lb/hr = 4.8 kg/hr, Coal type: Utah bituminous (Ultimate(wt%, daf): C 77.75%, H 5.03%, N 1.44%, S 0.45%, O 15.33%; Proximate: Moisture 3.03%, Volatile Matter 38.81%, Fixed Carbon 46.44%, Ash 11.72%; high heating value (HHV) = 11731 BTU/hr = 12377 kJ/hr). The testing matrix is shown in Table 8.
Table 8. cases selected for the comparison between O2/N2 flame and O2/CO2 flame O2/N2 mixture Case No. O2/CO2 mixture
Tadb (K) secondary PO2 overall PO2 Tadb (K) secondary PO2 overall PO2
2334 0.209 0.209 I 2289 0.330 0.313
2434 0.240 0.236 II 2389 0.380 0.352
2488 0.260 0.254 III 2447 0.415 0.379
2528 0.280 0.270 IV 2490 0.445 0.402
Photo images captured from experiments comparing O2/N2 environments and O2/CO2
environments can be found in Figure 24. In group I, both air-fired flames and oxy-fired flames are very unstable and hard to capture a scene of ignition, due to the fluctuation of flame itself instead of the feeding.
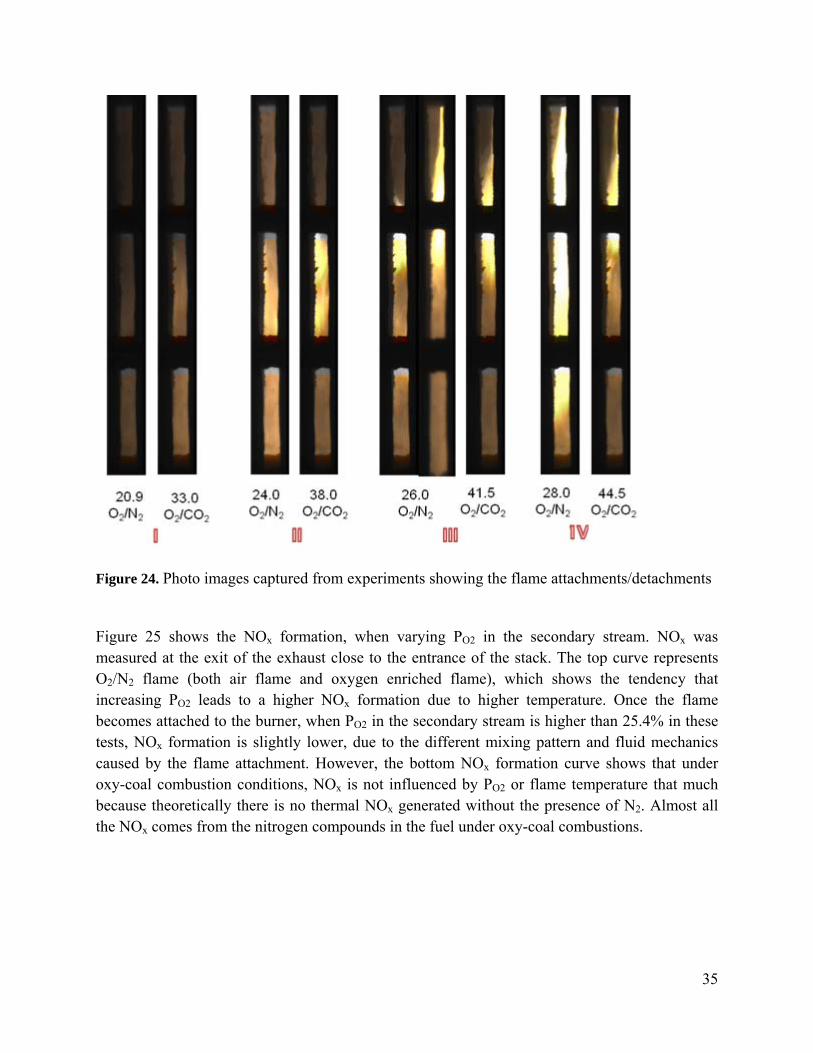
35
Figure 24. Photo images captured from experiments showing the flame attachments/detachments
Figure 25 shows the NOx formation, when varying PO2 in the secondary stream. NOx was measured at the exit of the exhaust close to the entrance of the stack. The top curve represents O2/N2 flame (both air flame and oxygen enriched flame), which shows the tendency that increasing PO2 leads to a higher NOx formation due to higher temperature. Once the flame becomes attached to the burner, when PO2 in the secondary stream is higher than 25.4% in these tests, NOx formation is slightly lower, due to the different mixing pattern and fluid mechanics caused by the flame attachment. However, the bottom NOx formation curve shows that under oxy-coal combustion conditions, NOx is not influenced by PO2 or flame temperature that much because theoretically there is no thermal NOx generated without the presence of N2. Almost all the NOx comes from the nitrogen compounds in the fuel under oxy-coal combustions.

36
Figure 25. Comparison of NOx formation under O2/N2 environment and O2/CO2 environment (red and blue numbers show PO2 in percentage in secondary stream of each case, PO2 in transport stream is always
20.9%)
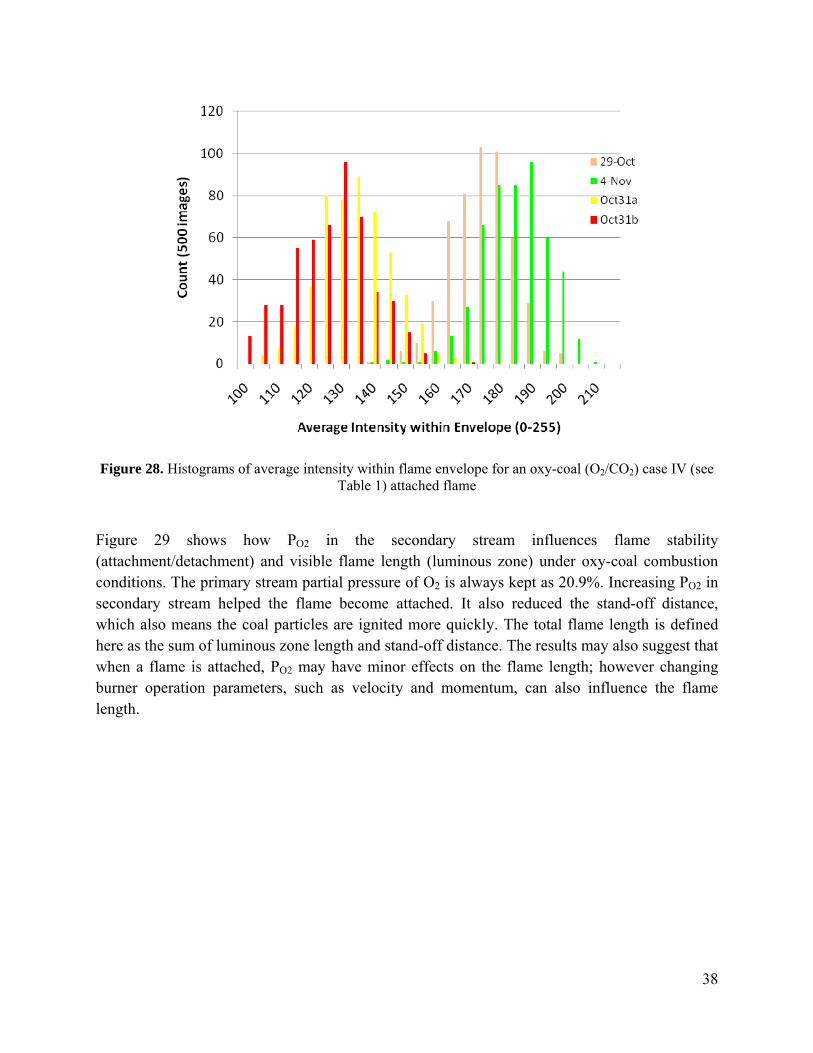
Figure 26 shows the comparison of the average flame luminosity over the entire image between an O2/CO2 flame and an O2/N2 flame. Flame luminosity, often related to soot formation in the flame, is of interest if one assumes flame luminosity is proportional to the flame intensity. Consequently when matching adiabatic flame temperature, an O2/CO2 flame tends to be more luminous than an O2/N2 flame, which is contrary to the experimental observations. To improve the methodology, a new concept of “average intensity within a flame envelope” has been developed. Figure 27 and 28 show the histograms of average intensity within the flame envelope for an O2/N2 flame and an O2/CO2 flame. The results show that for case IV in Table 8, when an O2/N2 flame and an O2/CO2 flame with an approximately matched adiabatic flame temperature are both attached, an oxy-coal flame is less luminous than an oxygen-enriched flame. This result may indicate that under oxy-coal combustion conditions, less soot is expected.

37
Figure 26. Comparison of relative flame luminosity between O2/N2 environment and O2/CO2 environment
Figure 27. Histograms of average intensity within flame envelope for an oxygen enriched (O2/N2) case IV(see Table 1) attached flame
38
Figure 28. Histograms of average intensity within flame envelope for an oxy-coal (O2/CO2) case IV (see Table 1) attached flame
Figure 29 shows how PO2 in the secondary stream influences flame stability (attachment/detachment) and visible flame length (luminous zone) under oxy-coal combustion conditions. The primary stream partial pressure of O2 is always kept as 20.9%. Increasing PO2 in secondary stream helped the flame become attached. It also reduced the stand-off distance, which also means the coal particles are ignited more quickly. The total flame length is defined here as the sum of luminous zone length and stand-off distance. The results may also suggest that when a flame is attached, PO2 may have minor effects on the flame length; however changing burner operation parameters, such as velocity and momentum, can also influence the flame length.

39
Figure 29. Flame length vs PO2 in secondary stream under oxy-coal combustion conditions
Final studies on effects of PO2 in the primary coal jet on flame standoff distance, and other data for simulation studies
a) Statistical studies
Under more realistic operating condition, experimental data are often noisy due to operator inconsistency, limitations in instrumentation accuracy, coal feeding rates, etc. Because of the turbulent nature of flame in addition, it is always fluctuating. Therefore two questions need to be addressed:
1) How to quantify the accuracy/error of the experiments? 2) How to quantify the reproducibility of the experiments?
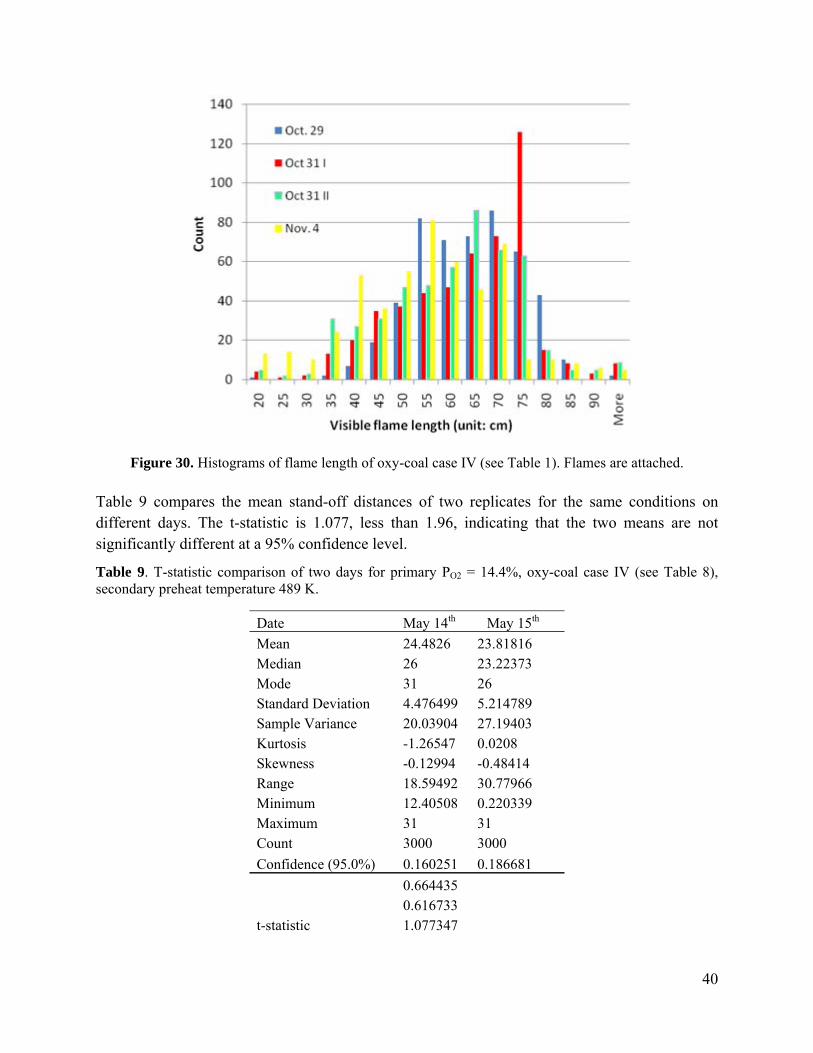
Figure 29 expresses average values with error bars. With a goal of providing validation data for large eddy simulation (LES) model development, the precision and accuracy of the OFC experiments are critical. Statistical analyses were performed to begin to quantify the accuracy, the error and the reproducibility of the experiments. For instance, Figure 30 shows the histograms of visible flame length of oxy-coal case IV (see Table 8, an attached flame). Ultimately the histograms will be used to generate PDFs, which will be used for LES model validation to quantify the model precision. Figure 30 also shows a good repeatability of the experiments.
40
Figure 30. Histograms of flame length of oxy-coal case IV (see Table 1). Flames are attached. Table 9 compares the mean stand-off distances of two replicates for the same conditions on different days. The t-statistic is 1.077, less than 1.96, indicating that the two means are not significantly different at a 95% confidence level.
Table 9. T-statistic comparison of two days for primary PO2 = 14.4%, oxy-coal case IV (see Table 8), secondary preheat temperature 489 K.
Date May 14th May 15th
Mean 24.4826 23.81816Median 26 23.22373Mode 31 26Standard Deviation 4.476499 5.214789Sample Variance 20.03904 27.19403Kurtosis -1.26547 0.0208Skewness -0.12994 -0.48414Range 18.59492 30.77966Minimum 12.40508 0.220339Maximum 31 31Count 3000 3000
Confidence (95.0%) 0.160251 0.186681
0.6644350.616733
t-statistic 1.077347
41
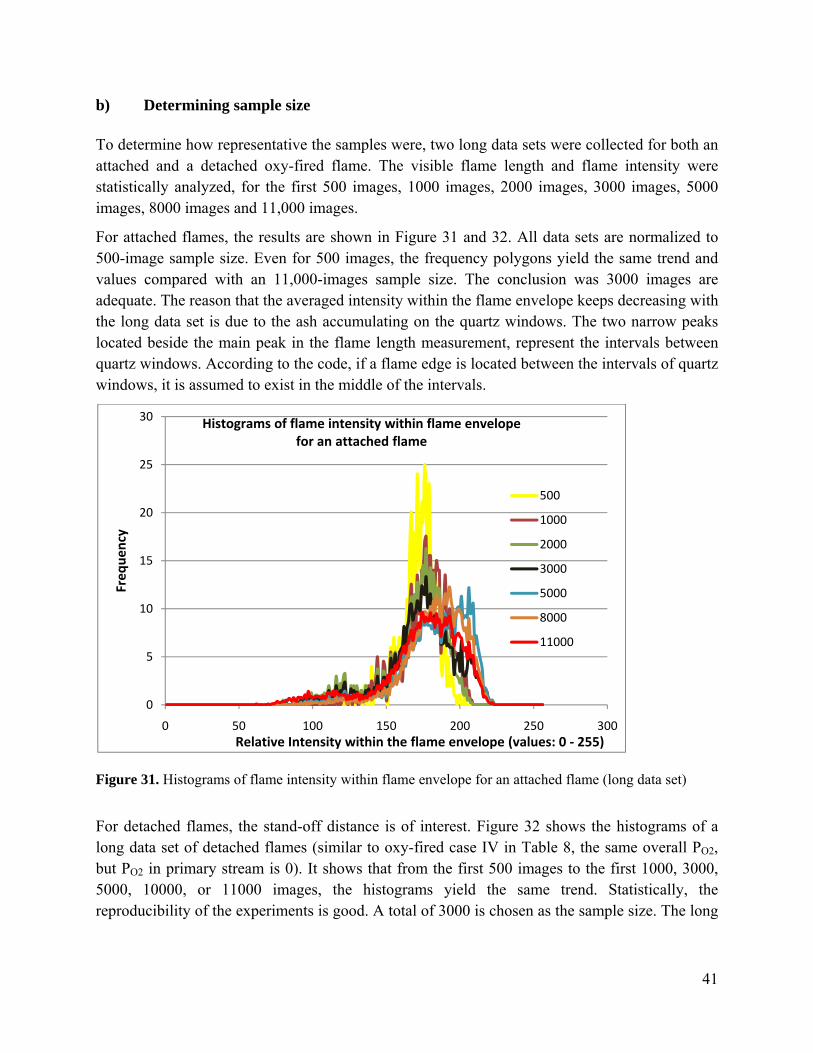
b) Determining sample size To determine how representative the samples were, two long data sets were collected for both an attached and a detached oxy-fired flame. The visible flame length and flame intensity were statistically analyzed, for the first 500 images, 1000 images, 2000 images, 3000 images, 5000 images, 8000 images and 11,000 images.
For attached flames, the results are shown in Figure 31 and 32. All data sets are normalized to 500-image sample size. Even for 500 images, the frequency polygons yield the same trend and values compared with an 11,000-images sample size. The conclusion was 3000 images are adequate. The reason that the averaged intensity within the flame envelope keeps decreasing with the long data set is due to the ash accumulating on the quartz windows. The two narrow peaks located beside the main peak in the flame length measurement, represent the intervals between quartz windows. According to the code, if a flame edge is located between the intervals of quartz windows, it is assumed to exist in the middle of the intervals.
Figure 31. Histograms of flame intensity within flame envelope for an attached flame (long data set)
For detached flames, the stand-off distance is of interest. Figure 32 shows the histograms of a long data set of detached flames (similar to oxy-fired case IV in Table 8, the same overall PO2, but PO2 in primary stream is 0). It shows that from the first 500 images to the first 1000, 3000, 5000, 10000, or 11000 images, the histograms yield the same trend. Statistically, the reproducibility of the experiments is good. A total of 3000 is chosen as the sample size. The long
0
5
10
15
20
25
30
0 50 100 150 200 250 300
Frequency
Relative Intensity within the flame envelope (values: 0 ‐ 255)
Histograms of flame intensity within flame envelope for an attached flame
500
1000
2000
3000
5000
8000
11000

42
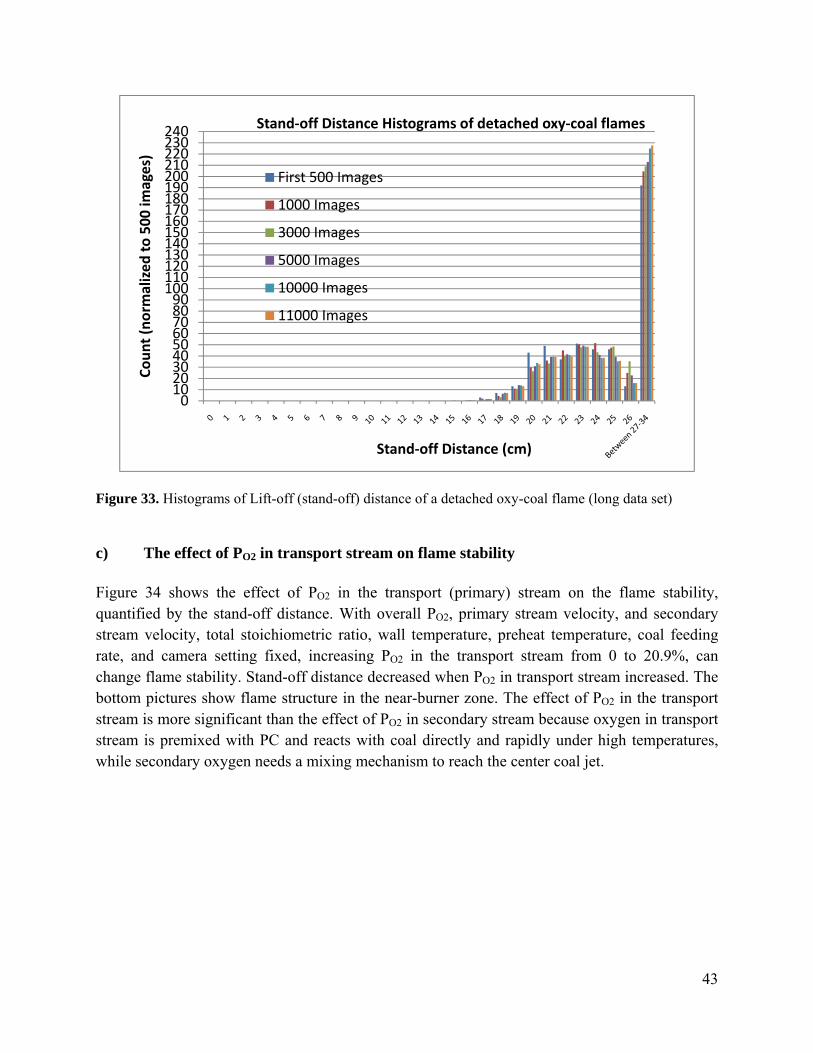
bars in the right of Figure 33 show the counts of flames starting in the interval between the top and the middle quartz windows, accounting for approximately 40% of the images.
Figure 32. Histograms of flame length for an attached flame (long data set)
0
5
10
15
20
25
30
35
0 500 1000 1500 2000 2500
Frequency
Flame length (unit: pixels)
Flame length histograms for an attached flame
500
1000
2000
3000
5000
8000
11000
43
Figure 33. Histograms of Lift-off (stand-off) distance of a detached oxy-coal flame (long data set)
c) The effect of PO2 in transport stream on flame stability Figure 34 shows the effect of PO2 in the transport (primary) stream on the flame stability, quantified by the stand-off distance. With overall PO2, primary stream velocity, and secondary stream velocity, total stoichiometric ratio, wall temperature, preheat temperature, coal feeding rate, and camera setting fixed, increasing PO2 in the transport stream from 0 to 20.9%, can change flame stability. Stand-off distance decreased when PO2 in transport stream increased. The bottom pictures show flame structure in the near-burner zone. The effect of PO2 in the transport stream is more significant than the effect of PO2 in secondary stream because oxygen in transport stream is premixed with PC and reacts with coal directly and rapidly under high temperatures, while secondary oxygen needs a mixing mechanism to reach the center coal jet.
0102030405060708090100110120130140150160170180190200210220230240
Count (norm
alized to 500 im
ages)
Stand‐off Distance (cm)
Stand‐off Distance Histograms of detached oxy‐coal flames
First 500 Images
1000 Images
3000 Images
5000 Images
10000 Images
11000 Images

44
Figure 34. The effect of PO2 in transport stream on flame stability and near-burner flame structure PO2 in transport stream = 0 0.099 0.144 0.207
d) The PDF of stand-off distance to quantify the effect of PO2 in transport stream on coal jet flame stability
A PDF of stand-off distance is computed by,
1
where :
:
The integration of probability density function of stand-off distance should be unity, which is, 1,
where :
45
:
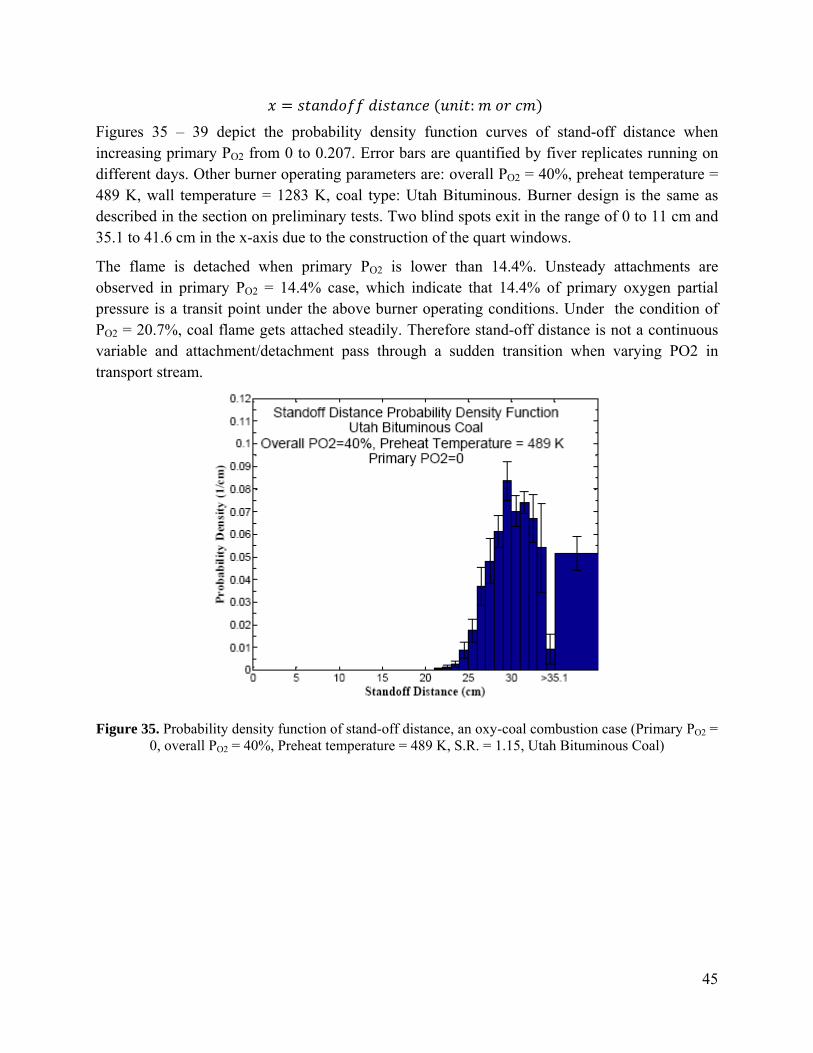
Figures 35 – 39 depict the probability density function curves of stand-off distance when increasing primary PO2 from 0 to 0.207. Error bars are quantified by fiver replicates running on different days. Other burner operating parameters are: overall PO2 = 40%, preheat temperature = 489 K, wall temperature = 1283 K, coal type: Utah Bituminous. Burner design is the same as described in the section on preliminary tests. Two blind spots exit in the range of 0 to 11 cm and 35.1 to 41.6 cm in the x-axis due to the construction of the quart windows.
The flame is detached when primary PO2 is lower than 14.4%. Unsteady attachments are observed in primary PO2 = 14.4% case, which indicate that 14.4% of primary oxygen partial pressure is a transit point under the above burner operating conditions. Under the condition of PO2 = 20.7%, coal flame gets attached steadily. Therefore stand-off distance is not a continuous variable and attachment/detachment pass through a sudden transition when varying PO2 in transport stream.
Figure 35. Probability density function of stand-off distance, an oxy-coal combustion case (Primary PO2 = 0, overall PO2 = 40%, Preheat temperature = 489 K, S.R. = 1.15, Utah Bituminous Coal)

46
Figure 36. Probability density function of stand-off distance, an oxy-coal combustion case (Primary PO2 = 0.054, overall PO2 = 40%, Preheat temperature = 489 K, S.R. = 1.15, Utah Bituminous Coal)
Figure 37. Probability density function of stand-off distance, an oxy-coal combustion case (Primary PO2 = 0.099, overall PO2 = 40%, Preheat temperature = 489 K, S.R. = 1.15, Utah Bituminous Coal)

47
Figure 38. Probability density function of stand-off distance, an oxy-coal combustion case (Primary PO2 = 0.144, overall PO2 = 40%, Preheat temperature = 489 K, S.R. = 1.15, Utah Bituminous Coal)
Figure 39. Probability density function of stand-off distance, an oxy-coal combustion case (Primary PO2 = 0.207, overall PO2 = 40%, Preheat temperature = 489 K, S.R. = 1.15, Utah Bituminous Coal)
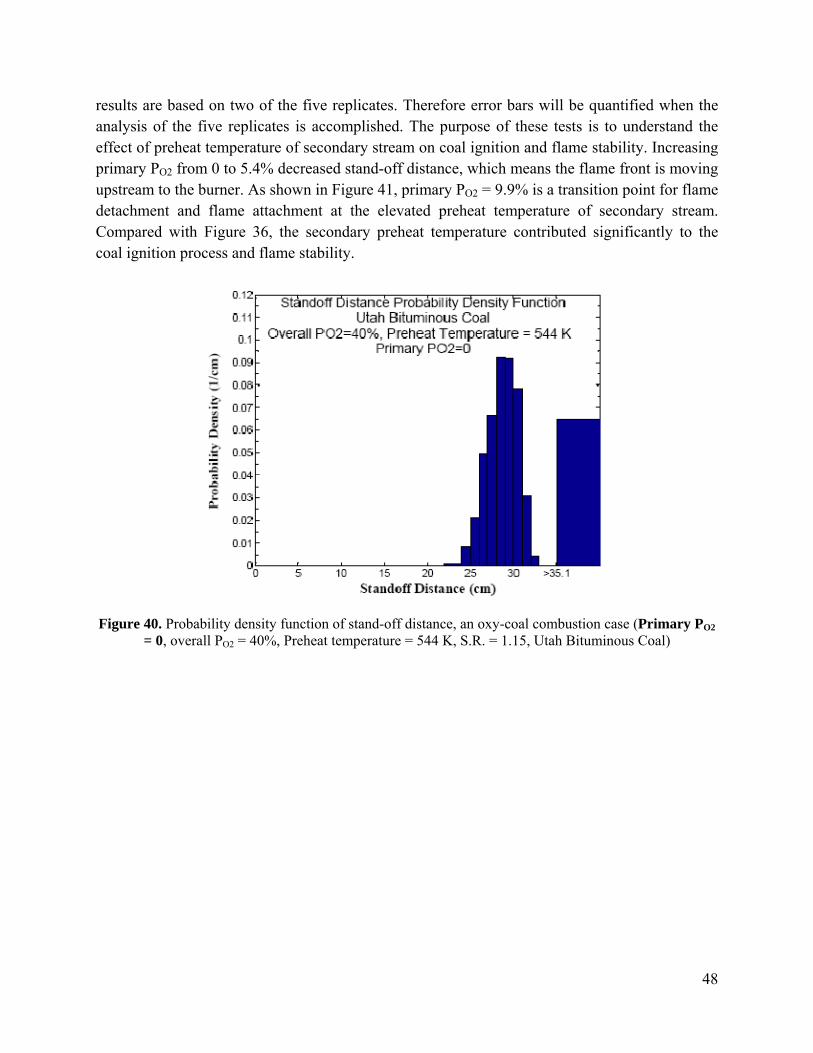
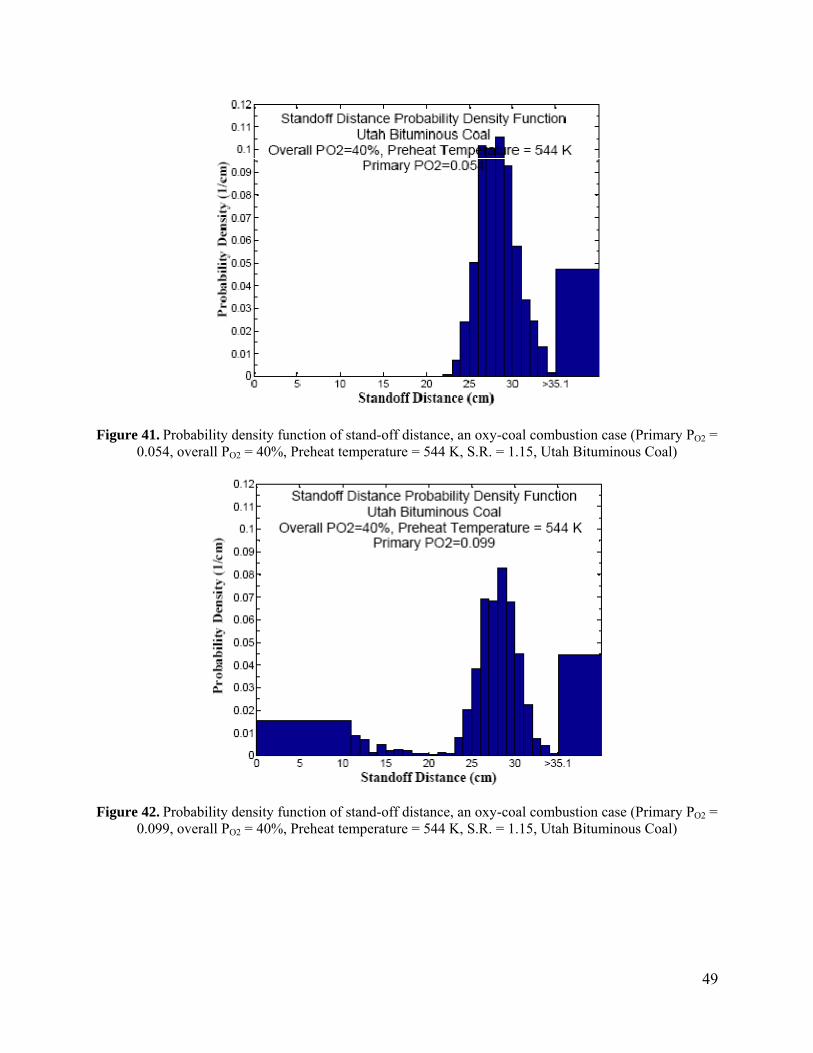
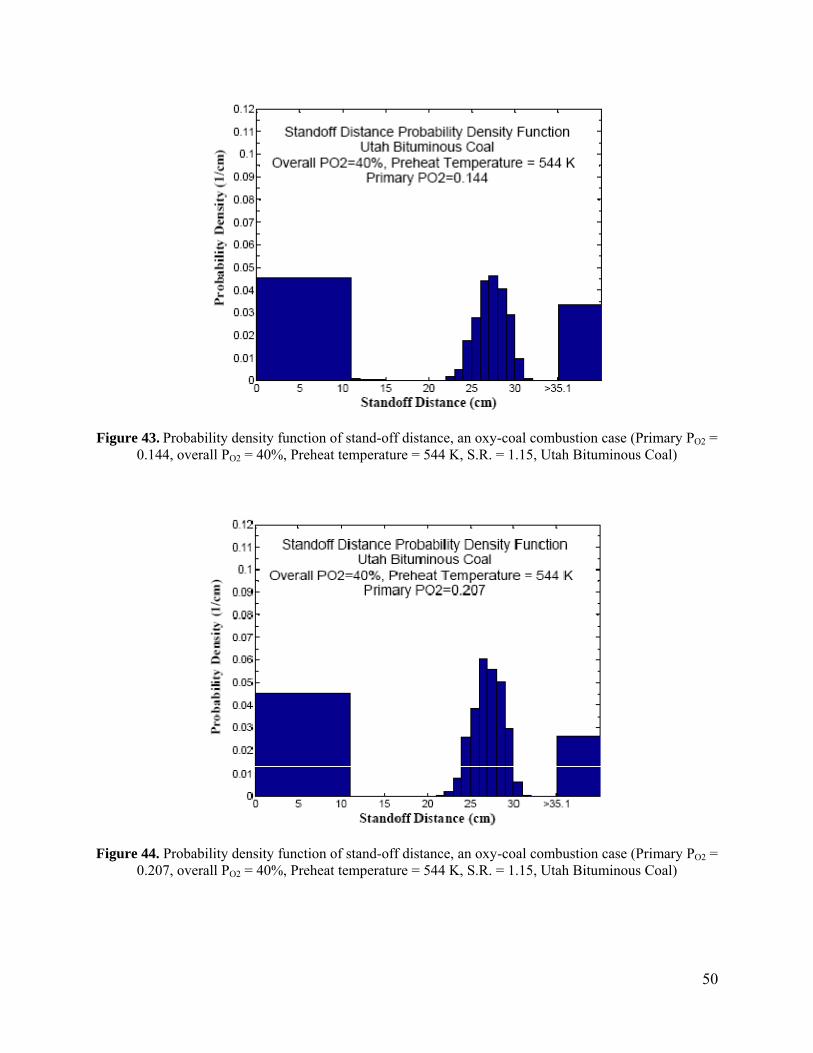
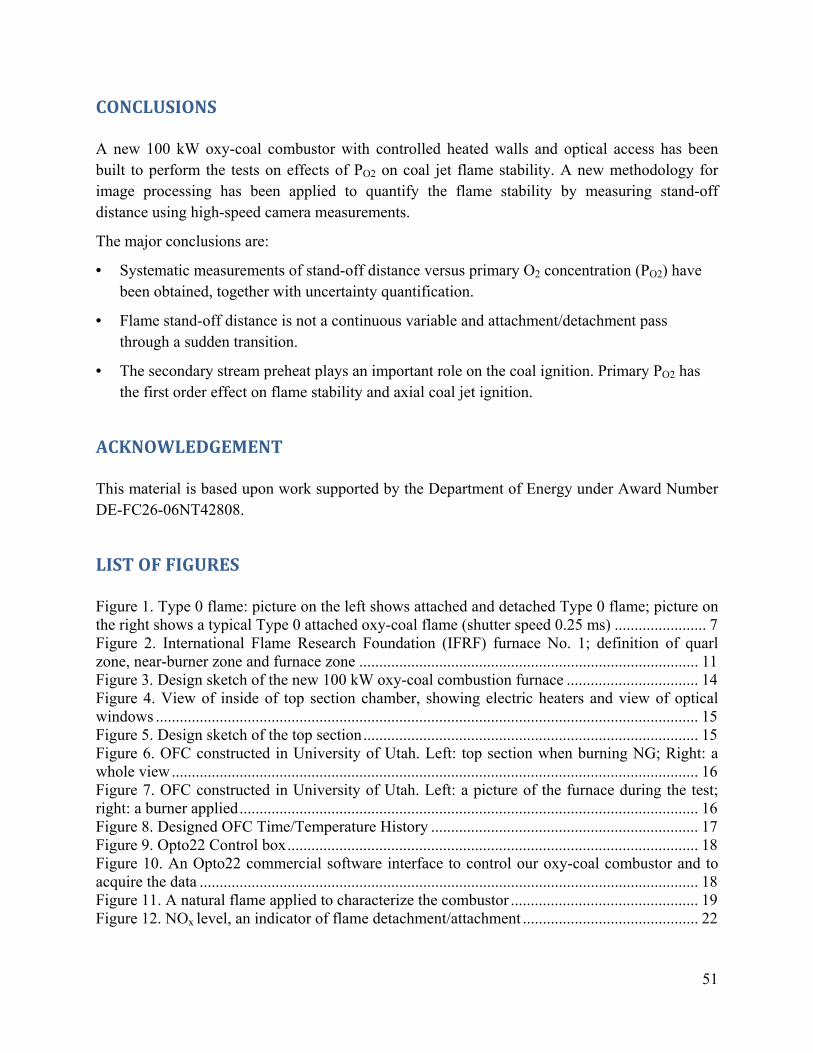
Figure 40 – 44 show probability density function curves of stand-off distance when varying primary PO2 from 0 to 20.7% at a higher secondary stream preheat temperature (544K). The
48
results are based on two of the five replicates. Therefore error bars will be quantified when the analysis of the five replicates is accomplished. The purpose of these tests is to understand the effect of preheat temperature of secondary stream on coal ignition and flame stability. Increasing primary PO2 from 0 to 5.4% decreased stand-off distance, which means the flame front is moving upstream to the burner. As shown in Figure 41, primary PO2 = 9.9% is a transition point for flame detachment and flame attachment at the elevated preheat temperature of secondary stream. Compared with Figure 36, the secondary preheat temperature contributed significantly to the coal ignition process and flame stability.
Figure 40. Probability density function of stand-off distance, an oxy-coal combustion case (Primary PO2 = 0, overall PO2 = 40%, Preheat temperature = 544 K, S.R. = 1.15, Utah Bituminous Coal)
49
Figure 41. Probability density function of stand-off distance, an oxy-coal combustion case (Primary PO2 = 0.054, overall PO2 = 40%, Preheat temperature = 544 K, S.R. = 1.15, Utah Bituminous Coal)
Figure 42. Probability density function of stand-off distance, an oxy-coal combustion case (Primary PO2 = 0.099, overall PO2 = 40%, Preheat temperature = 544 K, S.R. = 1.15, Utah Bituminous Coal)
50
Figure 43. Probability density function of stand-off distance, an oxy-coal combustion case (Primary PO2 = 0.144, overall PO2 = 40%, Preheat temperature = 544 K, S.R. = 1.15, Utah Bituminous Coal)
Figure 44. Probability density function of stand-off distance, an oxy-coal combustion case (Primary PO2 = 0.207, overall PO2 = 40%, Preheat temperature = 544 K, S.R. = 1.15, Utah Bituminous Coal)
51
CONCLUSIONS
A new 100 kW oxy-coal combustor with controlled heated walls and optical access has been built to perform the tests on effects of PO2 on coal jet flame stability. A new methodology for image processing has been applied to quantify the flame stability by measuring stand-off distance using high-speed camera measurements.
The major conclusions are:
• Systematic measurements of stand-off distance versus primary O2 concentration (PO2) have been obtained, together with uncertainty quantification.
• Flame stand-off distance is not a continuous variable and attachment/detachment pass through a sudden transition.
• The secondary stream preheat plays an important role on the coal ignition. Primary PO2 has the first order effect on flame stability and axial coal jet ignition.
ACKNOWLEDGEMENT
This material is based upon work supported by the Department of Energy under Award Number DE-FC26-06NT42808.
LIST OF FIGURES
Figure 1. Type 0 flame: picture on the left shows attached and detached Type 0 flame; picture on the right shows a typical Type 0 attached oxy-coal flame (shutter speed 0.25 ms) ....................... 7 Figure 2. International Flame Research Foundation (IFRF) furnace No. 1; definition of quarl zone, near-burner zone and furnace zone ..................................................................................... 11 Figure 3. Design sketch of the new 100 kW oxy-coal combustion furnace ................................. 14 Figure 4. View of inside of top section chamber, showing electric heaters and view of optical windows ........................................................................................................................................ 15 Figure 5. Design sketch of the top section .................................................................................... 15 Figure 6. OFC constructed in University of Utah. Left: top section when burning NG; Right: a whole view .................................................................................................................................... 16 Figure 7. OFC constructed in University of Utah. Left: a picture of the furnace during the test; right: a burner applied ................................................................................................................... 16 Figure 8. Designed OFC Time/Temperature History ................................................................... 17 Figure 9. Opto22 Control box ....................................................................................................... 18 Figure 10. An Opto22 commercial software interface to control our oxy-coal combustor and to acquire the data ............................................................................................................................. 18 Figure 11. A natural flame applied to characterize the combustor ............................................... 19 Figure 12. NOx level, an indicator of flame detachment/attachment ............................................ 22

52
Figure 13. Different flame shape under different PO2 in secondary stream when vp= vs = 9.14 m/s. (a – 30% O2 in secondary stream; b – 24% O2 in secondary stream; c – 21% O2 in secondary stream; d - 30% O2 in secondary stream; e – 21% O2 in secondary stream) Primary streams are all air and secondary streams are mixtures of O2 and N2. ............................................................. 23 Figure 14. Different flame shape under different PO2 in secondary stream when vp= vs = 4.57 m/s. (a – 21% O2 in secondary stream; b – 24% O2 in secondary stream; c – 26% O2 in secondary stream; d - 28% O2 in secondary stream; e – 30% O2 in secondary stream) Primary streams are all air and secondary streams are mixtures of O2 and N2. ............................................................. 24 Figure 15. Flame structure and flame length: A – 28% O2 in secondary stream; B – 32% O2 in secondary stream ........................................................................................................................... 25 Figure 16. Flame structure (near-burner view): A – 28% O2 in secondary stream; B – 32% O2 in secondary stream. .......................................................................................................................... 25 Figure 17. Praxair O2 tank (capacity: 6,000 gallon) ..................................................................... 26 Figure 18. Praxair CO2 tank 3 (capacity: 400 gallon) ................................................................... 26 Figure 19. K-Tron loss-in-w eight twin-screw coal feeder applied in oxy-coal combustion lab, University of Utah ......................................................................................................................... 28 Figure 20. An eductor design schematic in oxy-coal combustion lab, University of Utah .......... 29 Figure 21. A mesh installed inside the eductor at the exit of feeder screws ................................. 29 Figure 22. Results of image processing using MatLab and XCAP. ............................................. 31 Figure 23. Procedures of flame image processing: (a) original image, (b) image converted to grayscale, (c) edge detection using the Sobel method, (d) image converted to black and white using the threshold calculated from the Sobel method, (e) measurement of image statistics: stand-off distance (if any), flame length, and intensity within flame envelope. .................................... 33 Figure 24. Photo images captured from experiments showing the flame attachments/detachments....................................................................................................................................................... 35 Figure 25. Comparison of NOx formation under O2/N2 environment and O2/CO2 environment (red and blue numbers show PO2 in percentage in secondary stream of each case, PO2 in transport stream is always 20.9%) ............................................................................................................... 36 Figure 26. Comparison of relative flame luminosity between O2/N2 environment and O2/CO2 environment .................................................................................................................................. 37 Figure 27. Histograms of average intensity within flame envelope for an oxygen enriched (O2/N2) case IV(see Table 1) attached flame ............................................................................................. 37 Figure 28. Histograms of average intensity within flame envelope for an oxy-coal (O2/CO2) case IV (see Table 1) attached flame .................................................................................................... 38 Figure 29. Flame length vs PO2 in secondary stream under oxy-coal combustion conditions ...... 39 Figure 30. Histograms of flame length of oxy-coal case IV (see Table 1). Flames are attached. 40 Figure 31. Histograms of flame intensity within flame envelope for an attached flame (long data set) ................................................................................................................................................. 41 Figure 32. Histograms of flame length for an attached flame (long data set) .............................. 42 Figure 33. Histograms of Lift-off (stand-off) distance of a detached oxy-coal flame (long data set)....................................................................................................................................................... 43 Figure 34. The effect of PO2 in transport stream on flame stability and near-burner flame structure......................................................................................................................................... 44 Figure 35. Probability density function of stand-off distance, an oxy-coal combustion case (Primary PO2 = 0, overall PO2 = 40%, Preheat temperature = 489 K, S.R. = 1.15, Utah Bituminous Coal) .............................................................................................................................................. 45
53
Figure 36. Probability density function of stand-off distance, an oxy-coal combustion case (Primary PO2 = 0.054, overall PO2 = 40%, Preheat temperature = 489 K, S.R. = 1.15, Utah Bituminous Coal) .......................................................................................................................... 46 Figure 37. Probability density function of stand-off distance, an oxy-coal combustion case (Primary PO2 = 0.099, overall PO2 = 40%, Preheat temperature = 489 K, S.R. = 1.15, Utah Bituminous Coal) .......................................................................................................................... 46 Figure 38. Probability density function of stand-off distance, an oxy-coal combustion case (Primary PO2 = 0.144, overall PO2 = 40%, Preheat temperature = 489 K, S.R. = 1.15, Utah Bituminous Coal) .......................................................................................................................... 47 Figure 39. Probability density function of stand-off distance, an oxy-coal combustion case (Primary PO2 = 0.207, overall PO2 = 40%, Preheat temperature = 489 K, S.R. = 1.15, Utah Bituminous Coal) .......................................................................................................................... 47 Figure 40. Probability density function of stand-off distance, an oxy-coal combustion case (Primary PO2 = 0, overall PO2 = 40%, Preheat temperature = 544 K, S.R. = 1.15, Utah Bituminous Coal) .............................................................................................................................................. 48 Figure 41. Probability density function of stand-off distance, an oxy-coal combustion case (Primary PO2 = 0.054, overall PO2 = 40%, Preheat temperature = 544 K, S.R. = 1.15, Utah Bituminous Coal) .......................................................................................................................... 49 Figure 42. Probability density function of stand-off distance, an oxy-coal combustion case (Primary PO2 = 0.099, overall PO2 = 40%, Preheat temperature = 544 K, S.R. = 1.15, Utah Bituminous Coal) .......................................................................................................................... 49 Figure 43. Probability density function of stand-off distance, an oxy-coal combustion case (Primary PO2 = 0.144, overall PO2 = 40%, Preheat temperature = 544 K, S.R. = 1.15, Utah Bituminous Coal) .......................................................................................................................... 50 Figure 44. Probability density function of stand-off distance, an oxy-coal combustion case (Primary PO2 = 0.207, overall PO2 = 40%, Preheat temperature = 544 K, S.R. = 1.15, Utah Bituminous Coal) .......................................................................................................................... 50
LIST OF TABLES
Table 1. Time required to reach steady state under different natural gas firing rates ................... 19 Table 2. Typical wall and gas temperatures at different firing rates. ........................................... 20 Table 3. Effect of wall heating on measured gas and wall temperatures at a firing rate of 40.2 kW, and SR =1.15. ........................................................................................................................ 20 Table 4. Exhaust components measured in the end of convection zone when burning natural gas........................................................................................................................................................ 20 Table 5. Calculated (from mass balance) values of O2 and CO2 when burning natural gas. ........ 20 Table 6. An example of flame length measurement of an attached oxy-enriched flame .............. 32 Table 7. An example of flame length measurements of a detached air-fired flame ..................... 32 Table 8. cases selected for the comparison between O2/N2 flame and O2/CO2 flame .................. 34 Table 9. T-statistic comparison of two days for primary PO2 = 14.4%, oxy-coal case IV (see Table 8), secondary preheat temperature 489 K. .......................................................................... 40

54
REFERENCES
[1] B. Metz, et al. IPCC Special Report on Carbon dioxide Capture and Storage. Cambridge University Press, UK, 2007.
[2] D J Dillon, et al. Oxy-Combustion Processes for CO2 capture from advanced supercritical PF and NGCC Power Plant, IEA Greenhouse Gas R&D Program, UK
[3] K. Jordal, et al. Oxyfuel Cobustion for Coal-Fired Power Generation with CO2 Capture – Opportunities and Challenges, Vattenfall, Sweden
[4] Development of Oxy-Coal Combustion for Power Generation Industry Issue Paper, IEA Greenhouse Gas R&D Programme
[5] A. Molina; C. Shaddix. Coal particle ignition and devolatilization during oxygen-enhanced and oxygen/carbon dioxide pulverized coal combustion. 2005 Fall Meeting Western States Section of the Combustion Institute, Stanford, CA, U.S.A., Oct. 17-18, 2005; Paper 05F-20.
[6] A. Molina; C. Shaddix. Effect of O2/CO2-firing on coal particle ignition. 22nd Internationl Pittsburgh Coal Conference, Pittsburgh, PA, U.S.A. Sept. 12-15, 2005; Paper 268.
[7] J. Ballester; S. Jimenez. Kinetic parameters for the oxidation of pulverized coal as measured from drop tube tests. Combustion and Flame 2005, 142, 210-222.
[8] R.H. Essenhigh; M.K. Misra; etc. Ignition of coal particles: a review. Combustion and Flame 1989, 77, 3-30.
[9] H. Karcz; etc. Evaluation of kinetic parameters of coal ignition. Fuel 1980, 59, 799-802.
[10] T.F. Wall; V.S. Gururajan. Combustion kinetics and the heterogeneous ignition of pulverized coal. Combustion and Flame 1986, 66, 151-157.
[11] V.S. Gururajan; T. F. Wall; etc. Mechanisms for the ignition of pulverized coal particles. Combustion and Flame 1990, 81, 119-132.
[12] X.Y Du.; K. Annamalai. Transient ignition of isolated coal particle. Combustion and Flame 1994, 97(3-4), 339-354.
[13] H. Katalambula; J. Hayashi; etc. Dependence of single coal particle ignition mechanism on the surrounding volatile matter cloud. Energy and Fuels 1997, 11(5), 1033-1039.
[14] DK Zhang, Laser-Induced Ignition of Pulverized Fuel Particles, Combustion and Flame 1992, 90: 134 -142
[15] C. L. Sun, et al, Ignition of Coal Particles at High Pressure in a Thermogravimetric Analyzer, Combustion and Flame 1998, 115: 267-274
[16] C. Monson, Char Oxidation at Elevated Pressure, PhD dissertation, BYU, 1992
[17] D. Zeng, Effects of Pressue on Coal Pyrolysis at High Heating Rates and Char Combustion, PhD dissertation, BYU 2005
55
[18] M.C. Zhang, et al., A New Flame Sheet Model to Reflect the Influence of the Oxidation of CO on the Cobustion of a Carbon Particle, Combustion and Flame 2005, 143: 150-158
[19] M.C. Zhang, et al, An Improved Moving Flame Front Model for Combustion of A Carbon Particle with Finite-rate Heterogeneous Oxidation and Reduction, 6th Asia-Pacific Conference on Combustion, Nagoya, Japan, May 2007
[20] M.C. Zhang, et al, Further Discussion on the Reality and Usability of the Moving Flame Front Model for Combustion of A Carbon Particle, 6th Asia-Pacific Conference on Combustion, Nagoya, Japan, May 2007
[21] H. Liu; R. Zailani; B.Gibbs. Comparisons of pulverized coal combustion in air and in mixtures of O2/CO2. Fuel 2005, 84(7-8), 833-840.
[22] Y.Q. Hu; N. Kobayashi; M. Hasatani. The reduction of recycled-NOx in coal combustion with O2/recycled flue gas under low recycling ratio. Fuel 2001, 80(13), 1851-1855.
[23] H. Liu; K. Okazaki. Simultaneous easy CO2 recovery and drastic reduction of SOx and NOx in O2/CO2 coal combustion with heat recirculation. Fuel 2003, 82(11), 1427-1436.
[24] E. Croiset; K.V. Thambimuthu. NOx and SO2 emissions from O2/CO2 recycle coal combustion. Fuel 2001, 80(14), 2117-2121.
[25] K. Okazaki, T. Ando, NOx reduction mechanism in coal combustion with recycled CO2. Energy 1997, 22(2/3):207-215
[26] T. Nozaki, et al, Analysis of the flame formed during oxidation of pulverized coal by an O2-CO2 mixture. Energy 1997, 22(2/3): 199-205
[27] E. Chui, et al, Modeling of oxy-fuel combustion for a western Canadian sub-bituminous coal, Fuel 2003, 82: 1201-1210
[28] E. Chui, et al, Numerical investigation of oxy-coal combustion to evaluate burner and combustor design concepts, Energy 2004, 29: 1285-1296
[29] B.M. Visser; J.P. Smart; etc. Measurements and predictions of quarl zone properties of swirling pulverized coal flames. 23rd Symposium (International) on Combustion/The Combustion Institute, 1990, 949-955.
[30] J.S. Truelove; D. Holcombe. Measurement and modeling of coal flame stability in a pilot-scale combustor. 23rd Symposium (International) on Combustion/The Combustion Institute, 1990, 963-971.
[31] M. Costa; P. Costen; etc. Detailed measurements in and modeling of an industry-type pulverized-coal flame. 23rd Symposium (International) on Combustion/The Combustion Institute, 1990, 973-980.
[32] V.D. Miosavljevic; etc. Stability of pulverized coal burners. 23rd Symposium (International) on Combustion/The Combustion Institute, 1990, 957-962.

56
[33] F. El-Mahallawy, et al, Mixing and nozzle geometry effects on flame structure and stability, MCS 4, Lisbon, Portugal, October 2005
[34] A. Olivani, et al, Near field flow structure of isothermal swirling flows and reacting non-premixed swirling flames, MCS 4, Lisbon, Portugal, October 2005
[35] S.G. Budilarto, 2003. “An experimental study on effects of fluid aerodynamics and particle size distribution in particle-laden jet flows.” Ph.D. Thesis, Purdue University, West Lafayette, IN.
[36] S.G. Budilarto, and J.L. Sinclair, “An experimental study on effect of particle size distribution in particle-laden jet flows”. 2003 Annual AIChE Meeting, San Francisco, CA, November 2003.
[37] P. Heil, et al, Drvelopment of an oxycoal swirl burner operating at low O2 concentrations, Fuel 2009, 88: 1269 -1274
[38] G. Ogden. Pulverized coal combustion: flame attachment and NOx emissions. Ph.D. Thesis, The University of Arizona, 2002.
[39] G. Ogden and J Wendt, Using oxygen enrichment and coal fines to diminish NOx emissions from pulverized coal axial diffusion flames, 2003 AFRC Fall Meeting, Livermore, California, October 2003
[40]M. Holtmeyer, R. Axelbaum, et al, Flame stability in oxygen-enhanced combustion of coal, AIChE Annual Conference, Salt Lake City, UT, November 2007
[41] J. Beer and N. Chigier, Combustion Aerodynamics, Halsted Press Division, John Wiley and Sons, Inc., New York, 1972
[42] M. Field, et al, Combustion of Pulverized Coal, The British Coal Utilisation Research Association, Leatherhead 1967,
[43] L. Smoot and P. Smith, Coal combustion and gasification, Springer, 1 edition, 1985
[44] C. Baukal, Oxygen-Enhance Combustion, Air Products and Chemicals, Inc., Allentown, Pennsylvania, 1998 by CRC Press LLC
[45] D. Purshing, Nitrogen oxide formation in pulverized coal flames, PhD dissertation of University of Arizona, 1978
[46] J. Howard, Mechanisms of ignition and combustion in flames of pulverized bituminous coal, PhD dissertation of The Pennsylvania State University, 1965
[44] J. Smart, The effect of burner scale and coal quality on low NOx burner performance, PhD dissertation of the Imperial College, London, 1992

57
NOMENCLATURE
CCS – carbon capture and sequestration
CMOS - complementary metal–oxide–semiconductor
CO – carbon monoxide
CO2 – carbon dioxide
I.D. – inside diameter
IFRF – International Flame Research Foundation
GI – homogenous gas phase ignition
HI – heterogeneous ignition
Hg – mercury
IMFF – improved moving flame front
LDV – laser Doppler velocimetry
LOI – loss-on-ignition
MFF – moving flame front
N2 – nitrogen
NO – nitric monoxide
NOx – nitrogen oxide
N – total numbers of photo images
ni – frequency of flames starting in the ith bin
O2 - oxygen
O.D. – outside diameter
OFC – oxy-fuel combustion
PC – pulverized coal
PDF – probability density function
PIV – particle image velocimetry
PO2 – partial pressure of oxygen
ρ – probability density function
Re – Reynolds number
SO2 – sulfur dioxide

58
S.R. – Stoichiometric Ratio
STD – standard deviation
δ – wall thickness
vp– primary stream velocity
vs – secondary stream velocity
xi – stand-off distance corresponded to the ith bin