effects of some agronomic practices on the fatty acid
TRANSCRIPT

EFFECTS OF SOME AGRONOMIC PRACTICES ON THE
FA TTY ACID CONTENT AND COMPOSITION
OF TEA LEAVES.
BY
JOHN WAIT ITU MURITU
A thesis subm itted in p a r t fu l f i l lm e n t fo r the Degree o f
Master o f Science in the U n iv e rs i ty o f Na irob i.
1989
IrniTBRSITY OF NAIROBIL1BRARV
Th is thes is is my o r ig in a l w o rk and has not been presen ted
fo r a degree in any o the r U n iv e rs i ty .
JOHN T IT U MURITU
Th is thes is has been subm itted fo r exam ination w ith ou r
app rova l as U n iv e rs i ty S u p e rv iso rs .
PROFESSOR R.M. MUNAVU CHEMISTRY DEPARTMENT UNIVER SITY OF NAIROBI
DR. P.O . OWUOR CHEMISTRY DEPARTMENT TEA RESEARCH FOUNDATION OF KENYA.

DEDICATION
To my fam ily and my pa ren ts

ACKNOWLEDGEMENT
I am v e ry g ra te fu l to Doctor Ph ilip Okinda Owuor
fo r sugges ting the research p ro jec t and Professor Raphael
Munavu fo r a llow ing me to c a r ry ou t the research . Many
thanks to the two s u p e rv is o rs fo r th e ir va luab le suggestions ,
gu idance , adv ice and encouragement d u r in g the e n t i re per iod
I was w o rk in g on th is p ro je c t.
Thanks to Doctor Caleb O. O th ieno D ire c to r Tea Research
Foundation o f Kenya and the A f r ic a n H igh lands Produce
Company l im ited , Kericho fo r accep ting p a r t o f th is w o rk to
be ca r r ie d ou t at th e ir prem ises.
I am deeply indeb ted to the National Council fo r Science
and Techno logy fo r fu n d in g th is p ro je c t .
I ex tend my s incere thanks to all and especia lly the
s ta f f , my colleagues and o th e r members o f the Departm ent o f
C hem is try whose assistance and encouragement d i re c t ly o r
in d ire c t ly c o n t r ib u te d towards the successfu l completion o f
th is w o rk . Special thanks to M rs . Mary Kihara fo r ty p in g
th is thes is .

TABLE OF CONTENTS
PAGE
ACKNOWLEDGEMENT-----------------------------------------------------------------
A B S T R A C T --------------------------------------------------------------------------------- ( " i )
L IST OF TA B LE S ---------------------------------------------------------------------- (v )
CHAPTER ONE: INTRODUCTION
1.0 THE TEA INDUSTRY IN KENYA---------------------------- 1
1.1 THE IMPORTANCE OF Q U A L ITY IN TE A-------------- 3
1.2 ASSESSMENT OF TEA Q U A L IT Y -------------------------- 4
1. 2.1 Assessment o f q u a l i ty by chemical ana lys is ------ 5
1.3 THE IMPORTANCE OF FLAVOUR TO OVERALL
TEA Q U A L IT Y --------------------------------------------------------- 7
1.4 ASPECTS OF THE CHEMISTRY OF LIPIDS AND
FA TTY ACIDS OF TEA LEAVES-------------------------- 11
1.4.1 O ccu rrence --------------------------------------------------------------- ^
1.4 .2 P roduction o f vo la ti les by deg rada t ion o f
l ip id s -------------------------------------------------------------------------- 15
1.5 SOME FACTORS AFFECTING THE CHEMICAL
COMPOSITION AND Q U A L ITY OF CTC BLACK
TE A---------------------------------------------------------------------------- 19
1.5.1 Geographical area o f p ro d u c t io n -------------------------- 19
1.5 .2 Clonal v a r ia t io n s ------------------------------------------------------ 29
1 .5 .3 N itrogenous fe r t i l i z e r s ------------------------------------------- 21
1 .5 .4 P luck ing s ta n d a rd s ------------------------------------------------ 22
1 .5 .5 P ru n in g -------------------------------------------------------------------- 2^
1.6 OBJECTIVE OF THIS STUDY------------------------------- 24
• ( i )

PAGE
CHAPTER TWO: RESULTS AND DISCUSSION
2.0 ID E N T IF IC A T IO N OF THE F A T T Y ACIDS OF
TEA LEAVES--------------------------------------------------------------- 26
2.1 CLONAL DIFFERENCES AND GEOGRAPHICAL
AREA OF PRODUCTIO N------------------------------------------ 30
2.2 EFFECTS OF NITROGENOUS FERTIL IZER S-------- 47
2.3 EFFECTS OF PLUCKING STANDARDS AND THE
D IS T R IB U T IO N OF F A TTY ACIDS IN TEA
LEAVES------------------------------------------------------------------------ 52
2.4 EFFECTS OF PRUNING ON THE FA TTY ACID
CONTENT OF TEA LEAVES------------------------------------- 57
CHAPTER THREE: EXPERIMENTAL SECTION
3.0 _ GENERAL*REVIEW------------------------------------------------------ 51
3.1 M ATE R IALS----------------------------------------------------------------- 54
3.1.1 Clonal d i f fe rences and geograph ica l area o f
p ro d u c t io n ------------------------------------------------------------------- 54
3 .1 .2 E ffects o f n i trogenous fe r t i l i z e r s -------------------------- 55
3 .1 .3 E ffects o f p lu c k in g s ta n d a rd s -------------------------------- 55
3 .1 .4 E ffects o f p r u n in g ---------------------------------------------------- 56
3.2 LEAF TREATMENT AND CHEMICAL A N A LY S IS - 56
3.2 .1 E x tra c t io n p ro c e d u re ---------------------------------------------- 57
3 .2 .2 P u r i f ica t io n o f the l ip id e x t ra c ts -------------------------- 57
3 .2 .3 P repara tion o f FAMES--------------------------------------------- 57
3 .2 .4 A na lys is o f FAMES by GLC------------------------------------ 68
3 .2 .5 Id e n t i f ic a t io n and q u a n t i f ic a t io n ---------------------------- 69
REFERENCES------------------------------------------------------------- 71
APPENDIX------------------------------------------------------------------- 88
( i i )
( i i i )
ABSTR AC T
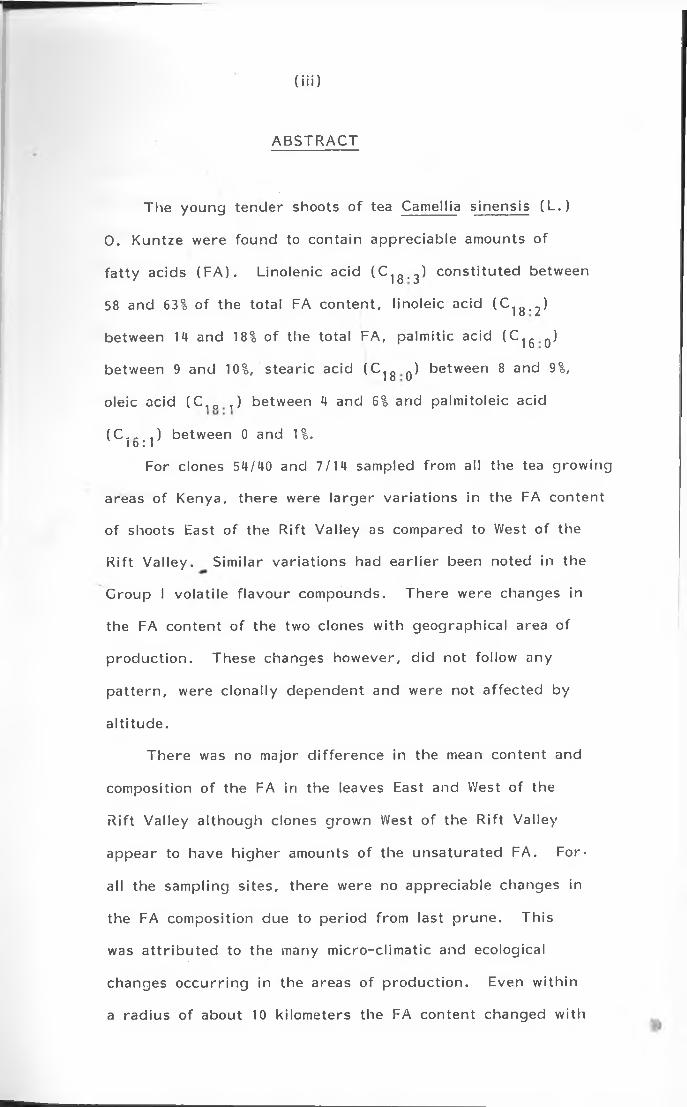
The young ten d e r shoots o f tea Camellia s inensis ( L . )
0 . Kuntze were found to conta in apprec iab le amounts o f
fa t ty acids (F A ) . L ino lenic acid ( C ig>3) co n s t i tu te d between
58 and 63% o f the to ta l FA co n te n t , lino le ic acid ( C ^ g . j )
between 14 and 18% o f the tota l FA, pa lm itic acid ( C ^ ^)
between 9 and 10%, s tear ic acid ( C 1 g Q ) between 8 and 9%,
oleic acid ( C 1Q 1) between 4 and 6% and palm ito le ic acid
( C . - . ) between 0 and 1%. l o l l
For clones 54/40 and 7/14 sampled from all the tea g row ing
areas o f Kenya, the re were la rg e r v a r ia t io ns in the FA con ten t
o f shoots East o f the R if t Va lley as compared to West o f the
R if t V a lle y . S imilar va r ia t io ns had e a r l ie r been noted in the
G roup I vo la t i le f la v o u r compounds. The re were changes in
the FA con ten t o f the two clones w ith geograph ica l area o f
p ro d u c t io n . These changes however, d id not follow any
p a t te rn , were c lona lly dependent and were not a ffec ted by
a l t i tu d e .
The re was no major d i f fe re n c e in the mean con ten t and
composition o f the FA in the leaves East and West o f the
R if t Va lley a lthough clones g row n West o f the R if t Va lley
appear to have h ig h e r amounts o f the unsa tu ra ted FA. For-
all the sampling s ites , the re were no apprec iab le changes in
the FA composition due to per iod from last p ru n e . Th is
was a t t r ib u te d to the many m ic ro -c l im a tic and ecological
changes o c c u r r in g in the areas o f p ro d u c t io n . Even w ith in
a rad ius o f about 10 kilom eters the FA con ten t changed w ith
( i v )
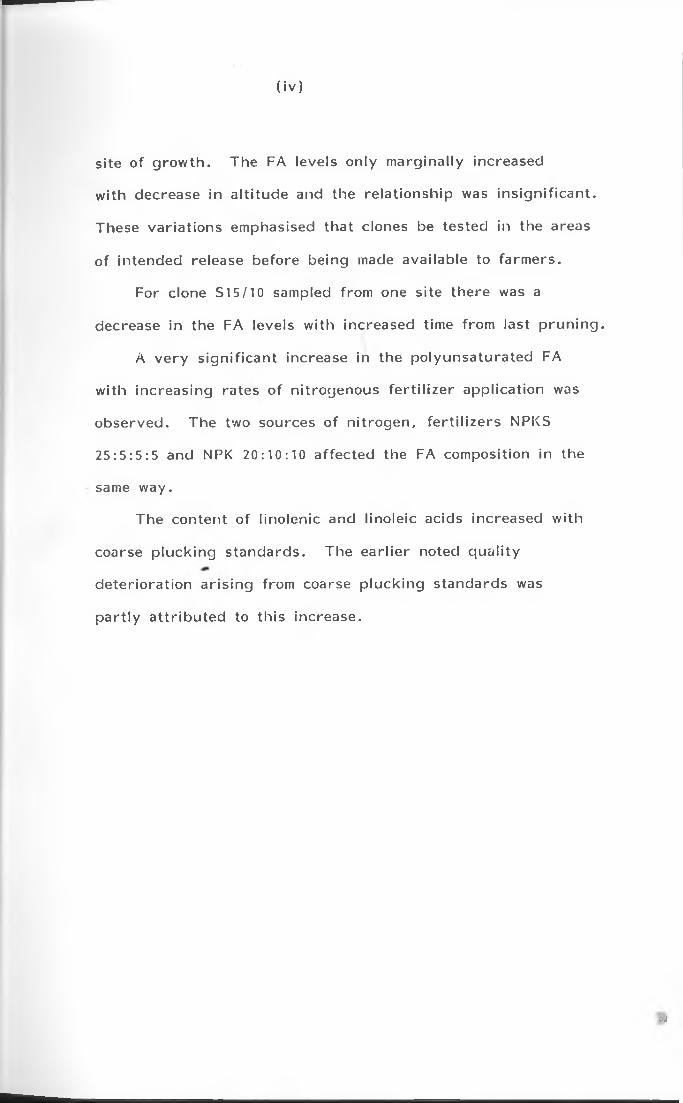
site o f g ro w th . The FA levels on ly m arg ina lly increased
w ith decrease in a l t i tu d e and the re la t io nsh ip was in s ig n i f ic a n t .
These v a r ia t io n s emphasised th a t clones be tested in the areas
o f in tended release before being made ava ilab le to fa rm ers .
For clone S15/10 sampled from one s ite the re was a
decrease in the FA levels w ith increased time from last p ru n in g .
A v e ry s ig n i f ic a n t increase in the po lyu n sa tu ra te d FA
w ith inc reas ing rates o f n i troge nous fe r t i l iz e r app lica tion was
obse rved . The two sources o f n i t ro g e n , fe r t i l iz e rs NPKS
2 5 :5 :5 :5 and NPK 20:10:10 a ffec ted the FA composition in the
same way.
The con ten t o f l ino len ic and lino le ic acids increased w ith
coarse p lu c k in g s tanda rds . The e a r l ie r noted q u a l i ty
d e te r io ra t io n a r is in g from coarse p lu c k in g s tandards was
p a r t ly a t t r ib u te d to th is increase.
»
( v )
LIST OF TABLES
TABLE PAGE
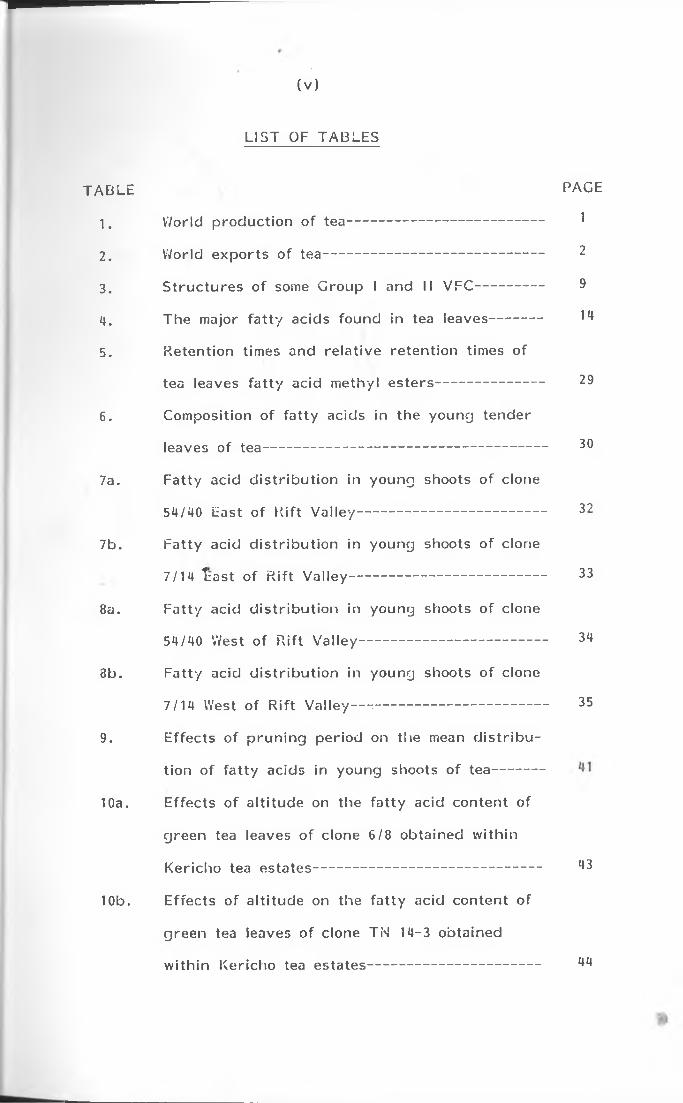
1. World p ro d u c t io n o f tea--------------------------------------------- 1
2 . World e x p o r ts o f tea-------------------------------------------------- 2
3. S t ru c tu re s o f some G roup I and II VFC---------------- 9
4 . The major fa t ty acids found in tea leaves------------ ^
5 . Retention times and re la t ive re te n t ion times o f
tea leaves fa t ty acid m ethyl e s te rs ------------------------ 29
6 . Composition o f fa t ty acids in the young tende r
leaves o f tea-------------------------------------------------------------------- 30
7a. F a tty acid d is t r ib u t io n in young shoots o f clone
54/40 East o f R i f t V a lle y ---------------------------------------------- 32
7b. F a tty acid d is t r ib u t io n in young shoots o f clone
7/14 l ia s t o f R i f t V a lle y ------------------------------------------------ 33
8a. F a tty acid d is t r ib u t io n in young shoots o f clone
54/40 West o f R i f t V a lle y ---------------------------------------------- 34
8b. Fa tty acid d is t r ib u t io n in young shoots o f clone
7/14 West o f R i f t V a lle y ------------------------------------------------ 35
9. E ffec ts o f p ru n in g per iod on the mean d is t r ib u
t ion o f fa t ty acids in young shoots o f tea-------------
10a. E ffec ts o f a l t i tu d e on the fa t ty acid con ten t o f
g reen tea leaves o f clone 6/8 obta ined w ith in
Kericho tea esta tes-------------------------------------------------------- **3
10b. E ffec ts o f a l t i tu d e on the fa t ty acid con ten t o f
g reen tea leaves o f clone TN 14-3 obta ined
w i th in K ericho tea es ta tes------------------------------------------- ****
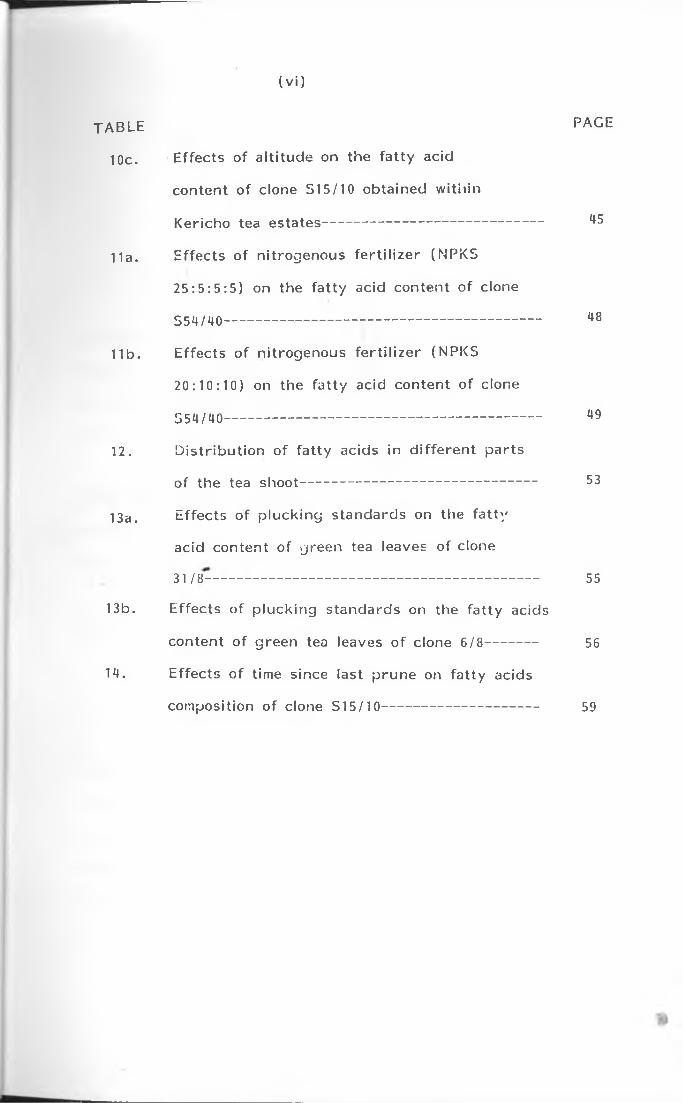
(Vi)
t a b l e p a g e
10c. E ffec ts o f a l t i tu d e on the fa t ty acid
con ten t o f clone 515/10 ob ta ined w ith in
Kericho tea esta tes-------------------------------------------------------- 45
l l a. E ffec ts o f n itrogenous fe r t i l iz e r (NPKS
2 5 :5 :5 :5 ) on the fa t ty acid con ten t o f clone
554/40----------------------------------------------------------------------------- 48
l l b . E ffec ts o f n i trogenous fe r t i l i z e r (NPKS
20: 10: 10) on the fa t ty acid con ten t o f clone
554/40------------------------------------------------------------------------ 49
12. D is t r ib u t io n o f fa t ty acids in d i f fe re n t p a r ts
o f the tea shoot----------------------------------------------------- 53
13a. E ffec ts o f p lu c k in g s tanda rds on the fa t ty
acid con ten t o f g reen tea leaves o f clone
3 1 /8 - -------------------------------------------------------------------------- 55
13b. E ffec ts o f p lu c k in g s tanda rds on the fa t ty acids
con ten t o f g reen tea leaves o f clone 6 /8 ----------------- 56
14. E ffec ts o f time since last p ru n e on fa t ty acids
composition o f clone S I 5 /10---------------------------------------- 59
1
CHAPTER ONE
INTRODUCTION
1.0 THE TEA INDUSTRY IN KENYA:
Kenya is p r im a r i ly an a g r ic u l tu ra l c o u n try w ith
a g r ic u l tu re s t i l l the major backbone o f the economy. The tea
in d u s t ry is one o f the b igges t g ro w th in d u s t r y in Kenya. I t
is a major c o n t r ib u to r to the Nation 's economy, ra n k in g th i r d
on ly to tour ism and coffee as an ea rne r o f fo re ign exchange1.
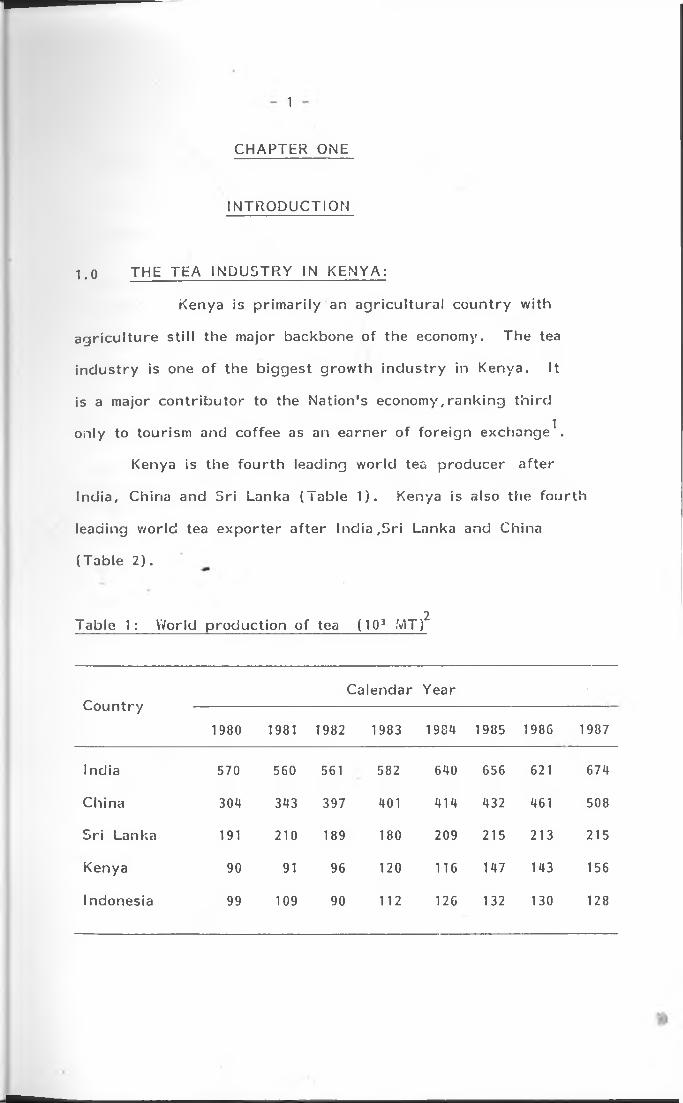
Kenya is the fo u r th leading w orld tea p ro d u ce r a f te r
Ind ia , China and Sri Lanka (Tab le 1). Kenya is also the fo u r th
leading w orld tea e x p o r te r a f te r Ind ia ,5 r i Lanka and China
(Tab le 2) .
2Table 1: World p ro d u c t io n o f tea ( IQ 3 MT)
C o u n tryCalendar Year
1980 1981 1982 1983 1984 1985 1986 1987
India 570 560 561 582 640 656 621 674
China 304 343 397 401 414 432 461 508
Sri Lanka 191 210 189 180 209 215 213 215
Kenya 90 91 96 120 116 147 143 156
Indonesia 99 109 90 112 126 132 130 128
- 2 -
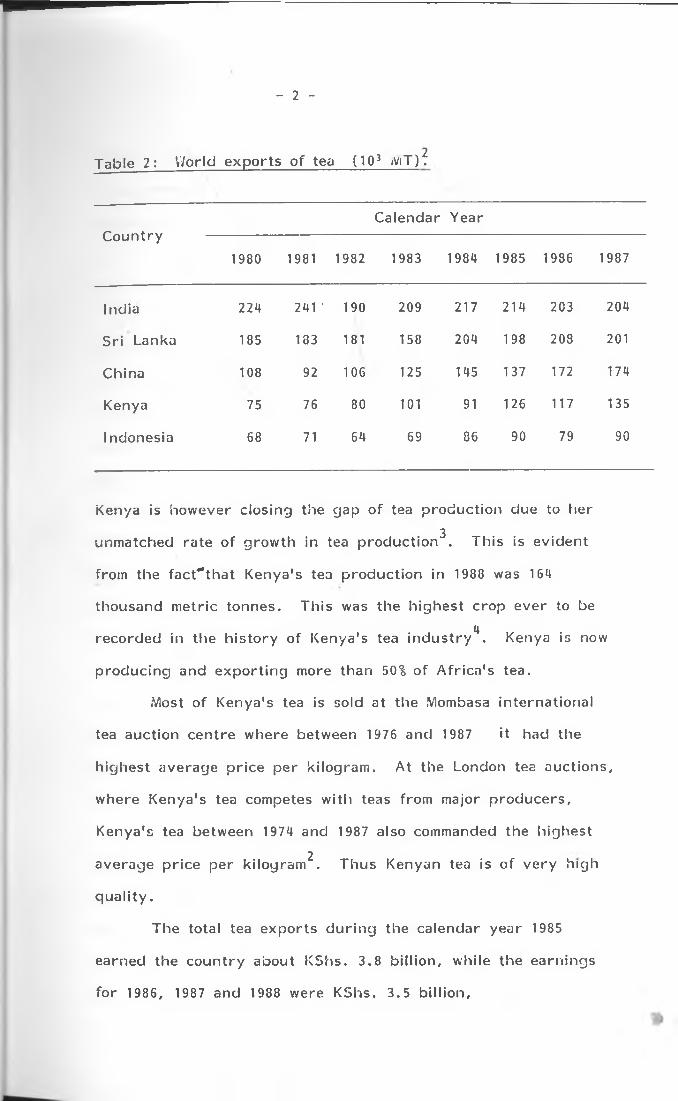
2Table 2: World e x p o r ts o f tea (103 iViT).
C o u n tryCalendar Year
1980 1981 1982 1983 1984 1985 1986 1987
India 224 241 • 190 209 217 214 203 204
Sri Lanka 185 183 181 158 204 198 208 201
China 108 92 106 125 145 137 172 174
Kenya 75 76 80 101 91 126 117 135
Indonesia 68 71 64 69 86 90 79 90
Kenya is however c los ing the gap o f tea p ro d u c t io n due to her3
unmatched ra te o f g ro w th in tea p ro d u c t io n . Th is is ev iden t
from the facf**that Kenya's tea p ro d u c t io n in 1988 was 164
thousand m etr ic tonnes. Th is was the h ighes t c rop eve r to be4
recorded in the h is to ry o f Kenya's tea in d u s t r y . Kenya is now
p ro d u c in g and e x p o r t in g more than 50% o f A fr ic a 's tea.
Most o f Kenya's tea is sold at the Mombasa in te rna tiona l
tea auction cen tre where between 1976 and 1987 it had the
h ighes t average p r ice pe r k i log ram . A t the London tea auc t ions ,
where Kenya's tea competes w ith teas from major p ro d u ce rs ,
Kenya's tea between 1974 and 1987 also commanded the h ighes t2
average p r ice pe r k ilogram . Thus Kenyan tea is o f v e ry h igh
q u a l i t y .
The tota l tea e xp o rts d u r in g the ca lendar year 1985
earned the c o u n t r y about KShs. 3.8 b i l l io n , while the ea rn ings
fo r 1986, 1987 and 1988 were KShs. 3.5 b i l l io n ,
3
r 0K5hs. 3.3 b i l l io n , and KShs. 3.7 b i l l io n re s p e c t iv e ly .
These ea rn ings p ro v id e a live l ihood fo r more than one million
Kenyans and c o n t r ib u te revenue in form o f d u ty and licenses.
1.1 THE IMPORTANCE OF Q U AL ITY IN TE A :
The beverage tea is non-a lcoho lic and its re fre s h in g and
mild s t im u la t ing e ffec ts makes it the most w ide ly d r u n k beverage
in the w o r ld . As such, the q u a l i ty o f the l iq u o r in the cup is
o f prime im portance. The beverage is m anufac tu red from the
young tende r shoots o f Camellia s inensis (L ) O. Kun tze . Kenya's
b lack tea is inc luded in the small g ro u p o f teas hav ing the
f ines t q u a l i ty and th is is re f lec ted in the co n s is te n t ly h igh2
pr ices they fe tch on in te rna t iona l m arkets . I he b u y e rs o f
Kenya's tea are p r im a r i ly in te res ted in the q u a l i ty o f the tea
on sale and not upon the q u a n t i ty . The s u rv iv a l o f the
Kenyan tea as a v iab le e n t i t y depends upon maintenance o f the
p resen t q u a l i ty s ta tus o r p ro d u c t io n o f even h ig h e r q u a l i ty tea.
It is th e re fo re o f atmost im portance to u nd e rs tan d the chemical
fac to rs respons ib le fo r the h igh q u a l i ty and to determ ine how
agronomic p rac t ices can be optim ised to maintain o r improve
the p resen t q u a l i ty leve l.
The Tea Research Foundation o f Kenya (TR FK ) is the
techn ica l execu ting agency o f the Tea Board o f Kenya charged
w ith the re s p o n s ib i l i ty o f c a r ry in g ou t research and p ro v id in g
techn ica l s u p p o r t based on research f in d in g s to the Kenyan
tea in d u s t r y . The TRFK has been engaged in tea research
programmes wh ich have resu lted in increased tea y ie lds , reduced
cost o f tea g ro w in g and process ing and, most im po rtan t ,
im proved q u a l i ty o f tea. Th is has been w ith a view to
en su r in g th a t the fa rm er gets the best possib le p r ice from
his c rop , while the rep u ta t io n o f Kenya's tea remains h igh
in the tea q u a l i ty - conscious, d is c r im in a t in g w orld tea
m arke ts . I t then fo llows tha t any fac to r re la ted to tea
q u a l i ty , no m atte r how t r i v ia l , s tands a good chance o f
ju s t i fy in g some research e f fo r t . Factors wh ich a f fe c t q u a l i ty
usua lly have an e f fe c t upon the economics o f tea p ro d u c t io n .
1.2 ASSESSMENT OF TEA Q U A L IT Y :
Values a n d /o r p r ices o f b lack tea are de term ined
o rg a n o le p t ic a l ly . T h is method o f va lua t ion has, how ever, o ften
been c r i t ic is e d as being sub jec t ive and in f luenced by consumers
m arket demands a n d /o r in d iv id u a l ta s te r 's personal p re fe re n ce s7
A f te r fe rm enta t ion and f i r in g the tea is g raded acco rd ing to
the size o f the p a r t ic le o f d r ie d leaf. T h is is also called
s o r t in g . The sorted tea is then assessed fo r q u a l i ty .
Black teas are c lass if ied as f la v o u ry o r p la in . Plain
te^s do not have f la v o u r and are sold mainly on the basis o f
b r iskn e ss , b r ig h tn e s s , th ickne ss , s t re n g th and co lour ' .
F lavou ry b lack teas, on the o the r hand, are bough t fo r. 9 1 o
th e«r special aromas and f la v o u rs ' . Kenyan b lack teas
9a re c lass if ied as medium f la v o u ry to p la in . The sub jec t ive
na tu re o f the ta s te rs ' assessment exp la ins how it is possible
f0 r d i f fe re n t tas te rs to assign d i f fe re n t c lass if ica t ions to the
Sa,T,e sample o f tea. The re could be wide d ive rgenc ies o f

5
opin ion among l iq u o re rs re g a rd in g the c h a ra c te r is t ic s o f
11-14identica l tea samples as was observed by Biswas . There
is th e re fo re need fo r a more p rec ise , re p ro d u c ib le , and
ob jec t ive method o f assessing tea q u a l i ty .
1.2.1 Assessment o f q u a l i ty by chemical ana lys is .
Research has been d ire c te d to the de te rm ina t ion o f
measurable chemicals o r g roup s o f chemicals in h e re n t ly found
in b lack tea. T h is has been w ith a view to und e rs ta n d the
chem is try o f tea and p a r t ic u la r ly where spec if ic chemical
compounds have been shown to in f luence the q u a l i ty o f tea.
Work has been done to re la te these essentia l chemical
c o n s t i tu e n ts found in b lack tea to the va r ious c lass if ica t ions
o f tea w ith the even tua l aim o f a r r i v in g at a s c ie n t i f ic
assessment o f the q u a l i ty o f b lack tea. T h is , to a la rge
e x te n t has been ach ieved .
The p os it ive c o n t r ib u t io n o f Thea flav ins (TF ) and
T h e a ru b ig in s (TR ) to b lack tea q u a l i ty was f i r s t dem onstra ted15 ig
in 1958 by Roberts ' . Since then , several s tud ies have
shown both the components to be im po rtan t in va lua tion o f
teas. Because the s t ru c tu re s o f TR are not p rec ise ly known,17-29TF have rece ived mo*j e a t ten t ion as a t ja i fh ty parameter
Results from TF stud ies have shown th a t s t re n g th ,
b r ig h tn e s s and b r iskn e ss o f b lack tea are re la ted to the TF
con ten t o f the l iq u o r and th a t th e re is a d i re c t l inea r re la t io nsh ip
between the TF con ten t and tea va lua t ions a n d /o r p r ices .

6
C onsequen t ly , in some coun tr ie s TF con ten t has been adopted
as the main q u a l i ty param eter o f b lack teas. Kenya's tea
has been noted to have v e ry h igh amounts o f TF when
compared to teas from o th e r p a r ts o f the w o r ld 7 . Th is p a r t ly
exp la ins why Kenya's tea is c lass if ied as p la in in the tea
trad e . For Kenyan b lack teas, the co rre la t io n coe ff ic ien ts
between TF and the tas te rs ' eva lua tions have been shown to
7 30be pos it ive b u t s ta t is t ic a l ly n o n -s ig n i f ic a n t ' . The pos it ive
co rre la t io ns imply tha t TF con ten t is a real q u a l i ty param eter
b u t lack o f s ig n i f ic a n t co r re la t io n s w ith p r ic e s / va lua tions
implies th a t TF alone is not enough to descr ibe q u a l i ty o f Kenyan
teas.
The exact c o n t r ib u t io n o f TR to tea q u a l i ty is s t i l l
e lus ive b u t i t is known th a t TR are necessary fo r the tota l
co lour and th ickne ss o f b lack tea and th a t v e ry i i ig h amounts
o f TR in tea is de le te r ious to q u a l i ty as i t makes the tea f la tg
and muddy . L inear regress ion ana lys is between the tas te rs '
30eva lua tions and TR con ten t were shown to be pos it ive . Th is
showed tha t TR has p os it ive c o n t r ib u t io n towards q u a l i ty and
is thus a q u a l i ty param eter.
Caffe ine has been known to c o n t r ib u te to the q u a l i ty31 32 i n 33
o f tea . Bhatia and iViullin ' asserted th a t ca ffe ine
c o n t r ib u te s tow ards the b r iskne ss (a s tr in g e n c y ) o f b lack tea.
The mild s t im u la t in g e ffec ts o f the beverage tea is mainly due
to the presence o f ca ffe ine . L inear reg ress ion ana lys is
between the ta s te rs ' eva lua tions and ca ffe ine con ten t o f Kenyan

7
black teas were pos it ive showing th a t ca ffe ine con ten t is a
good q u a l i ty param eter. G enera lly TF , TR and ca ffe ine are
the q u a l i ty param eters which have been ex te n s iv e ly s tud ied
fo r Kenyan teas. A l th o u g h these chemical components are
necessary fo r b lack tea q u a l i ty , no in d iv id u a l component has
s ig n if ic a n t d i re c t re la t io nsh ip w ith the o rgano lep tic eva lua t ions .
Ash, tota l wa ter so luble solids and c rude f ib re contents
37o f tea are also im po rtan t to tea q u a l i ty . A comparison o f
these a t t r ib u te s from the main b lack tea p ro d u c in g p a r ts o f
the w orld show th a t the compositions o f those parameters are
comparable. T h e ir va r ia t io n s were minimal. The ash, water
soluble solids and c rude f ib re o f all the teas used met the
requ irem en ts o f the In te rna t iona l S tandard O rgan isa tion (ISO)
3720 . The set le v e ls o f the ISO 3720 are as fo l lo w s : - water
soluble solids minimum 32%, tota l ash 4-8%, and c rude f ib re
. 39 40maximum o f 16.5% ' . H igh q u a l i ty teas norm ally have h igh
tota l wa ter soluble solids and low ash and c ru d e f ib re con ten ts .
The h ig h q u a l i ty o f the Kenyan teas is due to the
general favou rab le g ro w in g cond it ions , im proved methods o f
g row ing and h u s b a n d ry and m anufactu re wh ich have resu lted
in favourab le balance o f the chemicals respons ib le fo r q u a l i ty .
1.3 THE IMPORTANCE OF FLAVOUR TO OVERALL TEA
Q U A L IT Y :
Work on the f la v o u r o f Kenyan teas was v e ry re ce n t ly . J 9,41
s ta r te d . Owuor et _a] have shown th a t the composition o f
vo la ti le f la v o u r compounds o f commercial Kenyan teas is comparable
8
to th a t o f teas from areas famous fo r the p ro d u c t io n o f teas
42w ith h igh f la v o u r q u a li t ie s . The f la v o u r index ( F . l . ) o f the
world famous f la v o u ry teas were noted to be s l ig h t ly h ig h e r
or even equal to those o f the Kenyan clones used in the s tu d y ^ 1
T he re fo re the genera l notion th a t Kenyan b lack teas are p la in
is not t ru e . In these s tud ies i t was also shown th a t f la v o u r
o f Kenyan b lack tea is one o f the c r i te r ia de te rm in ing overa l l
q u a l i ty and se l l ing p r ic e , and hence f la v o u r is an im portan t
q u a l i ty param eter.
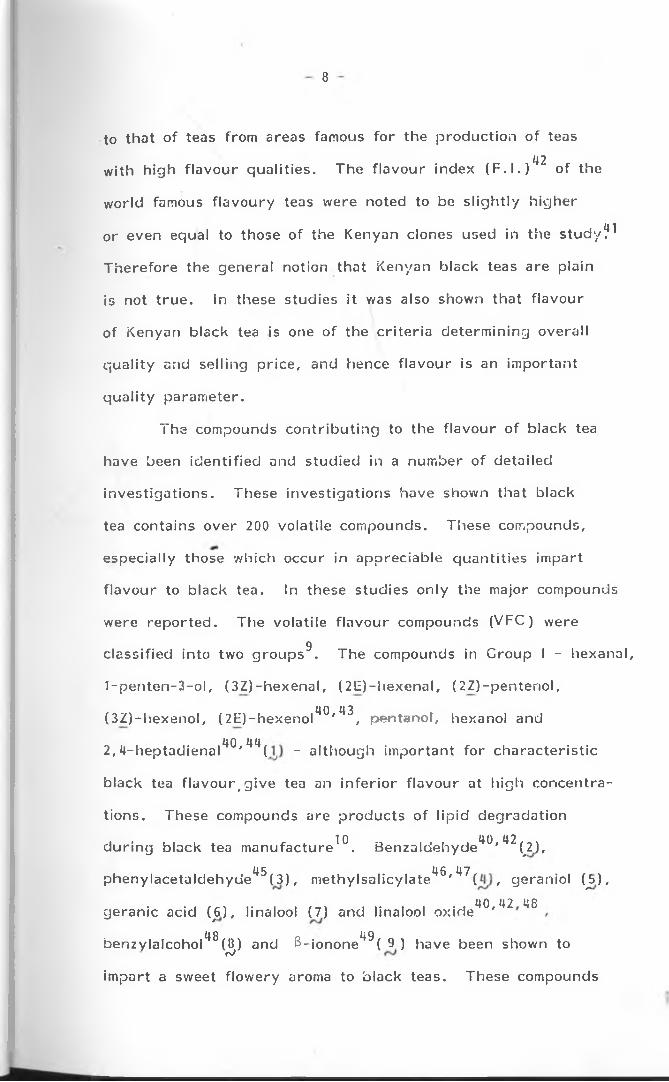
The compounds c o n t r ib u t in g to the f la v o u r o f b lack tea
have been id e n t i f ie d and s tud ied in a num ber o f deta iled
in ve s t ig a t io n s . These in ves t iga t io ns have shown th a t b lack
tea conta ins ove r 200 vo la t i le compounds. These compounds,
especia lly those wh ich occur in app rec iab le q u a n t i t ie s im part
f la v o u r to b lack tea. In these s tud ies on ly the major compounds
were re p o r te d . The vo la ti le f la v o u r compounds (VFC) wereg
class if ied in to two g roup s . The compounds in G roup I - hexanal,
1 -p e n te n -3 -o l , (3Z )-hexena l, (2E )-hexena l, ( 2Z )-p en teno l,
40 43(3Z )-he xeno l, ( 2E )-hexenol ' , pentanof, hexanol and
40 442, 4-hep tad iena l ' ( - a l though im portan t fo r c h a ra c te r is t ic
b lack tea f la v o u r #g ive tea an in fe r io r f la v o u r at h ig h concen tra
t ions . These compounds are p ro d u c ts o f l ip id deg rada tion
10 40 42d u r in g b lack tea m anufac tu re . Benzaldehyde ' (^2),
45 46 47pheny lace ta ldehyde (3 ) , m e thy lsa l icy la te ' ( , geran io l (j>),
40 42 48geran ic acid (J5), linalool (7) and linalool ox ide '
48 o 49benzyla lcohol ( 8 ) and P-ionone ( 9 ) have been shown torJ
im part a sweet f low e ry aroma to b lack teas. These compounds
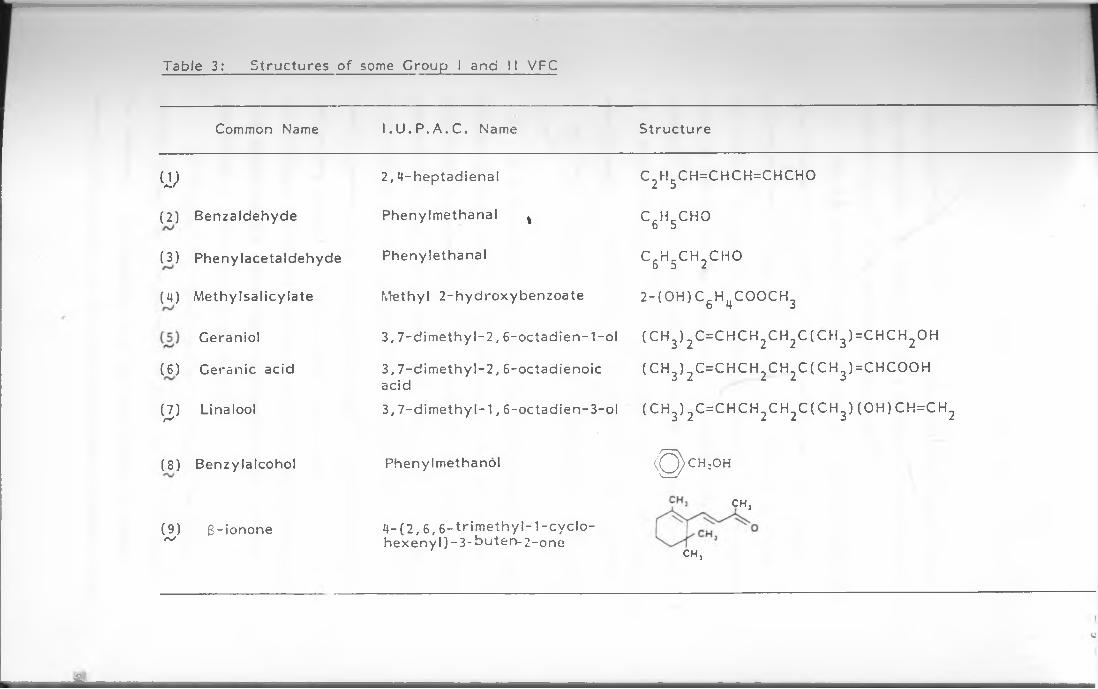
Table 3: S tru c tu re s o f some C roup I and II VFC
Common Name I . U . P . A . C . Name S tru c tu re
UP 2 ,4 -h e p tad iena l c 2h 5c h =c h c h =c h c h o
(2) Benzaldehyde Phenylmethanal % CcH_CHOb b
(3) Phenylaceta ldehyde Phenyle thanal C cH_CHnCHOo b JL
(4) M ethy lsa l icy la te fvtethyl 2-h y d ro x y b e n z o a te 2- (O H ) C 6H4COOCH3
Ceranio l 3 , 7 -d im e th y l - 2 , 6- o c ta d ie n - l - o l (C H 3) 2C=CHCH2CH2C (C H 3)=CHCH2OH
( 6) Geranic acid 3 , 7 -d im e th y l - 2, 6-oc tad ieno ic acid
(C H 3) 2C=CHCH2CH2C (C H 3)=CHCOOH
V Linalool 3 ,7 - d im e th y l -1, 6 -oc tad ien -3 -o l (C H 3) 2C=CHCH2CH2C (C H 3) (O H )C H =C H 2
(8) Benzy lalcohol Pheny Imethanol 0 CH:°HCHj
(9)r~/ B - ionone 4- ( 2 , 6 , 6- t r im e t h y l - 1- c y c lo - h e x e n y l) -3 - buterv-2-one
ch3
A
10
are c lass if ied as C roup I I . The c lass if ica t ion o f the res t o f
the compounds in to G roup I o r II is based on the method o f
42 44Yaminish i et_ aj and W ickremasinghe et a]_ .
By th is method, compounds w ith GC re te n t io n times less
than linalool are placed in G roup I while those w ith h ighe r
re te n t ion times are placed in G roup I I . The ra t io o f Group II
to G roup I VFC is called the f la v o u r index ( F . l . ) and can be
used to c la ss ify the ten q u a l i ta t iv e ly in o rd e r o f f la v o u r
42 44 —q u a l i ty ' . I he q u a l i ta t iv e na tu re o f FI is s tressed since
it is known th a t the o l fa c to ry pe rcep tion lim its o f the compounds
are d i f fe r e n t . Some compounds may th e re fo re ex is t as VFC
in on ly small amounts b u t a f fe c t the f la v o u r g re a t ly and vice
47versa
It is known th a t the h ig h e r the FI the b e t te r the f la v o u r q 50
q u a l i ty o f b lack tea ' For the Kenyan teas the re were
s ig n if ic a n t p os it ive c o rre la t io ns between f la v o u r index and the
ta s te rs 1 eva lua tions o f the tea. Th is dem onstra ted tha t FI is
a measure o f the f la v o u r q u a l i ty and thus an im portan t
q u a l i ty param eter fo r Kenyan b lack teas5^. Of all the q u a l i ty
parameters s tud ied fo r Kenyan teas, the G roup I VFC
concen tra t ion co rre la ted nega tive ly w ith the tas te rs ' eva lua t ion .
Th is con firm ed the notion tha t h ig h concen tra t ion o f these
compounds is de le te r ious to tea q u a l i ty .
I t is app a re n t, th e re fo re th a t to im prove the f la v o u r
q u a l i ty o f tea, the concen tra t ion o f these Group I VFC must
be reduced . Inves t iga t io ns in to the c o n t r ib u t io n o f l ip id s ,
especia lly fa t t y ac ids, to the aroma and f la v o u r vo la ti les d u r in g
11
tea process ing is one sub jec t w ith th is u n d e r ly in g v iew .
1.4 ASPECTS OF THE CHEMISTRY OF LIPIDS AND
FA TTY ACIDS OF TEA LEAVES: * 51
1.4.1 O ccurrence
The development o f im proved ana ly t ica l techn iques
51 52perm it ted Anan and Nakagawa and W righ t and F ishw ick
to c a r ry ou t q u a n t i ta t iv e analyses o f l ip ids and fa t ty acids o f
tea shoots. They made i t c lear tha t tea leaves conta in mainly
monogalactosyl d ig ly c e r id e (H I ) , d iga lac tosy l d ig ly c e r id e ( TJ) ,
pho spha t id y l cho line ( 12) / p h o spha t id y l ethanolamine ( 1J ) ,
su lp hog lyco l ip ids such as su lphoqu inovosy l d ig ly c e r id e (14)/
s te ro lacy l monoglucoside (J J ) , p h o spha t id y l g lyce ro l (16,)/
pho spha t id y l in o s i to l (17), ce rebros ides (18) and neu tra l l ip id s ./-v/
The component fa t ty acids were found to be palm itic
(hexadecano ic ) , palm ito le ic (c is -9 -h exnde ceno ic ) , s tear ic
(oc tadecano ic ) , oleic (c is -9 -o c tad eceno ic ) , l ino le ic (c is -9 ,
c is -12-octadecad ieno ic) and lino len ic (c is -9 , c is -12 , c is -15 -
o c ta d e c a tr ie n o ic ) . The s t ru c tu re s are g iven in Table 4
(Page 14).
»

12
h2coh
(10) IVionogalactosyl d ig ly c e r id e (MGDG)
HjCOH M |y—Oy \v
OH
o- ch2
HO
O i l
o- ch2iCH.O.CO.RI
C I I 2 . O . C O . R
(11) D iga lactosy l d ig ly c e r id e (DGDG)
+
c h 2.o .c o . r
2 Ir \ c o .o .c i i oI II
C I l 2 . 0 . P . 0 . C I I 2 N ( C H 3)3
O '
(12) Phospha tidy l choline (PC)
1^ . o . c o . r
R .CO .O .CII O■P
CH2.0.P.0.CH2CH2NH3
O '(13) Phosphatidy l ethanolamine (PE)

13 -
h2cso3h
ho\ oh /̂ q- ch2O H C H . O . C O . r '
ch2.o .co.r2(14) S u lphoqu inovosy l d ig ly c e r id e (SQDG)
c h 3
U 5 ) Sterol-acyl monoglucoside
C H 2 . O . C O . Rc h 2 o h
R 2 . C O . O . C H o c h . O H
C H 2 . 0 . P . 0 . C H 2
o n o n o
IIo . p . o c h 2
oI I C . O . C O . R 2
o - o n 1I 2 C . 0 . C O R(16) Phospha tidy l g lyce ro l (PG) ( 17) Phospha tidy l inos ito l (PI)'■'vj
CH(OH)CH=CH(CH2)12CH3CHNHOCRIc h2- o c h 2oh
/0 OHO
h o )
OH(18) Cerebros ides

14 -
Table The major fa t ty acids found in tea leaves.
CommonName
Symbol S t ru c tu re
Palmitic C 16 : 0
0II
CH3(C H 2) 14C-OH
Palmitoleic C 16 : 1CH_(CM ) CH=CH(CHi Z b
0II
2) 7C-OI-l
S tearic oCOd
r
0II
C H - ( C fL ) 1cC-OH3 / l b 0
Oleic C 18 : 1 CH3(C H 2) 7CH=CH(CH 2) 7c - o h
Linole ic C 18 :2 CH3(C H 2) 4CH=CHCH2
0II
CH=CH(CH2) c - o h
Linolenic C 18 :3 CH3CH2CH=CHCH2CM==CIICU2CH=CH(CH2) 7-
OII
- C-OH
These are the p r in c ip a l fa t ty acids p resen t in tea leaves which
account fo r o ve r 98% o f the fa t ty acid com position. C ons ider ing
the fa t ty acid composition o f in d iv id u a l l ip id s , l ino len ic acid is
de r ived from mono- and d iga lac tosy l d ig ly c e r id e s , l ino le ic acid
from p ho spha t id y lcho lin e and phospha t idy le thano lam ine , oleic acid
from p h o s p h a t id y lg ly c e ro l , s tear ic acid from s tero lacy lm onoglucos ide
and neu tra l l ip id s , and pa lm it ic acid from p h o s p h a t id y l in o s ito l and
s u lp h o q u in o v o s y ld ig ly c e r id e 5 ̂ 5 *
The l ip ids c o n s t i tu te less than ten per cent o f the total
d ry we igh t o f leaves arm most o f the l ip ids are located in the
15
ch lo rop lasts . L ip ids comprise about 30% o f the d r y w e igh t o f the
ch lo rop last, and 50% o f the ch lo rop las t lamellae.
1.4.2 P roduction o f vo la ti les by deg rada t ion o f l ip id s . 55 * 57
55 56Sanderson and Saijyo have shown tha t d u r in g
m anufacture o f tea the re is w idespread damage to membrane
s t ru c tu re s . Th is releases l ip id -d e g ra d in g enzymes which a t ta ck
lipop ro te in and l ip o ca rb o h yd ra te membrane s t ru c tu re s to release
57fa t ty acids . The fa t t y acids released unde rgo f u r t h e r degrada t ion
to p roduce the vo la t i le c ons t i tuen ts w ith c h a ra c te r is t ic f la v o u r
p ro p e r t ie s . These vo la t i le co n s t i tu e n ts are mainly the G roup I
v p c 9 , 10,43-48
The m a jo r i ty o f these G roup I VFC are alcohols and
a ldehydes. B iosyntT ie tic s tud ies on homogenates o f Camellia
sinensis leaves have shown tha t the p o lyu n sa tu ra te d fa t tyco—g2acids are the p re c u rs o rs o f the alcohols and a ldehydes
Linolenic and l ino le ic acids were id e n t i f ie d as the actual p re c u rs o rs
o f the a ldehydes (3Z )-hexena l and hexanal re sp e c t ive ly and tha t
Cg alcohols are reduc t io n p ro d u c ts o f these a ldehydes. The
6 3aldehydes are b iosyn thes ised as shown in Scheme 1 .
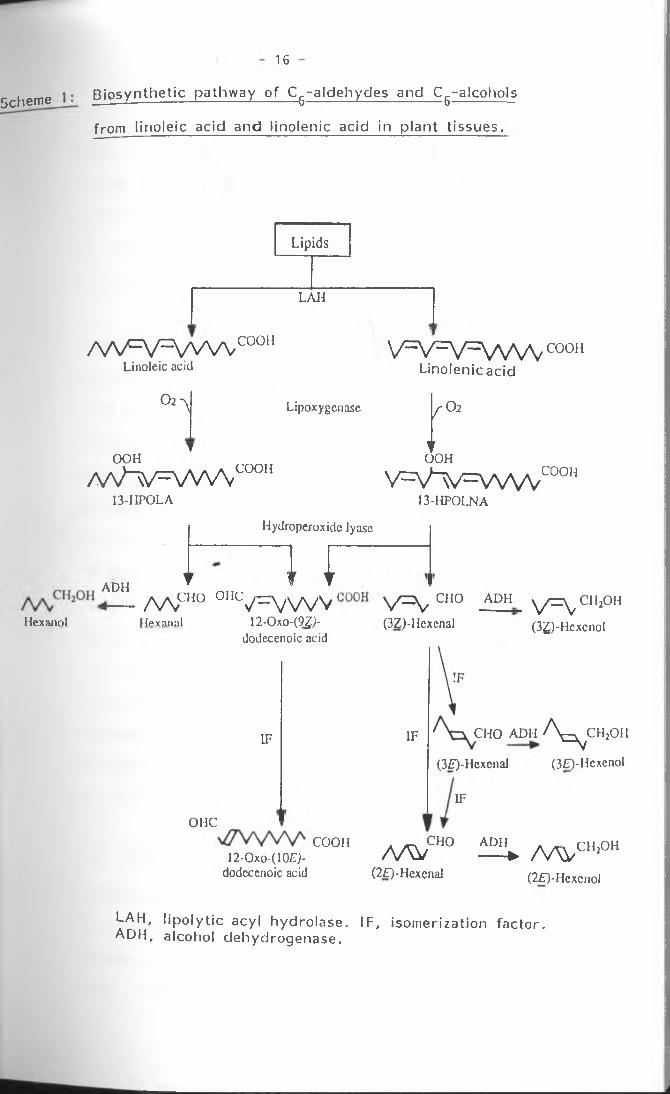
The reactions invo lve d in the major b io s y n th e t ic pathway
fo r C a ldehydes cons is t o f f iv e sequentia l s teps ; a c y lh y d ro ly s is
o f l ip ids , h y d ro p e ro x id a t io n o f l ino le ic and l ino len ic ac ids, cleavage
o f the fa t ty acid h y d ro p e ro x id e s , isomerization o f (3Z )-hexena l to
( 2E)-hexenal and conve rs ion o f the a ldehydes in to alcohols.
The fo u r enzymes and one non-enzym ic fa c to r in vo lved in
the pathway are l ip o ly t ic acyl hyd ro lase (L A N ) , l ipoxygenase ,
16
Scheme B iosyn the t ic pa thw ay o f C ^-a ldehydes and C^-a lcohols
from lino le ic acid and lino len ic acid in p lan t t issues.
Lipids
LAH
AV=V=VVW c o o n
Linoleic acidV = V c r V = W v V c o o n
Linolenic acid
O2 ^
T0 0 H
/ W - v = w \ V OOM13-HPOLA
Lipoxygenase f O2
fOOH
V = V ^ v ^ W W C00H13-HPOLNA
Hydroperoxide lyase
I Ai)H ▼ l f— A/Vcho OHCy=V W V
Hexanol Hexannl 12-Oxo-(9ZJ-12-Oxo-(9#- dodecenoic acid
IF
OHCco o n
12-Oxo-(10E> dodccenoic acid
V ^ v CH0(3Z)-Hexcnal
ADH V = V CH*0H(3g)-Hcxcnol
IF CHO ADH A ^ c h 2o h
(3ZT)-HexenaI (3E)-Hcxenol
IF
AAV(2£)-Hcxcnal
CHO ADH► / V \ V CHl0H
(2£)-Hcxcnol
i-AH, l ip o ly t ic acyl hyd ro lase . IF, isomerization fac to r . ADH, alcohol dehydrogenase .
17
fa t ty acid h y d ro p e ro x id e lyase (h y d ro p e ro x id e ly a s e ) ,
alcohol dehydrogenase (ADH) and an isomerization fac to r ( IF ) .
Among these enzymes lipoxygenase and h y d ro p e ro x id e lyase
are the most im po rtan t since these enzymes cata lyse
form ation o f C ^ -a ldehydes .
The l ip o ly t ic acyl hyd ro lase (LAM) hyd ro lyses the
lip ids and releases the fa t ty ac ids. The free fa t ty ac ids,
lino le ic acid (LA ) and lino leriic acid (LN A ) are ox id ised at the
C-13 pos it ion . Th is is cata lysed by lipoxygenase . Th is
enzyme cata lyses the aerob ic ox ida t ion o f LA and LNA since
62 64 65they conta in a c is-1 and c is -4 -pen tad iene system ' ' . The
ox ida t ion p ro d u c ts are 1 3 -hyd rop e ro x ide o f LA, 13-HPOLA
(13 - L - h y d ro p e ro x y -c is -9 , trans -11 -oc tadecad ieno ic acid) and
13 -h y d ro p e ro x K le o f LNA, 13-M.POLNA (13 -L -h y d ro p e ro x y -c is -
- 9 , t ra n s -1 1 ,c is -1 5 -o c ta d e c a tr ie n o ic a c id ) . The a ldehydes
(3Z)-hexenal and hexanal and 2-o x o -a c id , or
12 -oxo -c is -9 -dodeceno ic acid are p roduced th ro u g h an oxygena -
t ive cleavage at the double bond between C-12 and C-13. Th is
64 66cleavage is ca ta lysed by h y d ro p e ro x id e lyase ' . The
formed (3Z )-hexena l is isomerized to ( 2E)-hexenal and (3E)-hexena l
by the isomerization fac to r ( IF ) .
The c o rre sp o n d in g alcohols, (3Z )-hexeno l, ( 2E)-hexenol
and (3E )-hexeno l are formed by reduc t io n w ith alcohol
dehydrogenase (A D H ). Hexanal is reduced to hexanol by ADH.
Also d u r in g tea p rocess ing , oleic acid can b reak down to form
nonanal and n-nonano l while palm ito le ic acid can form heptanal
58 61and n -h e p ta n o l ' . The compounds dominate the G roup I
18
VFC and c o n t r ib u te to the c h a ra c te r is t ic f la v o u r p ro p e r t ie s
o f b lack tea. They are the compounds wh ich im part an
in fe r io r , g reen and g rassy f la v o u r to tea when p resen t in
re la t iv e ly h igh am oun ts1 ^ ° . Indeed the to ta l amounts o f these
compounds were noted to co rre la te neg a tive ly w ith the tas te rs '
30eva lua tions o f Kenyan b lack teas . The form ation o f these
im portan t a ldehydes and alcohols from deg rada t ion o f
lino le ic and lino len ic acids have served to emphasize the importance
o f FA in f la v o u r deve lopment.
Formation o f f la v o u r compounds is not confined to tea
o n ly . The a ldehydes and alcohols are w ide ly d is t r ib u te d in
67 68fresh fo liage, vegetab les and f r u i t s , iviajor et^ al_ ' , fo r
example, repo r te d th a t f resh leaves o f G ikgo biloba ( L . ) p roduced
( 2t ) -h e x e n a l when they were g ro u n d in the presence o f a i r ,
and th a t l ino len ic acid was conve rted in to ( 2t ) -h e x e n a l in the
G9leaves. D ra w e r t £ t a|_ repo r te d th a t hexanal and ( 2E)-hexenal
were p roduced enzym atica lly w ith p a r t ic ip a t io n o f a tmospheric
oxyge n , from lino le ic acid and lino len ic acid re sp e c t ive ly in
apples and g rapes . A num ber o f vo la t i le ca rbon y l compounds
sa tu ra ted o r unsa tu ra te d have been isolated from re v e r te d or
ox id ised soybean o i ls , and the vo la t i le substances isolated
from au tox id ised C 1g un sa tu ra te d fa t ty acids have been shown
to be mainly ca rbon y l com pounds70.
It is th e re fo re not questionab le th a t the c u r re n t tea
q u a l i ty problems in Kenya would re q u ire f u r t h e r w o rk to
re la te the vo la t i le f la v o u r compounds to th e ir chemical p re c u rs o rs ,
19 -
namely, l ino le ic ac id , l ino len ic ac id , oleic acid and palm ito le ic
acids in the g reen tea leaves. In fo rm ation re g a rd in g the
chemical compounds wh ich de term ine ove ra l l q u a l i ty would
fu r th e r enable fa rm ers to be c o r re c t ly and p rec ise ly advised
as to what is ac tua l ly necessary agronom ica lly o r o therw ise to
enhance the q u a l i ty o f th e ir processed p ro d u c t .
1.5 SOME FACTORS AFFECTING THE CHEMICAL
COMPOSITION AND Q U A L ITY OF CTC ALACK T E A :
1.5.1 Geographica l area o f p ro d u c t io n .
The areas p ro d u c in g tea in the w orld have large
va r ia t ions o f c lim atic cond it ions from equato r ia l climates to
su b - t ro p ic a l climates and at a l t i tud es from sea leavel to beyond
2,600 meters above abso lute mean sea leve l. Due to these
va r ia t io ns in the geograph ica l and c lim atic cond it ions o f g ro w th ,
the re are norm ally chemical concen tra t ion changes and henceq UO 41 47 7 1 - 7 4 Q
q u a l i ty d i f fe re n ce s ' ' . Owuor et^a|_, fo r example,
compared the chemical compositions o f b lack teas from the main
black tea p ro d u c in g p a r ts o f the w orld and found th a t all the
teas had la rge d if fe re n ce s in the con ten ts o f TF , TR and f la v o u rno 4i
compounds. Yamanishi et ̂ a\_ and Morita and Owuor also
compared the f la v o u r o f tea from d i f fe re n t pa r ts o f the world
while C lough ley et a j74 compared the f la v o u r o f teas d u r in g
s p r in g , summer and autumn in Malawi. The c limatic and
Geographical cond it ions in all these areas are d ive rse .
In Kenya, tea is g row n in d i f fe re n t locations at h igh
a lt i tudes between 1500 and 2700m above sea leve l. Compared

20
to the tea g ro w in g reg ions o f the w o r ld , the geograph ica l
and climatic changes are minimal. A s tu d y by Owuor et al 75
to de term ine any changes in the chemical composition o f b lack
tea o c c u r r in g due to the minimal geograph ica l and c limatic
changes was done. Th is s tu d y showed th a t TF va r ied w ide ly
w ith geograph ica l areas o f p ro d u c t io n fo r all the clones tes ted .
TR con ten ts also changed w ith geograph ica l locations. The re
were no s ig n if ic a n t changes in TR con ten ts w ith a l t i tu d e fo r
all c lones. In all clones d i f fe re n t geograph ica l areas o f g row ing
tea p roduced v a ry in g amounts o f ca ffe ine . No s ig n if ic a n t
re la t ionsh ips were shown between ca ffe ine con ten t and a l t i tu d e .
There were h ig h ly s ig n i f ic a n t d i f fe rences in the VFC con ten t
w ith locations. G enera l ly , the re was no s ig n if ic a n t re la t ionsh ip
between G roup I j?r 11 compounds and a l t i tu d e . The magnitude
and o rd e r o f the va r ia t io n s changed acco rd ing to the location
where the tea was g ro w n . A ll these d if fe rences in chemical
composition and hence q u a l i ty p a r t ly exp la in why farm ers from
d i f fe re n t reg ions do not always get the same payment fo r th e ir
p roduce . The d i f fe r in g chemical composition and hence q u a l i ty
o f tea can be a t t r ib u te d to the teas's chem ical/b iochem ical
composition reac t ing d i f fe r e n t ly to v a ry in g geograph ica l and
c limatic areas o f p ro d u c t io n .
1*5.2 Clonal v a r ia t io n s .
When d i f fe re n t va r ie t ie s o f tea (clones) are grow n
under s im ilar env ironm enta l cond it ion s , they do not react the
same way in terms o f g ro w th and hence th e ir chem ical/
21
biochemical compositions are d i f fe r e n t . A s tu d y by Owuor
30et_ aj_ on the v a r ia t io n s in the chemical composition o f some
Kenyan clonal teas showed th a t clones o f tea produce d i f fe re n t
amounts o f TF , TR , ca ffe ine and the VFC in v a ry in g p a t te rn s .
Clone 6/8 had the h ighes t TF , the second h ighes t TR , and the
best f la v o u r in d e x . Th is clone is used as a q u a l i ty s tandard
in o rgano lep tic va lua t ions . The FI o f the clones s tud ied were
in the o rd e r 6/8 > 31/8 > Ejulu > 31/11 > STC 5-3 > TN
14-3 > S 15/10. I t was th e re fo re suggested tha t c lones 'chem ica l
composition be used in con juc t ion w ith o rgano lep tic eva luations
in the reg ions o f in tended release before they are made
ava ilab le to fa rm ers .
•#»
1 .5 .3 N itrogenous fe r t i l iz e rs .
The app lica tion o f fe r t i l iz e rs to tea is a normal
agronomic p rac t ice which is essentia l fo r con tinuous economic
p ro d u c t io n o f tea. S tudies on the e ffec ts o f fe r t i l iz e rs on the
chemical composition o f tea have been in te n s if ie d . Bajaj et a I u,
dem onstra ted tha t in N o rth and East Ind ia , the app lica tion o f
phosphatic fe r t i l i z e r d id not seem to have any s ig n if ic a n t
impact on the tota l q u a n t i ty o f fa t ty acids in f resh tea leaves.
In Kenya, n itrogenous fe r t i l iz e rs have been shown to
77 78a ffec t the chemical composition o f tea leaves. Owuor et_ aj_
in ves t iga ted the v a r ia t io n s in the con ten t o f TF , TR and
ca ffe ine w ith d i f fe re n t sources and rates o f n i trogenous fe r t i l iz e r .
The genera l obse rva tion was th a t the TF and ca ffe ine levels
22
increased w ith increase in fe r t i l iz e r ra tes , while TR levels
decreased. N itrogenous fe r t i l iz e rs a ffec ted the composition
o f the vo la t i le f la v o u r compounds ' • VFC in both G roups I
and II increased w ith in c reas ing rates o f fe r t i l iz e r ano lica tion
b u t f la v o u r index showed an in ve rse t re n d . The VFC o f
G roup I showed the la rges t v a r ia t io n s due to the v a ry in g rates
o f fe r t i l iz e r a p p lica t ion . The increase in G roup I VFC
composition and decrease in the va lue o f FI can p a r t ly exp la in
the general obse rva tion by tea g row e rs tha t the q u a l i ty o f
b lack tea de te r io ra tes w ith inc reas ing n itrogenous fe r t i l iz e r
app lica tion ra tes .
1 .5 .4 P luck ing s tanda rds .
P luck ing s tanda rds is one agronomic p rac t ice which
adve rse ly a f fec ts the q u a l i ty o f tea. In most b lack tea p rod u c in g
c o u n tr ie s , the recommended p lu c k in g s tanda rd is tender shoots
o f two leaves arid a bud , b u t occasiona lly some producers are
known to have used less tende r shoots o f more than two leaves
and a b u d . The argum ent fo r use o f coarse p lu c k in g is the
e x tra biomass obta ined in a p lu c k in g ro u n d . However, coarse
p lu c k in g s tanda rd reduces the p lu c k in g f re q u e n cy os ex tra
time must be allowed fo r p ro d u c t io n o f more shoots. Over an
extended per iod the re is not any s ig n i f ic a n t advantage in
biomass p ro d u c t io n gained by coarse p lu c k in g as fine p lu c k in g
leads to more f re q u e n t p lu c k in g s .
79In Kenya, Owuor et^ a|_ have shown th a t f ine p lu c k in g
o f up to two leaves and a bud , p roduced b lack teas w ith h igh

23
contents o f the re q u ire d ca ffe ine and TF , and low contents
o f TR . The h ighes t TF con ten t was recorded in two leaves
and a b u d . Coarse p lu c k in g p roduced teas w ith v e ry h igh
TK con ten ts . I t was also dem onstra ted th a t the VFC
especia lly the alcohols and a ldehydes in G roup I VFC
increased w ith coarse p lu c k in g s tanda rd while G roup II VFC
decreased w ith coarse p lu c k in g , thus FI also decreased w ith
coarse p lu c k in g s tanda rds . The increase in Group I VFC and
decrease In the va lue o f the FI w ith coarse p lu c k in g s tandards
p a r t ly exp la ins the poor q u a l i ty norm ally ob ta ined when coarse
65p lu ck in g s tandards are used
1 .5 .5 P ru n in g .
P run ing is also an essentia l agronomic p rac t ice in the
p roduc tion o f tea since it mainta ins the tea bushes unde r
manageable cond it ions fo r p lu c k in g . Data p resen ted by Owuor
8 0and Langat showed tha t both TF and ca ffe ine contents o f
tea improve w ith time from p ru n in g . Longer time from p ru n in g
lowered the TR con ten ts o f tea. Thus measured by TF, TR and
caffe ine con ten ts wh ich are essentia l q u a l i ty parameters fo r
Kenyan b lack tea, increase in time from p ru n in g improved
tea q u a l i ty .
In the same s tu d y , i t was observed th a t inc reas ing
time from p ru n in g lowered the sum o f G roup I VFC bu t enhanced
both sum o f G roup II VFC and F I . Thus even measured by
f la vou r c h a ra c te r is t ic s , inc reas ing time from p ru n in g , tended to
improve tea q u a l i ty .
24 -
u e OBJECTIVE OF THIS STUDY :
In view o f the d iscuss ion above, i t is im po rtan t to
f ind ways and means o f lowering the con ten t and composition
o f the Group I VFC . Th is can f i r s t be done by de te rm in ing
the fac to rs wh ich in h ib i t o r accelerate the form ation o f the
p re cu rso rs o f these G roup I VFC. P resen tly , the re is no
re p o r t availab le on the e ffec ts o f agronomic p rac t ices on the
fa t ty acids o f tea leaves.
I t th e re fo re was the main ob jec t ive o f th is s tu d y to
determ ine how d i f fe re n t agronomic p rac t ices a ffec t the con ten t
and composition o f FA o f tea leaves. By re la t in g the FA to
the Group I VFC i t was possib le where a p p ro p r ia te , to suggest
ways and means in w h ich these agronomic p rac t ices can be
manipulated so~as to im prove tea q u a l i ty . S p ec if ica lly , the
fo llow ing agronomic p rac t ices were ta rge ted fo r assessment,
a) Geographical area o f p ro d u c t io n .
In Kenya the amount o f the Group I VFC was observed
to v a ry w ith the actual geograph ica l location where the tea
50was grown . Thus some clones p roduce h ig h e r amounts o f
C6 alcohols and a ldehydes at some sites and not at o th e rs .
Th is s tu d y proposed to f in d out i f the fa t ty acids in the fresh
leaves o f clones 7/14 and 54/50 would also v a ry w ith the site
where the tea is g ro w n . The s tu d y also und e rtoo k to
q u a n t i fy the changes in fa t ty acid con ten t o f clones obta ined
w ith in Kericho tea estates where c lim atic changes w ith in a
rad ius o f about 10 k ilom eters was assumed to be minimal, bu t
the sampling sites are in d i f fe re n t a l t i tu d e s .

25
b) N itrogenous fe r t i l iz e r s .
In Kenya, the G roup I VFC con ten t was observed to
increase w ith inc reas ing rates o f n i trogenous fe r t i l iz e r
73app lica tion . Changes in l ip id levels due to n i t rogenous
fe r t i l iz e r were th e re fo re speculated b u t not p ro v e d . Th is
s tu d y proposed to q u a n t i fy any changes in the fa t ty acids
wh ich may be b ro u g h t about by v a r ia t io n s in n i trogenous
fe r t i l iz e r app lica tion ra tes .
c) P luck ing s tanda rd o r h a rv e s t in g p o l ic y .
79Studies have dem onstra ted th a t the C . alcohols andb
aldehydes in G roup I VFC increased w ith coarse p lu c k in g
s ta n d a rd . I t was thus speculated tha t the FA con ten t o f green
tea leaves would also v a ry w ith p lu c k in g s tanda rds . Th is
s tu d y was aimed at f in d in g any changes in FA con ten t o f tea
leaves w ith coarse p lu c k in g s tanda rds . T h is would help to
exp la in why C^ alcohols and a ldehydes increase w ith coarse
p lu c k in g trea tm en ts .
d) P ru n in g .
Increas ing time from p ru n in g lowered the sum o f G roup I
80VFC . Th is s tu d y proposed to id e n t i fy any changes in the
FA con ten t o f g reen tea leaves w ith inc reas ing time from p ru n in g .

26
CHAPTER TWO
RESULTS AND DISCUSSION
2.0 ID E N T IF IC A T IO N OF THE FA T T Y ACIDS OF
TEA LEAVES:
S h o r t ly a f te r in t ro d u c in g a sample o f the fa t ty acid
methyl es te r m ix tu re in to the in jec t ion p o r t o f the GC the re
was a small a i r peak followed by a peak fo r the so lvent
(hexane) in wh ich the sample was d isso lved . The base line
soon s tab il ised and peaks fo r the va r ious components emerged.
F igures 1 and 2 are the GC traces fo r the two columns
showing peaks fo r the va r ious fa t ty acids p resen t in tea leaves.
Thus bpth columns gave exce llen t separa tions o f the
fa t ty acid methyl e s te rs . The separa tion was mainly on the
basis o f c h a in - le n g th and degree o f u n s a tu ra t io n . By com paring
the re te n t ion times o r more re l ia b ly , the re la t ive re te n tion
times (Tab le 5) o f the isolated fa t ty acids w ith those o f known
fa t ty acids und e r the same cond it ions , sample fa t ty acids were
id e n t i f ie d . The id e n t i f ic a t io n s were confirm ed by c a r r y in g out
th e ir GC-M5 ana lys is (A p p e n d ix ) .

27
Figure 1: Separation o f the major fa t ty acids (as methyl es ters)o f tea leaves by CLC on a 15% DECS oh cnrom osorb W (80/100 mesh) column.Column tem pera tu re 180 ± 1°C In je c to r -D e te c to r tem pera tu re 220 ± 1°C N itrogen gas flow 40 m l/m in .
m
•80

F igu re 2: Separation o f the major fa t ty acids (as methyl es ters)
o f tea leaves by GLC on a 10% PEGA on chrom osorb W (80/100 mesh) column.Column tem pera tu re 180 ± 1°C In je c to r -D e te c to r tem pera tu re 220 ± 1°C N itrogen gas flow 40 m l/m in .

29
Table 5: Retention times (m inutes) and re la t ive re te n tion
times* o f tea leaves fa t ty acid methyl es te rs .
M ethy les te r
Retention time Relative re te n tion time
DECS PEGA DEGS PEGA
^1G:0 5.8 4.4 0.59 0.57
C 16:1 7 ' 5.3 0.71 0.69
**C 17 : 0 7.6 5.8 0.78 0.75
C ____ 9.3 7.7 1 1I u : U
r18:1 11.1 8.6 1.13 1.12
c"18:2 13.6 10.4 1.39 1.35
C 18 : 3 17.6 13.2 1.80 1.72
*R e la t ive re te n t io n time = Retention time o f es te r________Retention time o f C 1Q esterlo l l )
* * th e added in te rn a l s tanda rd
Thus i t is appa ren t th a t inc reas ing chain leng th a n d /o r degree
o f u n s a tu ra t io n increases the re te n t ion time and re la t ive
re te n t ion time o f fa t ty acids on the GC columns used.
30
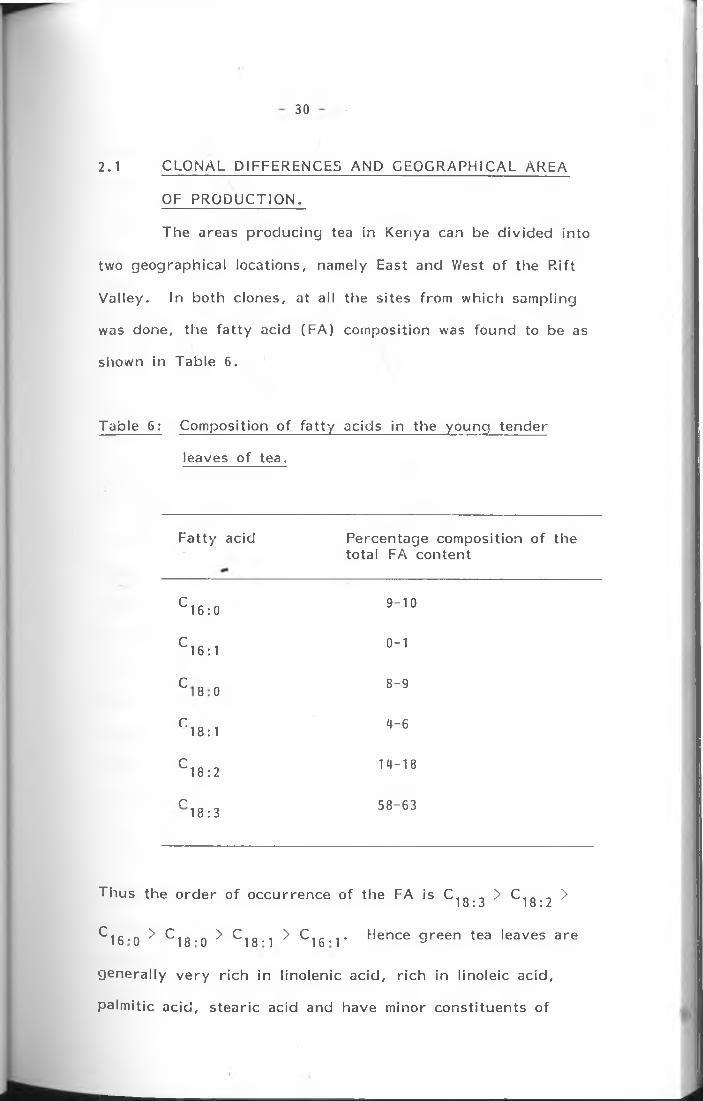
2.1 CLONAL DIFFERENCES AND GEOGRAPHICAL AREA
OF PRODUCTION.
The areas p ro d u c in g tea in Kenya can be d iv id e d in to
two geograph ica l locations, namely East and West o f the R if t
V a lley . Iri both clones, at all the sites from which sampling
was done, the fa t ty acid (FA) composition was found to be as
shown in Table 6.
Table 6: Composition o f fa t ty acids in the young tende r
leaves o f tea. * I
F a tty acid Percentage composition o f the to ta l FA con ten t
C 16:0 9-10
c 1 6 : , 0-1
nCO o
8-9
c18:1 4-6
c18:2 14-18
r18:3 58-63
Thus the o rd e r o f occu rrence o f the FA is C 10 . > C 1Q . >I o : 5 I o : L
^16*0 ^ ^18 -0 ^ ^18-1 ^ ^16*1* Hence green tea leaves are
gene ra lly v e ry r ic h in l ino len ic ac id , r ic h in l ino le ic ac id ,
pa lm itic ac id , s tea r ic acid and have m inor c o n s t i tu e n ts o f
31
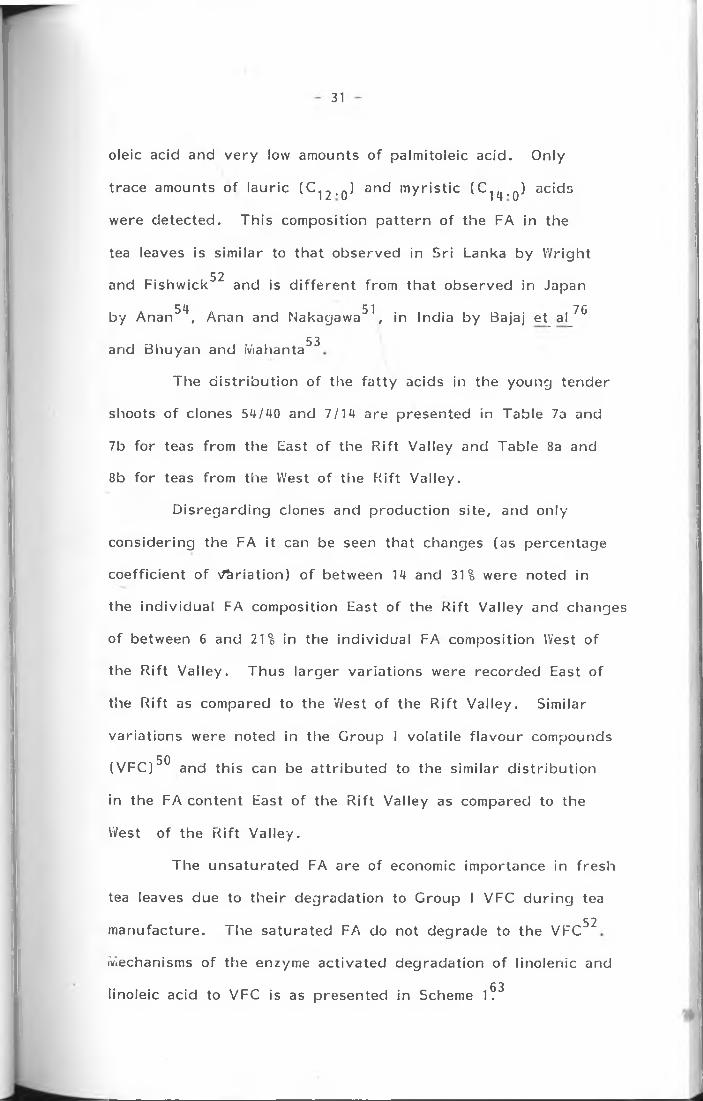
oleic acid and v e ry low amounts o f pa lm ito le ic ac id . Only
trace amounts o f la u r ic ( C ^ . q) and m y r is t ic ( C ^ . g ) acids
were de tec ted . Th is composition p a t te rn o f the FA in the
tea leaves is s im ila r to th a t observed in Sri Lanka by W righ t
52and F ishw ick and is d i f fe re n t from th a t observed in Japan
54 51 76by Anan , Anan and Nakagawa , in Ind ia by Bajaj et^ al_
53and Bhuyan and iViahanta
The d is t r ib u t io n o f the fa t ty acids in the young tende r
shoots o f clones 54/40 and 7/14 are presen ted in Table 7a and
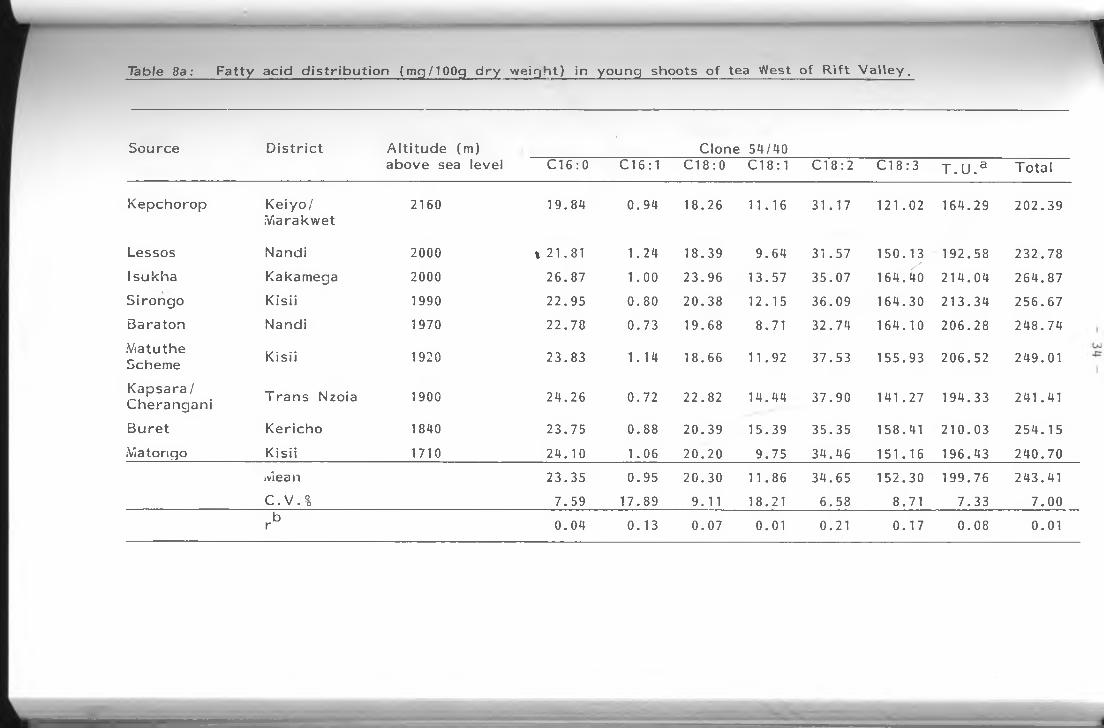
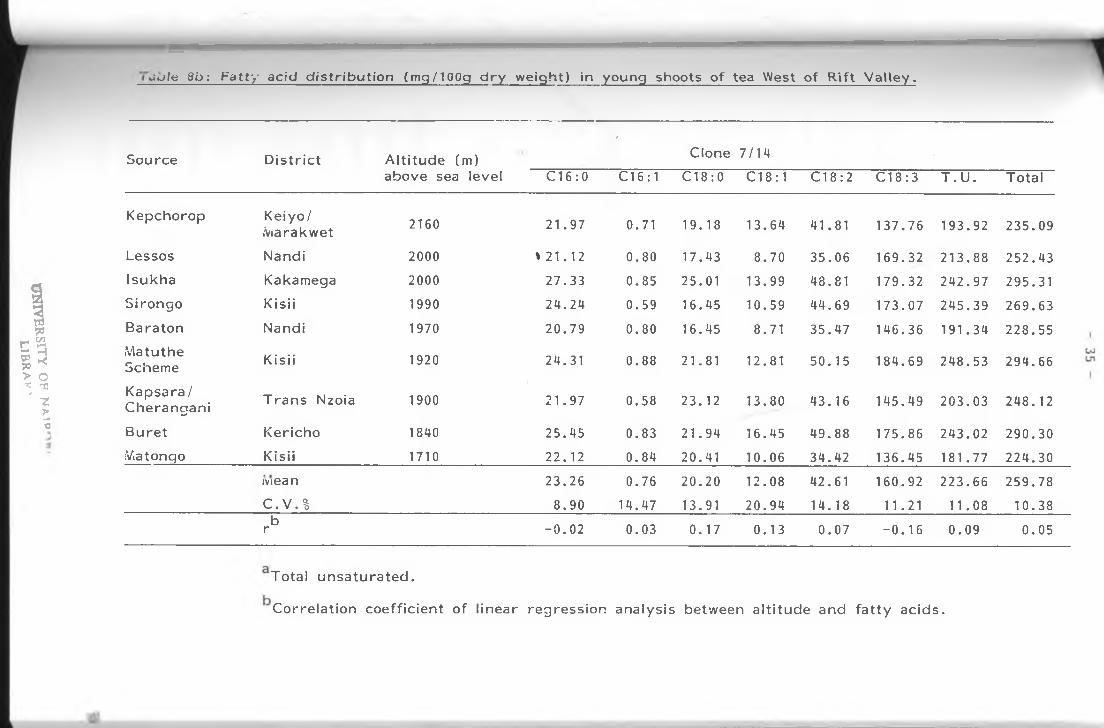
7b fo r teas from the East o f the R if t Va lley and Table 8a and
8b fo r teas from the West o f the R i f t Va lley .
D is re g a rd in g clones and p ro d u c t io n s ite , and on ly
cons ide r ing the FA i t can be seen tha t changes (as percen tage
coe ff ic ien t o f Va ria tion ) o f between 14 and 31% were noted in
the in d iv id u a l FA composition East o f the R if t Va lley and changes
o f between 6 and 21% in the in d iv id u a l FA composition West o f
the R if t V a lley . Thus la rg e r v a r ia t io n s were recorded East o f
the R if t as compared to the 'West o f the R i f t V a lle y . Similar
v a r ia t io ns were noted in the Group I vo la t i le f la v o u r compounds
50(VFC) and th is can be a t t r ib u te d to the s im ilar d is t r ib u t io n
in the FA con ten t East o f the R if t Va lley as compared to the
West o f the R i f t V a lley .
The unsa tu ra te d FA are o f economic im portance in f resh
tea leaves due to th e ir deg rada t ion to G roup I VFC d u r in g tea
52m anufac tu re . The sa tu ra ted FA do not degrade to the VFC
Mechanisms o f the enzyme ac t iva ted deg rada t ion o f l ino leriic and
6 3linole ic acid to VFC is as p resen ted in Scheme 1.

T a b le 7a : F a t t y a c id d i s t r i b u t i o n (m g /1 00 g d r y leaf) in y o u n g shoots o f tea East o f R i f t V a l le y
Source D is t r ic t A l t i tu d e (m) Clone 54/40above sea level C 1 6 : 0 C 1 6 :1 C1 8:0 C l 8:1 C 1 8 :2 C l 8 :3 T . U . 3 Tota l
Kaaga Kiambu 2190 17.39 0.67 16.37 8.44 26.46 99.75 135.38 169.08fvlakamboki .Viurang'a 2100 25.51 0.65 30.85 19.40 44.93 146.50 211.48 267.84K ionyo iVeru 2090 21.95 0.55 19.96 10.92 36.45 140.65 188.57 230.48K ia ru te ra iVleru 2070 25.57 0.65 23.82 17.61 45.82 159.72 223.80 273.19Kangaita K ir in y a g a 2050 1 32.04 1.17 26.75 20.33 54.41 210.77 286.68 345.47G atundu Kiambu 2030 19.18 0.76 17.67 9.48 30.51 113.45 154.30 191.15Vahiga N ye ri 2000 22.22 1.18 22.24 11.80 26.88 92.48 132.70 177.16Ir ia ini N ye ri 1990 22.02 0.87 20.56 13.84 36.46 144.66 195.83 238.41K i r i t i .Viurang'a 1970 26.08 1.15 20.18 14.58 39.44 133.17 188.34 234.60U ru k u V e ru 1970 21.61 0.92 18.52 9.85 27.58 123.65 162.00 202.13iViugui Embu 1900 26.46 0.66 20.10 14.42 39.11 130.51 184.70 231.26Othaya Lower N ye ri 1870 21.53 0.97 23.62 12.71 36.63 161.22 211.53 256.68K iara tha Viurang'a 1840 24.22 0.70 22.74 13.13 39.42 159.79 213.04 260.00Kiambagathi Embu 1730 23.92 0.93 25.24 15.14 35.35 129.33 180.75 229.91iVianyata Embu 1730 22.83 0.38 21.04 13.83 37.88 142.36 194.45 238.35iV.au a .V.eru 1640 17.63 0.52 16.55 9.30 29.16 100.92 139.90 174.08N ith i .Vieru 1510 25.95 0.46 22.23 17.34 39.00 160.83 217.63 265.81
iViean 23.30 0.78 21.67 13.65 36.80 138.24 189.47 234.45C V.% 14.98 30.77 16.71 25.20 19.46 20.22 19.71 18.29r b 0.01 0.13 0.06 0.13 0.12 -0 .0 2 -0 .0 2 0.10
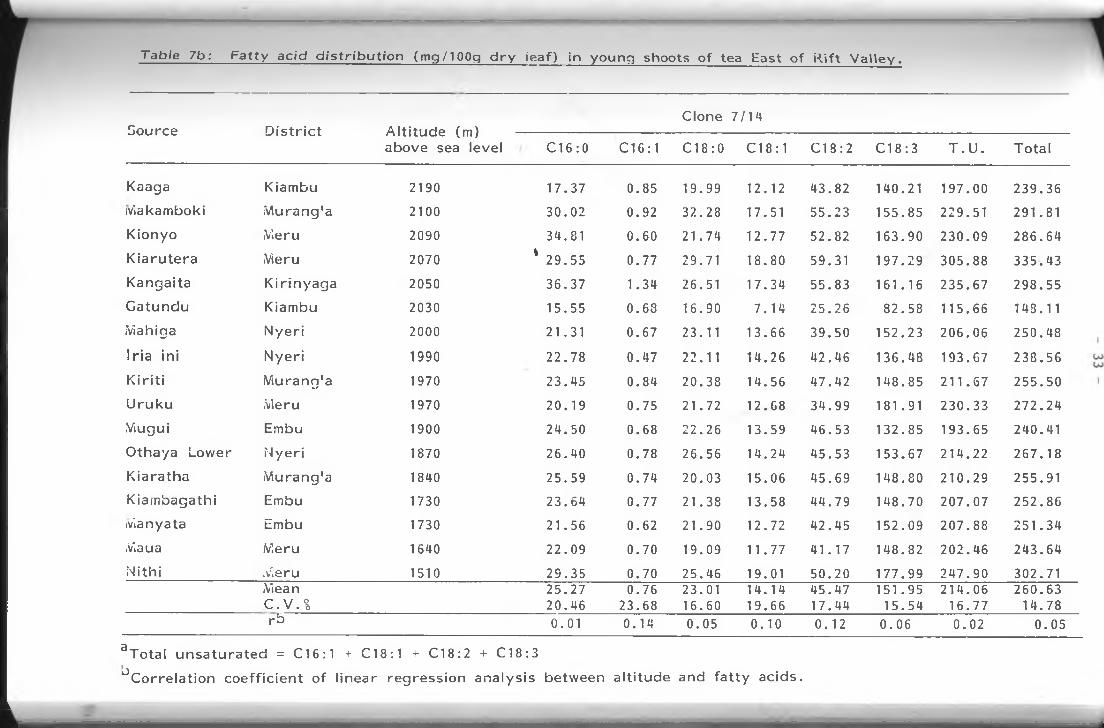
T a b le 7b : F a t t y a c id d i s t r i b u t io n (mq/IOOg d r y iea f) in y o u n g shoots o f tea East o f R i f t V a l le y .
Source D is t r ic t A l t i tu d e (m) above sea level
Clone 7/14
C l 6:0 Cl 6:1 Cl 8:0 C l 8:1 C l 8:2 C1 8:3 T .U . Tota l
Kaaga Kiambu 2190 17.37 0.85 19.99 12.12 43.82 140.21 197.00 239.36iviakamboki V lurang'a 2100 30.02 0.92 32.28 17.51 55.23 155.85 229.51 291.81K ionyo iVieru 2090 34.81 0.60 21.74 12.77 52.82 163.90 230.09 286.64K ia ru te ra Vieru 2070 1 29.55 0.77 29.71 18.80 59.31 197.29 305.88 335.43Kangaita K ir in y a g a 2050 36.37 1.34 26.51 17.34 55.83 161.16 235.67 298.55G atundu Kiambu 2030 15.55 0.68 16.90 7.14 25.26 82.58 115.66 148.11iViahiga N ye ri 2000 21.31 0.67 23.11 13.66 39.50 152.23 206.06 250.48
Ir ia in i N ye ri 1990 22.78 0.47 22.11 14.26 42.46 136.48 193.67 238.56K i r i t i M urang 'a 1970 23.45 0.84 20.38 14.56 47.42 148.85 211.67 255.50U ru k u .Vieru 1970 20.19 0.75 21.72 12.68 34.99 181.91 230.33 272.24.Viugui Embu 1900 24.50 0.68 22.26 13.59 46.53 132.85 193.65 240.41Othaya Lower N ye r i 1870 26.40 0.78 26.56 14.24 45.53 153.67 214.22 267.18K ia ra tha M urang 'a 1 840 25.59 0.74 20.03 15.06 45.69 148.80 210.29 255.91Kiambagathi Embu 1730 23.64 0.77 21.38 13.58 44.79 148.70 207.07 252.86ivianyata Embu 1730 21.56 0.62 21.90 12.72 42.45 152.09 207.88 251.34Maua Meru 1640 22.09 0.70 19.09 11.77 41.17 148.82 202.46 243.64N ith i Meru 1510 29.35 0.70 25.46 19.01 50.20 177.99 247.90 302.71
MeanC .V .%
25.2720.46
0.7623.68
23.0116.60
14.1419.66
45.4717.44
151.9515.54
214.0616.77
260.6314.78
rb 0.01 0.14 0.05 0.10 0.12 0.06 0.02 0.05
aTota l u n s a tu ra te d = C 16 :1 + C 18 :1 + C18:2 + C18:3
^ C o rre la t io n c o e f f ic ie n t o f l inea r regress ion ana lys is between a l t i tu d e and fa t t y ac ids.
Tab le 8a : F a t ty ac id d i s t r i b u t io n (m q/lOOg d r y w e ig h t ) in y o u n g shoots o f tea West o f R i f t V a l le y , 1
5ource D is t r ic t A l t i tu d e (m)4
Clone 54/40above sea level C l 6:0 C l 6:1 C l 8:0 C l 8:1 C 18 :2 C l 8:3 T . U . a Tota l
Kepchorop K e iyo /.Viarakwet
2160 19.84 0.94 18.26 11.16 31.17 121.02 164.29 202.39
Lessos Nandi 2000 % 21.81 1.24 18.39 9.64 31.57 150.13 192.58 232.78X
Isukha Kakamega 2000 26.87 1.00 23.96 13.57 35.07 164.40 214.04 264.87S irongo Kis ii 1990 22.95 0.80 20.38 12.15 36.09 164.30 213.34 256.67Bara ton Nandi 1970 22.78 0.73 19.68 8.71 32.74 164.10 206.28 248.74
M atu theScheme Kis ii 1920 23.83 1.14 18.66 11.92 37.53 155.93 206.52 249.01
K a psa ra / Cherangan i T ra n s Nzoia 1900 24.26 0.72 22.82 14.44 37.90 141.27 194.33 241.41
B u re t Kericho 1840 23.75 0.88 20.39 15.39 35.35 158.41 210.03 254.15iViatoriqo K is ii 1710 24.10 1.06 20.20 9.75 34.46 151.16 196.43 240.70
iviean 23.35 0.95 20.30 11.86 34.65 152.30 199.76 243.41C .V .% 7.59 17.89 9.11 18.21 6.58 8.71 7.33 7.00
br 0.04 0.13 0.07 0.01 0.21 0.17 0.08 0.01
►
0JHV
ERS1TY
OF N
*'» U
BR
Ap
'
j u l e 8 b : F a t ty a c id d is t r ib u t io n (mg/IOOg d r y w e ig h t ) in yo un g shoots o f tea West o f R i f t V a l le y .
Source D is t r ic t A l t i tu d e (m)
-Clone 7/14
above sea level C l 6:0 Cl 6:1 C l 8:0 C 1 8 :1 C l 8:2 C1 8:3 T .U . Tota l
Kepchorop K e iyo /iViarakwet 2160 21.97 0.71 19.18 13.64 41.81 137.76 193.92 235.09
Lessos Nandi 2000 *21 .12 0.80 17.43 8.70 35.06 169.32 213.88 252.43Isukha Kakamega 2000 27.33 0.85 25.01 13.99 48.81 179.32 242.97 295.31S irongo Kis ii 1990 24.24 0.59 16.45 10.59 44.69 173.07 245.39 269.63Baraton Nandi 1970 20.79 0.80 16.45 8.71 35.47 146.36 191.34 228.55M atu theScheme Kis ii 1920 24.31 0.88 21.81 12.81 50.15 184.69 248.53 294.66
Kapsara / Cherangan i T ra n s Nzoia 1900 21.97 0.58 23.12 13.80 43.16 145.49 203.03 248.12
B u re t Kericho 1840 25.45 0.83 21.94 16.45 49.88 175.86 243.02 290.30V.atongo Kis ii 1710 22.12 0.84 20.41 10.06 34.42 136.45 181.77 224.30
mean 23.26 0.76 20.20 12.08 42.61 160.92 223.66 259.78C .V .% 8.90 14.47 13.91 20.94 14.18 11.21 11.08 10.38
br -0 .02 0.03 0.17 0.13 0.07 -0 .1 6 0.09 0.05
Tota l u n s a tu ra te d .
C o rre la t ion co e ff ic ie n t o f l inea r reg ress ion ana lys is between a l t i tu d e and fa t t y ac ids .

In Kenyan b lack teas, the G roup I VFC are dominated
by the unsa tu ra te d alcohols and a ldehydes wh ich are
p roduc ts o f l ino len ic acid deg ra da t ion . These are followed by
hexanal and hexanol which are p ro d u c ts o f l ino le ic acid
d e g ra d a t io n ? '41,50,80 The sa tu ra ted c o n s t i tu e n ts are
followed by v e ry low levels o f nonanal and n-nonano l ’which
are p rodu c ts o f oleic acid deg ra da t ion . These are followed
by heptanal and n -hep tano l which are p ro d u c ts o f palm ito le ic
acid deg ra da t ion . The o rd e r o f occu rrence o f these Group I
VFC follows the o rd e r o f occu rrence o f th e ir p re c u rs o r fa t ty
acid con ten t in the f resh tea leaves (Tab le 6 ) . Th is o rd e r o f
occurrence is on ly an app rox im a tion due to the VFC losses
d u r in g tea m anu fac tu re . The lower bo i l ing vo la t i le f la v o u r
compounds w ill vo la t i l ize more and p ro p o r t io n a te ly h ig h e r amounts
o f the compounds w ill be lost d u r in g tea m anufac tu re and
p rocess ing .
Analyses o f the co rre la t io n co e ff ic ie n ts , r (Tab le 7 and
8) o f the l inea r regress ion between the FA con ten t and a lt i tud e
showed th a t the r values are v e ry small and close to zero.
These values are not s ig n i f ic a n t . T h is , bas ica l ly , implies that
there is no association between FA and a l t i tu d e und e r the wide
var ia t ions o f ecological and climatic cond it ions .
50Gwuor et_ aj also observed th a t the re was genera lly
no s ig n if ic a n t re la t io n sh ip between the G roup I VFC and
a lt i tud e fo r teas ob ta ined East and West o f the R i f t Va lley .
50Thus th is obse rva tion by Owuor et_ a]_ can p a r t ly be a t t r ib u te d to
lack o f a c o r re la t io n between the FA and a l t i tu d e . Th is
fu r th e r ind ica tes th a t o th e r fac to rs de term ine the FA content
I - 36 -

37 -
and the f la v o u r q u a l i ty aspect o f Kenyan teas w he the r the
tea is g row n East o r West o f the R if t V a lley .
Tables 7 and 8 show th a t the FA con ten t o f a clone
changes w ith any change in the locational area o f p ro d u c t io n .
For example, the tota l FA con ten t o f clone 54/40 in the East
o f the R i f t Valley changed from 169.08 mg/100g d r y leaf
(Kaaga, Kiambu) to 345.47 mg/100g d r y leaf (K anga ita ,
K i r in y a g a ) . The tota l FA con ten t o f clone 7/14 va r ied from
148.11 mg/100g d r y leaf (G a tund u , Kiambu) to 335.43 mg/100g
d r y leaf (K ia ru ta ra , V .eru). These were v e ry la rge d if fe rences
especia lly when one cons iders th a t the va r ious areas of
p rodu c t ion are not more than 200 k ilom eters apa rt and have
on ly an a l t i tu d e d i f fe re n c e o f 680 meters. In the West o f the
K i f t Va lley clone 54/40 had a tota l FA con ten t v a ry in g from
202.39 mg/100g d r y leaf (K apche rop , Keiyo, iV.arakwet) to
264.87 mg/IOOg d r y leaf ( Is u k h a , Kakamega) while clone 7/14
had a tota l FA con ten t v a ry in g from 224.30 (.Viatongo, K is ii)
to 295.31 mg/100g d r y leaf ( Is u k h a , Kakamega). These are
also s ig n if ic a n t d i f fe re n ce s w ith in an area o f rad ius 100 k i lo
meters and an a l t i tu d e d i f fe re n c e o f on ly 450 m eters. Even
w ith in the same d is t r i c t it was observed tha t the FA con ten t
o f a clone changed when the site o f g ro w th changed. The
va r ia t io ns had no p a t te rn , were independen t o f a l t i tud es and
were c lona lly dependen t.
50Similar obse rva tions were made by Owuor et^ a]^ on
the con ten t and composition o f the Group I VFC. The con ten t
o f these o f f - f la v o u r vo la t i le compounds, l ike the con ten t o f

38
th e ir p re c u rs o r FA, was observed to v a ry w ith the
locational area where the tea was g ro w n . The v a r ia t io n s
d id not fo llow any p a t te rn and were c lona lly dependent.
Thus the observed concen tra t ion changes in G roup I VFC
w ith locational area o f p ro d u c t io n can be exp la ined as due
to s im ilar v a r ia t io n s in the FA con ten t o f g reen tea leaves.
A fu r t h e r comparison o f the teas from East and West
o f the R if t Va lley showed tha t the con ten t o f the tota l unsa tu ra ted
FA, especia lly the p o ly u n s a tu ra te d , l ino len ic acid waS
h ig h e r in clones West o f the R if t Va lley as compared to clones
East o f the R i f t V a lley . Thus the q u a l i ty d i f fe rences th a t have
been noted in the past, where teas East o f the R if t Va lley were
ra ted b e t te r q u a l i ty can p a r t ly be a t t r ib u te d to teas East o f
the R if t Va lley hav ing lower FA con ten ts .
A comparison o f the two clones used in th is s tu d y ,
at any one s ite , showed marked species va r ia t io ns in the
amounts o f the FA. In fac t, in the East o f the R i f t Valley
the d if fe re n ce s in the tota l FA con ten t o f the two clones 54/40
and 7/14 wh ich are g row n at the same s ite , ranged from 0.15
( I r ia in i , N ye r i) to 73.32 mg/IOOg d r y leaf (Mahiga, N y e r i ) .
In the West o f the R if t Va lley , the d if fe rences in the tota l FA
con ten t ranged from 6.71 (C he rangan i, Nzoia) to 45.65 mg/100n
d r y leaf (M atu tu Scheme, K is i i ) . Thus clonal d i f fe rences were
la rg e r East o f the R i f t Va lley compared to West. The
obse rva tion made by Owuor et_ a]_ re g a rd in g the G roup I VFC
where clonal d i f fe rences East o f the R if t Va lley were more
39 -
than West o f the R if t Va lley can be a t t r ib u te d to the observed
clonal d i f fe rences in the FA con ten t.
An in te re s t in g obse rva t ion , how ever, about clonal
v a r ia t io n s was th a t fo r nea rly all sampling sites in Kenya
clone 7/14 had a h ig h e r FA con ten t than clone 54/40. Consequently
clone 7/14 would have a h ig h e r con ten t o f G roup I VFC than
clone 54/40 and thus th is clone is expected to have a lower
f la v o u r q u a l i ty .
The noted v a r ia t io n s in the FA o f clonal teas grow n
at the same s ite and rece iv ing same agronomic and c u l tu ra l
p rac t ices may be a t t r ib u te d to the basic gene tic d i f fe rences
o r may re f le c t the response o f the p a r t ic u la r clone to the
immediate env iro nm en t.
The d i f fe r in g " 'F A composition o f the tea leaves due to
geograph ica l location o f p ro d u c t io n can be a t t r ib u te d to the
tea chem ica l/b iochem ical composition reac t ing d i f fe re n t ly to a
v a r ie ty o f env ironm enta l cond it ions th a t are found in the areas
where the tea is g ro w n . Th is d i f fe r in g chem ica l/b iochem ical
composition o f tea re su lts in q u a l i ty v a r ia t io n s and is b ro u g h t8i 82
about by d i f fe re n t g ro w th ra tes . ' Factors th a t are known
to cause v a r ia t io n s in tea g ro w th ra te and hence q u a l i ty
8 3inc lude average a i r tem pera tu re , d is t r ib u t io n and tota l
amounts o f ra in fa l l? 7, **4 sunsh ine hours and cloud cover**5,
fog and typ e o f so i l47. A l th o u g h ra in fa l l d is t r ib u t io n s in
Fast and West o f the R i f t Va lley in Kenya are not v e ry d i f fe re n t ,
not all areas where the sampling was done rece ive equal amounts
o f ra in fa l l in arty one season. A lso, in all these tea g row ing
areas, the re are d i f fe re n ce s in the average a ir tem pera tu re ,
40 -
sunsh ine hou rs and cloud cover (hence l ig h t in te n s i t ie s ) ,
fog and soil ty p e s . The d i f fe re n c e in all these fac to rs
w ith localit ies help to exp la in the obse rved s ig n if ic a n t
v a r ia t io ns in tea FA con ten t . The m agnitude o f the va r ia t io ns
in d i f fe re n t geograph ica l locations fo r d i f fe re n t clones
ind ica te th a t not all clones behave in the same manner und e r
d i f fe re n t geograph ica l cond it ions .
In Kenya, time from last p ru n e has been shown to
8 0a ffe c t the chemical composition and hence q u a l i ty o f b lack tea
For example, teas w ith longer per iods since last p ru n in g had
lower G roup I VFC and thus teas w ith longer per iods since
last p ru n in g had h ig h e r values o f f la v o u r index and were o f
b e t te r f la v o u r q u a l i ty . The teas used in th is s tu d y were in
d i f fe re n t p e r io d ^ from last p ru n in g . The teas were g rouped
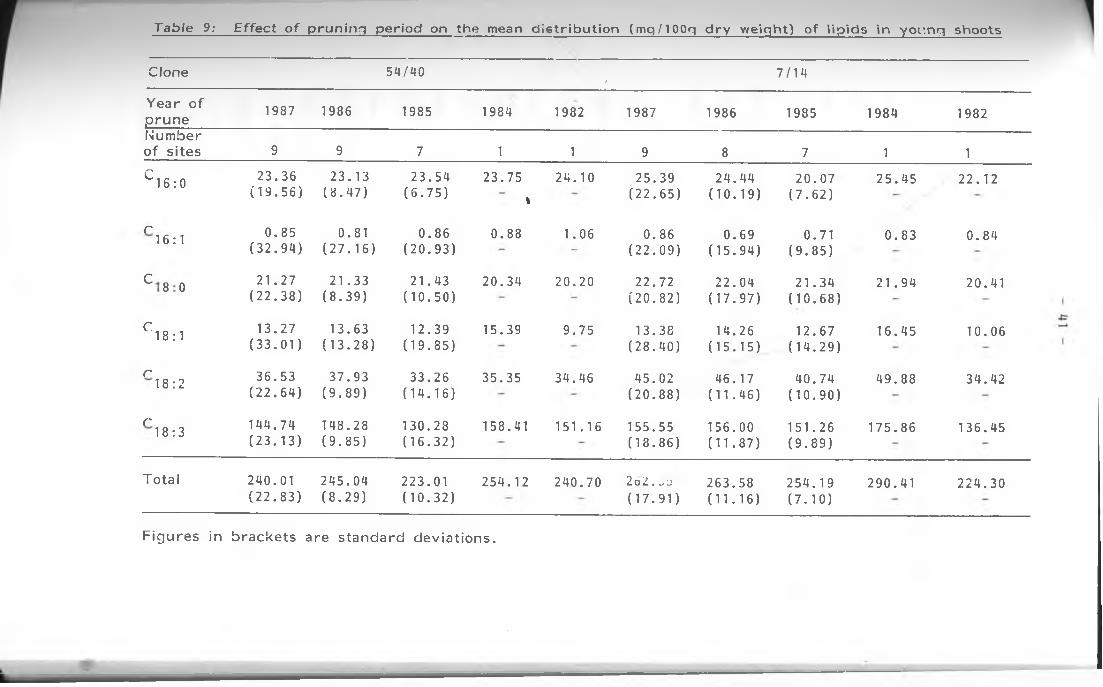
on the basis o f year o f p ru n in g and Table 9 shows the mean
FA com positions. From the table i t is appa ren t the re were
no apprec iab le changes in the FA composition due to periods
from last p ru n in g fo r the two clones s tu d ie d . Lack o f
apprec iab le changes in the FA con ten t due to per iods from last
p ru n in g can be a t t r ib u te d to the many climatic and env ironm enta l
changes o c c u r r in g due to the d i f fe r in g locational area o f
p ro d u c t io n .
The many c lim atic and env ironm enta l d i f fe rences
o c c u r r in g in the areas p ro d u c in g tea in Kenya cause va r ia t io ns
in the g ro w th ra te hence chemical composition and q u a l i ty o f
the teas from these areas. iViwakha has
shown tha t the g ro w th rates o f clonal teas v a ry w ith a l t i tu d e
such th a t as a l t i tu d e increases g ro w th ra te decreases. Thus
T a b l e 9: E f f e c t o f p r u n i n g p e r io d on t he mean d is t r ib u t io n (mq/IOOg d r y w e ig h t ) o f l ip id s in y o u n g shoo ts
Clone 54/40 , 7/14
Year o f p ru n e 1987 1986 1985 1984 1982 1987 1986 1985 1984 1982Number o f s ites 9 9 7 1 1 9 8 7 1 1
C 16:0 23.36(19.56)
23.13(8.47)
23.54(6.75)
23.75i
24.10 25.39(22.65)
24.44(10.19)
20.07(7.62)
25.45 22.12
r16:1 0.85
(32.94)0.81
(27.16)0.86
(20.93)0.88 1.06 0.86
(22.09)0.69
(15.94)0.71
(9.85)0.83 0.84
n 00 o 21.27(22.38)
21.33(8.39)
21.43(10.50)
20.34 20.20 22.72(20.82)
22.04(17.97)
21.34(10.68)
21.94 20.41
c18:1 13.27
(33.01)13.63
(13.28)12.39
(19.85)15.39 9.75 13.38
(28.40)14.26
(15.15)12.67
(14.29)16.45 10.06
r18:2 36.53
(22.64)37.93
(9.89)33.26
(14.16)35.35 34.46 45.02
(20.88)46.17
(11.46)40.74
(10.90)49.88 34.42
r18:3 144.74
(23.13)148.28(9 .85)
130.28(16.32)
158.41 151.16 155.55(18.86)
156.00(11.87)
151.26(9.89)
175.86 136.45
Tota l 240.01(22.83)
245.04(8.29)
223.01(10.32)
254.12 240.70 2 o 2 . ̂j ( 17 . 91 )
263.58(11.16)
254.19(7.10)
290.41 224.30
F igu res in b racke ts are s tanda rd dev ia t ion s .
42
h igh a l t i tu d e teas have been cons idered o f b e t te r q u a l i ty .
To minimise as much as possib le the e ffec ts o f env ironm enta l
and c limatic d i f fe re n ce s on the FA con ten t and composition
o f tea leaves, a s tu d y was c a r r ie d ou t on the FA o f clonal
teas ob ta ined in Kericho tea es ta tes. Samples were obta ined
from fo u r g ro w in g sites all w i th in a rad ius o f about 10 k ilom eters
and a p a r t from a l t i tu d e and location o f the p ro d u c t io n s ite ,
c limatic changes w ith in such a sh o r t rad ius were assuemd to be
minimal. Clones 6 /8 , TN14-3 and S15/10 were used.
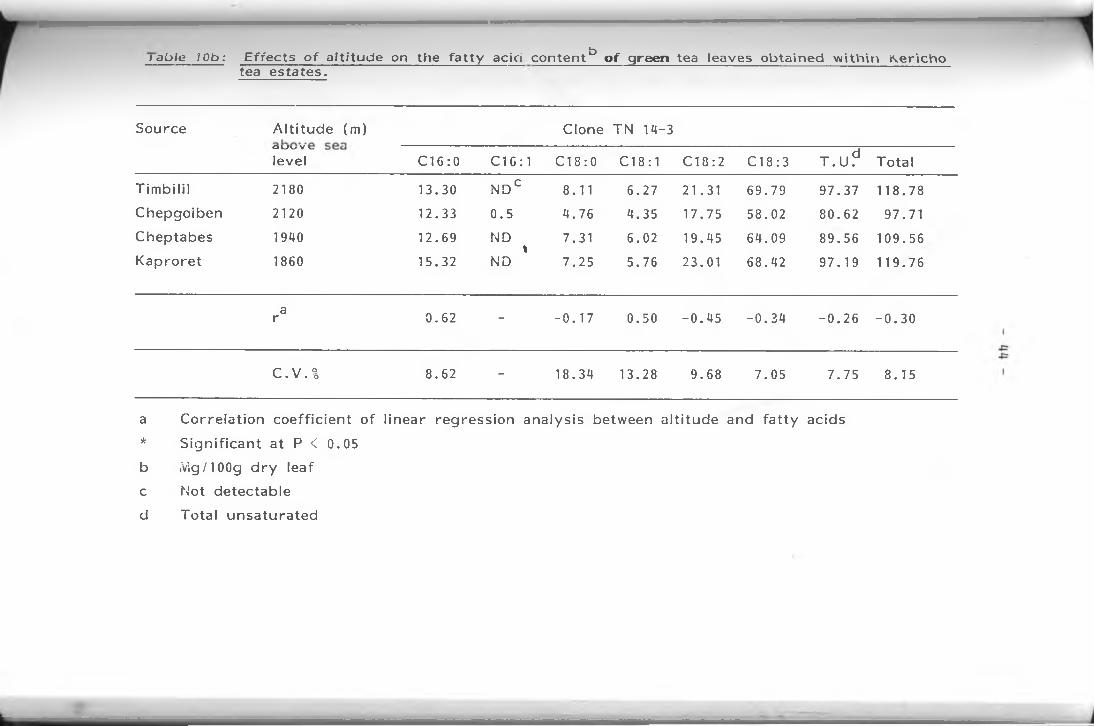
The resu lts o f th is s tu d y are g iven in Table 10a, b and
c. The tab le also shows the c o rre la t io n coe ff ic ie n t values ( r ) o f
the linea r reg ress ion ana lys is between a l t i tu d e and FA. Palmitic
acid o f all the th ree clones g en e ra l ly showed s ig n if ic a n t c o r re
la tions w ith a l t i tu d e . Palmitic acid levels increased w ith
decreas ing a l t i tu d e excep t fo r clone TN 14-3 where a reverse
t re n d was obse rve d . S tear ic acid con ten t fo r all clones
decreased w ith inc reas ing a l t i tu d e b u t the decrease was qu i te
s ig n i f ic a n t fo r clone 6 /8 . Oleic acid con ten t o f the clones 6/8
and TN 14-3 showed some increase w ith a l t i tu d e while fo r clone
S15/10 oleic acid decreased w ith a l t i tu d e . The changes were
not s ig n i f ic a n t . L ino le ic acid also changed w ith area o f sam pling.
For clone 6/8 lino le ic acid increased w ith inc reas ing a l t i tu d e . The
co rre la t io n coe ff ic ie n t fo r lino le ic acid and a l t i tu d e was s ig n if ic a n t
at P<0.05. However, fo r clones TN 14-3 and 515/10 lino le ic
acid showed a decrease w ith increase in a l t i tu d e b u t th is
re la t io nsh ip was not s ig n i f ic a n t . L ino len ic acid o f clone 6/8 and
TN 14-3 showed nega tive co rre la t io ns w ith a l t i tu d e while i t had
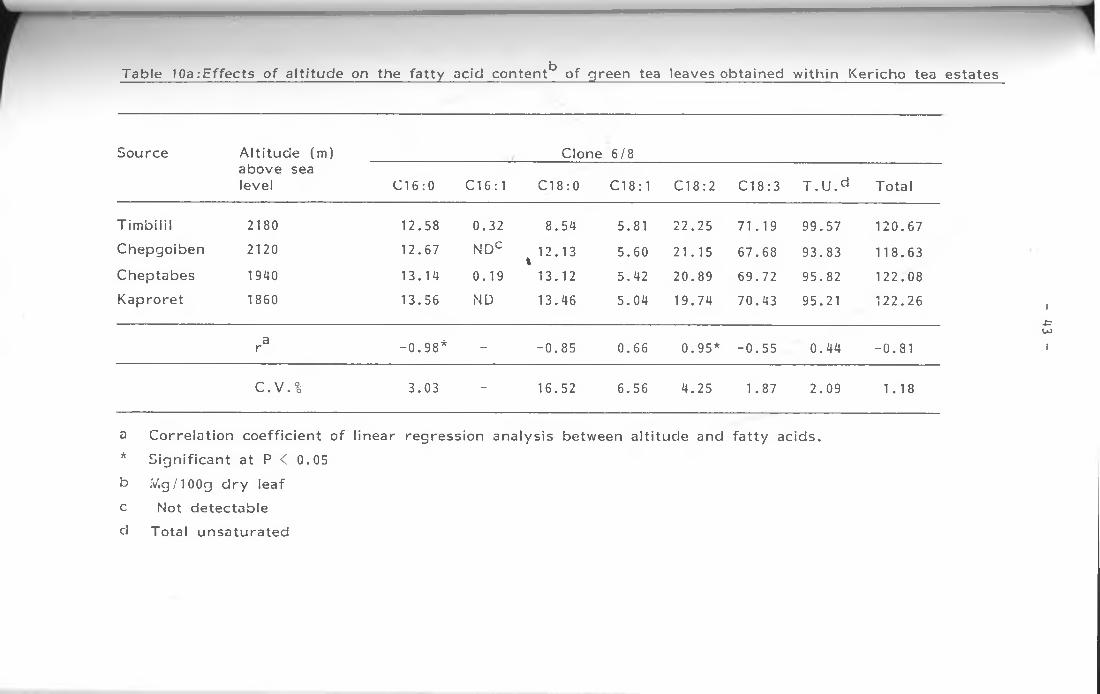
Table 10a:E f f e c t s o f a l t i tu d e on the fa t ty acid con ten t b o f g reen tea leaves ob ta ined w i th in K e richo tea esta tes
Source A l t i tu d e ( m ) __________________ Clone 6/8above sealevel C l 6:0 C l 6:1 Cl 8:0 Cl 8:1 C l 8:2 C l 8:3 T . U . d Tota l
T im b i l i l 2180 12.58 0.32 8.54 5.81 22.25 71.19 99.57 120.67Chepgo iben 2120 12.67 NDC 12.13t 5.60 21.15 67.68 93.83 118.63Cheptabes 1940 13.14 0.19 13.12 5.42 20.89 69.72 95.82 122.08K a p ro re t 1860 13.56 ND 13.46 5.04 19.74 70.43 95.21 122.26
ar -0 .9 8 * * - -0 .85 0.66 0.95* -0 .5 5 0.44 -0.81
C .V .% 3.03 _ 16.52 6.56 4.25 1.87 2.09 1.18
a C o rre la t io n coe f f ic ie n t o f l inea r regress ion ana lys is between a l t i tu d e and fa t t y ac ids.
* S ig n i f ic a n t a t P < 0.05
b .V.g/100g d r y leaf
c Not de tec tab le
d Tota l u n s a tu ra te d
i4=U>I
i able J Ob : E f f e c t s o f a l t i tu d e on the fa t ty acid c o n te n tb o f green tea leaves obta ined w i th in J e r ic h otea estates.
Source A l t i tu d e (m) Clone TN 14-3C iT 7 v /" V >—■ ” ”
level C l 6:0 C l 6:1 C l 8:0 C l 8:1 C l 8:2 C l 8:3 T . U ? Tota l
T im b il i l 2180 13.30 N D C 8.11 6.27 21.31 69.79 97.37 118.78Chepgoiben 2120 12.33 0.5 4.76 4.35 17.75 58.02 80.62 97.71Cheptabes 1940 12.69 ND l 7.31 6.02 19.45 64.09 89.56 109.56K a p ro re t 1860 15.32 ND 7.25 5.76 23.01 68.42 97.19 119.76
ar 0.62 - -0 .1 7 0.50 -0 .4 5 -0 .3 4 -0 .2 6 -0 .3 0
C.V .% 8.62 _ 18.34 13.28 9.68 7.05 7.75 8.15
a C o rre la t ion co e ff ic ie n t o f l inea r reg ress ion ana lys is between a l t i tu d e and fa t ty acids
* S ig n i f ic a n t at P < 0.05
b Mg/IOOg d r y leaf
c Not de tectab le
d Tota l u n sa tu ra te d
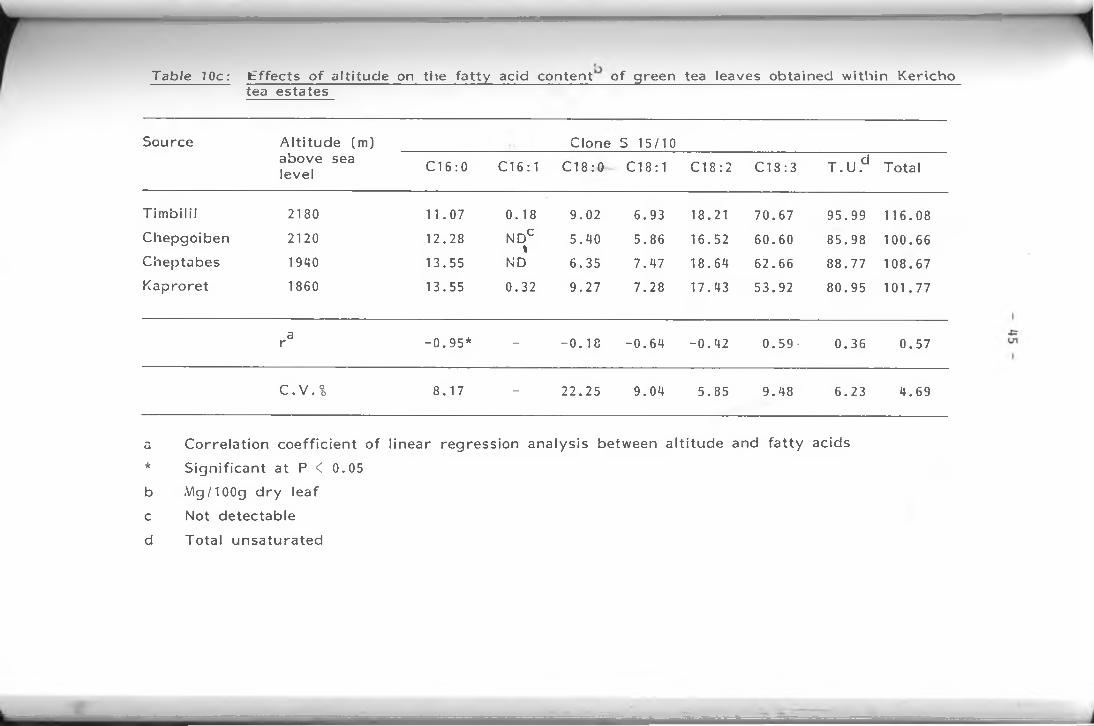
Table 10c: E f f e c t s o f a l t i tu d e on the fa t ty acid con ten t o f g reen tea leaves obta ined w i th in K e richotea estates
Source A l t i tu d e (m) above sea level
Clone S 15/10
C l 6:0 C l 6:1 C l 8:0 Cl 8:1 C18:2 C l 8:3 T .U .d Tota l
T im b il i l 2180 11.07 0.18 9.02 6.93 18.21 70.67 95.99 116.08Chepgoiben 2120 12.28 NDC
l5.40 5.86 16.52 60.60 85.98 100.66
Cheptabes 1940 13.55 ND 6.35 7.47 18.64 62.66 88.77 108.67K a p ro re t 1860 13.55 0.32 9.27 7.28 17.43 53.92 80.95 101.77
ar -0 .9 5 * - -0 .1 8 -0 .64 -0 .42 0.59- 0.36 0.57
C .V .% 8.17 - 22.25 9.04 5.85 9.48 6.23 4.69
a C o rre la t ion c o e f f ic ie n t o f l inea r regress ion ana lys is between a l t i tu d e and fa t ty acids
* S ig n i f ic a n t a t P < 0.05
b .Vig/100g d r y leaf
c Not de tec tab le
d Tota l u n sa tu ra te d
46
pos it ive co rre la t io ns fo r clone 515/10. However, all these
co rre la t io ns were not s ig n i f ic a n t . The genera l obse rva tion
was th a t the FA have a marginal increase w ith a decrease in
87a l t i tu d e . S im ilar obse rva tions were made by Owuor et al
on the behav iou r o f C roup I VFC.
Even fo r clones g row ing at the same site b ig va r ia t io ns
in the FA con ten t were obse rve d . The m agnitude and o rd e r
o f the v a r ia t io ns depend on the location. The areas from which
t l le tea samples were co llected , namely, T im b i l i l , Chepgoiben,
Cheptabes and K a p ro re t have an a l t i tu d e d i f fe re n ce ra ng ing
between 0 and 320 m eters. C limatic and env ironm enta l changes
are o b v ious ly minimal b u t data p resen ted here show tha t even
w ith such small microecological fac to rs o r geograph ica l changes,
the l ip id and fa t ty acid o f the tea would change.
I t has been recogn ised th a t im proved q u a l i ty tea can
on ly be ob ta ined from p lan ts w ith h igh q u a l i ty po ten t ia l,
p ro v id e d o the r agronomic and m a nu fac tu r ing processes are
op tim al. I t is fo r th is reason th a t e f fo r ts to p roduce h igh
q u a l i ty b lack tea from clonal materia ls have been in te n s if ie d .
A t p resen t, how ever, most p lan t improvement w o rk in Kenya
is cen tra lised in the Kericho reg ion . Th is should not be the
case.
Data p resen ted nere and in p rev io us w ork
have dem onstra ted tha t fo r b lack tea p ro d u c t io n the re are
va r ia t io ns in the chemical composition and hence q u a l i ty o f
the tea due to the loca li ty o f g ro w th , in add it ion to clonal
v a r ia t io n s and these may change w ith even marginal changes
47
in env ironm enta l fa c to rs . Similar v a r ia t io n s have been
observed in the g ro w th o f clonal teas p lan ted in d i f fe re n t
88locations. Th is suggests tha t clones chemical composition
be used in con junc t ion w ith o rgano lep tic eva lua tions and tha t
clonal f ie ld eva lua tions be done in the areas o f in tended
release before the clones are made ava ilab le to fa rm ers . Th is
would ensure th a t clones are on ly p lan ted in the areas they
are l ik e ly to have the best chemical composition re q u ire d to
p roduce the best q u a l i ty b lack tea. Th is is v e ry im po rtan t
i f q u a l i ty tea p ro d u c t io n is to be in te n s if ie d in Kenya.
2.2 EFFECTS OF NITROGENOUS FERTIL IZER S:
The e ffec ts o f n i trogenous fe r t i l iz e rs on the fa t ty
acid con ten t o f the young tende r shoots o f clone S15/10
are as shown in Table 11a and b fo r the n it roge n sources NPK5
2 5 :5 :5 :5 and NPK 20:10:10.
The re were v e ry s ig n i f ic a n t increases in the FA
(to ta l fa t ty ac ids, tota l u nsa tu ra ted fa t ty ac ids, o r in d iv id u a l
fa t ty acids) con ten t w ith inc reas ing rates o f n itrogenous
fe r t i l iz e r app lica t ions . The h ig h e r the app lica tion rates the
h ig h e r the FA con ten ts . Except fo r pa lm itic ac id , the
va r ia t io ns (as percen tage coe ff ic ie n t o f v a r ia t io n ) in the FA
fo r NPK 20:10:10 was always h ig h e r than fo r NPK5 2 5 :5 :5 :5 .
Owuor et^ a]_̂ s im ila r ly observed tha t the v a r ia t io n o f Group I
VFC when NPK 20:10:10 was app lied was h ig h e r than when
NPKS 2 5 :5 :5 :5 was app lied to clone G15/10. Th is obse rva tion
fo r NPK 20:10:10 is due to the observed va r ia t io n in the FA
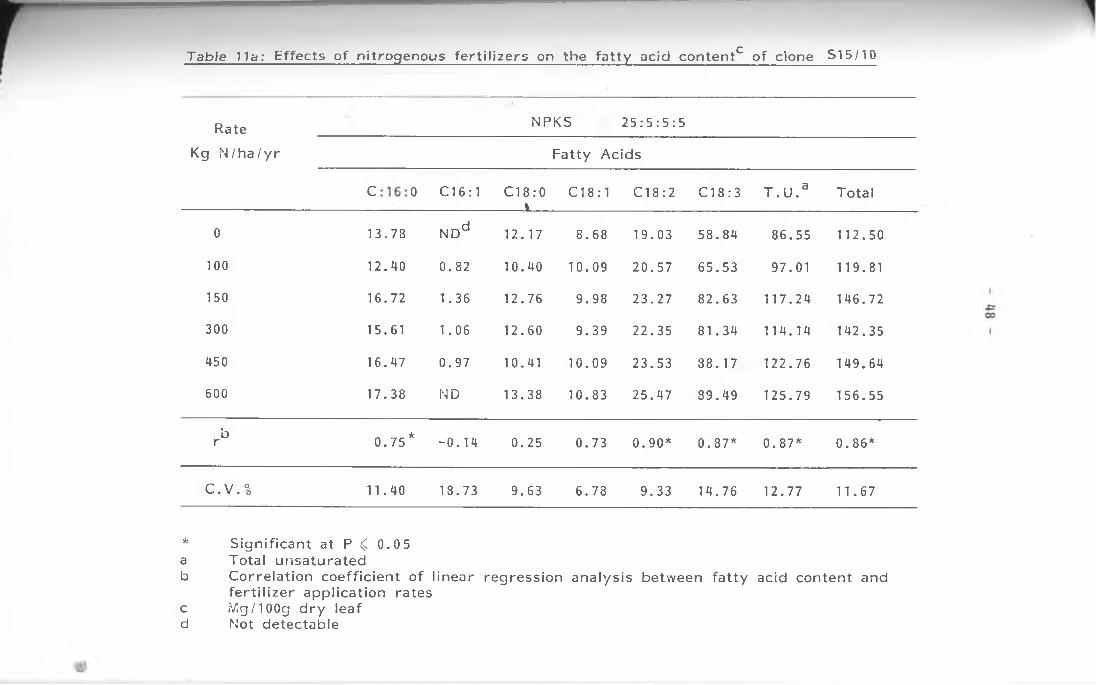
Tab le 11a: E f fe c ts o f n i t ro g e n o u s f e r t i l i z e r s on th e f a t t y ac id c o n te n t^ o f c lone S15/10
Rate _______________________________ NPKS 2 5 :5 :5 :5
Kg N / h a / y r F a t ty Ac ids
oU
C l 6:1 C 18 :0l
C 1 8 :1 C l 8 :2 C l 8:3 T . U .a Tota l
0 13.78 NDd 12.17 8.68 19.03 58.84 86.55 112.50
100 12.40 0.82 10.40 10.09 20.57 65.53 97.01 119.81
150 16.72 1.36 12.76 9.98 23.27 82.63 117.24 146.72
300 15.61 1.06 12.60 9.39 22.35 81.34 114.14 142.35
450 16.47 0.97 10.41 10.09 23.53 88.17 122.76 149.64
600 17.38 ND 13.38 10.83 25.47 89.49 125.79 156.55
br . _ _ -k0.75 -0 .1 4 0.25 0.73 0.90* 0.87* 0.87* 0.86*
C .V .% 11.40 18.73 9.63 6.78 9.33 14.76 12.77 11.67
* S ig n i f ic a n t at P ( 0 .05a Total u n sa tu ra te db C o rre la t ion c o e f f ic ie n t o f l inea r reg ress ion ana lys is between fa t t y acid con ten t and
fe r t i l i z e r app lica t ion rates iY,g/100g d r y leaf Not de tectab le
cd

Y a u le 11b : E f f e c t s o f n i t r o g e n o u s f e r t i l i z e r s on the f a t t y ac id c o n te n t0 o f c lone S i 5 /10
Ftate NPK ' 20:10:10
Kg N / h a / y r F A TTY AC 1IDS
C l 6:0 C l 6:1 C l 8:0 C l 8:1 C18:2 C l 8:3 T .U .a Tota l
0 14.94 1.80 11.09\
8.42 16.51 60.47 87.20 113.23
100 15.41 1.02 11.45 8.78 20.32 66.68 96.80 123.66
150 14.63 NDd 8.81 9.38 20.63 68.58 98.59 122.03
300 16.49 1.12 13.61 9.78 23.51 85.11 119.52 149.62
450 17.52 1.35 15.67 10.74 25.58 88.90 126.57 159.76
600 17.74 ND 16.48 11.54 25.84 93.99 131.37 165.59
br 0.93* -0 .48 0.88* 0.99* 0.95* 0.97* 0.97* 0 .97*
C .V .% 7.53 22.72 20.85 11.07 14.88 16.24 15.05 14.50
* S ig n i f ic a n t at P ^ U.05a Tota l u nsa tu ra tedb C o rre la t io n coe ff ic ie n t o f l inea r reg ress ion ana lys is between fa t ty acid co n te n t and
f e r t i l i z e r app lica t ion rates c Mg/IOOg d r y leafd Not de tec tab le
50
when th is fe r t i l iz e r is app lied .
The co rre la t io n coe ff ic ie n ts , r , o f the linear
regress ion between the FA and n itrogenous fe r t i l iz e r
app lica tion rates are as shown in Table 11. All c o r re la t io n
coe ff ic ien ts (excep t fo r pa lm ito le ic acid wh ich was
in s ig n i f ic a n t and negative) were p o s it ive , s ta t is t ic a l ly
con f irm ing the increase o f FA con ten t w ith in c reas ing n it ro g e n
leve ls . A ra th e r v e ry in te re s t in g obse rva tion was the v e ry
h igh values o f r th a t were ob ta ined . Most o f these r values
were s ig n if ic a n t at PcO.05. Th is implies tha t the increase in
the FA con ten t w ith inc reas ing n it ro g e n app lica tion rates was
l inea r . The r values fo r NPK 20:10:10 are gene ra l ly h ig h e r
than fo r NPKS 2 5 :5 :5 :5 , im p ly ing tha t the re ex is t a more linear
re la t io nsh ip beftveen NPK 20:10:10 fe r t i l iz e r rates and FA
levels than the re is fo r NPKS 2 5 :5 :5 :5 and FA levels. Owuor
78et al s im ila r ly observed tha t r values between G roup I VFC
and rates o f n i t ro g e n fe r t i l iz e r app lica tions fo r NPK 20:10:10
were h ig h e r than r values fo r NPKS 2 5 :5 :5 :5 . Th is
obse rva tion can be a t t r ib u te d to the observed e ffec ts o f the
two fe r t i l iz e rs on the FA composition.
For the h igh rates o f n i t ro g e n app lica tion NPK 20:10:10
appeared to in f luence h ig h e r form ation o f FA than NPKS 2 5 :5 :5 :5 .
However, fo r lower rates the e ffec ts o f the two fe r t i l iz e rs on
FA was the s a m e . l t is th o u g h t th a t h ig h e r amounts o f
phosphorus in NPK 20:10:10 helps more fo rm ation o f FA in tea
leaves than NPKS 2 5 :5 :5 :5 . Owuor et^ a l^° observed th a t the
q u a l i ty param eter fo r Kenya's tea th a t is a f fec ted most by9
51
v a r ia t io ns in fe r t i l iz e r app lica t ion rates is f la v o u r . The
G roup I VFC s ig n i f ic a n t ly (P < 0.05) increased w ith
inc reas ing rates o f fe r t i l iz e r app lica tion while G roup II VFC
and f la v o u r index decreased. The s ig n if ic a n t increase in
G roup I VFC w ith inc reas ing n i t ro g e n levels can be
a t t r ib u te d to the s ig n if ic a n t increases in the level o f the FA
especia lly the p re c u rs o r p o lyu n sa tu ra te d FA w ith inc reas ing
rates o f fe r t i l iz e r app lica t ion .
The increase in FA levels and hence G roup I VFC,
the decrease in Group II VFC and the re s u lt in g decrease in
FI w ith inc reas ing rates o f n itrogenous fe r t i l iz e r app lica tion
p a r t ly exp la ins the genera l obse rva tion by tea g row e rs tha t
the q u a l i ty o f b lack tea de te r io ra tes w ith inc reas ing
n itrogenous fe r t i l i z e r app lica tion ra tes . Th is also serves to
emphasize the im portance o f o b se rv in g the recommended rate
o f fe r t i l iz e r app lica t ion in Kenya wh ich is 150 to 200
kg N /h a /y e a r e i th e r as compound fe r t i l iz e r NPKS 2 5 :5 :5 :5 or
NPK 20:1010. Th is ra te o f fe r t i l iz e r app lica tion optim izes
both q u a l i ty and q u a n t i ty fo r good economic re tu rn s . As can
be observed in Table 11, the impact o f n itrogenous fe r t i l iz e r
app lica t ion rates on the FA was more noticeable at rates
between 100 and 300 kg N /h a /y e a r . Th is b racke t inc ludes the
recommended ra tes .
The major biochemical e f fe c t o f n i t ro g e n levels in a
p lan t such as tea is in te r fe re n c e w ith p ro te in syn thes is and
hence g ro w th ra te o f the p la n t . When n i tro g e n levels in the
soil increase (b y fo r example fe r t i l iz e r app lica t ion ) the re occurs
increased pho tosyn th es is . Th is causes the tea p lan t to
have not on ly the re q u ire d amino acids b u t the re also
occurs an enhancement o f the m ach inery fo r syn thes is o f l ip ids
con ta in ing fa t ty ac ids . Thus the overa l l syn thes is o f FA
especia lly the u nsa tu ra ted FA increases w ith increased
n i tro g e n levels in the soil.
2.3 EFFECTS OF PLUCKING STANDARDS AND THE
D IS T R IB U T IO N OF F A TTY ACIDS IN TEA LEAVES
The d is t r ib u t io n o f the FA in the d i f fe re n t po r t ions
o f the tea shoots is p resen ted in Table 12 . The re were
s ig n if ic a n t changes in the FA in the d i f fe re n t p a r ts o f the
shoot. The stem had the lowest accumulation o f FA. Th is
implies tha t thie stem does not g re a t ly in f luence the con ten t
and composition o f the Group I VFC . The bud conta ined the
h ighes t amounts o f pa lm itic ac id . However, the re was no
major d i f fe re n c e in the pa lm itic acid con ten t o f the 1st leaf
to 4th leaf. Reasonable q u a n t i t ie s o f pa lm ito le ic acid were
detected in the 2nd to 4th leaf b u t the bud and 1st leaf had
on ly trace amounts o f the ac id . S tearic acid levels increased
from the bud to 3rd leaf while oleic acid and lino le ic acid
levels decreased as the leaf m a tu red . The lino len ic ac id ,
to ta l FA and tota l u nsa tu ra ted FA leve ls , how ever, increased
w ith increased m a tu r i ty o f the leaf. The increase in total
u nsa tu ra ted FA especia lly l ino len ic acid implies th a t the good
f la v o u r po ten tia l w il l decrease w ith leaf m a tu r i ty .
S im ilar obse rva tions re g a rd in g the d is t r ib u t io n o f FA
in tea shoots were made by Mahanta et a]_ , Se lvendran

53
Table 12: D is t r ib u t io n o f fa t ty acids (mg/IOOg d r y leaf) in
d i f fe re n t p a r ts o f the tea shoot.
F a tty Acid
C16:0 C l 6:1 C 18 : 0 C 18 :1 C1 8:2 C1 8:3 T . U . 3 Total
Bud 18.68 NDb 10.08 5.58 20.75 53.49 79.83 108.60
1st leaf 11.52 ND 11.51 5.53 18.74 62.64 86.91 109.93
2nd leaf 11.31 0.84 14.36 5.72 18.74 72.83 98.13 123.79
3rd leaf 10.23 0.81 14.64 4.32 15.90 81.76 103.28 128.15'
4th leaf 10.17 0.84 13.47 3.75 12.33 91.13 108.09 131.74
Stem 6.96 ND 1.27 1.33 10.16 25.29 30.78 45.02
C.V.% 25.81 - 1.70 13.67 14.46 16.79 18.45 10.96 7.86
a Total unsa tu ra ted FA
b Not detectab le
H
54 -
and Anan and Nakagawa . They obse rved th a t the FA con ten t
o f young tea leaves increased from 1st leaf, 2nd leaf, 3rd leaf
and 4th leaf. Thus the in i t ia l g ro w th o f tea leaves is
accompanied by increased FA leve ls .
The e ffec ts o f d i f fe re n t p lu c k in g s tanda rds on the FA
levels o f clones 31/8 and 6/8 are p resen ted in Table 13a and b. The
tables shows th a t the concen tra t ion o f l ino le ic and l ino len ic
acids increased w ith coarse p lu c k in g trea tm en ts . The increase
was more s ig n if ic a n t and p ronounced fo r l ino len ic ac id . Linole ic
and l ino len ic acid are o f major in te re s t in th is s tu d y since they
comprise more than 90a o f the u nsa tu ra ted FA wh ich undergo
enzymic and chemical ox ida t ions to p roduce the G roup I VFC.
The ove ra l l p a t te rn o f va r ia t io n o f the FA w ith p lu c k in g
s tanda rds fo r tTie two clones was d i f fe r e n t . Th is f u r t h e r
ind ica tes the im portance o f clonal d i f fe re n c e s .
The amount o f pa lm itic acid was observed to g ra d u a l ly
decline w ith coarse p lu c k in g s tanda rds fo r the two clones
while the re was not any t re n d in the level o f oleic ac id .
T he re was not any s ig n i f ic a n t change in the amount o f s tear ic
acid w ith p lu c k in g s tanda rds as is ev idenced by the low C. V. %
va lues.
79Owuor et^ a]_ dem onstra ted tha t the amount o f G roup I
VFC increased w ith coarse p lu c k in g s tanda rds while Group II
VFC and the FI decreased. Thus coarse p lu c k in g s p roduce tea
w ith lower f la v o u r q u a l i ty than f in e ly p lucked tea. The
increase o f G roup I VFC especia lly the C^ compounds w ith
coarse p lu c k in g s tandards can be a t t r ib u te d to s im ilar increase
51
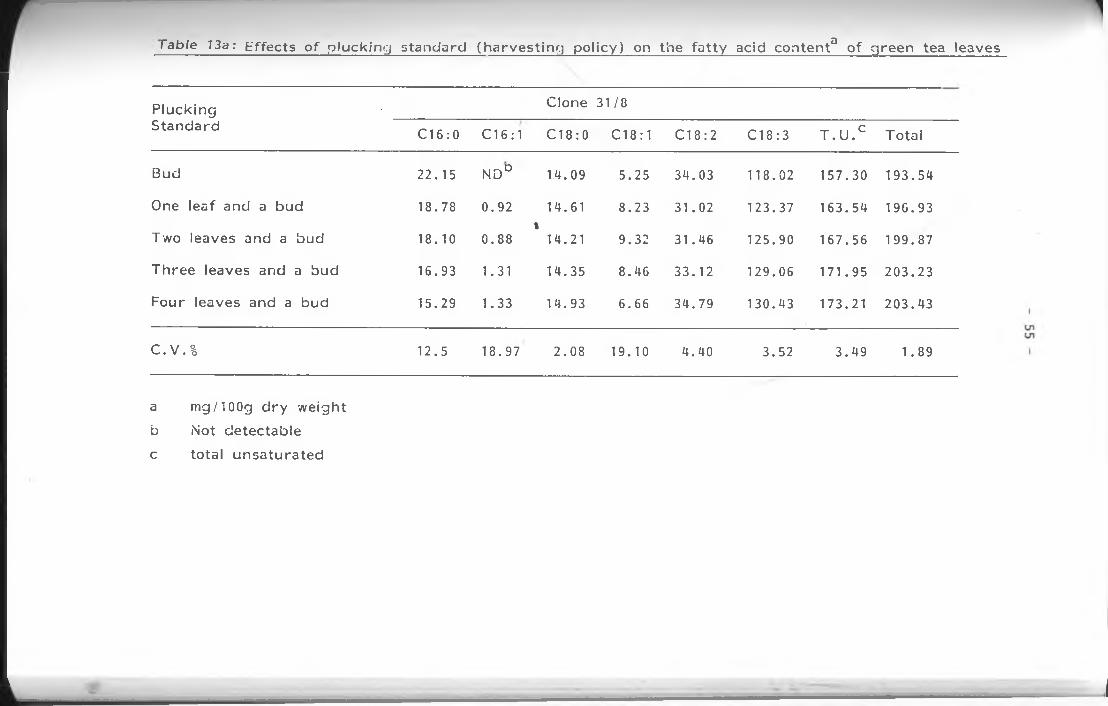
Table 7 3a: E f f e c t s o f p lu c k in g s ta n d a rd (h a r v e s t in g p o l ic y ) on th e f a t t y ac id c o n te n t0 o f g re e n tea leaves
P luck ingS tandard
Clone 31/8
C l 6:0 C 16 :1 C18:0 Cl 8:1 C l 8:2 C18:3 T . U . C Tota l
Bud 22.15 ND° 1.4.09 5.25 34.03 118.02 157.30 193.54
One leaf and a bud 18.78 0.92 14.61 8.23 31.02 123.37 163.54 196.93
Two leaves and a bud 18.10 0.88l
14.21 9.32 31.46 125.90 167.56 199.87
Th ree leaves and a bud 16.93 1.31 14.35 8.46 33.12 129.06 171.95 203.23
Four leaves and a bud 15.29 1.33 14.93 6.66 34.79 130.43 173.21 203.43
C .V .% 12.5 18.97 2.08 19.10 4.40 3.52 3.49 1.89
a mg/lOOg d r y w e igh t
b Not de tec tab le
c to ta l unsa tu ra te d
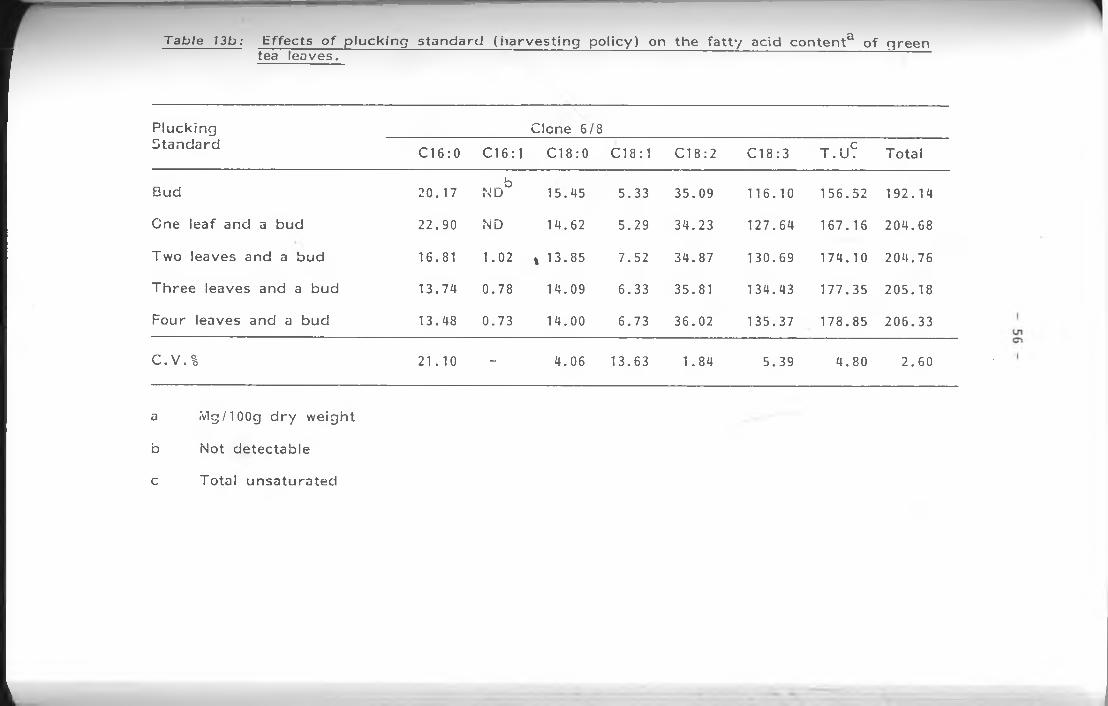
T a b l e 13b : E f f e c t s o f p lu c k in g s ta n d a rd ( h a r v e s t in g p o l ic y ) on th e f a t t y ac id c o n te n t3 o f g re e ntea leaves .
P luck ingS tandard
Clone 6/8
C l 6:0 C l 6:1 C l 8:0 Cl 8:1 C l 8:2 C 18 :3 T .U ? Tota l
Bud 20.17b
ND 15.45 5.33 35.09 116.10 156.52 192.14
One leaf and a bud 22.90 ND 14.62 5.29 34.23 127.64 167.15 204.68
Two leaves and a bud 16.81 1.02 1 13.85 7.52 34.87 130.69 174.10 204.76
Three leaves and a bud 13.74 0.78 14.09 6.33 35.81 134.43 177.35 205.18
Four leaves and a bud 13.48 0.73 14.00 6.73 36.02 135.37 178.85 206.33
C.V .% 21.10 _ 4.06 13.63 1.84 5.39 4.80 2.60
a fvlg/IOOg d r y w e igh t
b Not de tectab le
c Tota l un sa tu ra te d
57
in th e ir p re c u rs o r fa t ty acids in g reen tea leaves w ith coarse
p lu c k in g s tanda rds .
Th is data shows tha t the low q u a l i ty tea associated
w ith poor p lu c k in g s o f more than two leaves and a bud is
p a r t ly due to h igh levels in the con ten t o f the po lyu n sa tu ra te d
FA w h ich degrade to G roup I VFC, Thus the recommended
p lu c k in g po licy o f two leaves and a bud in Kenya shou ld be
observed i f q u a l i ty tea is to be p rodu ced . P luck ing two
leaves and a bud has also been p roved to g ive good economic
y ie ld r e tu rn s .
2.4 EFFECTS OF PRUNING ON THE F A TTY ACID
CONTENT OF TEA LEAVES
T a b le d showed tha t th e re were no apprec iab le changes
in the FA composition o f the clones w ith per iods from last
p ru n e . Lack o f a p a t te rn in the changes o f the FA con ten t
w ith per iod from last p ru n e was a t t r ib u te d to many
m icroecological and m icroclimatic changes o c c u r r in g due to the
geograph ica l areas o f p ro d u c t io n o r the v a ry in g c u l tu ra l
p rac t ices to wh ich the clones were sub jec ted .
F u r th e r s tu d y on the e f fe c t o f per iod from last p rune
on the FA composition o f clone 515/10 was done. The shoots
were p lucked from pa ren t p lan ts g row n on the same p lo t,
rece iv ing iden tica l agronomic p rac t ices , and g row ing und e r identica l
c limatic and env ironm enta l cond it ion s . The on ly d i f fe re n c e was
th a t the tea b locks from which the shoots were obta ined were
in d i f fe re n t per iods from last p ru n e .
58 -
Table 14 shows the e ffec ts o f per iods from last p ru n e
on the FA con ten t o f clone S15/10. Palmitic acid was observed
to s ig n i f ic a n t ly increase w ith decreas ing per iods since last
p ru n e . S tearic acid d id not change w ith time from p rev ious
p ru n in g . Oleic acid appeared to increase w ith increas ing
per iods since last p ru n e a lthough the increase was in s ig n i f ic a n t .
The tota l FA con ten t o f shoots p lucked from pa ren t p lants
th a t were re ce n t ly p ru n e d was h ig h e r than from p lan ts tha t
were p ru n e d e a r l ie r . The tota l u nsa tu ra ted FA were also
observed to be h ig h e r in the shoots ob ta ined from p lan ts tha t
had sh o r t per iods from p ru n in g than from p lan ts w ith longer
per iods since last p ru n in g . Thus inc reas ing time from the last
p ru n in g lowered the con ten ts o f the p o lyu n sa tu ra te d linole ic
and l ino len ic ac ids.
- I t has been shown tha t leaf m anufac tu red from teas
w ith longest time from p ru n in g were low in Group I VFC, b u t
G roup II VFC were not s ig n i f ic a n t ly a f fec ted by time from
p ru n in g # The observed increase o f G roup I VFC con ten t
o f b lack tea w ith decreas ing per iods from last p rune can be
exp la ined as due to the increase in the FA con ten t w ith
decreas ing per iods since p ru n in g . Teas made from leaves
p lucked from p lan ts closest to th e ir nex t p ru n in g the re fo re
are o f b e t te r f la v o u r q u a l i ty than those m anufactu red from
p lan ts which have ju s t been p ru n e d .
It is known tha t q u a l i ty o f tea is a ffec ted by g ro w th
ra te and improves as g ro w th ra te decrease81'**2 . G r ice90
91and Tubbs dem onstra ted tha t shoot g ro w th ra te o f tea is
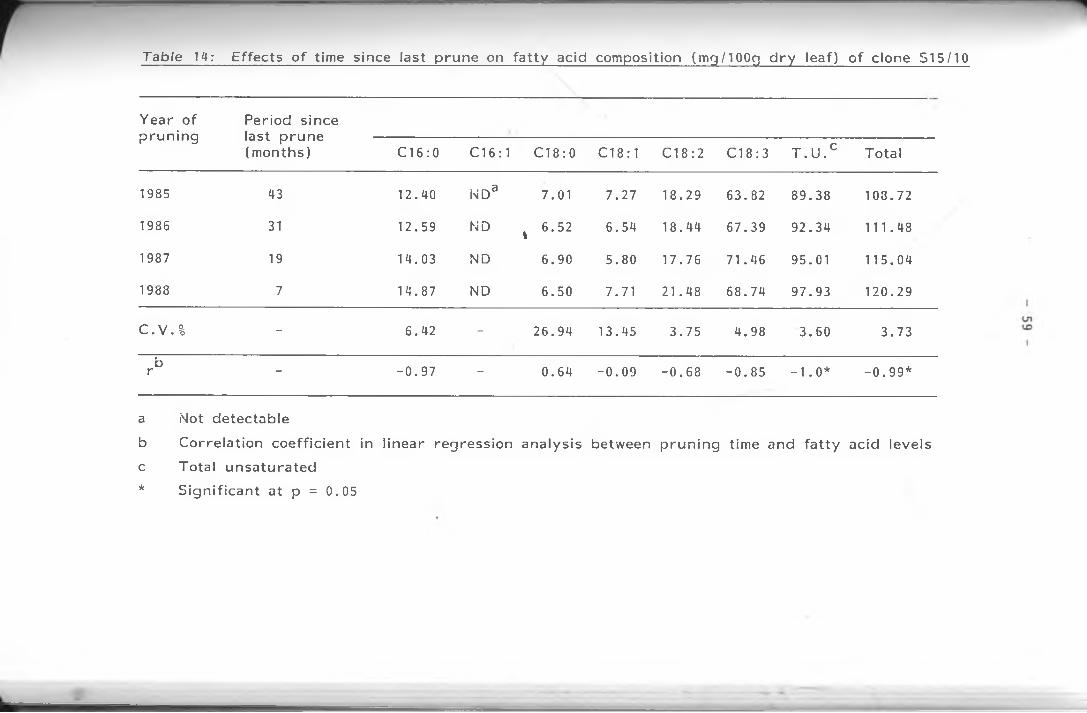
T a b l e 14: E f fe c ts o f t im e s ince las t p ru n e on f a t t y ac id com pos it ion (m g/IO Og d r y lea f) o f c lone S15/10
Year o f Period sincep ru n in g last p ru n e
(m onths) C l 6:0 C16:1 C l 8:0 C l 8:1 C l 8:2 C l 8:3 T . U . C Tota l
1985 43 12.40 NDa 7.01 7.27 18.29 63.82 89.38 103.72
1986 31 12.59 ND t 6.52 6.54 18.44 67.39 92.34 111.48
1987 19 14.03 ND 6.90 5.80 17.76 71.46 95.01 115.04
1988 7 14.87 ND 6.50 7.71 21.48 68.74 97.93 120.29
C .V .% - 6.42 - 26.94 13.45 3.75 4.98 3.60 3.73
br - -0 .9 7 - 0.64 -0 .09 -0 .6 8 -0 .8 5 - 1 . 0 * * -0 .9 9 *
a Not de tec tab le
b C o rre la t ion co e f f ic ie n t in l inea r regress ion ana lys is between p ru n in g time and fa t t y acid levels c Tota l u n sa tu ra te d
* S ig n i f ic a n t a t p = 0.05
60
slower when time from last p ru n in g is long. Thus the
obse rved v a r ia t io n o f FA con ten t w ith time from last p ru n in g
can be exp la ined on the basis o f g ro w th ra te . Teas w ith
sh o r t per iods from last p ru n in g have h igh g ro w th ra te , the
h igh g ro w th ra te re su lts in increased p ro te in and ch lo ro p h y l l
s yn th e s is . Th is is accompanied by increased syn thes is o f
membrane systems o f wh ich l ip ids form a b ig percentage
com position. Increased l ip id syn thes is is concomitant w ith
increased syn thes is o f the c o n s t i tu e n t fa t ty acids especia lly
the p o ly u n s a tu ra te d fa t ty ac ids.
It must be emphasised th a t p ru n in g o f tea must be
done to keep the bushes und e r manageable leve ls . Th is
s tu d y has on ly shown tha t teas w ith long periods since last
p ru n in g have low£V FA con ten ts and are thus b e t te r in terms
o f f la v o u r q u a l i ty .
61
CHAPTER THREE
EXPERIMENTAL SECTION
3.0 GENERAL REVIEW:
Chemical changes in tea leaves s ta r t as soon as the
tende r shoots are p lucked from the pa ren t p la n ts . Tea,
p a r t ic u la r ly conta ins l ip o ly t ic enzymes bound to the ce l lu la r
s t ru c tu re o f the leaves. Soon a f te r the leaves are p lucked
these l ip o ly t ic enzymes are released. These h ig h ly ac t ive
enzymes cause apprec iab le h y d ro ly s is o f acyl l ip ids to release
57fa t ty acids . The released fa t ty acids especia lly the
p o lyu n sa tu ra te d ones unde rgo chemical ox ida t ions and deg rada -
63tions as shown in Scheme 1
These enzym ic a l te ra t ions in l ip id s t ru c tu re re s u lt in
loss o f spec if ic components o r re s u lt in p ro d u c t io n o f a r te fa c ts .
Hence fo r tota l l ip id e x t ra c t io n and ana lys is the t issue must be
sub jected to some trea tm ents to deac tiva te these enzymes p r io r
to the in i t ia l stages o f l ip id e x t ra c t io n . Among the p rocedures
fo r deac tiva t ion wh ich have p roved s a t is fa c to ry w ith leaves a re ;
92-94d i re c t maceration o f the leaves in cold iso -p ropano l 95
95p lu n g in g the leaves in to bo i l ing water fo r v e ry b r ie f periods
o r bo i l ing the leaves in ethanol o r d i lu te acetic a c i d ^ .
Most o f the l ip ids o f leaf t issues occu r w ith in
membraneous s t ru c tu re s where they are associated w ith p ro te ins
o r c a rb o h yd ra te s by a combination o f h yd rog en bonds,
Van de r Waals and e le c tro s ta t ic forces as components o f
62
l ip o p ro te in o r l ip o ca rb o h yd ra te complexes. Thus the ideal
so lven t o r so lven t m ix tu re fo r e x t ra c t in g l ip ids from tissues
shou ld be s u f f ic ie n t ly po la r to remove all l ip ids from th e ir
association w ith cell membranes o r w ith l ip o p ro te in o r l ipo -
ca rb o h yd ra te s b u t shou ld not react chem ica lly w ith those l ip id s .
The so lven t should not be so po lar tha t no n -p o la r simple l ip ids
do not d isso lve and are le f t adh e r ing to the t issues.
The main fea tu res o f l ip ids which a f fe c t th e ir s o lu b i l i ty
in o rgan ic so lvents are the n o n -p o la r h y d ro ca rb o n chains o f
the fa t t y acid o r o th e r a l iph a t ic moieties and any func t iona l
97g roup s such as phosphates o r suga r res idues . L ip ids which
conta in no m arked ly po la r g roup s eg. cho les tero l es ters are
h ig h ly soluble in now -po la r so lvents o r s l ig h t ly more polar
so lvents such as ch lo ro fo rm o r d ie th y l e th e r . They are inso lub le
in po la r so lvents such as methanol. Polar l ip id s , on the o the r
hand d isso lve read i ly in more po lar so lvents such as methanol,
ethanol o r ch lo ro fo rm .
Hence q u a n t i ta t iv e e x tra c t io n o f l ip ids is achieved by
em ploy ing po lar so lvents such as e thano l, methanol o r acetone
wh ich not on ly b reak the l ip id -p ro te in o r l ip id -c a rb o h y d ra te
linkages , b u t also d isso lve all o f the po la r l ip ids availab le in
the t issue . These so lvents are used in combination w ith
n o n -p o la r ones such as ch lo ro fo rm , benzene, petro leum e th e r ,
o r d ie th y l e th e r .
The use o f e levated tem pera tu res (above 35°C) fo r
long periods can cause de tr im en ta l e f fec ts on some o f the l ip id
components, e .g . can accelerate the ox ida t ion o f the p o lyu n sa tu ra te d

63 -
f a t t y ac ids, while use o f tem pera tu res below 20°C lim its
s o lu b i l i ty o f many o f the l ip id s . Room tem pera tu re o r at
most 30°C is best fo r the most e f fe c t iv e l ip id e x t ra c t io n s .
Most po la r o rgan ic so lvents used to e x t ra c t l ip ids
from t issues also e x t ra c t s ig n if ic a n t amounts o f n o n - l ip id
contam inants such as suga rs , u rea , amino acids and sa lts .
Methods wh ich have been used to remove all po ten tia l contam i
nants o f l ip id e x t ra c ts a re ; adso rp t ion and cellu lose column
98chrom a tog raphy , e lec trod ia lys is and e le c tro p h o re s is , o r even
96p re -e x t ra c t io n o f t issues w ith 0.25% acetic acid
A gen e ra l ly s a t is fa c to ry method o f removing n o n - l ip id
99contam inants is the p rocedu re g iven by Folsh, Lees and S tanley
as modified by Ways and Hanahan100. T h is p rocedu re recovers
95-99% o f the l ip id s . I t was the method used in th is s tu d y and
is gen e ra l ly called the "F o lsh " wash.
Many simple and complex l ip ids are e i th e r too po lar or
o f too h igh a molecular w e igh t to be sub jected to some
ch rom atograph ic p ro ce d u re . So i t is necessary to c o n v e r t them
to d e r iv a t iv e s fo r f u r t h e r ana lys is . The fa t ty acid composition
o f l ip ids is de term ined by g a s - l iq u id ch rom atography (C L C ).
Th is is the techn ique th a t is chosen in most c ircum stances since
i t was in trodu ced in 1956 by James and M a r t i n ^ .
Before the fa t ty acid composition o f the l ip ids is ca r r ie d
out by GLC they are conve rted to the m ethyl es te rs . Convers ion
o f the fa t ty acids to th e ir methyl es te r d e r iv a t iv e s increases the
v o la t i l i ty o f the fa t ty acids (w h ich o the rw ise have too h igh
bo i l ing p o in ts ) , reduces the adso rp t ion o f the fa t ty acids on the
s u p p o r t and column su rface and im proves separa tion . The

64
v o la t i l i t y o f m ethyl es ters is s u f f ic ie n t ly h igh to perm it the
de te rm ina tion o f compounds ra ng ing from ^ iq - ^ 24 ^o r even102h ig h e r fa t ty ac ids) in the same sample
A method o f p re p a r in g fa t ty acid m ethyl esters (FAMES)
fo r GLC ana lys is should idea lly be simple, ra p id , q u a n t i ta t iv e
and should g ive r ise to no unw anted s t ru c tu ra l changes or side
reac t ions . The re are several methods fo r the p repa ra t io n o f
FAMES. The most w ide ly used are those wh ich employ
d iazom ethane1 104 and methanolic so lu tion o f boron t r i f lu o
r id e 105 107. Also f re q u e n t ly used are reactions w ith
1 08h y d ro c h lo r ic acid and methanol and s u lp h u r ic acid and methanol
3.1 M ATE R IALS :
For all the s tu d y cases excep t p lu c k in g s tanda rds ,
p lu c k in g o f p lan t materia ls from p a ren t p lan ts conformed to
the normal commercial p rac t ice i .e . 90% good leaf, mainly two
leaves and a bud w ith m inor amounts o f th re e leaves and a bu d .
M ateria ls fo r all s tu d y cases were ob ta ined as fo llows.
3 .1 .1 Clonal d i f fe re n ce s and geograph ica l area o f p ro d u c t io n . * 88
Clone 7/14 and 54/40 were sampled from the Kenya Tea
Development A u th o r i t y (K T D A ) clonal obse rva tiona l f ie ld t r ia ls
88set up in all the tea g ro w in g d is t r ic t s o f Kenya in 1981 .
Sampling was done between 9th and 21st November, 1987. The re
were 17 sampling sites East o f the R i f t Va lley and 9 sampling
s ites West o f the R i f t V a lley .
65
Clone 6/0 , S 15/10 and TN 14-3 were sampled from
Kericho tea estates w ith in a rad ius o f about 10 k ilom eters from
p lo ts at K a p ro re t, Cheptabes and Chepgoiben estates (at 1960,
1940 and 2120 meters above mean sea leve l, re sp e c t ive ly ) o f
the A f r ic a n H igh lands Produce Company, K e richo . The same
clones were also sampled from the Clonal Field T r ia ls (C FT) at
the T im b il i l estate o f the TRFK 2180 m above mean sea level.
Sampling was done on 15th December, 1988.
3 .1 .2 E ffects o f n i trogenous fe r t i l iz e rs .
Clone S15/10 was used. Th is is a h ig h -y ie ld in g clone
and y ie lds o f up to 8,000 kg o f b lack tea pe r hectare per year
have been reco rded . The recommended ra te , o f fe r t i l iz e r
app lica t ion in Kenya U 150 to 200 kg o f n i t ro g e n per hectare
pe r yea r . These rates may be inadequate fo r such a h igh
y ie ld in g clone. To c o r re c t fo r possib le inadequacy, h ig h e r rates
o f fe r t i l iz e rs on th is clone was used. The fe r t i l iz e r rates used
were 0, 100, 150, 300, 450 and 600 kg N /h a /y e a r . T h is was
p u t as NPKS 2 5 :5 :5 :5 and NPK 20:10:10 in a s ing le app lica t ion .
The experim enta l fe r t i l iz e r was app lied on 11th March
1989, and leaf samples were taken on 12th A p r i l , 1989 i .e . one
month a f te r the fe r t i l iz e r app lica t ion . The expe rim en t was laid
ou t on the same b lock of tea.
3 .1 .3 E ffects o f p lu c k in g s tanda rds .
The tea shoots used to determ ine the d is t r ib u t io n o f the
FA in the d i f fe re n t p a r ts o f young shoots were ob ta ined from
mother bushes o f clone 6/8 at the TR FK . The shoots were then

66 -
d iv id e d in to bud , 1st leaf, 2nd leaf, 3rd leaf, 4th leaf and
stem (between bud and 4th le a f) . The pa ren t bushes had
rece ived 200 kg N /h a /y e a r as NPK5 2 5 :5 :5 :5 fe r t i l iz e r .
Sampling was done in t r ip l ic a te . Clones 6/8 and 31/8 were
coarse ly p lucked from TRFK clonal f ie ld t r ia ls , set up in 1982
to de term ine e f fe c t o f p lu c k in g s tanda rds on FA levels o f tea
shoots. The p lucked shoots were d iv id e d in to bud , one leaf
and a bud , two leaves and a bud , th ree leaves and a bud and
fo u r leaves and a bud . The teas were rece iv ing 150 kg
N /h a /y e a r as NPKS 2 5 :5 :5 :5 . Sampling was done in t r ip l ic a te .
3 .1 .4 E ffects o f p ru n in g .
Shoots were p lucked from randomized b u t non -re p l ica te d/
f ie lds from b locks p ru n e d at d i f fe re n t times w ith in the App lied
Research Departm ent (Chepgoiben Estate) o f the A fr ic a n H igh lands
Produce Co. L td . , Ke richo , Kenya, at an a l t i tu d e o f 2120 m
above mean sea leve l. P luck ing was done in December 1988.
The teas had been p ru n e d 43, 31, 19 and 7 months p r io r to
sam pling. The h igh y ie ld in g clone S15/10 was used.
3.2 LEAF TREATMENT AND CHEMICAL AN ALY SIS :
As soon as the tea leaves were p lucked from the pa ren t
p lan ts , they were immediate ly steamed on a water bath fo r one 95m inute . The teas were cooled to room tem pera tu re and placed
in w e ll-ae ra ted bags. The samples were a ir d r ie d in an oven at
60°C fo r 6 h ou rs . The d r ie d samples were then g ro u n d to a
f ine powder us ing a coffee g r in d e r and s to red in a dee p - fre e ze r .
67 -
3.2.1 E x tra c t io n p roced u re .
To remove all po ten tia l l ip id contam inants p resen t in
the so lven ts , the so lvents were d is t i l le d tw ice before any
e x tra c t io n was s ta r te d .
Ten grams o f the powdered leaves was weighed out and
e x tra c te d w ith 200 mis o f ch lo ro fo rm and methanol m ix tu re (2:1
v / v ) fo r fo u r hou rs w ith continous s t i r r in g at room tem pera tu re .
The m ix tu re was then f i l te re d th ro u g h a s in te red glass funne l
w ith the aid o f sunc t ion pump. A f u r t h e r 200 mis o f
ch lo ro fo rm -m ethano l m ix tu re (2:1 v / v ) was added to the res idue
and e x tra c t io n done fo r a f u r t h e r 4 h ou rs . The two f i l t ra te s
wh ich rep resen ted the " to ta l l ip id s " were combined and the
volume de te rm ined . 0.015g o f heptadecanoic acid ( the in te rna l
s tanda rd ) was added and the con ten ts th o ro u g h ly s t i r r e d .
3 .2 .2 P u r i f ica t io n o f the l ip id e x t ra c ts .
100 mis o f 0.88 pe r cent potassium ch lo r ide so lu tion in
wa ter was added to the tota l l ip id e x t ra c ts and the m ix tu re
th o ro u g h ly shaken before being allowed to se tt le . The so lvents
p a r t i t io n e d in to a lower laye r and an upp e r la ye r . The lower
laye r conta ined the p u r i f ie d l ip ids and the u p p e r phase conta ined
the n o n - l ip id con tam inan ts . The p u r i f ie d l ip id layer was
f i l te re d before the so lven t was removed at 35°C on a ro ta ry
eva p o ra to r . The w e igh t o f the l ip id recovered was de te rm ined .
3 .2 .3 P repara tion o f fa t ty acid m ethyl es ters (FAMES).
Base-ca ta lysed t ra n s e s te r i f ic a t io n was used in con junc t ion
109w ith ac id -ca ta lysed es te r i f ic a t io n and t ra n s e s te r i f ic a t io n
1.0g o f the l ip id m ix tu re and 10 ml o f 0.5N methanolic
NaOH was placed in a 100 ml round bottomed f lask f i t te d w ith
a condenser. The m ix tu re was re f lu x e d fo r 10 m inutes u n t i l
the l ip ids d isso lved . 12 ml o f b o ro n tr i f lu o r id e -m e th a n o l complex
(abou t 14% w /w BF9) was added th ro u g h the top o f the condenser
and re f lu x in g done fo r a f u r t h e r two m inutes. The so lu tion was
cooled, 5 ml hexane added and the m ix tu re boiled once more fo r
two m inutes. A so lu tion o f sa tu ra ted sodium ch lo r ide was then
added, the o rgan ic laye r separated and d r ie d w ith a nh yd rous
sodium su lpha te . Under the cond it ions descr ibed no isomerization
o f double bonds in p o lyu n s a tu ra te d fa t ty acids occu rs .
3 .2 .4 A na lys is o f the FAMES by GLC.
Two s tanda rd types o f ch rom atograph ic s ta t io n a ry phases
were used fo r th is pu rpo se . Both were p o lyes te r phases, namely
po lye thy le ne g lyco l ad ipate (PECA) and d ie th y len e g lyco l
succ inate (DEGS). These po lyes te r column materia ls resolve
fa t ty acids esters acco rd ing to both chain leng th and degree o f
u n s a tu ra t io n . Two sta in less steel columns (2M by 3.2 mm Od)
were used. One column was supp lied a lready packed w ith 10%
(w /w ) PEGA on ac id -w ashed chrom oscrb w, A/VV mesh size
80/100. The second column was packed in the la b o ra to ry w ith
15% DEGS on ac id -w ashed chrom osorb w, A/VV mesh 80/100. The
two columns were f i r s t cond it ioned by pass ing n it ro g e n gas
th ro u g h them at 180°C fo r 5 h ou rs . The columns were then
f i t te d on a GOW-MAC gas ch rom atograph equ ipped w ith a flame
ion isa tion de tec to r ( F . I . D . ) , column tem pera tu re was isothermal

69 -
th ro u g h o u t the column leng th at 180 ± 1°C. In je c to r -d e te c to r
tem pera tu re was 220 ± 1°C, n i t roge n gas flow ra te was
40 m l/m in . A sample o f the FAiViES in hexane so lu tion was
in jec ted in to the GC us ing a m ic ro l i t re s y r in g e . There was no
need to con tro l the amount o f the so lu tion ac tua l ly in jected as
long as peaks o f re l ia b ly measurable size were ob ta ined .
3 .2 .5 Id e n t i f ic a t io n and q u a n t i f ic a t io n o f the FAMES.
Seven major peaks were observed on the GC ch a r t
pap e r. Thus the re were seven major fa t ty acids in the in jected
sample. P rov is iona l id e n t i f ic a t io n o f the fa t t y acids was done by
d i re c t comparison o f the re te n t ion times o f th e ir methyl esters
w ith those o f some known s tanda rd methyl es ters (Sigma Chemicals,
U . 5 . A . ) on the same two columns und e r iden tica l cond it ions .
The id e n t i ty o f the FAMES was con firm ed by c a r r y in g ou t th e ir
gas chrom atograph-m ass spec trom e try ana lyses.
For gas chrom atographs equ ipped w ith a flame ion isa tion
de tec to r the areas und e r the peaks on the GC c h a r t traces are
l in e a r ly p ro p o r t io n a l to the amount o f materia l e lu t in g from the
co lum ns101. For the purpose o f q u a n t i ta t iv e fa t ty acid
composition ana lys is i t was assumed th a t all the sample toge the r
w ith the in te rn a l s tanda rd were in jec ted and tha t the area
response recorded fo r the in te rn a l s tanda rd rep resen ted its
w e igh t. The we igh ts o f the o th e r peaks were then d i re c t ly
ca lcu la ted from the w e igh t o f the in te rn a l s ta n d a rd . The peak
areas o f the component FAMES were measured manually by
m u lt ip ly in g the he ig h t o f the peak by the w id th at h a lf he igh t 102

70 -
The peak area o f the sample components were then
co rre c ted by a m u lt ip ly in g fac to r and d iv id e d by the peak
area o f the in te rn a l s tanda rd to g ive the concen tra t ion o f the
p a r t ic u la r component. Th is can be expressed in the form o f
an equation as fo l low s* 1^ 5,
Peak area o f component x m u lt ip ly in g fa c to r x w e igh t o f in te rn a l s tandardpeak area o f in te rn a l s tanda rd Weight o f the component
The m u lt ip ly in g fa c to r was obta ined by p e r fo rm in g CC o f a
s tanda rd so lu tion o f re p re se n ta t ive fa t ty acids p repa red on an
equal w e igh t basis. The m u lt ip ly in g fac to rs o r response ra tios
in terms o f the in te rn a l s tanda rd was then ca lcu la ted by
d iv id in g the peak a w a o f the in te rna l s tanda rd by the peak area
1 08o f each component . Weight o f the in te rn a l s tanda rd is the
amount (0 .0 15g) o f in te rn a l s tanda rd added to the l ip id e x t ra c ts .
71
REFERENCES
1. Tea Times ( T . B . K . , P ub lishe rs ) No.1 p p .1 -3 , June 1987.
2. In te rna t iona l Tea Committee. Annual B u lle t in o f
S ta t is t ic s , p p . 52-99, 1988.
3. Kenya Tea. The Coming o f Age ( T . B . K . , P u b l is h e rs ) , 1988.
4. Tea Times. ( T . B . K . , P ub lishe rs ) No. 7 p p .4 -5 , December
1988.
Tea Times. ( T . B . K . , P ub lishe rs ) N o .5 p p .1 -2 June 1988.
Tea Times. ( T . B . K . , P ub lishers ) N o .9 p p .1 -2 June 1989.
O wuor, P . O . , ; Reeves ,S .G . and Wanyoko, J .K .
C o rre la t ion o f Thea flav ins con ten t and va lua tions o f
Kenya b lack tea. J. Sci. Food A q r ic . 37, 507-513 (1986).
8. O wuor, P .O . and Reeves, S .G . O ptim is ing fe rm enta t ion
time in b lack tea m anu fac tu re . Food C hem is try 21,
195-203 (1986).
9. O wuor, P .O . ; H o r i ta , H . ; T sush ida , T . and M ura i, T .
Comparison o f the chemical composition o f b lack teas
from main b lack tea p ro d u c in g p a r ts o f the w o r ld .
Tea 7, 71-78 (1986).
72
10. Yamanishi, T . Tea, Coffee, Cocoa and o the r beverages.
In " F lavour research . Recent advances" . (Tesan ish i, R . ;
F la th , A . R . ; Sugisawa, H. Eds. Marcel D ekker In c . ,
New Y o rk and Basel Volume 8 pp . 266-278, 1981.
11. Biswas, A .K . and Biswas, A .K . 3 io log ica l and chemical
fac to rs a f fe c t in g the va lua tions o f N o rth India p la in teas.
I. S ta t is t ica l association o f l iq u o rs cha ra c te r is t ic s w ith
cash va lua tions o f b lack tea. S c i. Food A g r ic . 22,
191-195 (1971).
12. Biswas, A . K . , B iswas, A .K . and S a rka r , A .R . Biological
and chemical fac to rs a f fe c t in g the va lua tions o f N o rth East
India p la in teas. I I . S ta t is t ica l eva lua tion o f the biochemical
^ co n s t i tu e n ts and th e ir e f fec ts on b r is k n e s s , q u a l i ty and
cash va lua tions o f b lack tea. J. Sci. Food A g r ic . 22,
196-200 (1971).
13. Biswas, A . K . , S a rka r , A .R . and Biswas, A .K . Biological
arid chemical fac to rs a f fe c t in g the va lua tions o f N o rth East
Ind ia p la in teas. I I I . S ta t is t ica l eva luation o f the
biochemical co n s t i tu e n ts and th e ir e f fec ts on co lou r,
b r ig h tn e s s and s t re n g th o f b lack tea. J. Sci. Food A g r ic .
24, 1457-1477 (1973).
14. Deb, 5 .B . and U llah, iVi.Fi. The role o f Thea flav ins (TF)
and T h e a ru b ig in s (TR ) in eva lua tion o f b lack teas Two
and a Bud 15, 101-102 ( 1968).

73 -
15. R oberts , E .A .H . The chem is try o f tea m anufac tu re .
J. Sci. Food A g r ic . 9, 381-390 (1958).
16. R oberts , E .A .H . The estimation o f Thea flav ins in
made tea. Two and a Bud . 5, 1 1-12 (1958).
17. C lough ley , J . 8 . and E llis , R .T . The e f fe c t o f pH
m odif ica tion on q u a l i ty param eters o f C entra l A fr ic a n
b lack tea. J. Sci. Food A g r ic . 31, 924-934 (1980).
18. C lough ley , J .B . Storage d e te r io ra t io n o f Cen tra l A fr ic a
teas: changes in chemical composition, sensory cha rac te
r is t ic s and p r ice eva lua t ion . J. Sci. Food A g r ic . 32,
1213-1223 (1-881).
19. C lough ley , j . B . E ffec t o f h a rv e s t in g po licy and n itroge n
app lica t ion rates on the p ro d u c t io n o f tea in Centra l
A f r ic a . I I . Q ua li ty and to ta l value o f the c rop
Exp. A g r ic . 19, 47-54 (1983).
20. C lough ley , J .B . The e ffec t o f fe rm enta t ion tem pera tu res
on the q u a l i ty param eters and p r ice eva lua tion o f C entra l
A fr ic a n b lack teas. J. Sci. Food A g r ic . 31, 911-919
(1980).
21. H i lton , P .J . B lend ing o f b lack tea. Tea Res. Foundation
o f C en tra l A f r ic a , Q. R eport. 56, 8-9 (1979).

Takeo, T . Photometric eva lua tion and s ta t is t ica l
ana lys is o f tea in fu s io n . Jpn . A g r ic . Res. Q. 8,
159-164 (1974).
R oberts , G .R . and Fernando, R .S .S . Some obse rva tions
on the co rre la t io n o f po lypheno l con ten t to the q u a l i ty o f
tea clones Tea Q . 50, 30-31 (1981).
W ickremasinghe, R . l . S tudies on the q u a l i ty and f la v o u r
o f tea. I. The po lypheno l and lo w -bo i l in g vo la ti le
compounds. Tea Q. 36, 59-63 (1965).
R oberts , E .A .H . and Smith, R .F . The phenolic substances
o f m anufac tu red tea. IX . The spec tropho tom etr ic
eva lua tion o f tea l iq u o rs . J. Sci. Food A g r ic . 14
689-700 (1965).
Owuor, P .O . T hea flav ins con ten t as a basis o f p r ic in g
Kenyan b lack tea. Tea 4, 1 1-16 (1983).
Owuor, P .O . Prices o f Kenyan b lack teas and tas te rs
eva lua t ion . Tea 4, 16-20 ( 1983).
Davies, A .G . T hea flav ins - ob jec t ive in d ica to rs o f
q u a l i ty . Tea and coffee t rad e Journa l 155, 34-35
75
29. Dougan, J . ; Glossop, E . J . ; Howard, G .E . and Jones, B .D .
S tudy o f the changes o c c u r r in g in b lack tea d u r in g
s to rage . Report Number G116. pp 56-62. T rop ica l
P roducts In s t i tu te 1978.
30. O wuor, P .O . ; T sush ida , T . ; H o rita , H. and M ura i, T .
Va ria tions in the chemical composition o f some Kenyan
clonal teas. Kenya J. Sci- Techno l. Series A 8,
27-32 (1987).
31. H ilton , P .J . and E llis , R .T . Estimation o f the m arket
value o f C entra l A fr ic a n tea by T l ie a f la v in ana lys is .
J. Sci. Food A g r ic . 22, 227-232 (1972).
32. Bhatia , I .S . Chemical aspects o f g reen leaf p rocess ing .
Two and a b u d . 1_0, 28-33 ( 1963).
33. iVlullin, D . J . ; C r isp en , D .J . and Swaine, D. N on-vo la t i le
components o f b lack tea and th e ir c o n t r ib u t io n to the
cha ra c te r o f the beverage. J. A g r ic . Food Chem. 17,
717-723 (1969).
34. Owuor, P .O . and C havan ji, A..VI. Caffe ine contents o f
clonal teas; seasonal v a r ia t io ns and e ffec ts o f p lu c k in g
s tanda rds u n d e r Kenyan cond it ion s . Food Chem is try
20, 225-233 (1986).
76 -
35. Wood, D .J . and R oberts , VV.A.H. The chemical basis
o f q u a l i ty in tea. I I I . C o rre la t ions o f ana lys is resu lts
w ith tea tas te rs re p o r ts and va lua t ions . J. Sci. Food
A g r ic . 1J5, 19-25 ( 1964).
i i36. H i l ton , P .J . Tea in Encyclopaedia o f In d u s t r ia l Chemical
A n a ly s is " (S u e l, F .D . and E t t re , 1.5 . E d s . ) . John Wiley,
New Y o rk , Volume 18 pp . 455-516, (1974).
37. Kenya Bureau o f S tandards . Black tea s tanda rd .
(1978).
38. In te rna t iona l S tandard O rg a n is a t io n . 3 lack tea s tanda rd .
Number 3120 ( 1977).
39. O th ieno, C .G . and O wuor, P .O . B lack tea q u a l i ty and
In te rna t iona l s ta n d a rd s . In te rn a t io n a l Tea J. 7, 27-30
(1984).
40. Yam in ish i, T . ; Kob iyash i, A . ; Nakamura, H . ; Uchida, A.
i'vlori, S . ; Ohsawa, K. and Sasakura, S. F lavour o f b lack
tea. V Comparison o f va r iou s b lack teas. A g r ic . B io l.
Chem. 32, 379-386 (1968).
41. H o ri ta , M. and O wuor, P .O . Comparison and
cha rac te r iza t io n o f vo la t i le f la v o u r compounds o f Kenyan
clonal b lack teas and va r ious b lack teas from o the r
p ro d u c in g areas o f the w o r ld . B u lle t in o f the National
77
Research In s t i tu te o f Vegetables, Ornamental Plants
and Tea 1 ( B ) , 55-G5 (1987).
42. Yamanishi, T . ; W ickremasinghe, R .L . and Perera, K .P .W .C .
Stud ies on f la v o u r and q u a l i ty o f tea. 3. Gas
ch rom atograph ic ana lys is o f aroma complex. Tea Q u a r te r ly
39, 81-8G (1978).
43. G ian tu rco , iV i.A . ; B igge rs , R .E . and R id d l in g , B .H .
Seasonal c o n s t i tu e n ts o f b lack tea. A numerical approach
to the co rre la t io n between composition and q u a l i ty o f
the aroma. J. A g r ic . Food Chern. 72, 758-764 (1974).
44. W ickremasinghe, R . L . ; Wick, E .L . and Yamanishi, T .
Gas chrom atograph ic-m ass spec trom e tr ic ana lys is o f
f la v o u ry and n o n - f la v o u ry Ceylon b lack tea aroma
concen tra tes p repa red by d i f fe re n t methods. J. Chroma
to g ra p h y 79, 75-80 (1973).
45. iViotoda, S. Formation o f a ldehydes from amino acids by
po lypheno l ox idase. J. fe rm enta t ion techno l. 57,
395-399 (1978).
46. Fernando, U. and R oberts , G .R . The e ffec t o f process
param eters on seasonal development o f f la v o u r in b lack
tea. J. Sci. Food A g r ic . 30, 71-76 (1984).
78
47. Howard, G .E . The vo la t i le c o n s t i tu e n ts o f tea.
Food Chem. 4, 97-106 (1979).
48. A isaka, H . ; Kosuge, M. and Yamanishi, T . Comparison
o f the f la v o u r o f Chinese "Keemum" b lack tea and
Ceylon b lack tea. A q r ic . B io l . Chem. 42, 2157-2159
(1978).
49. Yamanishi, T . Aroma o f va r ious teas. Proceedings o f
a conference sponsored by the A g r ic u l tu ra l and Food
C hem is try D iv is ion o f the American Chemical Society.
A thens , Greece, June 27-29, 1978.
/
50. O wuor, P .O . ; Xsush ida , T . ; H o r i ta , H. and M ura i, T .
E ffec ts o f geograph ica l area o f p ro d u c t io n on the
composition o f the vo la t i le f la v o u r compounds in Kenyan
clonal b lack CTC teas. Exp l. A q r ic . 24, 227-235 ( 1988).
51. Anan, T . and Nakagawa, ;Vi. S tudies on the l ip ids o f
tea leaves. N ippon S hkuh in Kogyo G akkaish i 24,
305-310 (1977).
52. Anan, T . The l ip ids o f tea. Japan A g r ic u l tu ra l Pvesearch
Q u a r te r ly J[6(4), 60-65 ( 1983).
53. B huyan , L. and Mahanta, P. S tud ies on fa t t y acid
composition in tea, Camellia s inens is . J. Sci. Food A q r ic .
46, 325-330 (1989).

79 -
54. W righ t, A .J . and F ishw ick , M .J . L ip id deg rada tion
d u r in g m anufactu re o f b lack tea. Phy tochem is try
W , 1511-1513 (1979).
55. Sanderson, C.W. S t ru c tu ra l and func t iona l aspects o f
p h y to ch e m is try In " Recent Advances in P h y toch em is try "
(Runeck les , U .C . and Tso, T .C . Eds .) Vo l. 5 pp . 245-
246. Academic Press, New Y o rk , (1972).
56. Saijyo, R. and Takeo, T . The p ro d u c t io n o f
pheny lace ta ldehyde from L-pheny iam ine in tea fe rm en ta t ion .
A q r ic . B io l. Chem. 34, 222-226 (1970).
57. G a ll ia rd , T . Degradation o f p lan t l ip id s . In " Recent
Advances in the C hem is try and B iochem is try o f Plant
" L ip id s " (G a l l ia rd , T . and M erce r, E .L . Eds.) pp . 319-320.
Academic Press, London (1975).
58. Se lvendran , R .R . ; Reynolds, J. and G a ll ia rd , T .
P roduction o f vo la ti les by deg rada t ion o f l ip ids d u r in g
m anufactu re o f b lack tea. P hy tochem is try 17, 233-236
(1978).
59. Hatanaka, A . ; Ka jiwara. T . and Sekiya, J. Seasonal
va r ia t io ns in T ra n s -2 -h e xe n a l and l ino len ic acid in
homogenates o f Thea s inensis leaves. Phy tochem is try
15, 1889-1891 (1976).

80
60. Hatanaka, A . and Harada, T . Formation o f c is -3 -h e xe n a l,
t ra n s -2 -h e x e n a l and c is -3 -hexe no l in macerated Thea
s inensis leaves. P hy tochem is try 12, 2341-2346 (1973).
61. Saijyo, R .and Takeo, T . The im portance o f l ino len ic acid
and lino le ic acid as p re c u rs o rs o f t ra n s -2 -h e x e n a l and
hexanal in b lack tea. Plant and Cell p h y s io l . 13, 991-998
(1972).
62. Hatanaka, A . and Harada, T . P u r i f ica t io n and p ro p e r t ie s
o f alcohol dehydrogenase from tea seeds. A q r ic . B iol.
Chem. 36, 2033-2037 (1972).
63. Hatanaka, A . ; ^K a jiw ara , T . and Sekiya, J. Enzymic
oxyge na t ive -c le avage reaction o f l ino le ic and lino len ic
acids in leaves - ch lo ro p la s t ic l ipoxygenase and fa t ty
acid h y d ro p e ro x id e lyase in tea leaves. *n " The metabolism,
s t ru c tu re , and fu n c t io n o f p la n t l i p id s " ( Pau l. K .S . ;
B r ia n , D av id , VV.N. E d s . ) . Plenum Pub lish ing
C o rpo ra t ion pp . 50-54 (1987).
64. Hatanaka, A . ; Ka jiwara , T . ; Sek iya , J. and Fu jim ura , K.
P a rt ic ipa t ion o f 13 -h yd ro p e ro x id e in the fo rm ation o f
n -hexana l from lino le ic acid in tea ch lo ro p la s ts . A q r ic .
B io l. Chem. 43, 175-176 (1979).
Saijyo, R. Mechanism o f deve lop ing b lack tea aroma
w ith special re fe rence to alcoholic com pounds. Japan
A g r ic . Res. Q. U_, 216-220 (1977).
Ka jiwara, T . ; Sek iya , J . ; Asano, M. and Hatanaka, A
E n an t iose lec t iv i ty o f enzymic cleavage reaction o f
13 -h y d ro p e ro x y l in o le n ic acid to C-6 a ldehyde and C^
oxo acid in tea ch lo ro p la s ts . A g r ic . B io l. Chem. 46,
3087-3088 (1982).
Major, R . T . ; March in i , P. and Bou lton , A .J . O bserva tions
on the p ro d u c t io n o f a -hexena l by leaves o f ce r ta in
p la n ts . J. B io l. Chem. 238, 1813-1816 (1963).
Major, R .T . The G inkgo , the most anc ien t l iv in g t ree .
Science 157, 1270-1273 (1967).
T re s s l, R. Enzymatische B i ld u n g von U exen-2-a l Und
H e x e n - l -a l bei de r A u fa rb e i tu n g von A p te ln , N a tu r fo rs h g
206, 497-498 (1967).
Hoffman, G. Vegetable o i ls . Proceedings o f a Symposium
on Foods: L ip ids and th e ir ox id a t io n . (H .W . S chu ltz , E d .)
p p . 215-229. The A v i P ub lish ing Company, In c . , West
Port C onnec t icu t ( 1962).
C lough ley , T . B . Factors in f lu e n c in g ca ffe ine contents
o f b lack tea. Part 2. The e f fe c ts o f f ie ld va r iab les .
Food C hem is try 9, 269-276 ( 1982).
82
72. Takeo, T . and Mahanta, P .K . Comparison o f b lack
tea aromas o f O r th o d ix and CTC tea and o f b lack teas
from d i f fe re n t va r ie t ie s . J. Sci. Food A q r ic . 34,
307-310 (1983).
73. H i l ton , P .J . and Palmer-Jones, R.VV. Chemical assessment
o f the q u a l i ty o f tea and its re la t ion to m arket va lue over
an ex tended p e r io d . J. Sci. Food A q r ic . 26, 1681-1687
(1975).
C lough ley , J . B . ; E ll is , R . T . ; P end ling to r i, 5 . and
H um phrey , P. Vo la ti le c o n s t i tu e n ts o f some Centra l
A fr ic a n b lack tea clones. J. A q r ic . Food Chem. 30,
842-843 (1982^.
O wuor, P .O . ; Obanda, A .M . ; T sush ida , T . ; H orita , H. and
IViurai, T . Geographical v a r ia t io n s o f thea f lav ins ,
th e a ru b ig in s and ca ffe ine in Kenya clonal b lack teas.
Food C h em is try , 26, 223-230 ( 1987).
Bajaj, K . L . ; Dev C h o u d h u ry , ,V,. N . and S ukh ija , P .S . E ffects
o f phosphorus on fa t ty acids o f tea leaves and on the
q u a l i ty o f teas. J. Food Sci. Techno l. 21 , 392-394
(1984).
77. O wuor, P .O. N itrogenous fe r t i l iz e r ra tes and p lu c k in g
s tanda rds e ffec ts on chemical composition and q u a l i ty o f
CTC black tea. Proceedings o f In te rna t iona l Tea Symposium.
74,
75
76
Rize, T u rk e y , pp . 1 11-123, 26-28th June, 1987. .
83
78. O wuor, P .O . ; O th ieno, C .O . ; T sush ida , T . ; H o rita , H. and
.Viurai, T . E ffects o f n i trogenous fe r t i l iz e rs on the
chemical composition o f CTC black tea. A g r ic . B io l. Chem.
51_, 2665-2670 (1987).
79. O wuor, P .O . ; Obanda, M .A . ; O th ieno, C .O . ; T sush ida ,
T . ; H o ri ta , H. and M ura i, T . Changes in chemical
composition and q u a l i ty o f b lack tea due to p lu c k in g
s tanda rds . A g r ic . B io l. Chem. 51 , 3383-3384 (1987).
80. Owuor, P .O . and Langat, J . K . A . Changes in chemical
composition o f b lack tea due to p ru n in g . T rop ica l science
28, 127-132 (1988).
81. iviwakha, E. Tea shoot g ro w th in the Kenya H igh lands .
Tea 6 (1 ) , 5-13 (1985a).
82. iViwakha, E. Tea shoot g ro w th at d i f fe re n t a l t i tud es in
western Kenya. Tea 6 ( 2 ) , 71-78 (1985b).
83. S qu ire , G .R . Stomatal behav iou r o f tea ( Camellia
s inensis) in re la t ion to e nv iro nm en t. J. App lied Ecology
15, 287-310 (1978).
84. C a r r , iV i.K .V . Response o f seedling tea bushes and th e ir
clones to water s tress . Exp l. A g r ic . 13, 317-324 (1977).
84
85. Portsm outh , G.L3. and Rajiah, E .5 . Factors a f fe c t in g
shoot p ro d u c t io n in tea ( Camellia s in ens is ) when grow n
as a p lan ta t ion c rop I I I . The time fac to r and new shoot
p ro d u c t io n . Tea Q u a r te r ly 28, 21-29 ( 1957).
86. O wuor, P .O . ; O th ieno, C .O . ; Howard, G .E . ; Robinson,
J.iVi. and Cooke, R .D . S tudies on the use o f shade in
tea p lan ta t ion in Kenya: E ffects on chemical composition
and q u a l i ty o f CTC b lack tea. J. Sci. Food A g r ic . 46,
63-70 (1989).
87. O wuor, P .O . ; Obaga, 5 . 0 . and O th ieno, C .O . The
e ffec ts o f a l t i tu d e on the chemical composition o f b lack
tea; J. Sci. Food A g r ic . 50, 9-17 ( 1990).
88. N juguna, C .K . Kenya Tea Development A u th o r i ty
obse rva tiona l clonal t r ia ls . Tea 4 (2 ) , 8-9 ( 1989).
89. Takeo, T . F lavour vo la ti les and l ip ids in va r ious
components o f tea shoots ( Camellia s inensis ( L . ) O.
K u n tz e ) . J. Sci. Food A g r ic . 36, 1 130-1 132 (1985).
90. G rice , J.W. Shoot g ro w th on Ind ian H y b r id Seedling
tea in all stages o f a th re e -y e a r -c y c le . Tea Research
Foundation o f Cen tra l A f r ic a . Q u a r te r ly Newsle tte r 80,
4-9 (1985).
85
91. T u b b s , F .R . The leng th o f p ru n in g cyc le . Tea
q u a r te r ly 10, 21-36 (1937).
92. N ichols, B.W. Enzyme a c t iv i t y d u r in g l ip id
e x t ra c t io n s . Biochim. B iophys . Ac ta . 70, 417-422
(1963). •
93. N icho ls , B.vV. The b iosyn thes is o f unsa tu ra ted fa t ty
acids in h ig h e r p lan ts . In " New biochemical separa
t ions " . (James, A . T . and M o rr is , L .J . Eds .) pp .321 -
337. Van N ostrand , London (1964).
94. S a s try , P .S . and Kates, M. Isolation o f animal l ip id s .
Can. J . biochem. 44, 459-467 (1966).
95. H averka te , F. and Van Deenen, L .L .M . Methods o f
l ip id e x t ra c t io n . Biochim. B iophys . Acta . 106, 78-92
(1965).
96. P h il ips , F .C . and P r iv e t t , 0 . 5 . Role o f l ip ids in
p lan t metabolism. L ip ids 14, 949-950 (1979).
97. Zah ler, P. and N igg l i , V . P lant l ip id b iochem is try .
In " Method in membrane b io lo gy " (K o rn , E .D . E d .)
Plunum Press, New Y o rk . Vo l. 8 pp . 1-50 ( 1964).
86
98. W uth ie r , R .E . P u r i f ica t io n o f l ip ids from n o n - l ip id
contam inants on sephadex head columns. J. u p id
Res. 7, 558-561 (1966).
99. Folsh, J . ; Lees, M . ; and S tan ley , G .U .5 . A simple
method fo r the iso lation and p u r i f ic a t io n o f tota l l ip ids
from animal t issue . J. B io l. Chem. 226, 497-509
(1957).
100. Ways, P. and Hanahan, D .J . C h arac te r iza t ion and
q u a n t i f ic a t io n o f red cell l ip ids in normal man.
j . l ip id Res. 5, 318-338 (1964).
101. James, A . T . and M a r t in , A .J .P . G as - l iqu id chrom a-
to g ra p h y . The separa tion and id e n t i f ic a t io n o f the
m ethyl es te rs o f sa tu ra ted and u nsa tu ra ted acids from
fo rm ic acid to n-octadecanoic ac id . Biochem. J.
63, 144-152 (1956).
102. V o rbe ck , M . L . ; M a tt ic k , L . R . ; Lee, F .A . and
Pederson, C .5 . P repara tion o f fa t ty acid methyl
es te rs fo r g a s - l iq u id ch rom a to g ra p h y . Ana l. Chem.
33, 1512-1515 (1961).
103. Q u inn , L .D . and Hobbs, M .E . A na lys is o f the
n o n -vo la t i le acids in c ig a re t te smoke by gas chrom a
to g ra p h y o f th e ir methyl es te rs . Ana l. Chem. 30,
1400-1404 (1958).

Sch lank, H. and Gellesman, J . L . E s te r if ica t io n o f
fa t ty acid w ith diazomethane on a small scale.
Ana l. Chem. 32, 1412-1415 (1960).
.'Metcalfe, L .D . and Schmitz, A . The rap id p repa ra t io n
o f fa t ty acid m ethyl es ters fo r gas ch rom atograph ic
ana lys is . Ana l. Chem. 33, 363-364 (1961).
M o rr iso n , VV.R. and Smith, C.iVi. P repara tion o f fa t ty
acid m ethy l es ters and d im ethy lace ta ls from l ip ids w ith
boron f lu o r id e -m e th a n o l. J. L io id Res. 5, 600-600
(1964).
Metcalfe, L . D . ; Schmitz, A .A . and Pelka, J .R . Rapid
p re p a ra t io n o f fa t ty acid es te rs from lip ids fo r gas
ch rom a tog raph ic ana lys is . Ana l. Chem. 38, 514-516
(1966).
S to ffee l, VV.; Chu, F. and A h re n s , E.M. A na lys is
o f lo ng -cha in fa t ty acids by g a s - l iq u id ch rom a to g raphy .
Ana l. Chem. 31 ,̂ 307-310 (1959).
V lunavu, R .M . C ro ton megalocarpus . Hutch Seed
Kernel o i l . A po te n t ia l ly r ic h source o f O c tadeca -9 ,-
12-dienoic ac id . Kenya J. Sci. Techno l. 4, 77-81

A P P E N D I X
Mass spectra o f the fa^ ty acids o f tea leaves.
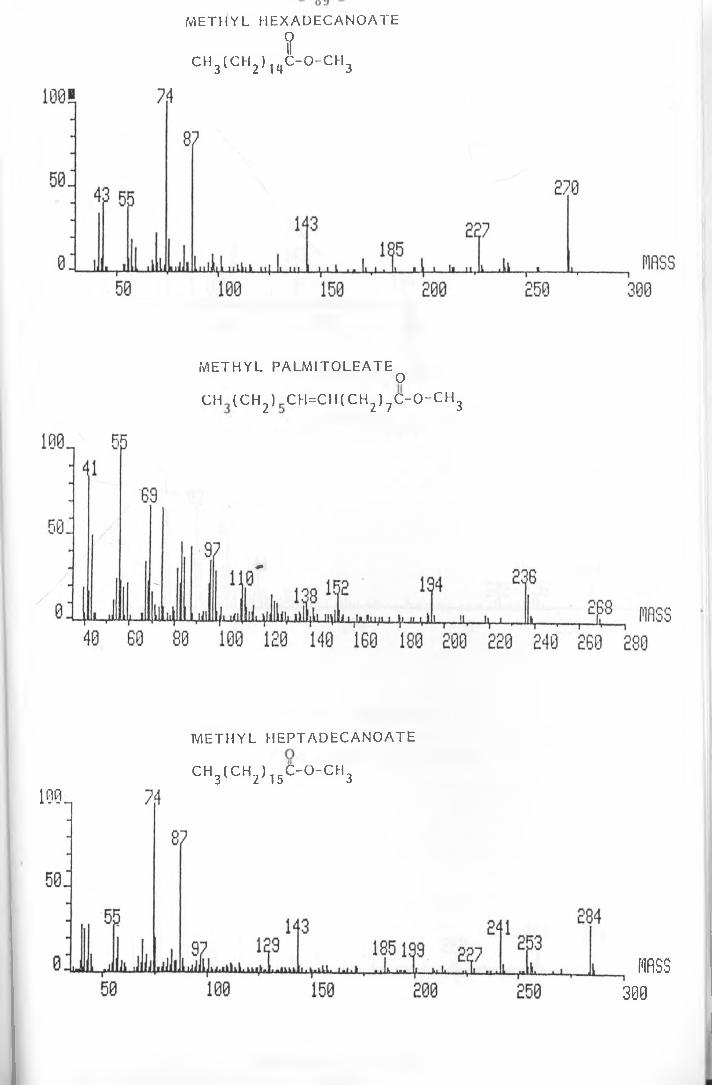
fC H 3(C H 2) 14C - 0 - C H 3
M E T H Y L H E X A D E C A N O A T E
M ETHYL PALM ITOLEATEO
CH (C H 2) CH=CH(CH2) 7C - 0 - C H 3
M ETH YL HEPTADECANOATE
c h 3( c h 2) 15c - o - c h 3
BASS300

M E T H Y L S T E A K A T E
CH3(C ,V l 6
OIIC -O -C II
1001
5 8 :
74
55
L J jlJ l
87
J i J !
143
•Mi Ik
193255 298
A mss50 100 150 200 250 300
METHYL OLEATE
METHYL L INO LEATE OII
CH (CH ) CII=CHCH CH=CH(CH ) C -O C II
ta lTER S lTY ok Na ir o b i LIBRA
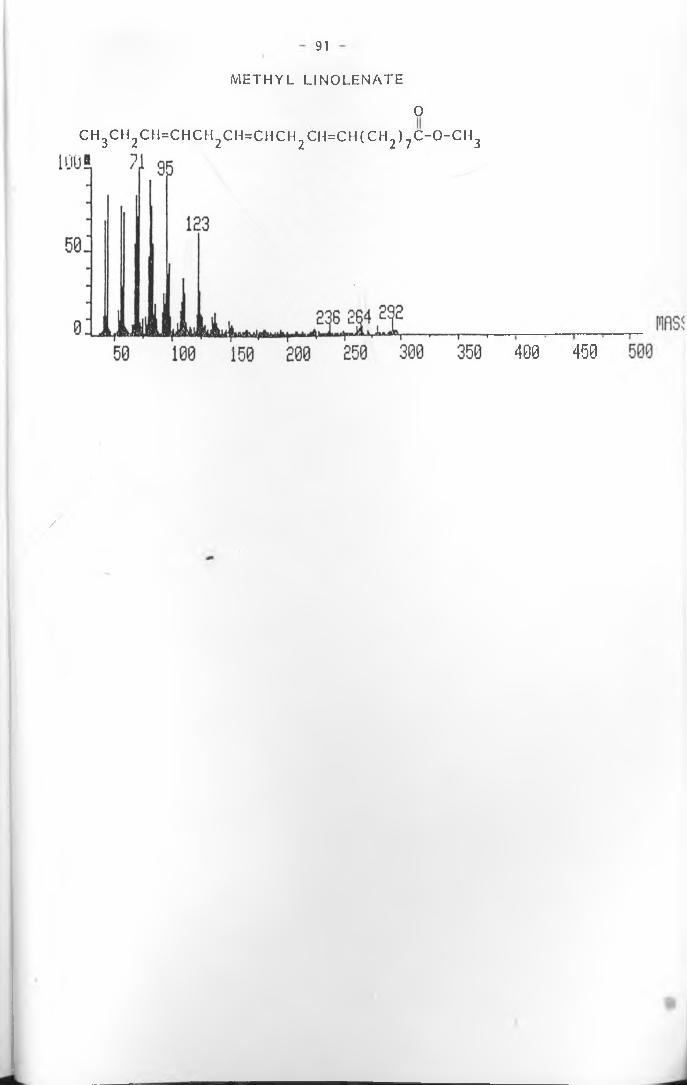
91
METHYL LINOLENATE
O
c h 3c h 2c h =c h c h 2c h =c h c h 2c h =c h ( c h 2) 7c - o - c h 3
400
/
450