efficiency of a stormwater detention pond in reducing loads of
TRANSCRIPT

U.S
.D
EP
A
RTMENT OF THE
INT
ER
IOR
M A R C H 3, 1849
Efficiency of a Stormwater Detention Pond in Reducing Loads of Chemical and Physical Constituents in Urban Streamflow, Pinellas County, Florida
By I.H. Kantrowitz and W.M. Woodham
U.S. GEOLOGICAL SURVEY
Water-Resources Investigations Report 94-4217
Prepared in cooperation with
PINELLAS COUNTY, FLORIDA
Tallahassee, Florida1995
U.S
.D
EP
A
RTMENT OF THE
INT
ER
IOR
M A R C H 3, 1849

U.S. DEPARTMENT OF THE INTERIOR
BRUCE BABBITT, Secretary
U.S. GEOLOGICAL SURVEY
Gordon P. Eaton, Director
For additional information write to: Copies of this report can be purchased from:
District Chief U.S. Geological SurveyU.S. Geological Survey Earth Science Information CenterSuite 3015 Open-File Reports Section227 North Bronough Street P.O. Box 25286, MS 517Tallahassee, FL 32301 Denver, CO 80225-0425

Contents III
CONTENTS
Abstract. ............................................................................................................................................................................ 1Introduction ....................................................................................................................................................................... 2Description of the Detention Pond, Monitoring Sites, and Drainage Basin ..................................................................... 2Data Collection.................................................................................................................................................................. 4Constituent Loads ............................................................................................................................................................. 5Detention Pond Efficiency for Stormwater ....................................................................................................................... 7
Measured Pond Efficiency........................................................................................................................................... 8Adjusted Estimates of Pond Efficiency ....................................................................................................................... 11Factors Affecting Constituent-Load Changes ............................................................................................................. 11
Errors in Load Adjustment ................................................................................................................................ 11Flushing of Stored Base Flow ........................................................................................................................... 12Settling and Biochemical Processes .................................................................................................................. 13Vegetation .......................................................................................................................................................... 13Restricted Circulation ........................................................................................................................................ 14
Load Reduction of Urban-Runoff Contaminants ........................................................................................................ 14Metals ................................................................................................................................................................ 14Nutrients ............................................................................................................................................................ 14Other Selected Chemical and Physical Constituents......................................................................................... 14
Detention Pond Efficiency For Base Flow........................................................................................................................ 15Summary and Conclusions................................................................................................................................................ 17References Cited ............................................................................................................................................................... 18
FIGURES
1. Map showing detention area 3 and the location of the inflow and outflow monitoring sites on Saint Joe Creek, Pinellas Park, Pinellas County, Fla .................................................................................................. 3
2. Discharge hydrograph for typical storm C and samples selected for chemical analysis at outflow site (02308935) ............................................................................................................................ 6
TABLES
1. Drainage area and land-use characteristics of areas contributing flow into and out of detention area................... 42. Hydraulic characteristics of the monitored storms.................................................................................................. 53. Computed loads of selected water-quality constituents in stormwater at the inflow site ....................................... 74. Computed loads of selected water-quality constituents in stormwater at the outflow site ..................................... 85. Daily base-flow loads of selected water-quality constituents at the inflow site ..................................................... 96. Concentrations of selected water-quality constituents in stormwater and base flow at the inflow site .................. 97. Pond efficiencies for selected water-quality constituents in stormwater based on loads measured at the
inflow and outflow sites ....................................................................................................... ................................... 108. Mean-event concentrations of selected water-quality constituents in stormwater at the inflow and
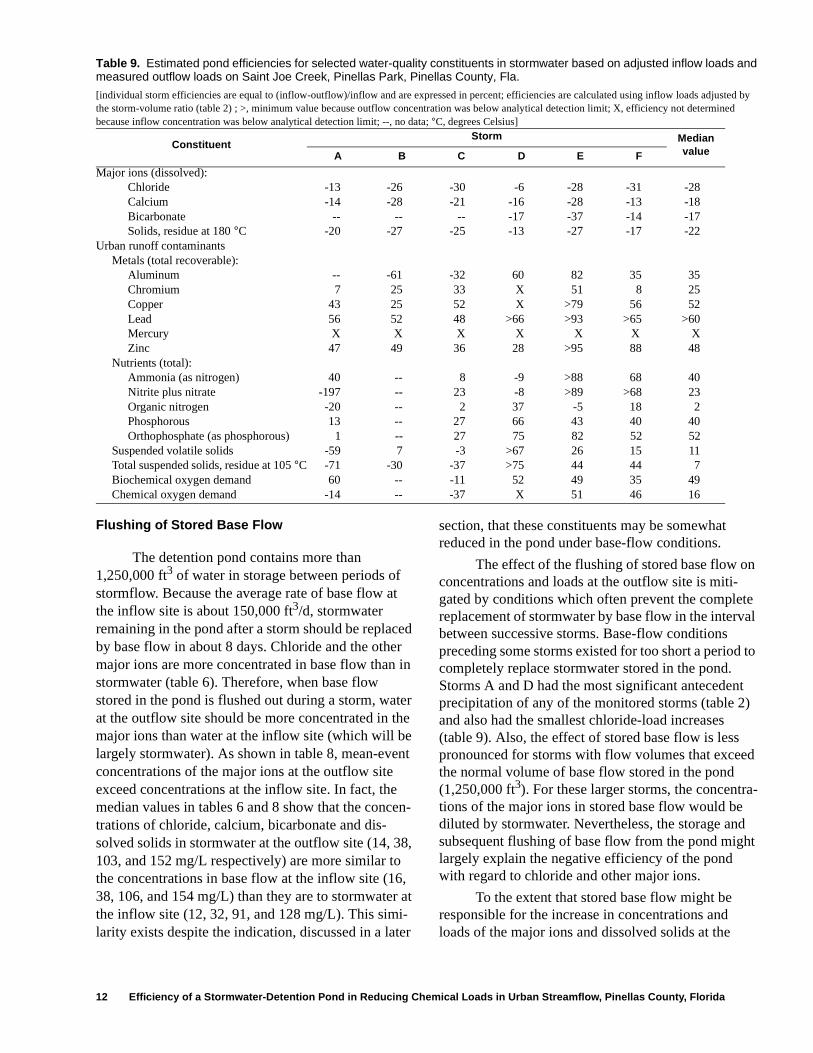
outflow sites ............................................................................................................................................................ 109. Estimated pond efficiencies for selected water-quality constituents in stormwater based on adjusted
inflow loads and measured outflow loads ............................................................................................................... 1210. Daily base-flow loads of selected water-quality constituents at the outflow site before and after
construction of the detention pond.......................................................................................................................... 16

IV Contents
CONVERSION FACTORS, WATER-QUALITY ABBREVIATIONS, AND ACRONYM
Temperature in degrees Celsius (°C) can be converted to degrees Fahrenheit (°F) asfollows:
°F=1.8 °C+32
WATER-QUALITY ABBREVIATIONS
kg kilogramsmg/L milligrams per liter
ACRONYM
USGS U.S. Geological Survey
Multiply By To obtain
inch (in.) 25.4 millimeter
foot (ft) 0.3084 meter
cubic foot (ft3) 0.0283 cubic meter
cubic foot per day (ft3/d) 0.0283 cubic meter per day
square mile (mi2) 2.590 square kilometer
acre 0.4047 hectare

Abstract 1
Efficiency of a Stormwater-Detention Pond in Reducing Loads of Chemical and Physical Constituents in Urban Streamflow, Pinellas County, Florida
By I.H. Kantrowitz and W.M. Woodham
Abstract
A multipurpose wet stormwater-detention pond in Pinellas Park, Florida, was studied to determine its effectiveness in reducing the load of selected water-quality constituents commonly found in urban streamflow. Water-quality samples, and data on streamflow and precipitation were collected at the outflow and principal inflow of detention area 3 on Saint Joe Creek. To compare the constituent loads entering and leaving the detention pond, flows and water quality were simultaneously monitored at the inflow and outflow sites for six storms as well as intermittently monitored during periods of base flow. Loads of 19 selected chemical and physical constituents were determined.
Because all the stormwater entering the detention pond was not measured at the inflow site, computed stormwater inflow loads were adjusted to account for loads from the unmonitored areas. The ratio of stormwater volume measured at the outflow site to stormwater volume measured at the inflow site was used to adjust inflow loads for individual storms. Pond efficiencies for selected water-quality constituents for each of the storms were estimated by dividing the difference in outflow and adjusted inflow loads by the adjusted inflow load.
Stormwater loads of the major ions (chloride, calcium and bicarbonate) and dissolved solids at the outflow site exceeded loads at the inflow site, partly as a result of mixing with base flow stored within the pond. However, the detention pond was effective in reducing the stormwater load of such
urban-runoff contaminants as metals, nutrients, suspended solids, and biochemical and chemical oxygen demand. Estimated median pond efficiencies for reducing constituent loads ranged from 25 to more than 60 percent for metals, 2 to 52 percent for nutrients, 7 to 11 percent for two measurements of suspended solids, and 16 to 49 percent for the oxygen-consuming substances. The reductions of constituent loads in stormwater are probably a result of dilution with pond water (particularly for smaller storms), adsorption, chemical precipitation, settling, biologic uptake, and oxidation. The establishment of aquatic vegetation midway through the study appears to have increased the efficiency of the pond in reducing loads of urban-runoff contaminants in stormwater.
The efficiency of the detention pond in reducing base-flow loads was estimated by comparing base-flow loads at the outflow site prior to and after construction of the pond. Loads of major ions and dissolved solids in base flow were reduced at median efficiencies ranging from 17 to 35 percent. Urban-runoff contaminants in base flow were generally reduced at higher efficiencies. Median efficiencies ranged from 38 to 82 percent for metals, 19 to 83 percent for nutrients, 34 to 45 percent for suspended solids, and 43 to 65 percent for the oxygen-consuming substances. The reductions in base-flow loads are probably a result of adsorption, chemical precipitation, biologic uptake, and settling within the pond. These processes were more effective in reducing base-flow loads after the establishment of aquatic vegetation in the pond.

2 Efficiency of a Stormwater-Detention Pond in Reducing Chemical Loads in Urban Streamflow, Pinellas County, Florida
INTRODUCTION
Urban streamflow, particularly stormwater run-off, often contains substantial loads of numerous chemical and physical constituents that may adversely affect the water quality of receiving waters. These constituent loads are caused by the rainfall washoff of deposited material such as vehicle emissions, trash, pet litter, fertilizers and pesticides applied to lawns, and atmospheric deposition. Several constituents common in urban streamflow include metals, dust and soils, nutrients, pesticides, bacteria, and other natural and anthropogenic compounds (Lopez and Giovannelli, 1984).
Even relatively small loads of some contami-nants can stress the biological integrity of receiving waters through various physical and chemical pro-cesses. Metals can be toxic to aquatic life and are often accumulated and concentrated in the food chain. Excess nutrients commonly result in the growth of undesirable aquatic plants and contribute to the eutrophication process of receiving waters. Suspended material in water causes turbidity, which affects the penetration of light and inhibits the growth of desir-able aquatic plants such as seagrass. The presence of oxygen-consuming substances reduces the level of oxygen dissolved in water and can kill fish.
Stormwater-detention ponds, commonly used to attenuate peak flows and minimize flooding, are regarded as one of the most promising management practices to reduce contaminant loads (McCuen, 1980) and are widely used throughout Florida. Detention ponds designed to control flooding and to improve water quality by maximizing sedimentation and chem-ical and biologic processes are referred to as multipur-pose stormwater-detention ponds. Ponds designed to retain water during nonstorm periods are referred to as wet detention ponds.
Urban streamflow in densely populated Pinellas County contains concentrations of selected constitu-ents that exceed State standards for treated sewage effluent and that also exceed the standards for water entering the Gulf of Mexico and Tampa Bay (Lopez and Giovannelli, 1984). A multipurpose wet detention pond located on Saint Joe Creek in the urban commu-nity of Pinellas Park in Pinellas County (fig. 1) was selected to study the effectiveness of stormwater-detention ponds as pollution-control measures. The study was conducted from 1984 to 1991 by the U.S. Geological Survey (USGS) in cooperation with the Pinellas County Engineering Department.
Streamflow in Saint Joe Creek during, and for a period following storms, is referred to in this report as “stormwater runoff”. Although consisting largely of overland flow, most of which is conveyed to the stream channel by stormwater sewers, stormwater run-off may also include a small component of flow contributed by ground-water discharge as well as water released (flushed) from storage from small, upstream detention ponds. Streamflow during periods of fair weather consists almost entirely of ground-water discharge to the channel and is referred to as “base flow”. Because of delays in the construction of the detention pond, intensive collection of stormwater-runoff data did not begin until 1989. The delay provided the opportunity for more extensive sampling of base flow and thus broadened the scope of the study to include the full range of urban streamflow.
The purpose of this report is to present a comparison of the constituent loads in urban streamflow as it enters and leaves a multipurpose wet detention pond. The report also presents efficiency data for the removal of selected urban-runoff contaminants (metals, nutrients, suspended material, and oxygen-consuming substances) in both stormwater and base flow within the detention pond. Stormwater runoff and base flow were measured and sampled upstream and downstream from the detention pond. Constituent loads in stormwater were computed from intensive sampling of six storms during a 2-year period from 1989 to 1991. Constituents loads in base flow were computed from 13 grab samples collected upstream from the pond during the period from 1989 to 1991 and from 16 grab samples collected at the downstream site during the period from 1984 to 1991.
DESCRIPTION OF THE DETENTION POND, MONITORING SITES, AND DRAINAGE BASIN
The stormwater-detention pond selected for this study is located on Saint Joe Creek, a largely channelized perennial stream that flows westward and drains an urbanized area in central Pinellas County (fig. 1). The stream is also referred to locally as “Saint Joes Creek,” “Joe's Creek” and “Joe Creek.” The detention pond, known as detention area 3, was constructed by the Pinellas County Engineering Department by excavating a 25-acre (0.04 mi2) area to a depth of 15 to 20 ft below the general land surface and, in two settling basins within the pond, as much as 8 ft

Description of the Detention Pond, Monitoring Sites, and Drainage Basin 3
below the original streambed elevation. Construction of the detention pond was completed in 1989. A 30-in. diameter gravity sanitary sewer parallels the channel and the southern boundary of the pond but is not known to have affected water quality in Saint Joe Creek or detention area 3.
Because detention area 3 was excavated below the water table and below the level of the pond outlet, it contains water over most of its area even under base-flow conditions. During construction, an area of fill was placed parallel to the original creek channel in order to temporarily isolate the channel from the northern part of the pond. After construction, the fill was not completely removed, leaving it partially emerged during base-flow conditions and overgrown by cattails. Even when sub-merged during storms, the fill probably restricts circula-tion between the two halves of the pond (fig.1).
Under base-flow conditions, the entire pond is covered by water except for the emergent area of fill. With a typical 1-ft depth of water covering the shallow submerged parts of the pond, and with more than 5 ft of water in the deeper parts, the pond contains more than 1,250,000 ft3 of water. During storms, backwater
46th Avenue North
Saint Joe Creek
Saint Joe Creek
49th Avenue North
AUTOMATICWATER SAMPLERAND RAIN GAGE
AUTOMATICWATER SAMPLERAND RAIN GAGE
INFLOWDISCHARGE-
GAGINGSTATION
(02308931)OUTFLOW
DISCHARGE-GAGINGSTATION
(02308935)
LOW-HEADV-NOTCH WEIR
46th
Str
eet
Nor
th
40th
Str
eet
Nor
th
SeaboardCoastline
Railroad
0 500 FEET
SETTLING BASIN
AREA OF FILL
EXPLANATION
LealmanDetention
Area
PinellasPark
Location of Study Areawithin the city ofPinellas Park inPinellas County
Figure 1. Detention area 3 and the location of the inflow and outflow monitoring sites on Saint Joe Creek, Pinellas Park, Pinellas County, Fla.
conditions are created behind the concrete v-notch weir outlet and water is temporarily stored in the pond. Approximately 1,000,000 ft3 are stored for each foot of water-level rise. Backwater conditions are generally dissipated less than 24 hours after cessation of precipi-tation. Because of the permanent water-storage conditions within the pond, however, the residence time of stormwater may commonly exceed 24 hours.
A daily-discharge gaging station and an auto-matic water sampler were maintained on Saint Joe Creek by the USGS from September 1984 through September 1991. The gaging station, Saint Joe Creek at Pinellas Park (station number 02308935), was 30 ft upstream from a box culvert at the intersection of 46th Avenue North and 46th Street North and about 900 ft downstream from the outlet of the detention pond (fig. 1). This station, referred to as the “outflow” site, monitored the quantity and chemical quality of flow from a 2.55 mi2 drainage basin composed mostly of medium-density, single-family residential and commercial land uses (table 1). Land-use characteris-tics of the drainage basin did not change during the period of study because the basin experienced little or no new development.

4 Efficiency of a Stormwater-Detention Pond in Reducing Chemical Loads in Urban Streamflow, Pinellas County, Florida
Table 1. Drainage area and land-use characteristics of areas contributing flow into and out of detention area 3 on Saint Joe Creek, Pinellas Park, Pinellas County, Fla.
SiteDrainage area(square miles)
Land use, percentage of area
Residential CommercialOpen andrecreation
RoadsInstitu-tional
Outflow 2.55 53 20 14 12 1
Inflow 2.00 51 22 13 13 1
Intervening area 0.55 60 13 16 9 2
Following construction of detention area 3 in 1989, a daily-discharge gaging station and an auto-matic water sampler were installed about 1,100 ft upstream from the excavated area. This “inflow” gaging station was operated by the USGS from October 1989 through September 1991. The inflow site, Saint Joe Creek at Lealman (station number 02308931), was 60 ft upstream from the Seaboard Coastline Railroad bridge near the intersection of 49th Avenue North and 40th Street North (fig. 1). The inflow site monitored the quantity and chemical quality of flow from a 2.00 mi2 drainage basin.
A 0.55 mi2 area surrounding the detention pond, referred to as the “intervening” area, contributes run-off to the pond that is not monitored at the inflow site (table 1). The intervening area includes the 0.04 mi2 area of the pond. Runoff from the intervening area enters the detention pond from three stormwater sew-ers located on the north, south, and west sides of the pond. It was considered impractical to monitor the inflow from the sewers; therefore, indirect methods were used to estimate loads from the intervening area.
DATA COLLECTION
Water-quality samples and data on streamflow and precipitation were collected at the outflow and principal inflow of detention area 3 on Saint Joe Creek. Samples of stormwater runoff for six storms were collected and analyzed at both sites from September 1989 through August 1991. One to three base-flow samples per year were collected from 1984 to 1991 at the outflow site. One base-flow sample was collected at the inflow site in 1986 and two to five samples per year were collected from 1989 to 1991.
The outflow and inflow sites were operated as standard USGS gaging stations (Carter and Davidian, 1968). Continuously monitored water levels in the stream were converted to flows using a stage-discharge relation developed for each site by means of periodic flowmeter measurements (Buchanan and
Somers, 1969; Kennedy, 1984). Efforts were made to take measurements during storms in order to define the stage-discharge relation for the higher stages and flows of primary interest to this study. Mean daily dis-charge values for both sites have been published in the annual data releases of the USGS. Instantaneous dis-charges and discharges for subdivided days were com-puted using the stage-discharge relation and were used to compute the constituent loads for base flow and for each of the six storms at the outflow and inflow sites.
Sample collection, preservation, shipping, and analysis were done according to standard procedures of the USGS (Fishman and Friedman, 1989). Manual sampling techniques were used to collect water samples during base flow. Automatic sampling equipment was used at both sites to collect water samples during storms. The samplers were stage activated, and the frequency of sampling was controlled by a data logger programmed to sample at designated time intervals or when the stage changed at more than a designated rate. The stage, time intervals, and rates of change programmed into the data logger were based on the hydrograph characteristics observed at the outflow site prior to construction of the pond. Generally, 15 to 24 samples were collected at each site for each storm. The storage area of the sampling equipment was refrigerated and was maintained at a temperature of approximately 4°C.
The concentration of major ions (chloride, calcium, and bicarbonate), total recoverable metals (aluminum, chromium, copper, lead, mercury, and zinc), total nutrients (ammonia, nitrite plus nitrate, organic nitrogen, phosphorus, and orthophosphate as phosphorus), dissolved solids, suspended volatile solids, total suspended solids, biochemical oxygen demand, and chemical oxygen demand were determined at a USGS water-quality laboratory, except for bicarbonate, which was computed from the field determination of alkalinity. For consistency throughout this report, these chemical and physical measurements and constituents will be described collectively as constituents.

Constituent Loads 5
Reported concentrations of metals, particularly concentrations less than 0.1 mg/L, could be strongly influenced by contamination introduced by sampling methods. Because the focus of this study was a comparison of loads at the two sites, and because sampling methods at both sites were the same, the analytical data for metals and the computations based on these data were assumed to be valid in a relative sense, if not in an absolute sense.
CONSTITUENT LOADS
The load (mass) of a constituent in streamflow is the mathematical product of the concentration of the constituent (mass per volume) and the total volume of water passing a point. Concentration data for 19 con-stituents and continuous discharge data were available at the inflow and outflow sites for each of the six storms studied and also for selected periods of base flow. The hydraulic characteristics for each of the six storms are shown in table 2.
During periods of stormwater runoff, both the quantity and chemical quality of the flow may change rapidly. Although runoff was monitored continuously, there is no practical way to monitor the chemical qual-ity of a variety of constituents in a continuous manner. This inability introduces an intuitive but unknown error into the computation of load. The method chosen to obtain constituent concentrations for load computa-tions in this study is referred to as “discrete sampling” and is one of several standard methods commonly used, all of which have associated unknown errors. Discrete sampling has the advantage of being rela-tively straightforward, relying on mathematical com-putation rather than physically blending a composite sample. Too, by using data from several chemical analyses, discrete sampling minimizes the effect of possible sampling error or spurious laboratory data.
To compute storm loads by the discrete method of sampling, several samples from among the total samples collected during a storm were selected for chemical analysis. The samples were chosen so that they were representative of discrete intervals on the storm hydrograph: two or three samples on the rising limb of the hydrograph, one or two at or near the peak, and two or three on the falling limb. A hydrograph showing the discharge measured at the outflow site during a typical storm as well as samples selected for chemical analyses are shown in figure 2. The total interval representing stormwater flow is bounded by the first and last samples collected; within the storm, discrete intervals are bounded by the midpoint (based on time) between successive samples.
Samples were individually analyzed and constituent loads were computed from the product of the constituent concentrations and the volume of flow occurring during the interval of the storm represented by the sample. Each discrete load represents the quality of the flow for a part of the storm hydrograph. These loads were then summed to determine the total constituent load for the storm.
Loads for 19 constituents, along with the median value for each, were computed at the inflow and outflow sites for the six storms, and are presented in tables 3 and 4. Loads were computed from discharge data reported to two significant figures and concentration data reported to one, two, or three significant figures, depending on the constituent and the analytical method used. Load computations based on concentrations reported to one significant figure, are reported to two significant figures in tables 3 and 4. In all other cases, loads are reported to three significant figures. Some constituents in some storms had concentrations below analytical detection limits. In these cases, the detection limits were used to compute a maximum possible load. These loads are indicated by a “less than” symbol in tables 3 and 4. The presence of these censored data points made it necessary to use median, rather than mean, values to summarize the load data (tables 3 and 4).
Table 2. Hydraulic characteristics of the monitored storms on Saint Joe Creek, Pinellas Park, Pinellas County, Fla.
[Rainfall data from 8-inch recording raingage at the inflow site]
Storm Date
Rainfall Inflow site runoff Outflow site runoff Volume ratio
Total(inches)
Duration(hours)
Intensity(inches per
hour)
Ten-dayantecedent
(thousands of
cubic feet)(inches)
(thousands of
cubic feet)(inches)
outflow/inflow
A 09-25-89 1.44 28.0 0.05 1.96 2,510 0.54 3,830 0.65 1.53
B 12-08-89 1.69 15.0 .11 .01 4,100 .88 5,240 .88 1.28
C 02-23-90 2.66 13.5 .20 .18 4,580 .99 4,620 .78 1.01
D 10-11-90 1.54 12.0 .13 2.12 1,060 .23 1,570 .27 1.48
E 04-24-91 1.00 4.5 .22 .37 1,350 .29 1,210 .20 0.90
F 08-19-91 1.43 13.0 .11 .82 3,930 .85 7,050 1.19 1.79

6 Efficiency of a Stormwater-Detention Pond in Reducing Chemical Loads in Urban Streamflow, Pinellas County, Florida
The greatest constituent loads contained in storm-water at both the inflow and outflow sites are associated with naturally occurring dissolved major ions, repre-sented in this study by chloride, calcium, and bicarbon-ate as well as the dissolved solids residue. Nevertheless, relatively small loads of metals, nutrients, and suspended solids and the presence of oxygen-consum-ing substances are often environmentally significant. These 15 constituents are collectively referred to in this report as “urban-runoff contaminants.”
Many constituents in stormwater runoff are also in base flow. In addition to the stormwater samples collected for this study, 13 base-flow samples were collected from December 1986 to July 1991 at the inflow site and 16 samples were collected from November 1984 to May 1991 at the outflow site. Because base-flow quantity and chemical quality are relatively constant, daily base-flow load was com-puted as a simple product of the concentrations in a single sample and the daily volume of flow for the date of sampling. Base-flow volumes were available from the record of daily discharge at the gaging sta-tions or, in only one case, from an instantaneous mea-
DIS
CH
AR
GE
,IN
CU
BIC
FE
ET
PE
RS
EC
ON
D75
50
25
02400 0800 1600 2400 0800 1600 2400 0800 1600 2400 0800 1600 2400
FEB. 22, 1990 FEB. 23, 1990
24-HOUR TIME
FEB. 24, 1990 FEB. 25, 1990
SAMPLE SELECTED FORCHEMICAL ANALYSIS
Figure 2. Discharge hydrograph for typical storm C and samples selected for chemical analysis at outflow site (02308935) on Saint Joe Creek, Pinellas Park, Pinellas County, Fla.
surement of discharge. The minimum, maximum, and median daily constituent loads computed from base-flow samples at the inflow site are shown in table 5. Only data from the inflow site are presented to avoid the effect of the detention pond on the constituent loads. (Data from the outflow site are presented in table 10 and are discussed elsewhere in this report.)
Constituent concentrations in stormwater and base flow at the inflow site are summarized in table 6. The data for stormwater are event-mean concentrations calculated from load and runoff-volume data (tables 3 and 2) for each of the storms; the data for base flow are based on the concentrations of individual samples. Median concentrations of urban-runoff contaminants in stormwater are generally greater than in base flow (table 6); furthermore, instantaneous concentrations of these constituents in stormwater are often significantly greater than the mean-event concentrations shown in table 6. The relatively high concentrations, coupled with increased volumes of flow during storms, result in stormwater constituent loads that may be as much as 60 times greater than comparable base-flow loads.

Detention Pond Efficiency for Stormwater 7
Table 3. Computed loads of selected water-quality constituents in stormwater at the inflow site on Saint Joe Creek, Pinellas Park, Pinellas County, Fla.
[ --, no data; <, maximum possible load based on concentration below analytical detection limit;°C, degrees Celsius]
ConstituentStorm (loads in kilograms)
MedianA B C D E F
Major ions (dissolved)Chloride 803 1,740 1,300 398 543 1,100 952Calcium 2,350 3,950 3,530 953 1,270 3,520 2,940Bicarbonate -- -- -- 2,630 3,500 10,100 3,500Solids, residue
at 180 °C 9,240 17,600 13,500 3,740 5,230 13,900 11,400Urban Runoff Contaminants
Metals (total recoverable):Aluminum -- 23.7 33.9 2.65 12.3 8.27 12.3Chromium .33 .24 .56 <.03 .09 .20 .22Copper .32 .47 .81 <.03 .16 .29 .30Lead .52 1.18 1.19 .08 .45 .32 .48Mercury <.02 <.01 <.01 <.004 <.004 <.01 <.01Zinc 3.35 4.76 4.90 .62 7.36 22.0 4.83
Nutrients (total):Ammonia (as nitrogen) 10.6 -- 4.85 0.56 4.05 31.2 4.85Nitrite plus nitrate 12.7 -- 12.2 1.11 6.73 6.91 6.91Organic nitrogen 44.9 -- 82.3 22.7 50.4 80.8 50.4Phosphorous 7.08 -- 21.8 4.88 7.96 9.77 7.96Orthophosphate
(as phosphorus) 2.73 -- 11.1 3.00 2.64 6.04 3.00
Suspended volatile solids 300 1,180 780 89 330 190 320Total suspended solids, residue
at 105 °C
816 1,900 2,240
120
790 710 803Biochemical oxygen demand 308 -- 381 126 227 356 308Chemical oxygen demand 1,910 -- 3,830 <729 1,470 3,060 1,910
Lopez and Giovannelli (1984, p. 68) used a set of regression equations to estimate that stormwater loads make up 67 to 78 percent of the annual load of selected contaminants transported in Saint Joe Creek. The avail-able data from the present study could not be used to confirm their estimate because the range in volume of the 6 monitored storms was not representative of 20 small storms (flow volumes less than 1,000,000 ft3 that occurred during the 2-year study period. Despite the inability to estimate loads for small storms, a minimum approximation of the annual stormwater loads for the urban-runoff contaminants at the inflow site can be computed as the product of the median storm loads (table 3) and the 19 storms per year that had flow vol-umes within the range of the monitored storms. Annual base-flow loads of the urban-runoff contaminants were computed as the product of median daily base-flow load (table 5) and 269 days of base flow per year during the study period. Based on these approximate annual loads, stormwater runoff is estimated to contribute from 54 percent (chemical oxygen demand) to 82 percent (lead) of the total load of urban-runoff contaminants at the inflow site. These minimum percentages support the estimates made by Lopez and Giovannelli (1984).
DETENTION POND EFFICIENCY FOR STORMWATER
A common method used to quantify the efficiency of a treatment facility, in this case the detention pond, is to divide the change in load by the inflow load (Martin and Smoot, 1986); the result is expressed as a percent. As an example, if the load of a constituent entering the pond were 100 kg and the load leaving the pond were 50 kg, the efficiency of the pond for that constituent for that particular storm would be 50 percent. An efficiency of 100 percent is the theoretical maximum that could be attained. On the other hand, if the load leaving the pond exceeded the load entering the pond, the efficiency would be expressed as a negative percentage and can exceed 100 percent. Efficiencies cannot be computed when the inflow load (table 3) is a “less-than” value because the mathematical expression (Inflow-Outflow)/Inflow has no rational solution. However, a minimum efficiency can be computed when only the outflow load is a “less-than” value.

8 Efficiency of a Stormwater-Detention Pond in Reducing Chemical Loads in Urban Streamflow, Pinellas County, Florida
Table 4. Computed loads of selected water-quality constituents in stormwater at the outflow site on Saint Joe Creek, Pinellas Park, Pinellas County, Fla.
[--, no data; <, maximum possible load based on concentration below analytical detection limit; °C, degrees Celsius]
ConstituentStorm (loads in kilograms)
MedianA B C D E F
Major ions (dissolved):Chloride 1,390 2,810 1,710 624 626 2,580 1,550Calcium 4,110 6,470 4,300 1,630 1,460 7,130 4,200Bicarbonate -- -- -- 4,570 4,330 20,600 4,570Solids, residue at
180 °C 17,000 28,600 17,100 6,260 6,000 29,100 17,000Urban Runoff Contaminants
Metals (total recoverable):Aluminum -- 49.0 45.1 1.56 1.95 9.66 9.66Chromium .47 .23 .38 <.04 .04 .33 .28Copper .28 .45 .39 <.05 <.03 .23 .26Lead .35 .72 .63 <.04 <.03 <.20 <.28Mercury <.01 <.15 <.02 <.01 <.01 <.02 <.02Zinc 2.73 3.08 3.15 .66 <.34 4.59 2.90
Nutrients (total):Ammonia (as nitrogen) 9.68 -- 4.51 .90 <.44 17.7 4.51Nitrite plus nitrate 57.8 -- 9.44 1.78 <.69 <3.99 <3.99Organic nitrogen 82.4 -- 81.3 21.2 47.8 118 81.3Phosphorus 9.43 -- 16.0 2.49 4.06 10.5 9.43Orthophosphate
(as phosphrus) 4.12 -- 8.24 1.09 .43 5.16 4.12
Suspended volatile solids 730 1,400 810 <44 220 290 510Total suspended solids,
residue at 105 °C 2,140 3,170 3,110 <44 401 714 1,430
Biochemical oxygen demand
188 -- 429 88.8 104 417 188
Chemical oxygen demand 3,340 -- 5,300 <44 653 2,960 2,960
Measured Pond Efficiency
Individual storm efficiencies based on the loads computed from data at the inflow and outflow sites for the 19 constituents are listed in table 7. About half the efficiencies in table 7 are negative; that is, the load leaving the pond was more than the load entering the pond. Additional loading to the pond is to be expected because of the unmonitored inflows from the interven-ing area (table 1) and precipitation directly on the pond. Stormwater runoff from the 0.51 mi2 area sur-rounding the detention pond is collected by stormwa-ter sewers that flow directly into the pond. Precipitation falling directly on the 0.04 mi2 pond also contributes to runoff and loads at the outflow site.
The significance of the load contribution from the intervening area (including precipitation on the pond) can be recognized by comparing the volume of flows at the inflow and outflow sites for the six storms (table 2). Measured outflow volume exceeded inflow volume in all cases except for storm E. Storm E also had the fewest observed negative efficiencies of any
monitored storm, doubtless because the intervening area contributed little or no flow and associated load. For the other storms, the outflow volume was 1.01 to 1.79 times greater than the inflow volume, with a mean ratio for all monitored storms of 1.33. By way of comparison, the drainage area at the outflow site is 1.28 times greater than the drainage area at the inflow site (table 1).
Because the measured changes in constituent loads (table 7) are based on incomplete inflow data, they do not accurately describe the efficiency of the detention pond in reducing constituent loads contained in stormwater. Mean-event concentrations of urban-runoff contaminants in stormwater leaving the pond (outflow site) are generally less than concentrations at the inflow site (table 8), suggesting that these constitu-ents are being removed or diluted within the pond. To estimate the true efficiency of the pond, measured inflow loads must be adjusted to account for the load from the unmonitored intervening area.

Detention Pond Efficiency for Stormwater 9
Table 6. Concentrations of selected water-quality constituents in stormwater and base flow at the inflow site on Saint Joe Creek, Pinellas Park, Pinellas County, Fla.
[data for stormwater are event-mean concentrations; <, concentration below analytical detection limit (baseflow) or maximum possible mean-event concentration based on one or more individual concentrations below analytical detection limit (stormwater); X, not applicable; °C, degrees Celsius; discharge in cubic feet per second (cfs)]
Constituent or characteristicNumber of samples
Stormwater
Number of samples
Base flow
Minimum Maximum Median Minimum Maximum Median
Concentration inmilligrams per liter
Concentration inmilligrams per liter
Major ions (dissolved):Chloride 6 10 15 12 12 14 22 16Calcium 6 27 34 32 12 19 48 38Bicarbonate 3 81 92 91 8 90 126 106Solids, residue at 180 °C 6 104 152 128 13 125 214 154
Urban runoff contaminantsMetals (total recoverable):
Aluminum 5 .07 .30 .20 9 .04 1.0 .08Chromium 6 <.001 .005 .002 13 <.001 .008 .003Copper 6 <.001 .006 .004 13 <.001 .012 .002Lead 6 .003 .012 .008 13 <.001 .010 .002Mercury 6 <.0001 <.0003 <.0001 12 <.0001 .0022 <.0001Zinc 6 .02 .20 .04 13 .01 .04 .02
Nutrients (total):Ammonia (as nitrogen) 5 .02 .28 .11 11 .02 .27 .07Nitrite plus nitrate 5 .04 .18 .09 11 <.02 .42 .08Organic nitrogen 5 .63 1.3 .73 11 .55 1.3 .67Phosphorous 5 .09 .21 .16 11 .05 .15 .08Orthophosphate
(as phosphorous)5 .04 .10 .07 11 <.01 .10 .03
Suspended volatile solids 6 2 10 5 12 1 10 4Total suspended solids,
residue at 105 °C6 4 21 14 13 2 39 8
Biochemical oxygen demand 5 2.9 5.9 4.2 12 1.4 5.1 1.9Chemical oxygen demand 5 <24 38 27 12 <10 190 42Discharge (cfs) X X X X 13 .82 2.6 1.6
Table 5. Daily base-flow loads of selected water-quality constituents at the inflow site on Saint Joe Creek, Pinellas Park, Pinellas County, Fla.[<, maximum possible load based on concentration below analytical detection limit; °C, degrees Celsius]
ConstituentNumber ofsamples
Minimum Maximum Median
Load in kilograms per dayMajor ions (dissolved):
Chloride 12 32.3 102 59.5Calcium 12 38.1 254 145Bicarbonate 8 250 535 404Solids, residue at 180 °C 13 367 1040 616
Urban runoff contaminantsMetals (total recoverable):
Aluminum 9 0.080 0.450 0.318Chromium 13 <.004 .025 .010Copper 13 .002 .068 .010Lead 13 <.004 .064 .008Mercury 12 <.001 .005 <.001Zinc 13 .002 .196 .078
Nutrients (total):Ammonia (as nitrogen) 11 .040 .954 .206Nitrite plus nitrate 11 .060 1.14 .254Organic nitrogen 11 1.37 4.517 2.70Phosphorous 11 .100 .587 .343Orthophosphate (as phosphorus) 11 .032 .308 .159
Suspended volatile solids 12 2.01 50.9 18.6Total suspended solids, residue at 105 °C 13 4.01 95.4 29.4Biochemical oxygen demand 11 2.81 20.0 7.49Chemical oxygen demand 12 <41.6 604 117

10 Efficiency of a Stormwater-Detention Pond in Reducing Chemical Loads in Urban Streamflow, Pinellas County, Florida
Table 8. Mean-event concentrations of selected water-quality constituents in stormwater at the inflow and outflow sites on Saint Joe Creek, Pinellas Park, Pineallas County, Fla.
[<, maximum possible mean-event concentration based on one or more individual concentrations below analytical detection limit ; °C, degrees Celsius]
ConstituentNumber ofsamples
Inflow siteNumber ofsamples
Outflow siteMinimum Maximum Median Minimum Maximum Median
Concentration inmilligrams per liter
Concentration inmilligrams per liter
Major ions (dissolved):Chloride 6 10 15 12 6 13 19 14Calcium 6 27 34 32 6 33 44 38Bicarbonate 3 81 92 91 3 103 126 103Solids, residue at 180 °C 6 104 152 128 6 131 193 152
Urban runoff contaminantsMetals (total recoverable):
Aluminum 5 .07 .30 .20 5 .04 .34 .06Chromium 6 <.001 .005 .002 6 <.001 .004 .002Copper 6 <.001 .006 .004 6 <.001 .003 .002Lead 6 .003 .012 .008 6 <.001 .005 .002Mercury 6 <.0001 <.0003 <.0001 6 <.0001 <.001 <.0002Zinc 6 .02 .20 .04 6 <.01 .03 .02
Nutrients (total):Ammonia (as nitrogen) 5 .02 .28 .11 5 <.02 .09 .04Nitrite plus nitrate 5 .04 .18 .09 5 <.02 .53 .04Organic nitrogen 5 .63 1.3 .73 5 .48 1.4 .62Phosphorous 5 .09 .21 .16 5 .05 .12 .09Orthophosphate
(as phosphorous)5 .04 .10 .07 5 .01 .06 .03
Suspended volatile solids 6 2 10 5 6 <1 9 6Total suspended solids, residue
at 105 °C6 4 21 14 6 <1 24 16
Biochemical oxygen demand 5 2.9 5.9 4.2 5 1.7 3.3 2.1Chemical oxygen demand 5 <24 38 27 5 <1 41 19
Table 7. Pond efficiencies for selected water-quality constituents in stormwater based on loads measured at the inflow and outflow sites on Saint Joe Creek, Pinellas Park, Pineallas County, Fla.
[individual storm efficiencies are equal to (inflow load-outflow load)/inflow load and are expressed as a percent; >, minimum value because outflow concentration was below analytical detection limit; X, efficiency not determined because inflow concentration was below analytical detection limit; --, no data; °C, degrees Celsius ]
Constituent Storm Medianvalue A B C D E F
Major ions (dissolved):Chloride -73 -61 -32 -57 -15 -135 -59Calcium -75 -64 -21 -71 -15 -103 -68Bicarbonate -- -- -- -74 -24 -104 -74Solids, residue at 180 °C -84 -62 -27 -67 -15 -109 -64
Urban runoff contaminantsMetals (total recoverable):
Aluminum -- -107 -33 43 84 -17 -17Chromium -42 4 32 X 55 -65 4Copper 12 4 52 X >81 21 21Lead 33 39 47 >50 >93 >38 43Mercury X X X X X X XZinc 18 35 36 -6 >95 79 36
Nutrients (total):Ammonia (as nitrogen) 9 -- 7 -61 >89 43 9Nitrite plus nitrate -355 -- 23 -60 >90 >42 23Organic nitrogen -84 -- 1 7 5 -46 1Phosphorous -33 -- 27 49 49 -7 27Orthophosphate (as phophorous) -51 -- 26 64 84 >15 26
Suspended volatile solids -143 -19 -4 >51 33 -53 -12Total suspended solids, residue at 105 °C -162 -67 -39 >63 49 -1 -20Biochemical oxygen demand 39 -- -13 30 54 -17 -30Chemical oxygen demand -75 -- -38 X 56 3 -18

Detention Pond Efficiency for Stormwater 11
Adjusted Estimates of Pond Efficiency
In a study of urban streamflow in the Tampa Bay area, Lopez and Giovannelli (1984) observed that stormwater volume was the most significant variable in predicting contaminant loads in stormwater. Their study was based on a regression analysis of rainfall, runoff, and water-quality data for nine urban drainage basins, including Saint Joe Creek. The constituents included as independent variables in the regression analysis were total recoverable lead, total organic nitrogen, total nitrogen (the sum of the nitrogen species analyzed for in this study), total phosphorus, biochemical oxygen demand, and chemical oxygen demand. Because stormwater volume has been shown to be a reasonable predictor of stormwater loads, the measured constituent loads at the inflow site were volume adjusted to permit a comparison with loads at the outflow site. The premise behind this adjustment is that, for an individual storm, the volume of flow into the pond should be equal to the volume of flow out of the pond.
Load data for the inflow site (table 3) were multi-plied by the volume ratio for the appropriate storm (table 2) to compute an adjusted load that is assumed to represent the total constituent loading to the pond including the estimated load from the unmonitored intervening area. Individual storm efficiencies for the 19 constituents, based on the adjusted inflow loads and the measured outflow loads, are listed in table 9. Because there is no way to verify the accuracy of the volume-ratio adjustment, and because of the inherent, but unknown, errors in the basic computation of loads, pond efficiencies in table 9 are considered to be esti-mates.
The adjusted storm efficiencies listed in table 9 are more consistent (have a smaller range) among storms for each constituent than the unadjusted values in table 7 and have fewer negative values. Median values are used to summarize the pond efficiency for each constituent. The median, rather than the mean, was used because of the relatively large number of censored data points (“less-than” values) and because it minimizes the effect of outlier data points. Although more vigorous methods have been used to mathemati-cally describe constituent-load efficiencies (Martin and Smoot, 1986), the relatively small number of data sets available for the present study does not justify their use. Too, the logic behind the zero-intercept regression method used by Martin and Smoot (1986, p. 22) is invalidated by the unmonitored intervening area and the presence of a base-flow component in the stormwater runoff at detention area 3. For this reason, median values are believed to adequately describe the overall performance of the detention pond.
Factors Affecting Constituent-Load Changes
Data in table 9 indicate that loads of chloride, calcium, bicarbonate, and dissolved solids leaving the pond consistently exceeded the loads entering the pond. These constituents should be little changed by the processes operating within the pond. In particular, dissolved chloride in water is highly stable and gener-ally does not react or form solute complexes with other ions, does not form salts, is not absorbed on mineral surfaces, and is not involved in biochemical reactions (Hem, 1985, p. 118). Because of the conser-vative nature of chloride in water, it is reasonable to assume that the total loads entering and leaving the detention pond should be about the same (ignoring the negligible contribution directly from rain on the pond). Other studies (for example, Martin and Smoot, 1986, p. 27) have determined that detention ponds have little or no effect on chloride loads. Therefore, the median increase in chloride load of 28 percent (table 9) is of interest because of what it may indicate concerning factors affecting constituent-load changes in the pond.
Errors in Load Adjustment
One factor contributing to the greater than expected loads of chloride and other major ions at the outflow site may be that loads entering the pond from the unmonitored intervening area are underestimated by the volume-ratio method of load adjustment. An underlying assumption of the volume-ratio method is that the constituent load generated from the intervening area is similar to that generated from the area monitored at the inflow site. Although this is a reasonable assumption based on the general land-use characteristics of the two areas (table 1), the assumption was not verified because of the difficulty of instrumenting and sampling the sewers that discharged stormwater directly into the pond from the intervening area. If the inflow loads of the major ions were underestimated by the volume-ratio adjustment, the inflow loads of the urban-runoff contaminants (metals, nutrients, suspended material and oxygen-consuming substances) also might be underestimated. In this case, the efficiencies for the urban-runoff contaminants shown in table 9 might be too low. There are, however, other explanations for the increased loads of the major ions (discussed below) so that it is not possible to quantify the possible errors or uncertainties in table 9 due to underestimation of inflow loads.
12 Efficiency of a Stormwater-Detention Pond in Reducing Chemical Loads in Urban Streamflow, Pinellas County, Florida
Table 9. Estimated pond efficiencies for selected water-quality constituents in stormwater based on adjusted inflow loads and measured outflow loads on Saint Joe Creek, Pinellas Park, Pinellas County, Fla.
[individual storm efficiencies are equal to (inflow-outflow)/inflow and are expressed in percent; efficiencies are calculated using inflow loads adjusted by the storm-volume ratio (table 2) ; >, minimum value because outflow concentration was below analytical detection limit; X, efficiency not determined because inflow concentration was below analytical detection limit; --, no data; °C, degrees Celsius]
ConstituentStorm Median
valueA B C D E F
Major ions (dissolved):Chloride -13 -26 -30 -6 -28 -31 -28Calcium -14 -28 -21 -16 -28 -13 -18Bicarbonate -- -- -- -17 -37 -14 -17Solids, residue at 180 °C -20 -27 -25 -13 -27 -17 -22
Urban runoff contaminantsMetals (total recoverable):
Aluminum -- -61 -32 60 82 35 35Chromium 7 25 33 X 51 8 25Copper 43 25 52 X >79 56 52Lead 56 52 48 >66 >93 >65 >60Mercury X X X X X X XZinc 47 49 36 28 >95 88 48
Nutrients (total):Ammonia (as nitrogen) 40 -- 8 -9 >88 68 40Nitrite plus nitrate -197 -- 23 -8 >89 >68 23Organic nitrogen -20 -- 2 37 -5 18 2Phosphorous 13 -- 27 66 43 40 40Orthophosphate (as phosphorous) 1 -- 27 75 82 52 52
Suspended volatile solids -59 7 -3 >67 26 15 11Total suspended solids, residue at 105 °C -71 -30 -37 >75 44 44 7Biochemical oxygen demand 60 -- -11 52 49 35 49Chemical oxygen demand -14 -- -37 X 51 46 16
Flushing of Stored Base Flow
The detention pond contains more than 1,250,000 ft3 of water in storage between periods of stormflow. Because the average rate of base flow at the inflow site is about 150,000 ft3/d, stormwater remaining in the pond after a storm should be replaced by base flow in about 8 days. Chloride and the other major ions are more concentrated in base flow than in stormwater (table 6). Therefore, when base flow stored in the pond is flushed out during a storm, water at the outflow site should be more concentrated in the major ions than water at the inflow site (which will be largely stormwater). As shown in table 8, mean-event concentrations of the major ions at the outflow site exceed concentrations at the inflow site. In fact, the median values in tables 6 and 8 show that the concen-trations of chloride, calcium, bicarbonate and dis-solved solids in stormwater at the outflow site (14, 38, 103, and 152 mg/L respectively) are more similar to the concentrations in base flow at the inflow site (16, 38, 106, and 154 mg/L) than they are to stormwater at the inflow site (12, 32, 91, and 128 mg/L). This simi-larity exists despite the indication, discussed in a later
section, that these constituents may be somewhat reduced in the pond under base-flow conditions.
The effect of the flushing of stored base flow on concentrations and loads at the outflow site is miti-gated by conditions which often prevent the complete replacement of stormwater by base flow in the interval between successive storms. Base-flow conditions preceding some storms existed for too short a period to completely replace stormwater stored in the pond. Storms A and D had the most significant antecedent precipitation of any of the monitored storms (table 2) and also had the smallest chloride-load increases (table 9). Also, the effect of stored base flow is less pronounced for storms with flow volumes that exceed the normal volume of base flow stored in the pond (1,250,000 ft3). For these larger storms, the concentra-tions of the major ions in stored base flow would be diluted by stormwater. Nevertheless, the storage and subsequent flushing of base flow from the pond might largely explain the negative efficiency of the pond with regard to chloride and other major ions.
To the extent that stored base flow might be responsible for the increase in concentrations and loads of the major ions and dissolved solids at the

Detention Pond Efficiency for Stormwater 13
outflow site, it might also be partly responsible for the decrease in stormwater concentrations and loads of metals, nutrients, suspended solids, and biochemical and chemical oxygen demand (tables 8 and 9). These urban-runoff contaminants are less concentrated in base flow than they are in stormwater (table 6), so that base flow flushed from the pond during storms might decrease the load at the outflow site relative to the load at the inflow site. Another result of the flushing of base flow during storms is to moderate the peak con-centration of urban-runoff constituents downstream from the detention pond. Tables 6 and 8 show that con-centrations of most constituents in water released from the pond (outflow site) are closer to the concentrations found in base flow than they are to concentrations in stormwater (inflow site).
The effect of stored base flow on pond efficiency is more pronounced for smaller storms in which base flow is a more significant component of flow at the outflow site. The two smallest storms monitored, storms D and E, generally showed the greatest removal (positive efficiency) of urban-runoff contaminants (table 9). Of the 14 urban-runoff contaminants for which efficiencies were calculated, 9 had the greatest load reduction in storm E and 4 in storm D. Three of the four major ions had the greatest load increase in storm D, further supporting the significant role of stored and subsequently flushed base flow in affecting loads at the inflow site, particularly for smaller storms.
Dilution of stormwater by stored base flow reduces peak concentrations and loads in Saint Joe Creek downstream from the detention pond; however, it does not affect the long-term mass balance of constituents entering and leaving the pond. Dissolved constituents are not removed by this process but rather are simply redistributed in time. Any stormwater (with higher concentrations of urban-runoff contaminants) that is stored within the pond after storms would subsequently be flushed from the pond by base flow. There is, however, some evidence to suggest that other processes active in the detention pond may have a more permanent effect on constituent loads.
Settling and Biochemical Processes
As described in a later section, the relatively greater loads of urban-runoff contaminants anticipated to occur in base flow at the outflow site following storms were not observed and, in fact, constituent loads within the pond under base-flow conditions
appear to have been appreciably reduced. The processes assumed to be responsible for these reductions in base-flow loads are adsorption, chemical precipitation, settling, biologic uptake, and oxidation. These processes, referred to collectively in this report as settling and biochemical processes, are also assumed to be active in the pond during and immediately following storms. Settling and biochemical processes are probably least significant in reducing constituent loads for small storms (when dilution plays a major role) and are most significant during larger storms, such as storms A, B, C and F with flow volumes 3 to more than 5 times greater than the volume of water stored in the pond. Settling and biochemical processes result in permanent load reductions only to the extent that urban-runoff contaminants in biota and sediments are not recycled by decay of vegetation, resuspension of sediments, and mobilization of adsorbed ions.
Vegetation
Excluding the low-volume storms D and E during which dilution was probably a major factor, 12 of the 14 urban-runoff contaminants for which efficiencies were calculated had the greatest load reductions during storm F (table 9). Storm F had the highest volume of flow at the outflow site of any of the monitored storms so that load reduction due to dilution was relatively low and settling and biochemical processes were largely responsible for the significant load reductions. What further distinguishes storm F from the other high-volume storms (A, B, and C) and what may explain the higher rates of pond efficiency is that vegetation in the pond had become well established at the time of this storm whereas it was more sparse during the earlier high-volume storms. The presence of an extensive plant community in the pond obviously promotes biologic uptake of nutrients and possibly metals. Plants also oxygenate the water which helps reduce biochemical and chemical oxygen demand. Additionally, plants decrease flow velocities in the pond which promotes the settling of suspended material and also increases residence time within the pond. Longer residence time, in turn, provides more opportunity for settling and biochemical processes to reduce loads.
During the first summer after construction of the pond, between storms C and D (table 2), vegetation became well established along the banks of the pond, on the fill material across the center of the pond, and in areas of shallow water throughout the pond. The

14 Efficiency of a Stormwater-Detention Pond in Reducing Chemical Loads in Urban Streamflow, Pinellas County, Florida
presence of a vegetative community during the final three monitored storms (D, E, and F) appears to have greatly improved the efficiency of the pond in remov-ing urban-runoff contaminants (table 9).
Restricted Circulation
The northern half of the detention pond is nearly isolated from the through-flowing Saint Joe Creek during base-flow conditions (fig. 1). Removal of water by evaporation and plant transpiration in this part of the pond might result in the accumulation of water with somewhat higher concentrations of all dissolved constituents. This relatively enriched water would be flushed out of the pond during higher stages of flow associated with storms (when circulation between the two halves of the pond occurs) thus adding to the load measured at the outflow site. To the extent that this occurred, the apparent efficiency of the pond in reduc-ing stormwater loads of urban-runoff contaminants could be increased by enhancing the circulation of water within the pond during base-flow conditions, thus minimizing the concentration of constituents by evaporation and transpiration. This would, by itself, have little or no effect on the total load transported by Saint Joe Creek, but it would help further reduce loads during and immediately after storms.
Load Reduction of Urban-Runoff Contaminants
In the following discussion, median values based on all six storms are used to describe the effi-ciency of the pond in reducing the loads of urban-run-off contaminants. Long-term efficiencies might likely be higher under conditions of mature vegetation and enhanced circulation. Also, no attempt is made to quantify the various physical, biologic and chemical processes assumed to be responsible for the observed reductions in stormwater load.
Metals
The pond removed metals at an estimated median efficiency ranging from 25 percent for chro-mium to greater than 60 percent for lead (table 9). Alu-minum and zinc, the metals with by far the largest inflow loads (table 3), had estimated efficiencies of 35 and 48 percent, respectively. Aluminum is the only metal with negative efficiencies for individual storms. With the lack of additional geochemical data, particu-
larly pH values, the failure of the pond to consistently remove aluminum cannot be fully explained. How-ever, for three of the five storms for which aluminum was monitored, a minimum of 35 percent of the alumi-num load entering the pond was estimated to have been removed (table 9). Mercury was not present in sufficient concentration to compute loads. Loads of all other metals (chromium, copper, lead, and zinc) were consistently reduced in the pond, most likely as a result of dilution, adsorption, chemical precipitation, and the settling of the suspended phase.
Nutrients
Nutrients were removed at an estimated median efficiency ranging from 2 percent for organic nitrogen to 52 percent for orthophosphate. Pond efficiencies for the removal of nitrogen species in stormwater are highly variable, both from storm to storm for individ-ual species, and species to species for individual storms (table 9). This likely reflects the complex chemistry of nitrogen and its occurrence in various oxidation states. The negative efficiencies for nitrite plus nitrate (-197 percent) and organic nitrogen (-20 percent), and the reduced positive efficiencies for phosphorus and orthophosphate for storm A (table 9) could be the result of suspected sources of contamina-tion adjacent to the pond. In general, however, the loads of all nitrogen species were reduced in the pond, probably as a result of dilution and biologic uptake. Phosphorus and orthophosphate loads were reduced in all storms, probably due to chemical precipitation as well as dilution and biologic uptake.
Other Selected Chemical and Physical Constituents
The pond seems to function erratically as a settling basin. Loads of suspended volatile solids increased (negative efficiency) for two of the six storms, and loads of suspended total solids increased for three of the storms. Overall, suspended volatile solids and suspended total solids were removed at esti-mated median efficiencies of only 11 and 7 percent, respectively. However, efficiencies for these constitu-ents were consistently positive for the later storms (D, E, and F), possibly reflecting more settling of suspended material, less resuspension of bottom sedi-ments, and less erosion of bank and fill material coin-cident with the establishment of natural vegetation in and adjacent to the pond.
Detention Pond Efficiency for Base Flow 15
Biochemical oxygen demand and chemical oxygen demand, commonly used as measures of total oxygen consuming substances in water and good rela-tive indicators of environmental stress from organic material, were reduced at estimated median efficien-cies of 49 and 16 percent, respectively. The significant reductions of the loads of these indicators in the pond for most storms (table 9) indicate biologic oxidation of organic material within the pond.
DETENTION POND EFFICIENCY FOR BASE FLOW
Although stormwater runoff can often “shock” receiving waters because of the delivery of large con-taminant loads within relatively short periods of time, base-flow loads are, nevertheless, also of environmen-tal significance. As discussed in this report and Lopez and Giovannelli (1984), base-flow loads of contami-nants make up at least 20 percent of the estimated annual contaminant load transported in Saint Joe Creek.
Detention area 3 functions as a modified wetland during base-flow conditions because of the relative shallowness of the water and the presence of cattails and other emergent vegetation. The wetland characteristics of the detention pond were best devel-oped after the first summer of operation (between storms C and D). Data developed by Martin and Smoot (1986) indicate that a small, natural wetland in central Florida was more effective in reducing constit-uent loads than a relatively deep detention pond. Therefore, constituent loads in base flow entering detention area 3 are expected to be reduced by the physical, chemical, and biologic processes active in the shallow water, wetlandlike environment of the pond.
Base-flow loads at the inflow and outflow sites cannot be compared directly in time because the volume of storage in the pond (1,250,000 ft3) far exceeds the daily inflow rate (150,000 ft3/d). Typical base-flow detention time of the pond is about 8 days, although it may be as little as 4 days if circulation to the northern half of the pond is restricted. The method chosen to estimate the efficiency of the pond in reducing base-flow loads was to compare loads at the outflow site before and after construction of the pond.
Nine base-flow samples were collected at the outflow site between November 1984 and April 1988
prior to construction, and seven samples were collected between September 1989 and May 1991 after construction was completed. The minimum, maximum, and median daily constituent loads for the pre- and post-construction periods are shown in table 10. The median values were used to compute apparent base-flow efficiencies by dividing the difference in median load (preconstruction minus postconstruction) by the preconstruction median load. The results, expressed as a percentage, also are presented in table 10.
Based on the data in table 10, constituent loads in base flow appear to be significantly reduced in the detention pond. The method of comparison presented in table 10 assumes that pre- and post-construction conditions were similar except for the presence of the pond. Changing conditions that could appreciably affect constituent loads generated within the drainage basin, and therefore invalidate the comparison made in table 10, are land use, streamflow rates, and chemical concentrations in base flow. Streamflow rates and chemical concentrations are, at least in part, controlled by land use. Because the basin experienced little or no new building development during the study period, reductions in base-flow load are not likely to be due to changes in basin characteristics.
Loads are a function of chemical concentration and rates of streamflow discharge. Although median discharges associated with the pre- and post-construc-tion samples are similar, the range of flow is less in the postconstruction period (table 10). This might explain, at least in part, the apparent reduction in load. Constit-uent chemical concentrations, however, are also lower in the postconstruction period, suggesting that the pos-itive efficiencies represent an actual reduction of load within the pond.
Unlike stormwater, base-flow loads of the major ions (chloride, calcium, bicarbonate and dissolved solids) apparently are reduced within the pond. Some of this reduction may be the result of mixing with residual stormwater in the pond. However, data presented by Martin and Smoot (1986, p. 49 and p. 51) show significant removal (positive median efficiencies) of major ions in the wetland treatment part of the detention pond-wetland system they studied. At least some of the load reduction of the major ions in detention area 3 may, therefore, be due to processes active in the wetlandlike environment that exists in the pond during base-flow conditions.

16 Efficiency of a Stormwater-Detention Pond in Reducing Chemical Loads in Urban Streamflow, Pinellas County, Florida
Table 10. Daily baseflow loads of selected water-quality constituents at the outflow site before and after construction of the detention pond on Saint Joe Creek, Pinellas Park, Pineallas County, Fla.
[load in kilograms per day; discharge in cubic feet per second (cfs)] <, maximum possible load based on concentration below analytical detection limit; --, no data; X, not determined; °C, degrees Celsius; apparent efficiency is equal to (median preconstruction load minus postconstruction load)/preconstruction load]
Constituent orcharacteristic
Preconstruction PostconstructionApparentefficiency
Numberof
samplesMinimum Maximum Median
Numberof
samplesMinimum Maximum Median
Major ions (dissolved):Chloride 3 67.5 153 108 7 33.4 99.4 78.8 27Calcium 4 138 288 218 7 23.9 218 163 25Bicarbonate 5 367 813 553 4 171 454 359 35Solids, residue at
180 °C 9 528 1376 830 7 267 905 686 17Urban runoff contaminants
Metals (total recoverable):Aluminum -- -- -- -- 5 .064 .440 .166 --Chromium 8 <.003 .037 .018 7 <.003 <.023 .009 50Copper 8 .004 .024 .013 7 <.002 .026 .008 38Lead 8 .003 .099 .028 7 .003 .019 .005 82Mercury 8 <.001 .002 .001 6 <.001 .002 <.001 XZinc 8 .049 .621 .084 7 .016 .139 .042 50
Nutrients (total):Ammonia (as nitrogen) 9 .078 1.90 .391 6 .016 .264 .065 83Nitrite plus nitrate 9 .039 1.57 .134 6 .048 .165 .086 36Organic nitrogen 9 1.97 4.23 2.64 6 .922 3.35 2.15 19Phosphorous 9 .117 .621 .274 6 .042 .296 .150 45Orthophosphate
(as phosphorous)9 .059 .352 .132 6 .016 .176 .065 51
Suspended volatile solids 3 17.6 61.2 24.5 7 3.18 46.4 16.2 34Total suspended solids,
residue at 105 °C9 5.35 141 58.7 7 4.16 204 32.3 45
Biochemical oxygen demand
9 4.14 17.6 8.22 5 1.43 12.3 2.90 65
Chemical oxygen demand 8 4.40 290 152 6 26.9 207 87 43Discharge (cfs) 9 1.1 2.5 1.6 7 .65 1.9 1.7 --
All the urban-runoff contaminants, except for organic nitrogen and suspended volatile solids, had load-reduction efficiencies that exceeded the efficien-cies of the major ions (table 10). Because 3 of the 7 postconstruction base-flow samples were collected within 4 days of the preceding storm and another sam-ple was collected within 8 days of the preceding storm, mixing of base flow with stormwater remaining in the pond might have been expected to increase, rather than decrease the load at the outflow site, at least for these four samples. This is because stormwater contains higher concentrations of urban-runoff contaminants than does base flow (table 6) and because the mini-mum time required to completely flush stormwater from the pond under base-flow conditions is 4 days. Nevertheless, there was no correlation between post-construction loads at the outflow site and the duration
of base-flow conditions prior to sampling; the maxi-mum load of 6 of the 15 urban-runoff contaminants occurred in the 3 base-flow samples collected within 4 days of the preceding storm as compared to 7 of the 15 maximum loads that occurred in 3 samples collected between 14 and 45 days after the preceding storm. Additionally, 14 of the 15 minimum constituent loads in postconstruction base flow at the outflow site occurred in samples collected after the summer of 1990 when vegetation had become well established in the pond. Therefore, the relatively high efficiencies computed for metals, nutrients, suspended solids, bio-chemical oxygen demand and chemical oxygen demand, could be related to settling and biochemical processes (adsorption, chemical precipitation, biologic uptake and oxidation) which appear to be most active under wetlandlike conditions.

Summary and Conclusions 17
Apparent efficiencies for the removal of constit-uent loads of urban-runoff contaminants in base flow (table 10) range from 38 to 82 percent for the metals, 19 to 83 percent for the nutrients, 34 to 45 percent for suspended solids, 65 percent for biochemical oxygen demand, and 43 percent for chemical oxygen demand. Except for copper and orthophosphate, the base-flow efficiencies in table 10 exceeded the comparable stormwater efficiencies (table 9) for every constituent with available data. Therefore, the slow, shallow flow conditions and relatively long residence times associ-ated with base flow in the detention pond are more effective in reducing constituent loads than the rapid, sometimes turbulent, deeper flow conditions and shorter residence times occurring during storms.
SUMMARY AND CONCLUSIONS
Streamflow and water-quality data were collected at the inflow and outflow of a multipurpose, wet detention pond on Saint Joe Creek, Pinellas County, Florida, in order to determine the effectiveness of the pond in reducing the load of urban-runoff contaminants. Loads for 19 constituents (4 major ions and 15 urban-runoff contaminants) in stormwater were computed for six storms at the inflow and outflow sites. The greatest loads contained in stormwater are associated with naturally occurring major ions, as indicated by the loads for chloride, calcium, bicarbonate, and dissolved solids. However, the relatively small loads of metals, nutrients, and suspended solids, and the presence of oxygen-consuming substances in stormwater runoff can be of environmental concern.
Because all the stormwater inflow to the deten-tion pond was not measured at the inflow site, loads computed for the inflow site were adjusted to account for the estimated load from the unmonitored area. Stormwater load data at the inflow site were adjusted by the ratio of the stormwater volume measured at the outflow and inflow sites. On the basis of the adjusted inflow data, it is estimated that the pond removes met-als at median efficiencies ranging from 25 percent (chromium) to more than 60 percent (lead). Estimated median efficiencies of removal for nutrients in storm-water ranged from 2 percent (organic nitrogen) to 52 percent (orthophosphate). Suspended solids were removed at estimated median efficiencies of 7 percent
(for volatiles) to 11 percent (for total), and biochemi-cal and chemical oxygen demands had estimated median efficiencies of 49 and 16 percent, respectively. Efficiencies for the suspended solids were notably greater for the last three storms sampled, possibly because of the establishment of vegetation within the pond and on the exposed slopes.
Pond efficiencies for the reduction of base-flow constituent loads could not be determined from comparison of synchronous data at the inflow and outflow sites because the daily volume of base flow entering the pond only represents about 12 percent of the fair-weather volume of water stored in the pond. However, the apparent efficiency of the pond in reducing base-flow loads was estimated based on a comparison of base-flow loads at the outflow site prior to and after construction of the pond. The major ions, including dissolved solids, were reduced at apparent median efficiencies ranging from 17 percent (dissolved solids) to 35 percent (bicarbonate). Generally, the urban-runoff contaminants in base flow were reduced at greater apparent efficiencies, ranging from 38 percent (copper) to 82 percent (lead) for metals, 19 percent (organic nitrogen) to 83 percent (ammonia) for nutrients, 34 percent (volatiles) to 45 percent (totals) for suspended solids, and 43 to 65 percent for biochemical and chemical oxygen demand.
Despite the difficulty of making direct comparisons at the detention pond, constituent loads of both the stormwater and base-flow components of urban streamflow are clearly reduced within the pond. Dilution (mixing with base flow stored in the pond) is significant in reducing the stormwater loads of urban-runoff contaminants in relatively small storms. Adsorption, chemical precipitation, settling, biologic uptake, and oxidation within the pond are important processes in the reduction of constituent loads during larger storms and during base-flow conditions. Settling and biochemical processes are typical of wetland environments; the establishment of aquatic vegetation appears to have increased the efficiency of the pond in reducing stormwater and base-flow constituent loads. Further reductions in the loads of urban-runoff contaminants leaving the pond during storms could possibly be attained by improving the circulation of base flow within the pond between storms.

18 Efficiency of a Stormwater-Detention Pond in Reducing Chemical Loads in Urban Streamflow, Pinellas County, Florida
REFERENCES CITED
Buchanan, T.J., and Somers, W.P., 1969, Discharge measurements at gaging stations: U.S. Geological Survey Techniques of Water-Resources Investigations, book 3, chap. A8, 65 p.
Carter, R.W., and Davidian, J., 1968, General procedure for gaging streams: U.S. Geological Survey Techniques of Water-Resources Investigations, book 3, chap. A6, 13 p.
Fishman, M.J. and Friedman, L.C., 1989, Methods for determination of inorganic substances in water and fluvial sediments: U.S. Geological Survey Techniques of Water-Resources Investigations, book 5, chap. A1, 545 p.
Hem, J.D., 1985, Study and interpretation of the chemical characteristics of natural water (3d ed.): U.S. Geological Survey Water-Supply Paper 2254, 264 p.
Kennedy, E.J., 1984, Discharge ratings at gaging stations: U.S. Geological Survey Techniques of Water-Resources Investigations, book 3, chap. A10, 59 p.
Lopez, M.A., and Giovannelli, R.F., 1984, Water-quality characteristics of urban runoff and estimates of annual loads in the Tampa Bay area, Florida, 1975-80: U.S. Geological Survey Water-Resources Investigations Report 83-4181, 76 p.
Martin, E.H., and Smoot, J.L., 1986, Constituent-load changes in urban stormwater runoff routed through a detention pond-wetlands system in central Florida: U.S. Geological Survey Water-Resources Investigations Report 85-4310, 74 p.
McCuen, R.H., 1980, Water quality trap efficiency of storm water management basins: American Water Resources Association, Water Resources Bulletin, v. 16, p. 15-21.