efficient utilization of the existing i system and the
TRANSCRIPT

Efficient Utilization of the Existing ITS System and the Viability of a Proactive Traffic Management
System for the Orlando-Orange County Expressway Authority System
Contract # DTRT12GUTC12 with USDOT Office of the Assistant Secretary for Research and Technology (OST-R)
Final Report
September 2014
Principal Investigator: Mohamed Abdel-Aty, Ph.D.
National Center for Transportation Systems Productivity and Management O. Lamar Allen Sustainable Education Building 788 Atlantic Drive, Atlanta, GA 30332-0355 P: 404-894-2236 F: 404-894-2278 [email protected] nctspm.gatech.edu

DISCLAIMER
The contents of this report reflect the views of the authors, who are responsible for the facts and the
accuracy of the information presented herein. This document is disseminated under the sponsorship of
the U.S. Department of Transportation’s University Transportation Centers Program, in the interest of
information exchange. The U.S. Government assumes no liability for the contents or use thereof.

EFFICIENT UTILIZATION OF THE EXISTING ITS SYSTEM AND THE
VIABILITY OF A PROACTIVE TRAFFIC MANAGEMENT SYSTEM FOR
THE CENTRAL FLORIDA EXPRESSWAY AUTHORITY SYSTEM
Final Report
Dr. Mohamed Abdel-Aty, PE
Dr. Essam Radwan, PE
Qi Shi, PhD Candidate
Ling Wang, PhD Student
Center for Advanced Transportation Systems Simulation
Department of Civil, Environmental & Construction Engineering
University of Central Florida
Orlando, FL 32816-2450
Submitted to
Central Florida Expressway Authority and UTC
National Center for Transportation System Productivity and Management
September 2014
i
EXECUTIVE SUMMARY
The rapid development of Intelligent Transportation Systems (ITS) has triggered new traffic
detection technologies to capture the traffic flow characteristics. The data acquired from these
systems provide traffic operators and researchers with different perspectives to evaluate their
system, pinpoint the potential problems and make targeted improvement. This report documents
the efforts to explore the efficient utilization of the ITS systems on the expressway network
operated by Central Florida Expressway Authority (CFX). On CFX's system, multiple ITS
systems are in deployment. In this report, detailed work using the traffic data from these existing
ITS systems has been conducted to identify the potential applications of current ITS systems on
CFX's expressways. The applications include evaluation of current expressway operation and
potential improvement using the ITS systems. In addition, since traffic safety is another
important indicator of system performance and is closely related to operation. Traffic safety
performance on the expressways has also been examined.
To achieve these goals, comprehensive database including traffic detection data from Automatic
Vehicle Identification (AVI) system and Microwave Vehicle Detection System (MVDS),
Dynamic Message Signs (DMS) data, roadway geometric data and crash data have been prepared.
Currently, AVI and MVDS sensors have been installed along the expressways in large quantity
over the whole system to provide real-time traffic information of the five expressways under
CFX's management. Based on the traffic detection data, multiple congestion measures were
proposed to determine the mainline segments and ramps that experience congestion. The
suggested congestion measures have the advantages of reflecting traffic congestion in real-time
manner at numerous locations because of the continuous monitoring of the detection system and
high deployment density of sensors along the expressways. Consequently, congestion intensity,
time duration and locations have been identified. According to the conclusions of congestion
evaluation, congestion mitigation via DMS for queue warning was discussed. The current DMS
that can be used for queue warning and potential locations of DMS in the future were identified.
In addition to congestion evaluation and improvement, ramp closure practice in extreme cases
such as total shut-down on the mainline has been investigated through a survey. Both domestic
and international toll and turnpike authorities have been included in this survey to share their
experience in ramp closure practice and procedures. Detailed information about how these

ii
authorities close their on-ramps, how they communicate with their road users and the ITS
systems they implemented in this process provide valuable insights into the emergency response
in case of mainline shut-down.
Traffic safety is evaluated using the crash data during the past three and half years to be able to
both reflect the most recent safety conditions on the expressways and the trend of changes. More
detailed crash statistics based on the characteristics of crashes have been calculated to explore
whether specific safety issues exist on certain expressways. Finally, crash data visualization is
provided to illustrate the spatial and temporal patterns of the crashes on CFX's system. The
spatial and temporal patterns of crashes clearly point out to the relationship between congestion
and crashes especially rear end crashes. Moreover, lighting related crashes, weather and wet
pavement related crashes also have their significant characteristics on the expressways for which
future improvement projects should consider their effects.
To get insights about the ramp crashes at interchanges, a case study focusing on SR 528 – SR
417 interchange was conducted. Individual crash reports were scrutinized. The most important
finding in this study is that the wet road surface condition could contribute to crashes on ramps.
Most of the crashes on the ramps were single-vehicle crashes and the vehicles hydroplaned on
the wet surface. Potential treatments including warning messages, high friction surface treatment,
providing guardrail and shoulders on ramps have been proposed to reduce the crashes.
Overall, the current ITS systems on the CFX expressway network could be efficiently used for
congestion measurement and queue warning. They are proved to be able to reflect the dynamics
of traffic flow for which the traditional Average Annual Daily Traffic (AADT) or Level of
Service (LOS) could not. The real-time nature of the traffic detection data enables traffic
operators to understand their system at the microscopic level, locate the spots experiencing
specific issues and make the most of limited resources for effective improvement. Efficient
utilization of the ITS system could benefit both traffic operation and safety, enhancing overall
performance of expressways. Nevertheless, their applications are not limited to the topics
discussed in this report. Potential applications include travel time estimation, micro-simulation,
incident and closure duration, DMS optimum locations, etc. that can be further explored in future.

iii
Contents LIST OF TABLES ........................................................................................................................ vii
LIST OF FIGURES ........................................................................................................................ x
LIST OF ACRONYMS .............................................................................................................. xvii
1 INTRODUCTION .................................................................................................................. 1
1.1 Overview .......................................................................................................................... 1
1.2 Objectives: ........................................................................................................................ 2
1.3 Research Organization ..................................................................................................... 2
2 DATA PREPARATION ......................................................................................................... 4
2.1 Expressway System Overview ......................................................................................... 4
2.2 Traffic Detection Systems on the Expressways ............................................................... 5
2.2.1 AVI Traffic Data ....................................................................................................... 6
2.2.2 MVDS Traffic Data .................................................................................................. 9
2.3 DMS Systems on Expressways ...................................................................................... 12
2.4 Road Geometric Characteristics Data for Expressways ................................................. 14
2.5 Crash Data on Expressways ........................................................................................... 15
3 TRAFFIC OPERATION EVALUATION ........................................................................... 16
3.1 Overview ........................................................................................................................ 16
3.2 Congestion Measurement ............................................................................................... 20
3.2.1 AVI-based Congestion Measurement ..................................................................... 21
3.2.2 MVDS-based Congestion Measurement................................................................. 21
3.3 Expressway Congestion Evaluation ............................................................................... 22
3.3.1 Mainline Congestion ............................................................................................... 22
3.3.2 Ramp Congestion .................................................................................................... 30
4 DMS APPLICATION IN CONGESTION MANAGEMENT ............................................. 33

iv
4.1 DMS Application in Queue Warning ............................................................................. 33
4.1.1 Queue Warning ....................................................................................................... 33
4.1.2 Queue Warning Implementation ............................................................................. 34
4.1.3 Placement of Queue Warning Signs ....................................................................... 34
4.2 Expressway Congestion Area and Suggested DMS Locations ...................................... 36
5 RAMP CLOSURE PRACTICE ON THE EXPRESSWAYS .............................................. 46
5.1 Introduction on Toll Authority Survey Response .......................................................... 46
5.2 Summary of the Questionnaire ....................................................................................... 48
5.2.1 Existing Toll Collection System ............................................................................. 48
5.2.2 Practice of Ramp Closure ....................................................................................... 49
5.2.3 Procedures of Ramp Closure .................................................................................. 53
5.2.4 Ramp-closure Information and Information Media ................................................ 57
5.2.5 On-ramp Volume Control Strategy ......................................................................... 60
5.2.6 Existing ITS System ............................................................................................... 61
5.2.7 Average Spacing between Ramps ........................................................................... 63
5.3 Experience and Ideas on Safety, Traffic Management .................................................. 64
5.3.1 Response from Belgium .......................................................................................... 65
5.4 Toll Plaza Modified Operations Plan for Closures and Waivers ................................... 65
5.5 Preliminary Statistical Tests Results .............................................................................. 66
5.6 Summary and Conclusions ............................................................................................. 67
6 TRAFFIC SAFETY EVALUATION ................................................................................... 69
6.1 Crash Data Preparation................................................................................................... 69
6.2 Expressway Safety Overview......................................................................................... 74
6.3 Categorical Analysis of Expressway Mainline Crashes ................................................. 78
6.4 Spatial Analysis of Expressway Crash ........................................................................... 83

v
6.5 Temporal Analysis of Expressway Crashes ................................................................... 90
7 CASE STUDY OF INTERCHANGE TRAFFIC SAFETY ................................................. 93
7.1 Crash Data ...................................................................................................................... 93
7.2 Ramp Traffic Safety Overview ...................................................................................... 96
7.3 Detailed Analysis ........................................................................................................... 99
7.3.1 SR 417 Southbound – SR 528 Westbound ............................................................. 99
7.3.2 SR 528 Eastbound – SR 417 Northbound............................................................... 99
7.3.3 Other Ramps ......................................................................................................... 100
7.4 Potential Treatments ..................................................................................................... 100
7.5 Conclusion .................................................................................................................... 103
8 CONCLUSIONS AND RECOMMENDATIONS ............................................................. 105
8.1 General ......................................................................................................................... 105
8.2 Congestion Evaluation ................................................................................................. 106
8.3 DMS Application in Congestion Management ............................................................ 107
8.4 Ramp Closure Practice ................................................................................................. 108
8.5 Expressway Traffic Safety Performance ...................................................................... 109
8.6 Case Study of Interchange Traffic Safety .................................................................... 110
9 POTENTIAL ITS IMPLEMENTATION ON THE EXPRESSWAYS ............................. 111
9.1 Travel Time Estimation ................................................................................................ 111
9.2 Micro-Simulation using ITS Data ................................................................................ 111
Appendix A. AVI SENSOR DEPLOYMENT ....................................................................... 113
Appendix B. AVI SYSTEM SEGMENTATION ................................................................... 121
Appendix C. MVDS SYSTEM AND LANE MANAGEMENT ........................................... 128
Appendix D. DMS LOCATIONS ON EXPRESSWAYS ...................................................... 136
Appendix E. EXPRESSWAY MAINLINE OPERATION OVERVIEW ............................. 137

vi
Appendix F. EXPRESSWAY MAINLINE TRAFFIC PATTERN ....................................... 142
Appendix G. MAINLINE TOLL PLAZA CASH LANES TRAFFIC VOLUME ................. 144
Appendix H. EXPRESSWAY RAMP WEEKDAY TRAFFIC ............................................. 149
Appendix I. MAINLINE CONGESTION MEASUREMENT (2) OCCUPANCY .............. 154
Appendix J. MAINLINE CONGESTION MEASUREMENT (3) CONGESTION INDEX 156
Appendix K. MAINLINE SYSTEM OCCUPANCY AND TREND OF CONGESTION .... 158
Appendix L. PEAK HOUR OCCUPANCY PROFILE AND TREND OF CONGESTION 163
Appendix M. MAINLINE SYSTEM CONGESTION INDEX AND TREND OF
CONGESTION 166
Appendix N. PEAK HOUR CONGESTION INDEX PROFILE AND TREND OF
CONGESTION 171
Appendix O. RAMP OCCUPANCY PROFILE ..................................................................... 174
Appendix P. RAMP CONGESTION INDEX PROFILE ...................................................... 179
Appendix Q. EXPRESSWAY CONGESTION AREA IDENTIFICATION AND DMS
SUGGESTION 184
Appendix R. THE QUESTIONNAIRE .................................................................................. 191
Appendix S. EXPRESSWAY CRASH BY TYPE OF LANE .............................................. 195
Appendix T. CRASH BY YEAR ........................................................................................... 196
Appendix U. SPATIAL DISTRIBUTION OF TRAFFIC CRASHES ................................... 200
Appendix V. TEMPORAL DISTRIBUTION OF CRASHES ............................................... 218
References ................................................................................................................................... 224

vii
LIST OF TABLES Table 2-1 AVI Segments on CFX Expressway System.................................................................. 6
Table 2-2 MVDS on CFX Expressway System ............................................................................ 12
Table 2-3 DMS on CFX Expressway System............................................................................... 13
Table 2-4 Crash in CAR and S4A................................................................................................. 15
Table 3-1 Expressway System Operation Overview .................................................................... 18
Table 3-2 Travel Time Index and Congestion Levels .................................................................. 21
Table 3-3 MVDS-Based Congestion Measures and Congestion Levels ...................................... 22
Table 4-1 Guidelines for Placement of Warning Signs (adapted from MUTCD 2009) ............... 35
Table 4-2 SR 408 Eastbound Congestion Area ............................................................................ 37
Table 4-3 SR 408 Westbound Congestion Area ........................................................................... 38
Table 4-4 Mainline Congestion Segment and Location Identification and DMS Application for
Congestion Management .............................................................................................................. 42
Table 4-5 Ramp Congestion Identification and DMS Application for Congestion Management 45
Table 5-1 Question 1: Current Toll Collection System ................................................................ 49
Table 5-2 Question 2: Ramp Closing Practices in Case of Total Shut-down ............................... 50
Table 5-3 Question 3: Procedures When Frontage Road is Available ......................................... 51
Table 5-4 Question 4: Procedures When No Frontage Road is Available ................................... 51
Table 5-5 Question 5: Providing Information to Motorists .......................................................... 53
Table 5-6 Ramp Closure Procedure by Domestic Toll Authority ................................................ 54
Table 5-7 Ramp Closure Procedure by International Toll Authority ........................................... 55
Table 5-8 Question 6: Media for Ramp-closure Information ....................................................... 57
Table 5-9 Question 7: Whether Provide Advice Based on Specific Closure Condition .............. 58
Table 5-10 Question 8: Whether Procedure Changes Depending on Other Factors .................... 59
Table 5-11 Question 9: On-ramp Control Strategy....................................................................... 60
Table 5-12 Question 10: Current ITS Systems on Roadways ...................................................... 62
Table 5-13 Existing ITS Systems Implemented by Toll Authorities ............................................ 63
Table 5-14 Domestic Toll Authorities on Safety and/or Traffic Management ............................. 64
Table 5-15 International Toll Authorities on Safety and/or Traffic Management ........................ 65
Table 6-1 Crash Data Preparation for CFX Expressway System ................................................. 69
Table 6-2 Key Words Used for Expressway Crash Selection ...................................................... 71

viii
Table 6-3 Expressway Segment and Operation Authority ........................................................... 72
Table 6-4 Expressway Crash by Type of Lane in 2011 ................................................................ 74
Table 6-5 SR 408 Annual Crash Count by Type of Lane ............................................................. 76
Table 6-6 Crash Rates in 2012 on Toll Expressways in Florida................................................... 77
Table 6-7 Crash Types by Expressway and Year ......................................................................... 79
Table 6-8 Number of Vehicles Involved in Crashes by Expressway and Year ............................ 79
Table 6-9 Crash Injury Severity by Expressway and Year ........................................................... 80
Table 6-10 Weather Condition of Crashes by Expressway and Year ........................................... 81
Table 6-11 Lighting Conditions of Crashes by Expressway and Year ......................................... 82
Table 6-12 Road Surface Conditions of Crashes by Expressway and Year ................................. 82
Table 7-1 Distribution of Environmental, Roadway Factors on Ramps ....................................... 98
Table A-1 SR 408 Eastbound AVI Sensor Deployment ............................................................. 113
Table A-2 SR 408 Westbound AVI Sensor Deployment ........................................................... 114
Table A-3 SR 414 Eastbound AVI Sensor Deployment ............................................................. 115
Table A-4 SR 414 Westbound AVI Sensor Deployment ........................................................... 115
Table A-5 SR 417 Northbound AVI Sensor Deployment .......................................................... 116
Table A-6 SR 417 Southbound AVI Sensor Deployment .......................................................... 117
Table A-7 SR 429 Northbound AVI Sensor Deployment .......................................................... 118
Table A-8 SR 429 Southbound AVI Sensor Deployment .......................................................... 119
Table A-9 SR 528 Eastbound AVI Sensor Deployment ............................................................. 120
Table A-10 SR 528 Westbound AVI Sensor Deployment ......................................................... 120
Table B-1 SR 408 Eastbound AVI System Segmentation .......................................................... 121
Table B-2 SR 408 Westbound AVI System Segmentation ........................................................ 122
Table B-3 SR 414 Eastbound AVI System Segmentation .......................................................... 123
Table B-4 SR 414 Westbound AVI System Segmentation ........................................................ 123
Table B-5 SR 417 Northbound AVI System Segmentation ....................................................... 124
Table B-6 SR 417 Southbound AVI System Segmentation ....................................................... 125
Table B-7 SR 429 Northbound AVI System Segmentation ....................................................... 126
Table B-8 SR 429 Southbound AVI System Segmentation ....................................................... 126
Table B-9 SR 528 Eastbound AVI System Segmentation .......................................................... 127
Table B-10 SR 528 Westbound AVI System Segmentation ...................................................... 127

ix
Table C-1 SR 408 Eastbound MVDS System and Lane Management ....................................... 128
Table C-2 SR 408 Westbound MVDS System and Lane Management ..................................... 129
Table C-3 SR 414 Eastbound MVDS System and Lane Management ....................................... 130
Table C-4 SR 414 Westbound MVDS System and Lane Management ..................................... 130
Table C-5 SR 417 Northbound MVDS System and Lane Management .................................... 131
Table C-6 SR 417 Southbound MVDS System and Lane Management .................................... 132
Table C-7 SR 429 Northbound MVDS System and Lane Management .................................... 133
Table C-8 SR 429 Southbound MVDS System and Lane Management .................................... 134
Table C-9 SR 528 Eastbound MVDS System and Lane Management ....................................... 135
Table C-10 SR 528 Westbound MVDS System and Lane Management ................................... 135
Table D-1 DMS Locations on Expressway System .................................................................... 136
Table Q-1 SR 414 Eastbound Congestion Area ......................................................................... 184
Table Q-2 SR 417 Northbound Congestion Area ....................................................................... 185
Table Q-3 SR 417 Southbound Congestion Area ....................................................................... 188
Table Q-4 SR 528 Eastbound Congestion Area ......................................................................... 189
Table Q-5 SR 528 Westbound Congestion Area ........................................................................ 190
Table S-1 Expressway Crash by Type of Lane in 2012.............................................................. 195
Table S-2 Expressway Crash by Type of Lane in 2013.............................................................. 195
Table S-3 Expressway Crash by Type of Lane in 2014 (Jan – Jun) ........................................... 195
Table T-1 SR 414 Annual Crash Count by Type of Lane .......................................................... 196
Table T-2 SR 417 Annual Crash Count by Type of Lane .......................................................... 197
Table T-3 SR 429 Annual Crash Count by Type of Lane .......................................................... 198
Table T-4 SR 528 Annual Crash Count by Type of Lane .......................................................... 199

x
LIST OF FIGURES Figure 2-1 Expressways under CFX Management (2) ................................................................... 4
Figure 2-2 Deployment of AVI Sensors on Expressway Network ................................................. 7
Figure 2-3 SR 408 Eastbound Capped AVI Data (Aug, 2013)....................................................... 8
Figure 2-4 SR 408 Eastbound Uncapped AVI Data (Aug, 2013)................................................... 9
Figure 2-5 Deployment of MVDS Sensors on Expressway Network .......................................... 10
Figure 2-6 Deployment of DMS on Expressway Network ........................................................... 13
Figure 3-1 Weekday Hourly Volume along SR 408 Eastbound ................................................... 16
Figure 3-2 Spatial-Temporal Hourly Volume Distribution on SR 408 (a) Eastbound and (b)
Westbound .................................................................................................................................... 17
Figure 3-3 SR 408 Eastbound Toll Plaza Cash Lanes Traffic Volume ........................................ 19
Figure 3-4 SR 408 Eastbound Weekday Ramp Traffic Volume .................................................. 20
Figure 3-5 Mainline Weekday Travel Time Index of SR 408 (a) Eastbound and (b) Westbound 23
Figure 3-6 Mainline Weekday Occupancy of SR 408 (a) Eastbound and (b) Westbound ........... 24
Figure 3-7 Mainline Weekday Congestion Index of SR 408 (a) Eastbound and (b) Westbound . 24
Figure 3-8 AVI-based TTI Profile vs MVDS-based Congestion Index Profile ........................... 25
Figure 3-9 MVDS-based Congestion Index and Occupancy ........................................................ 26
Figure 3-10 SR 408 Eastbound System Occupancy and Trend of Congestion ............................ 27
Figure 3-11 SR 408 Eastbound Peak Hour Occupancy and Trend of Congestion ....................... 28
Figure 3-12 SR 408 Eastbound System Congestion Index and Trend of Congestion .................. 29
Figure 3-13 SR 408 Eastbound Peak Hour Congestion Index and Trend of Congestion ............. 29
Figure 3-14 SR 408 Eastbound Ramp Occupancy Profile............................................................ 32
Figure 3-15 SR 408 Eastbound Ramp Congestion Index Profile ................................................. 32
Figure 4-1 SR 408 Eastbound Congestion Segment and Upstream DMS Location..................... 37
Figure 4-2 SR 408 Westbound Congestion Segment 1 and Upstream DMS Location ................ 39
Figure 4-3 SR 408 Westbound Congestion Segment 2 and Suggested DMS Area ...................... 40
Figure 4-4 SR 408 Eastbound Congested Ramp and Upstream DMS Location .......................... 43
Figure 4-5 SR 408 Westbound Congested Ramp 1 and Upstream DMS Location ...................... 44
Figure 4-6 SR 408 Westbound Congested Ramp and Upstream DMS Location ......................... 44
Figure 4-7 SR 429 Southbound Congested Ramp and Upstream DMS Location ........................ 45
Figure 5-1 Domestic States with Responses ................................................................................. 47

xi
Figure 5-2 International Responses (Belgium, Greece, Japan & South Korea) ........................... 47
Figure 5-3 Current Toll Collection Systems ................................................................................. 49
Figure 5-4 Ramp Closing Practices in Case of Total Shut-down ................................................. 50
Figure 5-5 Procedures When Frontage Road is Available............................................................ 51
Figure 5-6 Procedures When No Frontage Road is Available ...................................................... 52
Figure 5-7 Media for Ramp-closure Information ......................................................................... 57
Figure 5-8 Whether Advice Provided Based on Specific Closure Condition ............................... 58
Figure 5-9 Whether Procedure Changes Depending on Other Factors ......................................... 60
Figure 5-10 On-ramp Control Strategy ......................................................................................... 61
Figure 5-11 Current ITS System on Roadways ............................................................................ 62
Figure 6-1 Expressway Network in GIS ....................................................................................... 70
Figure 6-2 Total Crashes of Orange County in 2011 .................................................................... 71
Figure 6-3 Initial Selection of Expressway Crashes in 2011 ........................................................ 72
Figure 6-4 Final Selection of Expressway Crashes in 2011 ......................................................... 73
Figure 6-5 Crash Match on Mainline, Ramp and Toll Plaza Cash Lanes ..................................... 74
Figure 6-6 SR 408 Crash Count by Year ...................................................................................... 75
Figure 6-7 Spatial Pattern of Traffic Crashes by Types of Lane in 2011 ..................................... 84
Figure 6-8 Spatial Pattern of Traffic Crashes by Crash Type in 2011 .......................................... 86
Figure 6-9 Spatial Pattern of Traffic Crashes by Number of Vehicles in 2011 ............................ 87
Figure 6-10 Spatial Pattern of Traffic Crashes by Crash Severity in 2011 .................................. 88
Figure 6-11 Spatial Pattern of Traffic Crashes by Lighting Condition in 2011 ........................... 88
Figure 6-12 Spatial Pattern of Traffic Crashes by Weather Condition in 2011............................ 89
Figure 6-13 Spatial Pattern of Traffic Crashes by Road Surface Condition in 2011 ................... 90
Figure 6-14 Temporal Distribution of Traffic Safety on SR 408 ................................................. 91
Figure 6-15 Spatial-Temporal Distribution of Traffic Crashes in 2011 ....................................... 92
Figure 7-1 Total Crashes Within the Region of SR 417 -- SR 528 Interchange .......................... 93
Figure 7-2 Ramp SR 417 SB -- SR 528 WB ................................................................................ 94
Figure 7-3 Ramp SR 528 EB -- SR 417 NB ................................................................................. 95
Figure 7-4 Ramp SR 417 SB -- SR 528 EB .................................................................................. 95
Figure 7-5 Ramp SR 528 WB -- SR 417 NB ................................................................................ 96
Figure 7-6 Ramp SR 417 NB -- SR 528 WB ................................................................................ 96

xii
Figure 7-7 Crash Time Distribution .............................................................................................. 97
Figure 7-8 Number of Vehicles Involved in Crashes ................................................................... 97
Figure 7-9 Tyregrip HFST System at I-75 Ramp ....................................................................... 101
Figure 7-10 Tyregrip HFST System at I-595 Ramp ................................................................... 102
Figure E-1 Weekday Hourly Volume along SR 408 Westbound ............................................... 137
Figure E-2 Weekday Hourly Volume along SR 414 Eastbound ................................................ 138
Figure E-3 Weekday Hourly Volume along SR 414 Westbound ............................................... 138
Figure E-4 Weekday Hourly Volume along SR 417 Northbound .............................................. 139
Figure E-5 Weekday Hourly Volume along SR 417 Southbound .............................................. 139
Figure E-6 Weekday Hourly Volume along SR 429 Northbound .............................................. 140
Figure E-7 Weekday Hourly Volume along SR 429 Southbound .............................................. 140
Figure E-8 Weekday Hourly Volume along SR 528 Eastbound ................................................ 141
Figure E-9 Weekday Hourly Volume along SR 528 Westbound ............................................... 141
Figure F-1 Spatial-Temporal Hourly Volume Distribution on SR 414 (a) Eastbound and (b)
Westbound .................................................................................................................................. 142
Figure F-2 Spatial-Temporal Hourly Volume Distribution on SR 417 (a) Northbound and (b)
Southbound ................................................................................................................................. 142
Figure F-3 Spatial-Temporal Hourly Volume Distribution on SR 429 (a) Northbound and (b)
Southbound ................................................................................................................................. 143
Figure F-4 Spatial-Temporal Hourly Volume Distribution on SR 528 (a) Eastbound and (b)
Westbound .................................................................................................................................. 143
Figure G-1 SR 408 Westbound Toll Plaza Cash Lanes Traffic Volume .................................... 144
Figure G-2 SR 414 Eastbound Toll Plaza Cash Lanes Traffic Volume ..................................... 145
Figure G-3 SR 414 Westbound Toll Plaza Cash Lanes Traffic Volume .................................... 145
Figure G-4 SR 417 Northbound Toll Plaza Cash Lanes Traffic Volume ................................... 146
Figure G-5 SR 417 Southbound Toll Plaza Cash Lanes Traffic Volume ................................... 146
Figure G-6 SR 429 Northbound Toll Plaza Cash Lanes Traffic Volume ................................... 147
Figure G-7 SR 429 Southbound Toll Plaza Cash Lanes Traffic Volume ................................... 147
Figure G-8 SR 528 Eastbound Toll Plaza Cash Lanes Traffic Volume ..................................... 148
Figure G-9 SR 528 Westbound Toll Plaza Cash Lanes Traffic Volume .................................... 148
Figure H-1 SR 408 Westbound Weekday Ramp Traffic Volume .............................................. 149

xiii
Figure H-2 SR 414 Eastbound Weekday Ramp Traffic Volume ............................................... 150
Figure H-3 SR 414 Westbound Weekday Ramp Traffic Volume .............................................. 150
Figure H-4 SR 417 Northbound Weekday Ramp Traffic Volume ............................................. 151
Figure H-5 SR 417 Southbound Weekday Ramp Traffic Volume ............................................. 151
Figure H-6 SR 429 Northbound Weekday Ramp Traffic Volume ............................................. 152
Figure H-7 SR 429 Southbound Weekday Ramp Traffic Volume ............................................. 152
Figure H-8 SR 528 Eastbound Weekday Ramp Traffic Volume ............................................... 153
Figure H-9 SR 528 Westbound Weekday Ramp Traffic Volume .............................................. 153
Figure I-1 Mainline Weekday Occupancy of SR 414 (a) Eastbound and (b) Westbound .......... 154
Figure I-2 Mainline Weekday Occupancy of SR 417 (a) Northbound and (b) Southbound ...... 154
Figure I-3 Mainline Weekday Occupancy of SR 429 (a) Northbound and (b) Southbound ...... 155
Figure I-4 Mainline Weekday Occupancy of SR 528 (a) Eastbound and (b) Westbound .......... 155
Figure J-1 Mainline Weekday Congestion Index of SR 414 (a) Eastbound and (b) Westbound 156
Figure J-2 Mainline Weekday Congestion Index of SR 417 (a) Northbound and (b) Southbound
..................................................................................................................................................... 156
Figure J-3 Mainline Weekday Congestion Index of SR 429 (a) Northbound and (b) Southbound
..................................................................................................................................................... 157
Figure J-4 Mainline Weekday Congestion Index of SR 528 (a) Eastbound and (b) Westbound 157
Figure K-1 SR 408 Westbound System Occupancy and Trend of Congestion .......................... 158
Figure K-2 SR 414 Eastbound System Occupancy and Trend of Congestion ........................... 159
Figure K-3 SR 414 Westbound System Occupancy and Trend of Congestion .......................... 159
Figure K-4 SR 417 Northbound System Occupancy and Trend of Congestion ......................... 160
Figure K-5 SR 417 Southbound System Occupancy and Trend of Congestion ......................... 160
Figure K-6 SR 429 Northbound System Occupancy and Trend of Congestion ......................... 161
Figure K-7 SR 429 Southbound System Occupancy and Trend of Congestion ......................... 161
Figure K-8 SR 528 Eastbound System Occupancy and Trend of Congestion ........................... 162
Figure K-9 SR 528 Westbound System Occupancy and Trend of Congestion .......................... 162
Figure L-1 SR 408 Westbound Peak Hour Occupancy and Trend of Congestion ..................... 163
Figure L-2 SR 417 Northbound Peak Hour Occupancy and Trend of Congestion .................... 164
Figure L-3 SR 417 Southbound Peak Hour Occupancy and Trend of Congestion .................... 164
Figure L-4 SR 528 Eastbound Peak Hour Occupancy and Trend of Congestion ....................... 165

xiv
Figure L-5 SR 528 Westbound Peak Hour Occupancy and Trend of Congestion ..................... 165
Figure M-1 SR 408 Westbound System Congestion Index and Trend of Congestion ............... 166
Figure M-2 SR 414 Eastbound System Congestion Index and Trend of Congestion ................ 167
Figure M-3 SR 414 Westbound System Congestion Index and Trend of Congestion ............... 167
Figure M-4 SR 417 Northbound System Congestion Index and Trend of Congestion .............. 168
Figure M-5 SR 417 Southbound System Congestion Index and Trend of Congestion .............. 168
Figure M-6 SR 429 Northbound System Congestion Index and Trend of Congestion .............. 169
Figure M-7 SR 429 Southbound System Congestion Index and Trend of Congestion .............. 169
Figure M-8 SR 528 Eastbound System Congestion Index and Trend of Congestion ................ 170
Figure M-9 SR 528 Westbound System Congestion Index and Trend of Congestion ............... 170
Figure N-1 SR 408 Westbound Peak Hour Congestion Index and Trend of Congestion........... 171
Figure N-2 SR 417 Northbound Peak Hour Congestion Index and Trend of Congestion ......... 172
Figure N-3 SR 417 Southbound Peak Hour Congestion Index and Trend of Congestion ......... 172
Figure N-4 SR 528 EB Peak Hour Congestion Index and Trend of Congestion ........................ 173
Figure N-5 SR 528 WB Peak Hour Congestion Index and Trend of Congestion ...................... 173
Figure O-1 SR 408 WB Ramp Occupancy Profile ..................................................................... 174
Figure O-2 SR 414 EB Ramp Occupancy Profile ...................................................................... 175
Figure O-3 SR 414 WB Ramp Occupancy Profile ..................................................................... 175
Figure O-4 SR 417 NB Ramp Occupancy Profile ...................................................................... 176
Figure O-5 SR417 SB Ramp Occupancy Profile ........................................................................ 176
Figure O-6 SR 429 NB Ramp Occupancy Profile ...................................................................... 177
Figure O-7 SR 429 SB Ramp Occupancy Profile ....................................................................... 177
Figure O-8 SR 528 EB Ramp Occupancy Profile ...................................................................... 178
Figure O-9 SR 528 WB Ramp Occupancy Profile ..................................................................... 178
Figure P-1 SR 408 Westbound Ramp Congestion Index Profile ................................................ 179
Figure P-2 SR 414 Eastbound Ramp Congestion Index Profile ................................................. 180
Figure P-3 SR 414 Westbound Ramp Congestion Index Profile ................................................ 180
Figure P-4 SR 417 Northbound Ramp Congestion Index Profile .............................................. 181
Figure P-5 SR 417 Southbound Ramp Congestion Index Profile .............................................. 181
Figure P-6 SR 429 Northbound Ramp Congestion Index Profile .............................................. 182
Figure P-7 SR 429 Southbound Ramp Congestion Index Profile .............................................. 182

xv
Figure P-8 SR 528 Eastbound Ramp Congestion Index Profile ................................................. 183
Figure P-9 SR 528 Westbound Ramp Congestion Index Profile ................................................ 183
Figure Q-1 SR 414 Eastbound Congested Location and Suggested DMS Area ........................ 184
Figure Q-2 SR 417 Northbound Congested Segment and DMS Location ................................. 186
Figure Q-3 SR 417 Northbound Congested Location and Suggested DMS Area ...................... 187
Figure Q-4 SR 417 Southbound Congested Location and Suggested DMS Area ...................... 188
Figure Q-5 SR 528 Eastbound Congested Segment and DMS Location.................................... 189
Figure Q-6 SR 528 Westbound Congested Segment and Suggested DMS Area ....................... 190
Figure R-1 Florida’s Turnpike Rollover Scene (Lane Blocking) Cone Setup............................ 192
Figure R-2 Heavy Yellow/Black Chain and Free-standing Pole ................................................ 193
Figure R-3 Chain and Safety Barrier .......................................................................................... 193
Figure R-4 “Entrance Closed” Sign ............................................................................................ 194
Figure T-1 SR 414 Crash Count by Year.................................................................................... 196
Figure T-2 SR 417 SR 414 Crash Count by Year ....................................................................... 197
Figure T-3 SR 429 SR 414 Crash Count by Year ....................................................................... 198
Figure T-4 SR 528 SR 414 Crash Count by Year ....................................................................... 199
Figure U-1 Spatial Pattern of Traffic Crashes by Types of Lane in 2012 .................................. 200
Figure U-2 Spatial Pattern of Traffic Crashes by Types of Lane in 2013 .................................. 201
Figure U-3 Spatial Pattern of Traffic Crashes by Types of Lane in 2014 (Jan -- Jun) ............... 202
Figure U-4 Spatial Pattern of Traffic Crashes by Crash Type in 2012 ....................................... 203
Figure U-5 Spatial Pattern of Traffic Crashes by Crash Type in 2013 ....................................... 204
Figure U-6 Spatial Pattern of Traffic Crashes by Crash Type in 2014 (Jan – Jun) .................... 205
Figure U-7 Spatial Pattern of Traffic Crashes by Number of Vehicles in 2012 ......................... 206
Figure U-8 Spatial Pattern of Traffic Crashes by Number of Vehicles in 2013 ......................... 207
Figure U-9 Spatial Pattern of Traffic Crashes by Number of Vehicles in 2014 (Jan – Jun) ...... 208
Figure U-10 Spatial Pattern of Traffic Crashes by Crash Severity in 2012 ................................ 209
Figure U-11 Spatial Pattern of Traffic Crashes by Crash Severity in 2013 ................................ 209
Figure U-12 Spatial Pattern of Traffic Crashes by Crash Severity in 2014 (Jan -- Jun) ............ 209
Figure U-13 Spatial Pattern of Traffic Crashes by Lighting Condition in 2012 ........................ 210
Figure U-14 Spatial Pattern of Traffic Crashes by Lighting Condition in 2013 ........................ 211
Figure U-15 Spatial Pattern of Traffic Crashes by Lighting Condition in 2014 (Jan – Jun) ...... 212
xvi
Figure U-16 Spatial Pattern of Traffic Crashes by Weather Condition in 2012 ......................... 213
Figure U-17 Spatial Pattern of Traffic Crashes by Weather Condition in 2013 ......................... 214
Figure U-18 Spatial Pattern of Traffic Crashes by Weather Condition in 2014 (Jan -- Jun) ..... 215
Figure U-19 Spatial Pattern of Traffic Crashes by Road Surface Condition in 2012 ................. 216
Figure U-20 Spatial Pattern of Traffic Crashes by Road Surface Condition in 2013 ................. 216
Figure U-21 Spatial Pattern of Traffic Crashes by Road Surface Condition in 2014 (Jan -- Jun)
..................................................................................................................................................... 217
Figure V-1 Temporal Distribution of Traffic Safety on SR 414 ................................................ 218
Figure V-2 Temporal Distribution of Traffic Safety on SR 417 ................................................ 219
Figure V-3 Temporal Distribution of Traffic Safety on SR 429 ................................................ 219
Figure V-4 Temporal Distribution of Traffic Safety on SR 528 ................................................ 220
Figure V-5 Spatial-Temporal Distribution of Traffic Crashes in 2012 ...................................... 221
Figure V-6 Spatial-Temporal Distribution of Traffic Crashes in 2013 ...................................... 222
Figure V-7 Spatial-Temporal Distribution of Traffic Crashes in 2014 (Jan -- Jun) ................... 223

xvii
LIST OF ACRONYMS ATIS -- Advanced Traveler Information System
AVI -- Automatic Vehicle Identification
Caltrans -- California Department of Transportation
CFX -- Central Florida Expressway Authority
CI -- Congestion Index
DelDOT -- Delaware Department of Transportation
DMB -- Digital Multimedia Broadcasting
DMS -- Dynamic Message Signs
DUI -- Driving Under the Influence
ETC -- Electronic Toll Collection
FDOT -- Florida Department of Transportation
FHWA -- Federal Highway Administration
FITM -- Freeway Incident Traffic Management
GIS -- Geographic Information
HFST -- High friction surface treatment
HOT -- High Occupancy Lane
ICS -- Incident Command System
ITS -- Intelligent Transportation System
KEC -- Korean Expressway Corporation
LCS -- Lane Control System
M&E -- Monitoring and Evaluation
MDTA -- Maryland Transportation Authority
MDXWay -- Miami-Dade Expressway Authority
MP -- Milepost
MVDS -- Microwave Vehicle Detection System
MnDOT -- Minnesota Department of Transportation
MOT -- Maintenance of Traffic
MUTCD -- Manual on Uniform Traffic Control Devices
MVMT -- Million Vehicle Miles Traveled
NH Turnpike Bureau -- New Hampshire Department of Transportation Bureau of Turnpikes

xviii
ORT -- Open Road Tolling
PDO --Property Damage Only
PRT -- Perception-Response Time
PSV -- Polished Stone Value
RCI -- Road Characteristics Inventory
RISC -- Rapid Incident Scene Clearance
RTMS -- Remote Traffic Management Sensors
MVDS -- Microwave Vehicle Detector Sensor
SOP -- Standard Operating Procedure
STARR -- Specialty Towing and Roadside Repair
TMC -- Traffic Management Center
TTI -- Travel Time Index
UCF -- University of Central Florida
WV Parkways Authority -- West Virginia Parkways Authority

1
1 INTRODUCTION
1.1 Overview Traffic detection technology is the main spine of any Intelligent Transportation System (ITS);
there are a wide range of vehicle detection devices in use than ever before on freeways and
expressways, starting from the popular inductive loops and magnetometers to video and radar-
based detectors. The Central Florida Expressway Authority (CFX) System utilizes Automatic
Vehicle Identification (AVI) system for Electronic Toll Collection (ETC) as well as for the
provision of real time information to motorists within the Advanced Traveler Information
System (ATIS). Recently CFX also introduced Microwave Vehicle Detection System (MVDS)
for more precise traffic detection. These ITS systems can provide services include but not limited
to fleet management systems, emergency response services, congestion pricing, pay-as-you-drive
insurance services and navigation capabilities. Efficient use of the traffic data from these systems
is therefore essential to fulfill the services above.
Despite that the detection technologies for each traffic detection system can be distinct,
they share several common features. These systems monitor the traffic flow continuously and
archive the traffic data on short time interval (e.g., 30 seconds, 1 minute). In addition, they are
often installed with relatively short spacing on the managed freeways and expressways especially
in urban areas. Thus they have the advantage of reflecting the traffic states along the roadways in
real-time. The availability of real-time traffic data has transformed the outlook of numerous
aspects of traffic operation and safety, both in research and practice. They allow operators to
evaluate the traffic conditions at extremely microscopic level (i.e., specific locations at specific
time). Researchers use the data to restore traffic conditions prior to individual crashes and
summarize the common patterns leading to unsafe traffic conditions. As a result, proactive traffic
management strategies can be developed to improve overall performance of roadway networks.
To realize the envisioned improvement, the authority needs a medium to communicate with
motorists on their system. Dynamic Message Signs (DMS) serve as an ideal tool since they can
convey the required message to drivers in a timely manner. Nevertheless, only proper
emplacement of them ensures their effectiveness.

2
The main objective of this research study is to identify potential applications of the
current ITS infrastructure on CFX’s system. The applications are focused on real-time traffic
operation (congestion) and safety evaluation and improvement. The applications depend on
efficient use of the AVI, MVDS and DMS systems. Consequently, the viability of using the AVI
and MVDS for high quality data and DMS for timely warning will be investigated carefully.
Expected contributions from this study are guidelines to adapt the existing ITS systems in the
context of a proactive traffic management strategy.
1.2 Objectives There are 4 general objectives of this research for the short and long terms. The research will try
to answer the questions raised in each objective:
1. How well do the current ITS systems on CFX’s expressways perform? How can the
authority achieve more effective use of the data from these systems?
2. Based on the ITS infrastructure, how to evaluate the current operational performance of
expressways? How can CFX improve their DMS deployment?
3. How are the current traffic safety conditions on the expressways? How can the ITS
systems help operators improve their understanding about the safety on their system?
How to achieve a safer expressway system through more proactive management?
4. What potential applications can CFX do to improve their ITS applications in future?
To achieve these objectives, several tasks have been conducted at different phases of the
project and are described in the following report.
1.3 Research Organization The organization of this report is as follows: following this chapter, the efforts related to the data
collection are summarized in Chapter 2. This chapter covers an overview of the expressway
system managed by CFX, the current deployment of ITS systems and detailed description about
different types of data to be used in the report. Chapter 3 to Chapter 5 are about traffic operation
on CFX’s system. Chapter 3 focuses on overall traffic conditions on the expressways and
congestion evaluation. Chapter 4 discusses the use of DMS in congestion management. Chapter
5 offers insights about another perspective in traffic operation, which is ramp closure practice in
case of total shut-down on the mainline. Chapter 6 to Chapter 7 give a comprehensive analysis
about the traffic safety on the expressways. Chapter 6 offers comprehensive analysis of

3
expressway safety conditions and their trends. Chapter 7 is a case study about the traffic safety of
an interchange on the expressway system especially asked by CFX. Chapter 8 summarizes the
findings in the previous chapters and raises a real-time traffic management strategy intended for
operation and safety improvement. Chapter 9 sheds some light on potential ITS implementation
for the CFX system in future regarding micro-simulation and travel time estimation.

4
2 DATA PREPARATION
2.1 Expressway System Overview The Central Florida Expressway Authority (CFX) operates and maintains the region’s 109-miles
of expressway networks as shown in Figure 2-1 (1). Currently, there are five toll roads under or
partly under the management of CFX. Although future extensions have been planned, this
project only focuses on existing CFX system. The five expressways connect Orlando and
neighboring areas, serving both residents and visitors.
Figure 2-1 Expressways under CFX Management (2)
According to CFX, State Road 408 (Spessard L. Holland East-West Expressway) is the
backbone of the Expressway Authority’s 109-mile network. Except for the westernmost mile, the

5
expressway is owned and operated by CFX. An estimated 125,000 - 135,000 vehicles a day
travel the 21-mile expressway through downtown Orlando. Land uses along the expressway
include residential, commercial and services, transportation (airport), academic institutions (3).
State Road 414 (John Land Apopka Expressway) is a 9-mile east-west corridor and is
relatively new in the system. It improves access to SR 429 which is another expressway in CFX
system, Interstate 4 and many local roads in the greater Apopka area (4).
A segment of 33 miles of the State Road 417 located in Orange County is under CFX
management. This segment is also known as the GreeneWay. It provides the suburban areas near
Orlando with convenient access if motorists need to travel between Sanford, Oviedo, the
University of Central Florida, East Orlando or Kissimmee. SR 417 was the first in the system to
have all mainline toll plazas converted to Express Lanes, which keep traffic moving by allowing
customers to pay tolls at the posted highway speed (5).
State Road 429 (Daniel Webster Western Beltway) was developed in partnership between
the Expressway Authority and the Florida’s Turnpike Enterprise. CFX operates 23 miles of the
expressway. The function of the SR 429 is to provide West Orange and Osceola counties with an
alternate north-south route to Interstate 4 (6).
State Road 528 (Martin B. Andersen Beachline Expressway) provides a crucial
connection for residents and tourists between the attractions area, the Orlando International
Airport and the East Coast beaches and Cape Canaveral. The Expressway Authority operates the
23 miles of the expressway (7).
For a thorough evaluation of current operation and safety performance of the network,
comprehensive efforts have been made to collect data from different sources. Traffic data from
two different detection systems, DMS message information, roadway geometric characteristics
data, and crash data have been collected.
2.2 Traffic Detection Systems on the Expressways When CFX converted mainline toll plazas to open tolling express lanes, they adopted the
Automatic Vehicle Identification (AVI) system for Electronic Toll Collection (ETC). If vehicles
traveling on CFX’s expressways are equipped with E-PASS or SunPass, they don’t have to stop

6
to pay the tolls. The AVI detectors will keep records of the vehicle information and calculate the
tolls according to the distance that the vehicles traveled. Although AVI detectors can archive
traffic information, they are not designed for this objective. Since 2012, CFX has introduced
Microwave Vehicle Detection System (MVDS) to their expressway network. These detectors are
specifically installed for traffic monitoring. The two systems exhibit substantial difference
between them, however, both of them could be leveraged to provide traffic professionals with
valuable traffic information. In this study, both data were collected based on their availability.
2.2.1 AVI Traffic Data AVI detectors are installed at toll plazas for Electronic Toll Collection (ETC) and at other
locations for travel time estimation. The deployment of AVI system since 2005 and system
updates afterwards were provided by CFX. The AVI traffic data were collected from September
2012 to July 2014. Table A-1 to A-10 in Appendix A show the active AVI sensors in each month
during the study time period. Then the traveling speed for a segment can be calculated. The
segmentation of expressways based on the AVI sensors is shown in Appendix B. Table 2-1
summarizes the number of AVI segments per direction and basic statistics on each of the five
expressways.
Table 2-1 AVI Segments on CFX Expressway System
Route ID Direction No. of Segments
Segment Length Mean Std Dev Min Max
SR 408 EB 23 0.926 0.479 0.290 1.853 WB 23 0.977 0.524 0.332 2.287
SR 414 EB 3 1.529 0.555 0.928 2.022 WB 4 2.445 2.948 0.350 6.811
SR 417 NB 16 1.959 0.829 0.751 3.848 SB 20 1.567 0.770 0.378 3.098
SR 429 NB 10 1.895 1.220 0.704 4.271 SB 9 2.136 1.534 0.614 4.536
SR 528 EB 8 2.740 2.25149 0.329 7.058 WB 9 2.578 2.129 0.861 7.597
Figure 2-2 illustrates the deployment of AVI sensors on the expressway network. SR 408
has the smallest AVI segment length of the five expressways. SR 528 has relatively short AVI
segments near the international airport and west to SR 417. However, on the suburban segments

7
leading to the coast area, the distance of adjacent AVI sensors could be above 7 miles. The
distance of adjacent AVI tag readers are determined on two basic criteria: 1) the need for toll
collection; 2) the need for travel time estimation. In urban areas, the accessibility of the
expressway has to accommodate the travelers’ demand of entering and exiting the expressways.
This makes the toll collection for a relatively short spacing necessary on SR 408.
Figure 2-2 Deployment of AVI Sensors on Expressway Network
Traffic data generated from the AVI system can be categorized in two types, one is the
more traditional capped AVI data and the other is the uncapped AVI data collected since the

8
beginning of the project. The capped AVI data contain space mean speed information for each
detection segment on one minute interval basis. The speed is capped at speed limit. Therefore,
the AVI data during this time period are referred to as capped AVI data. While providing traffic
information in real-time, the capped AVI data is not able to reflect the real situation as shown in
Figure 2-3.
Figure 2-3 SR 408 Eastbound Capped AVI Data (Aug, 2013)
Since September 2012, CFX and Atkins have archived the raw readings by the AVI
detectors. The raw readings contain the encrypted vehicle ID information and the timestamps of
detection at each AVI detector location. Based on the information, the speed of individual
vehicles can be derived using equation (1).
speed = �milepostupstream−milepostdownstream�timestampdownstream−timestampupstream
(1)
Consequently, traffic information from the raw readings is referred to as the uncapped
AVI data. Compared with capped AVI data, the uncapped data is not trimmed at speed limit,
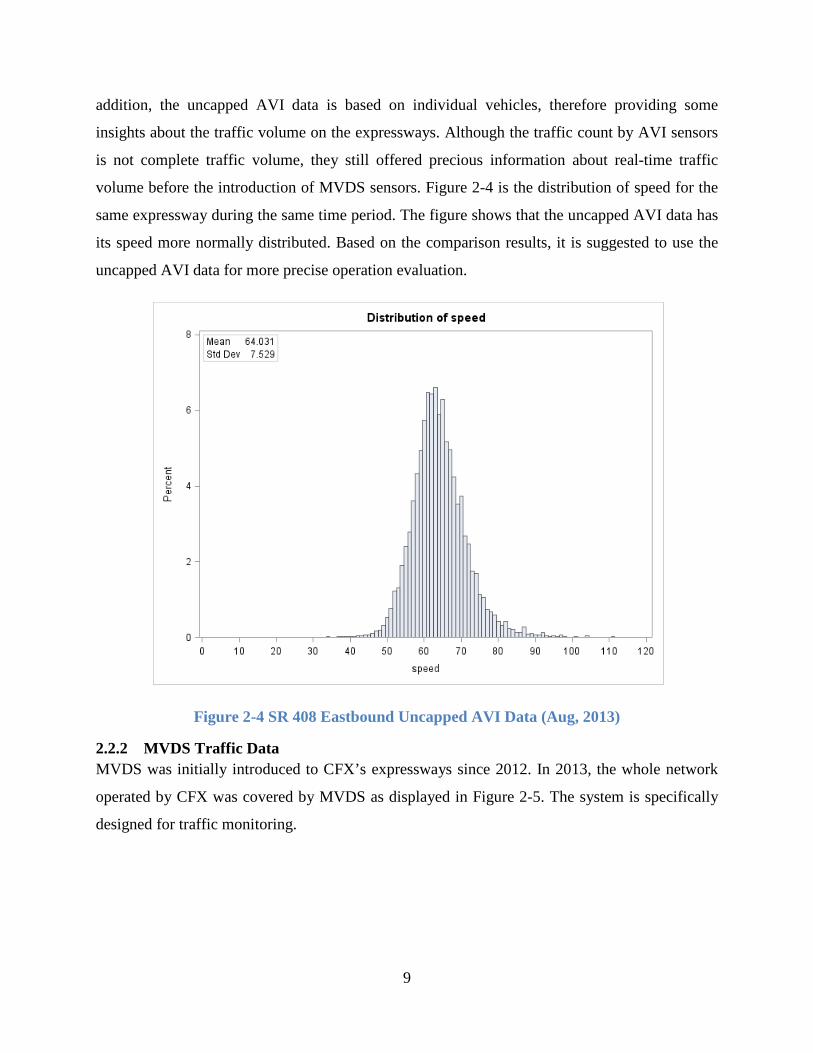
thus reflecting the speed of the segment at a specific time closer to the real traffic condition. In
9
addition, the uncapped AVI data is based on individual vehicles, therefore providing some
insights about the traffic volume on the expressways. Although the traffic count by AVI sensors
is not complete traffic volume, they still offered precious information about real-time traffic
volume before the introduction of MVDS sensors. Figure 2-4 is the distribution of speed for the
same expressway during the same time period. The figure shows that the uncapped AVI data has
its speed more normally distributed. Based on the comparison results, it is suggested to use the
uncapped AVI data for more precise operation evaluation.
Figure 2-4 SR 408 Eastbound Uncapped AVI Data (Aug, 2013)
2.2.2 MVDS Traffic Data MVDS was initially introduced to CFX’s expressways since 2012. In 2013, the whole network
operated by CFX was covered by MVDS as displayed in Figure 2-5. The system is specifically
designed for traffic monitoring.

10
Figure 2-5 Deployment of MVDS Sensors on Expressway Network
For the purpose of this project, MVDS data have been collected since July, 2013. MVDS
does not identify individual vehicles. They return aggregated traffic flow parameters for each
lane of the cross-section where the MVDS detector is installed at one minute interval basis. The
traffic parameters include traffic volume, time mean speed, lane occupancy and traffic volume
by vehicle length. Four types of vehicles were defined by their lengths:
• Type 1: vehicles 0 to 10 feet in length • Type 2: vehicles 10 to 24 feet in length • Type 3: vehicles 24 to 54 feet in length

11
• Type 4: vehicles over 54 feet in length
Additional information from MVDS traffic data includes the timestamp when the sensor
is polled. It has been mentioned above that the sensors are polled every one minute. Also, unique
sensor identifier and lane identifier are contained within the data. The sensor identifier consists
of the roadway (i.e., SR 408, SR414, SR 417, SR 429 and SR 528), milepost and direction. The
lanes are counted from the roadway medium to the outside lane. The lanes fall into four
categories, which are Mainline, Ramp, Mainline TP Express and Mainline TP Cash. Mainline TP
Expressway indicates express lanes at mainline toll plazas; vehicles equipped with tags do not
need to slow down on these lanes when they pass the toll plazas. Mainline TP Cash means toll
booth at mainline toll plazas; vehicles need to stop and pay tolls. On the expressways, these two
types of lanes are physically separated. The types of lanes and number of lanes at each MVDS
detection location can be seen in Appendix C.
Compared with the AVI traffic data, MVDS data reflect the traffic states at their installed
locations instead of a segment. They also have several advantages over AVI data. The first is the
scale of MVDS system. As shown in Table 2-2, the MVDS sensors significantly outnumber the
AVI sensors and average distance between adjacent detectors of MVDS is much smaller than
that of the AVI system. The higher deployment density means traffic information from more
locations is gathered and more detailed knowledge about the expressway system is available. The
second advantage is traffic data for different types of lanes from MVDS system. Given that
MVDS sensors monitor traffic conditions on each traveling lane, traffic data at toll plazas and on
ramps can be collected. AVI data only provide traffic information of a cross-section on the
mainline. However, to have a general understanding about the expressway performance, analysis
of toll plazas and ramps are necessary as well. The third advantage is the richness of traffic
information from MVDS data. Capped AVI data only has capped speed information which does
not reflect real-world traffic conditions while uncapped AVI data has more realistic speed data
and part of the traffic volume information. The traffic count from uncapped AVI data is not the
complete traffic volume. MVDS data include speed, complete traffic volume, and lane
occupancy as a surrogate measure of traffic density and the volume by vehicle lengths.

12
Table 2-2 MVDS on CFX Expressway System
Route Length (mi) Direction
MVDS Detectors
Total
Mainline (including
TP Express)
TP Cash Ramp
Distance between adjacent detectors
Mean Std Dev Min Max
SR 408 21.4 EB 57 55 8 39 0.38 0.18 0.1 1 WB 56 55 8 39 0.39 0.18 0.1 1
SR 414 9.5 EB 14 14 2 8 0.44 0.17 0.2 0.7 WB 13 12 2 7 0.46 0.23 0.1 0.9
SR 417 31.5 NB 56 55 7 31 0.58 0.28 0.2 1.3 SB 56 55 7 32 0.58 0.28 0.2 1.2
SR 429 22 NB 29 28 4 17 0.68 0.54 0.2 2.8 SB 29 27 4 16 0.68 0.59 0.1 3.1
SR 528 22.4 EB 29 26 4 19 0.84 0.79 0.1 3 WB 29 29 4 18 0.84 0.82 0.1 3.1
In conclusion, MVDS on CFX expressway network is more suitable for traffic
monitoring. Nevertheless, AVI data will also be used in the report. It is expected that by using
the two types of traffic data, better understanding about the expressways will be reached.
2.3 DMS Systems on Expressways CFX installed numerous Dynamic Message Signs (DMS) on their expressways. The DMS are
electronic signs on roadways to give motorists real-time information. As shown in Figure 2-6
and Table D-1 in Appendix D, in total 37 DMS are currently in use on CFX expressways and 35
of them are located on the five expressways involved in this study. The other two DMS are
located on SR 451 and SR 520, respectively. The DMS data from September 2012 to September
2013 were collected. The DMS data record the DMS identifier information, the messages
displayed on the boards, and the displayed time and duration of each message. SR 408 and SR
417 have the most DMS on the mainline according to Table 2-3. And SR 414, SR 429 and SR
528 have relatively fewer DMS installed. The differences are mainly affected by the traffic
demand and the length of the segment. SR 408 has the highest traffic load among the five
expressways. SR 417 on the other hand is the longest expressway in the system. However, the
average distance between DMS on SR 408 is much smaller than the other roadways.

13
Figure 2-6 Deployment of DMS on Expressway Network
Table 2-3 DMS on CFX Expressway System
Route Direction Total Number On Mainline Average Distance between DMS (mi) On Ramp
SR 408 EB 7 6 3.84 1 WB 5 5 3.925 0
SR 414 EB 0 0 -- 0 WB 1 1 -- 0
SR 417 NB 5 5 6.725 0 SB 6 6 5.94 0
SR 429 NB 3 3 6.6 0 SB 2 2 4.3 0
SR 528 EB 3 3 7.3 0 WB 3 3 8.85 0

14
DMS is used to convey the messages from traffic operators to motorists on road.
According to the messages displayed on the DMS board in the one year period, several types of
messages could be summarized. Typical messages include:
• travel time estimation message (the most common type) • alert message: silver alert, child abduction, LEO alert, traffic alert • law enforcement message: safety belt use, moving over for emergency vehicle • adverse weather warning message: fog, smoke, brush fire, low visibility • congestion warning message: congestion, heavy congestion, expected congestion • lane close/open message: lane block, all lanes block, ramp close, ramp open, planned
close/open of lanes/ramps • unexpected events warning message: incident, crash, debris, disabled vehicle • planned events message • road work warning message: construction, road work, planned road work, work zone,
rolling road block
Among the listed types of messages above, several types of messages are not expected to
alter motorists’ behaviors, such as messages related to travel time estimation, alert, law
enforcement and planned events. Other messages are displayed to heightened travelers’
awareness of the traffic conditions, weather, incidents, etc. These types of messages are expected
to reduce risks on the expressways and improve the traffic flow. Besides these commonly
displayed messages, blank signs are also observed during the study period. In other cases signs
under test will show "TEST" message. The DMS data will be used to evaluate current adequacy
of DMS.
2.4 Road Geometric Characteristics Data for Expressways Roadway geometry has been verified in previous research (8-16) to have significant impact on
traffic operation and safety. In this project, we first collected the geometric characteristics data in
2012 and updated the data in 2013. Florida Department of Transportation (FDOT) maintained
the Road Characteristics Inventory (RCI) database that has the complete roadway geometry and
other relevant information. The RCI database has hundreds of variables. Only the most relevant
variables were chosen for the data preparation. In sum 14 variables have been selected, including
pavement condition, number of lanes, auxiliary lane type, shoulder type and width, median type
and width, inside shoulder type and width, horizontal degree of curvature, speed limit, section
AADT, D factor, K factor and truck percentage. The expressways are divided into homogeneous

15
segments. If one of the geometric characteristics variables changes, a new segment will be
generated. For the convenience of study, the smallest segment length is specified to be 0.1 mile.
Segments smaller than 0.1 mile will be combined with adjacent segment which shares higher
geometric similarity.
2.5 Crash Data on Expressways In Florida, crashes are recorded in two formats of crash reports, namely the short form and long
form. Long form crash reports are designed to keep records of more severe crashes, especially
those involving injuries or fatalities. Short form crashes are mostly used for property damage
only crashes. Two databases served as the crash data source. One is FDOT Crash Analysis
Reporting (CAR) system and the other is Signal 4 Analytics (S4A) system. CAR database has
longer history. However, they only archive the long form crashes. In contrast, S4A is newly
developed and has both short and long form crashes. The issue with S4A database is that for the
crashes occurred in early years (e.g., early 2000s), the short form crashes were not complete.
After June 2012, S4A has the complete crash data from both types of reports for whole Florida.
This current project covers two-year period since September 2012, thus having no problem with
the crash data. For insurance, the research team still made a comparison between the CAR and
S4A system using crash data from July 2012 to December 2013. All crashes recorded to occur on
the expressways from CAR system were extracted as shown in Table 2-4. It should be noted that
the crashes happening on the expressways are not necessarily on the segments operated by CFX.
The number of crashes for each roadway that can be matched in S4A system was also retrieved.
The results confirmed that S4A can replace CAR database in our research. As a result, in the
safety analysis, the crash data were collected from S4A system.
Table 2-4 Crash in CAR and S4A
Expressways Crash Count in CAR Crash Matched in S4A
SR 408 731 730 SR 414 270 264 SR 417 401 401 SR 429 110 110 SR 528 592 590

16
3 TRAFFIC OPERATION EVALUATION
3.1 Overview As stated in the system overview in section 2.1, the five expressways are located in Central
Florida area. SR 408, SR 528 and SR 414 travel along east-west direction; SR 417 and SR 429
travel along north-south direction. SR 408 carries the most traffic in the expressway system,
especially commuting traffic. By taking the merit of MVDS traffic data, traffic operation on the
expressways can be examined at more microscopic level. MVDS data from July, 2014 was
selected to represent the most recent traffic operation states on the expressways. As illustrated in
Figure 3-1 and Appendix E, the spatial-temporal characteristics of hourly traffic volume on
mainline could be easily captured.
Figure 3-1 Weekday Hourly Volume along SR 408 Eastbound
For SR 408, Eastbound experiences significant high demand during evening rush hours
while the traffic reaches its peak on Westbound during morning rush hours. With the contour
plots in Figure 3-2 and in Appendix F, the pattern can be interpreted more clearly. Hourly traffic
volume on SR 408 during peak hours can rise to about 7000 vehicles. The high demand exists
around 6:00 to 9:00 AM in the morning and 16:00 to 19:00 PM in the afternoon. The segments

17
that experience the high volume extend from around Milepost (MP) 11 to MP 17. For other
segments and other time period, it can be seen that the traffic volumes are relatively stable and
mostly below 3000 vehicles per hour. This preliminary review of SR 408 suggests when and
where the congestion is likely to occur. Future congestion evaluation should focus on these
segments during peak hours. By viewing the traffic demand at both spatial and temporal
dimension, it has also been confirmed about how dynamic the traffic flow can be. Use of ITS
traffic detection data enables operators and researchers to have precise and detailed knowledge
about the performance of their roadways.
(a) (b)
Figure 3-2 Spatial-Temporal Hourly Volume Distribution on SR 408 (a) Eastbound and (b) Westbound
SR 414 has relatively low hourly volume even during the morning (for Eastbound) and
evening (for Westbound) peak hours. In non-peak hours, the hourly volume is generally below
600 vehicles per hour. During peak hours, there will be moderate increase in traffic volume.
However, the peak hour traffic volume on SR 414 is still below 2000 vehicles per hour, which is
similar to non-peak hourly volume on SR 408. Moreover, since SR 414 has the shortest segment
length of the five expressways, traffic increases on the whole roadway segment during the peak
hours.
SR 417 shows the similar pattern during the peak hours. Nevertheless, from around MP 7
to MP 27, on the 20-mile segment, hourly traffic volume only increases mildly in the morning
and evening peak hours. In contrast, from MP27 to MP 37, the hourly volume is significantly

18
higher during the same time period. Especially for Northbound, hourly traffic can reach to about
5000 vehicles per hour around 17:00 PM.
SR 429 Northbound experiences mild traffic increase in the evening and Southbound in
the morning. Peak hour volume is relatively low compared with SR 408, SR 417 and SR 528.
SR 528 accommodates most of its peak hour traffic on the segment from MP 8 to MP 13.
Evening peak hours exert on SR 528 Eastbound while morning peak hours appear on Westbound.
During peak hours, the hourly traffic volume can reach to 4000 vehicles per hour.
Synthesizing the mainline operation on the five expressways, it can be seen that SR 408
and SR 528 share similar traffic pattern and SR 417 and SR 429 share the similar traffic pattern.
Considering the expressway locations in Figure 2-1, it can be seen that in the morning, traveling
directions that experience higher demand is towards downtown Orlando while in the evening the
direction is opposite. This pattern is straightforward considering the function of downtown area
and should be taken into account for further analysis.
Table 3-1 Expressway System Operation Overview
Traveling Direction Expressway Direction of
Morning Peak Hour
Segments with High Hourly
Volume
Direction of Evening Peak Hour
Segments with High Hourly
volume EB – WB SR 408 WB MP 11 -- MP 17 EB MP 11 -- MP 17 EB -- WB SR 528 WB MP 09 -- MP 13 EB MP 09 -- MP 13 EB -- WB SR 414 EB MP 04 -- MP 09 WB MP 04 -- MP 09 NB -- SB SR 417 SB MP 27 -- MP 37 NB MP 27-- MP 37 NB -- SB SR 429 SB MP 24-- MP 30 NB MP 24 -- MP 30
Besides mainline traffic conditions, toll plaza cash lanes and ramps were also examined.
In most cases, one MVDS sensor will be installed at the beginning of the toll plaza and another
one will be installed at the end. Figure 3-3 and figures in Appendix G show the traffic on the
cash lanes at the toll plazas on each expressway. It was found that on the five expressways, if the
toll plaza is located on the segments with high hourly volume as listed in Table 3-1, the cash
lanes are much likely to have daily volume on weekend higher than that on weekdays. On other
segments, either the daily volumes on weekday and weekend for the cash lanes are similar to
each other or the weekday has relatively higher daily traffic volume. These patterns might be
explained by the land use property of the nearby area. If the segment is located near office,

19
commercial or business area, then on weekdays the most users are expected to be frequent users
who will use the express lanes and on weekend there might be more users who only occasionally
use the expressways. If the segment is near residential area, fewer trips are expected on weekend
than on weekdays.
Figure 3-3 SR 408 Eastbound Toll Plaza Cash Lanes Traffic Volume
As shown in Figure 3-4 and in Appendix H, if a ramp is on-ramp, then its volume will be
represented as a positive value. If a ramp is off-ramp, the volume will be negative indicating the
traffic leaves the expressway system. SR 408 has several ramps with daily volume above 25000
vehicles per day on weekdays. On other expressways, high volume on ramps usually ranges from
10000 to 20000 vehicles per day. Considering the milepost of the ramps with high traffic volume,
it can be found that most of these ramps are located near interchanges with other arterials that
also have high traffic demand on weekdays.
By reviewing the traffic on expressway mainline, toll plaza cash lanes and ramps, a
general impression of current expressway operation can be gained. For further evaluation,
mainline operation will be thoroughly investigated. Ramps with daily volume higher than 10000
vehicles per day will also be studied. Since the toll plaza cash lanes are physically separated

20
from the mainline and vehicles need to stop and pay tolls at the toll stations, they won’t be the
focus on this study.
Figure 3-4 SR 408 Eastbound Weekday Ramp Traffic Volume
3.2 Congestion Measurement Traffic operation on expressways focuses on providing motorists with efficient movement to
their destinations. To achieve this goal, reducing congestion is the most important task.
Measuring congestion accurately is a prerequisite in congestion management. Traditionally,
volume-to-capacity (V/C) ratios and level of service (LOS) are implemented by transportation
authorities as indicators of congestion intensity (17). Nevertheless, traffic demand can vary
considerably in both temporal and spatial dimensions and roadway capacity can be reduced by
incidents as discussed above. In such cases, V/C ratios and LOS lack the capability to capture the
variability of congestion. With the fast development of ITS technology, real-time congestion
measurement is becoming an urgent call. On the expressways, AVI and MVDS traffic detection
systems are employed. Both of these systems archive the traffic data in real-time manner. In this
project, multiple congestion measures were introduced and compared based on these two
systems.

21
3.2.1 AVI-based Congestion Measurement Congestion can be measured from three aspects, namely density, travel time and travel speed.
AVI system is able to calculate the travel time of vehicles on a segment. Therefore, congestion
measured by travel-time was introduced for the AVI system.
Travel time index (TTI) is the commonly accepted measure used to evaluate traffic
congestion. It is defined as the ratio of actual travel time to an ideal (free-flow) travel time (18)
as shown in Equation (2)
TTI = actual travel timefree flow travel time
(2)
It indicates the additional time spent on a trip made during peak traffic hours compared to
an ideal trip on the same corridor. On CFX expressway system, free flow travel time for each
segment is offered in AVI traffic data. Free flow travel time is calculated based on segment
length and average speed limit. Average speed limit of a segment accounts for that speed limits
may vary within the segment. From the Enhancing Expressway Operations Using Travel Time
Performance Data (19), the levels of congestion and the corresponding travel time index for the
studied expressways are listed in Table 3-2:
Table 3-2 Travel Time Index and Congestion Levels
Functional Class Travel Time Index for different Congestion Levels
Below congestion threshold Moderate Congestion High Congestion
Freeway Less than 1.25 1.25 – 1.99 Higher than 2.00
3.2.2 MVDS-based Congestion Measurement Different from AVI system, MVDS sensors reflect the traffic conditions at the installed points
rather than segments. Speed, volume and lane occupancy will be archived on one-minute interval
basis.
Multiple congestion measures can be developed from the MVDS traffic data. Occupancy
is defined as the percent of time a point on the road is occupied by vehicles (20). Gerlough and
Huber (21) referred to occupancy as a surrogate for density. Compared with traditional V/C
Ratio or LOS, occupancy has the advantage that it could be monitored in real-time.

22
The speed detected by MVDS detector is spot speed and the rate of reduction in speed caused by congestion from the free flow speed condition is adopted as congestion index (12; 22). The congestion index (CI) is expressed as
CI = free flow speed−actual speedfree flow speed
× 100% when CI > 0; (3)
= 0 when CI ≤ 0
The CI is a continuous congestion indicator ranging from 0 to 1. The free flow speed is the
85th percentile speed at the corresponding detection point. From equation (3) above it can be seen
that when the actual speed is above free flow speed, CI will be recorded as 0. When CI increases,
the congestion becomes more severe.
Currently, for the congestion measures calculated from MVDS data, no specific
relationship between occupancy/CI and level of congestion is available. However, the TTI value
of 1.25 and 2 are approximately equivalent to CI value of 0.2 and 0.5. And According to the
congestion plots, when CI reaches 0.2 and 0.5, the corresponding occupancy (%) is about 15 and
25. Therefore, the research team set up the following congestion levels defined by occupancy
and CI as displayed in Table 3-3. Nevertheless, further refinement of these thresholds might be
possible.
Table 3-3 MVDS-Based Congestion Measures and Congestion Levels
Congestion Measure Expressway Congestion Levels
Below congestion threshold Moderate Congestion High Congestion
Occupancy (%) ≤ 15 15 – 24.99 ≥ 25 CI ≤ 0.2 0.2 – 0.499 ≥ 0.5
In conclusion, expressway mainline congestion will be evaluated using the three
congestion measures using traffic data from the two traffic detection systems. For ramps, only
occupancy and CI could be used since no AVI segment is available on ramps.
3.3 Expressway Congestion Evaluation
3.3.1 Mainline Congestion Two major efforts of have been made to evaluate the congestion for the expressways. One is the
evaluation of spatial-temporal distribution of current congestion on the expressways. The other
effort is to identify the trend of congestion during the past one year to determine whether

23
congestion is worsened or alleviated on the expressways. For this longitudinal comparison, five
months during the past year was selected considering the availability of traffic data.
To measure current expressway congestion conditions, the traffic data were aggregated at
five-minute interval and averaged by the weekdays for each month. Contour plots were
generated to illustrate the spatial-temporal property of the congestion.
The TTI congestion plot shown in Figure 3-5 show a proportion of data near MP 3.0 and
MP 20 were missing for both directions in July, 2014. As mentioned in the section about AVI
system, the expressway system undertook major update in April, 2014. As a result, in the recent
three months (May, 2014 – July, 2014) the AVI traffic data have the similar issues. For specific
segments, no records were available during specific time period. Despite the incompleteness of
the AVI data, some patterns could still be found from Figure 3-5, on SR 408 Eastbound,
congestion is found near MP 9.0 and MP 18 in the evening peak hours. On SR 408 Westbound,
morning congestion is observed from MP 11 to MP 15. These congestion patterns could also be
found in Figure 3-6 and Figure 3-7, indicating that AVI data could reflect congestion to certain
extent. However, it is still important to have the complete data to evaluate the performance of
AVI-based congestion measure. In the following analysis, TTI won’t be used to evaluate the
current congestion on the system due to this data completeness issue.
(a) (b)
Figure 3-5 Mainline Weekday Travel Time Index of SR 408 (a) Eastbound and (b) Westbound
The congestion plots derived from occupancy and CI (Figure 3-6, Appendix I, Figure 3-7
and Appendix J) exhibit comparable congestion patterns for the expressways. As mentioned

24
above, the number of MVDS sensors installed along the expressways is significantly more than
that of the AVI sensors. In addition, the MVDS system is stable in terms of active sensors during
the study time period. Therefore, the MVDS data is relatively complete and stable.
(a) (b)
Figure 3-6 Mainline Weekday Occupancy of SR 408 (a) Eastbound and (b) Westbound
(a) (b)
Figure 3-7 Mainline Weekday Congestion Index of SR 408 (a) Eastbound and (b) Westbound
Based on occupancy and CI, congestion conditions on the five expressways can be
summarized. SR 408 experiences moderate congestion on Eastbound in morning peak hours and
high congestion on Westbound in the evening peak hours. However, it should be noticed that the
congestion intensity changes with time. When it is approaching peak hours, the congestion
intensity gradually increases. Once the peak time is passed, the congestion becomes less severe.
The congested area for SR 408 is approximately from MP 17 to MP 19 on Eastbound and from

25
MP 10 to MP 13 on Westbound. For SR 414, only the Eastbound experiences moderate
congestion during morning peak hours, the congested segment is near MP 9.3. For SR 417, both
directions experience moderate congestion during evening peak hours, the congested segments
are short, only near the interchanges with University Blvd which leads to University of Central
Florida. No congestion was detected on SR 429. On SR 528, congestion is detected on
Eastbound in the evening and on Westbound in the morning.
In conclusion, based on the most recent MVDS data, the five expressways show distinct
congestion patterns. SR 408 is affected by congestion most significantly. SR 528 also experience
high congestion on the segment near MP 10 to MP 12. SR 417 and SR 528 only expect moderate
congestion on specific locations for short time intervals. SR 429 has no congestion either in the
morning or evening peak hours.
In the above congestion evaluation, the three candidate congestion measures were all
applied. For a more detailed assessment of their performance, one segment on SR 408
Westbound with traffic data from February 2014 was extracted for the comparison. The selected
AVI segment runs from MP 16.488 to MP 15.245. Within the AVI segment, five MVDS sensors
are installed at the locations as shown in Figure 3-8.
Figure 3-8 AVI-based TTI Profile vs MVDS-based Congestion Index Profile

26
The Figure 3-8 indicates that in the morning peak hours, both MVDS and AVI detect
congestion on the segment. However, there is about one hour lag for the peak between the two
types of data. The time period for congestion by the CI is considered more reliable since
congestion was mostly found from 7:00 AM to 9:00 AM. On the other hand, congestion by TTI
occurred from 8:30 AM to 9:30 AM. Furthermore, CIs from MVDS sensors within one AVI
segment differ from each other. Downstream (MP 15.2) has the highest congestion intensity and
upstream (16.5) has the lowest congestion intensity. However, the AVI data could not reflect this
detail. The high deployment density of the MVDS system ensures better reflection of the
congestion of at different locations within a queue.
Occupancy and CI are both derived from MVDS system. Therefore their performances in
congestion detection are similar (Figure 3-9) according to several detectors. These findings
imply that MVDS traffic data is more appropriate for congestion monitoring for several reasons:
1) MVDS system works in a more reliable manner, thus resulting in more complete data; 2)
MVDS system has much more sensors than AVI system, consequently generating more detailed
information about the expressways.
Figure 3-9 MVDS-based Congestion Index and Occupancy

27
In addition to the analysis of current congestion conditions on the expressways, the
longitudinal trend of congestion during the past one year was also examined using the MVDS
data. Five months, namely July 2014, May 2014, February 2014, November 2013 and August
2013 were selected. To see the trend of congestion, the system occupancy and CI were defined
and calculated. The system occupancy and CI are the average occupancy and CI from all the
MVDS sensors. They are used to represent the general congestion condition on the expressway
(Figure 3-10, Figure 3-12, Appendix K and Appendix M). After the system congestion for each
expressway is generated, the peak congested time can be identified. Then the detailed congestion
information at different locations of the expressways at the time when the system congestion
intensity is the highest can be evaluated (Figure 3-11, Figure 3-13, Appendix L and Appendix N).
Overall, the longitudinal congestion evaluation consists of two parts, 1) whether the congestion
has been alleviated during the last year for the whole expressway; 2) what are the changes for
each specific location regarding to congestion intensity. The evaluation was conducted using
both occupancy and CI.
Figure 3-10 SR 408 Eastbound System Occupancy and Trend of Congestion

28
From a system point of view, Figure 3-10, Figure 3-12, etc. all confirmed that on SR 408,
congestion is alleviated significantly in the recent month. Of the five months, both SR 408
Eastbound and SR 408 Westbound have the lowest system CI and occupancy. SR 408 is known
as the spine of the expressway network since it carries the heaviest traffic load among the five
expressways. Congestion on SR 408 is also the most severe compared with other expressways
within the system. As a consequence, reduction in congestion intensity proves significant
improvement in traffic operation. The same conclusion can be reached for SR 414. For SR 417
and SR 429, the improvement is not that significant yet congestion is not worsened. For SR 528,
the conclusions from CI and occupancy diverge a little. According to the system occupancy,
congestion conditions in the two months of 2013 were better than those in the three months of
2014. On the contrary, the system CI indicates that the three months in 2014 have less severe
congestion than the two months in 2013. Nevertheless, at the system level, it cannot be judged
that congestion on SR 528 has been improved significantly.
Figure 3-11 SR 408 Eastbound Peak Hour Occupancy and Trend of Congestion

29
Figure 3-12 SR 408 Eastbound System Congestion Index and Trend of Congestion
Figure 3-13 SR 408 Eastbound Peak Hour Congestion Index and Trend of Congestion

30
Based on the system congestion evaluation, the exact time when the system reaches the
peak congestion intensity can be identified. Congestion conditions at each detection point at this
peak time were extracted for SR 408, SR 417 and SR 528. SR 414 and SR 429 were excluded
because for SR 414 only one detection point has congestion and for SR 429 there is no
congestion detected. This effort provides some insights into the trend of congestion at different
locations along the road.
For SR 408 Eastbound (Figure 3-11 and Figure 3-13), congestion intensity measured by
occupancy and CI implies that the congested segments experience relatively less severe
congestion compared with February and May 2014, but not necessarily better than 2013. For
Westbound, the alleviation of congestion at congested segments is significant.
For SR 417, congestion intensity remains stable during the past one year according to
occupancy. Based on CI, congestion increased near MP 31 for both Northbound and Southbound
increased in a small amount. In conclusion, the congestion conditions on SR 417 did not change
significantly.
For SR 528, congestion concentrated on the segment near MP 10 for both Eastbound and
Westbound. Comparing the congestion at this segment in the five months during the past one
year, it is suggested by both CI and occupancy that significant reduction of congestion intensity
has been achieved.
As a result, the longitudinal analysis confirms operation improvement on SR 408, SR 414
and congested segments on SR 528. SR 417 and SR 429 remain stable during the past one year.
Considering SR 408 and SR 528 are the expressways that experience most congestion,
significant improvement on these two expressways indicate the successful management by the
CFX.
3.3.2 Ramp Congestion Ramps on the expressways lead the vehicles into the mainline and divert the vehicles out of the
system. When congestion occurs on off-ramps, queues can build up on the mainline and affect
the mainline congestion and safety. When congestion occurs on on-ramps, traveling speed on
mainline and ramps are likely to differ significantly. The variation of speed near the merging

31
area can greatly affect the mainline speed as well as probability of sideswipe crashes. Identifying
ramps experiencing congestion will help improve both operation and safety on the expressways.
SR 408 has 37 ramps on Eastbound and 37 ramps on Westbound. SR 414 Eastbound has
8 ramps and SR 414 Westbound has 7 ramps. There are 31 ramps located on SR 417 Northbound
and 32 ramps on SR 417 Southbound. SR 429 contains 17 ramps on Northbound and 16 ramps
on Southbound. For SR 528, 19 ramps are on the Eastbound and 18 ramps on the Westbound. To
identify the ramps that experience congestion, only the ramps having more than 10000 vehicles
per day on weekdays were selected. If the ramps have less volume, they are unlikely to have
congestion. Both occupancy and CI were used to evaluate the congestion conditions on the
ramps.
As seen in Figure 3-14 and Figure 3-15 and figures in Appendix O and Appendix P,
several ramps experience congestion during the peak hours. For SR 414, SR 417 and SR 528, the
ramps on the three expressways were found to have no congestion on them. The on-ramp at MP
9.7 on SR 408 Eastbound has moderate congestion during the evening peak hours according to
the profile of CI. This on-ramp has relative high occupancy for most time of the day. The
location of this on ramp is at the interchange of SR408 and I-4 in downtown Orlando. On SR 408
Westbound, congestion occurs on two off-ramps in the morning peak hours, at MP 9.9 and MP
10.3 respectively. Off-ramp at MP 9.9 takes vehicles off the expressway to I-4 Westbound and
off-ramp at MP 10.3 takes vehicles from SR 408 to I-4 Eastbound. The congestion on SR 408
ramps indicate that in the morning, more traffic is traveling from I-4 to SR 408 while in the
evening more vehicles are traveling from SR 408 to I-4.Except the ramps on SR 408, only one
ramp on SR 429 was found to have congestion. The off-ramp is at MP 19.8 of SR 429
Southbound. During the evening peak hours, both CI and occupancy increased significantly and
indicate moderate congestion. This congested ramp is located next to Winter Garden Village, a
big shopping center and residential area. The land use property of this region explains why
congestion is found on this particular ramp.
Results of the ramp congestion evaluation identify four ramps on the expressways that
experience congestion. Three of the ramps are on SR 408 and one on SR 429. In addition, three
of the four ramps are off-ramps and one is on ramp. Future operation improvement should also
take these ramps into consideration.

32
Figure 3-14 SR 408 Eastbound Ramp Occupancy Profile
Figure 3-15 SR 408 Eastbound Ramp Congestion Index Profile

33
4 DMS APPLICATION IN CONGESTION MANAGEMENT
4.1 DMS Application in Queue Warning Traffic congestion results in travel delay, excess fuel consumption and congestion costs. In 2010,
Orlando ranked the 3rd in Florida in terms of the above three standards (38,260,000 hours delay,
11,883,000 gallons excess fuel, and 811 million dollars congestion costs) (23).
Traditionally, increasing road capacity has been a common countermeasure to alleviate
congestion. Due to the limited land resources, public investment and increasing travel demand,
only adding more capacity to the system is not a long-term solution. Public transportation, road
pricing and other measures to reduce traffic are also encouraged or implemented to ease traffic
congestion. However, these steps are not able to change the current supply and demand greatly
and quickly enough. Consequently, traffic management is crucial in order to enhance the
efficiency of the road and lessen the intensity of congestion.
Recent years saw the rise of active traffic management (ATM). It is a combination of
congestion management techniques. The goal of the ATM strategies is to better the roadway
system’s performance on road segments experiencing frequent congestion, or susceptible to
crashes, bottlenecks and adverse weather conditions.
4.1.1 Queue Warning Queue warning is a strategy to warn drivers of upcoming congestion and allow drivers enough
time in advance to make decisions whether to detour or stay on the route. From a safety
perspective it also allows drivers enough decision and reaction time to slow down. Dynamic
message signs (DMS) are the most common media to convey the traffic information to upstream
drivers. Variable speed limits and lane control signals often work together with queue warning
signs.
The potential benefits offered by the queue warning system include prevention of primary
and secondary crashes (also the severity is expected to be reduced), delay of the onset of
congestion, and travel time improvement. The basic principle behind queue warning is alerting
the drivers to congestion conditions, drivers’ caution will rise, and more smooth and uniform
traffic flow be achieved.

34
4.1.2 Queue Warning Implementation In Germany, the queue warning system involves displaying a congestion pictograph on each side
of the speed harmonization gantry or DMS indicating congestion ahead. The gantries are
generally spaced 1 km apart, and the system typically begins reducing speeds between three and
four gantries before an incident. It was also noted that users are interested in knowing the
location of the queue and what route they should take to avoid it (24).
The Netherlands alerts travelers to congestion and queues by flashing lights and speed
signs on variable speed limit signs. The system, generally located every 500 m, provides queue
tail warning and protection in known bottleneck locations. The Dutch have seen definite benefits
from their congestion warning system. The throughput increased and incidents decreased (24).
Researchers from the Netherlands interviewed morning drivers about the queue warning
signs. The drivers comments on the signs indicated some important issues such as that the first
sign should be placed further in advance so that drivers could still take another road (25).
In Canada, Highway 402 installed the queue warning system. They remind the drivers of
the location of congestion downstream using the system. They had demonstrated that the
implementation of the system was a success in terms of rear end collision reduction on this road
(26).
In Sweden, Belgium and France, the queue warning systems have all been successfully
applied.
In United States, it is recommended that the queue warning message displays should be
implemented at regular intervals based on dynamic traffic detection. It is also suggested that the
queue warning system should work in conjunction with speed harmonization (24).
4.1.3 Placement of Queue Warning Signs Exact guidelines about the placement of queue warning signs in the United States were not found.
Only general principles have been discussed, which is presented in the previous section.
The Manual on Uniform Traffic Control Devices (MUTCD) 2009 edition addresses the
placement of warning signs as in Table 4-1. The warning signs should leave the drivers with
adequate Perception-Response Time (PRT) to make corresponding adjustment. However, it is

35
stated that the distance between the sign and the warned location should not be too far, such that
drivers might tend to forget the warnings, especially in urban areas.
Table 4-1 Guidelines for Placement of Warning Signs (adapted from MUTCD 2009)
Posted or 85th-
Percentile Speed
Advance Placement Distance1 Condition A:
Speed reduction and lane changing in heavy traffic2
Condition B: Deceleration to the listed advisory speed (mph) for the condition
03 104 204 304 404 504 604 704
20 mph 225 ft 100 ft6 N/A5 -- -- -- -- -- -- 25 mph 325 ft 100 ft6 N/A5 N/A5 -- -- -- -- -- 30 mph 460 ft 100 ft6 N/A5 N/A5 -- -- -- -- -- 35 mph 565 ft 100 ft6 N/A5 N/A5 N/A5 -- -- -- -- 40 mph 670 ft 125 ft 100 ft6 100 ft6 N/A5 -- -- -- -- 45 mph 775 ft 175 ft 125 ft 100 ft6 100 ft6 N/A5 -- -- -- 50 mph 885 ft 250 ft 200 ft 175 ft 125 ft 100 ft6 -- -- -- 55 mph 990 ft 325 ft 275 ft 225 ft 200 ft 125 ft N/A5 -- -- 60 mph 1,100 ft 400 ft 350 ft 325 ft 275 ft 200 ft 100 ft6 -- -- 65 mph 1,200 ft 475 ft 450 ft 400 ft 350 ft 275 ft 200 ft 100 ft6 -- 70 mph 1,250 ft 550 ft 525 ft 500 ft 450 ft 375 ft 275 ft 150 ft -- 75 mph 1,350 ft 650 ft 625 ft 600 ft 550 ft 475 ft 375 ft 250 ft 100 ft6
1 The distances are adjusted for a sign legibility distance of 180 feet for Condition A. The distances for Condition B have been adjusted for a sign legibility distance of 250 feet, which is appropriate for an alignment warning symbol sign. For Conditions A and B, warning signs with less than 6-inch legend or more than four words, a minimum of 100 feet should be added to the advance placement distance to provide adequate legibility of the warning sign. 2 Typical conditions are locations where the road user must use extra time to adjust speed and change lanes in heavy traffic because of a complex driving situation. Typical signs are Merge and Right Lane Ends. The distances are determined by providing the driver a PRT of 14.0 to 14.5 seconds for vehicle maneuvers (2005 AASHTO Policy, Exhibit 3-3, Decision Sight Distance, Avoidance Maneuver E) minus the legibility distance of 180 feet for the appropriate sign. 3 Typical condition is the warning of a potential stop situation. Typical signs are Stop Ahead, Yield Ahead, Signal Ahead, and Intersection Warning signs. The distances are based on the 2005 AASHTO Policy, Exhibit 3-1, Stopping Sight Distance, providing a PRT of 2.5 seconds, a deceleration rate of 11.2 feet/second2, minus the sign legibility distance of 180 feet. 4 Typical conditions are locations where the road user must decrease speed to maneuver through the warned condition. Typical signs are Turn, Curve, Reverse Turn, or Reverse Curve. The distance is determined by providing a 2.5 second PRT, a vehicle deceleration rate of 10 feet/second2, minus the sign legibility distance of 250 feet. 5 No suggested distances are provided for these speeds, as the placement location is dependent on site conditions and other signing. An alignment warning sign may be placed anywhere from the point of curvature up to 100 feet in advance of the curve. However, the alignment warning sign should be installed in advance of the curve and at least 100 feet from any other signs. 6 The minimum advance placement distance is listed as 100 feet to provide adequate spacing between signs.
In California Department of Transportation’s Traffic Manual Chapter 4 about signs, the
placement of warning signs is also specified. They state that in rural areas, the warning signs
should normally be placed about 150m (0.09mi) in advance of the conditions. On high-speed

36
roads, particularly on freeways, the advance warning distance may have to be as great as 450m
(0.28mi) or more (27). These standards are similar to those provided by MUTCD.
These guidelines are designed for general warning signs. However, the property of queue
warning message signs is different. The MUTCD’s criterion is based on PRT and adjusted for
sign legibility distance. Following these guidelines, the drivers will be informed of upcoming
congestion and slow down accordingly, which is adequate to avert hitting the back of the queue.
Nevertheless, it might not be sufficient for detour, as a problem raised by the aforementioned
Dutch study.
From the perspective of offering drivers alternative routes, it is critical that after the
drivers see the queue warning message that there will still be an off-ramp upstream of the
congested area. Only in this case would the driver be able to make a decision of route choice.
4.2 Expressway Congestion Area and Suggested DMS Locations On the expressways, the congestion areas have been identified in previous chapter. Based on the
identified congested segments or locations, the DMS upstream can be used for congestion
warning. Furthermore, for the congested ramps, DMS can also be used to remind motorists about
the traffic condition on downstream ramps. In case that no DMS exists upstream to the congested
segments, future DMS can be considered at these places.
Table 4-2 shows the congested segment on SR 408 Eastbound is located around MP 18. It
can be seen from the table that the length of the queue changes over time. In total the congestion
lasts for about 40 minutes from 17:30 PM to 18:10 PM. The maximum length of the queue was
extracted to represent the congestion condition. According to the end of the queue when it is
most congested, the upstream DMS is located. Figure 4-1 visually displays the congested
segments and nearest upstream DMS. The beginning of queue (MP 18.4) is near the interchange
with Dean Road and the end of the queue (MP 17.7) is at the interchange with SR 417. The
nearest upstream DMS is at MP 15.2. The distance between the DMS and end of queue is 2.5
miles, which can warn drivers when they approach the queue.
SR 408 Westbound as shown in Table 4-3, Figure 4-2 and Figure 4-3 has two queues in
the morning peak hours. The first queue is near Orlando Executive Airport. The congestion
exists from Conway Road Toll Plaza to the interchange with Semoran Blvd. One DMS is located

37
at MP 15.2. The second queue is from the interchange with I-4 to interchange with Crystal Lake
Drive, about 2.3 miles long. Although one DMS is found at MP 11.8 within the congested
segment, no DMS upstream can be used for queue warning. Therefore, one DMS is suggested
near MP 13.6 to MP 14.6 for potential implementation in the future for queue warning in Figure
4-3.
Table 4-2 SR 408 Eastbound Congestion Area
Hour 17 18 Minute 30 35 40 45 50 55 0 5
Beginning of Queue 18.4 18.4 18.4 18.4 18.4 18 18 18
End of Queue 18 18 17.7 17.7 17.7 17.7 17.7 17.7
Figure 4-1 SR 408 Eastbound Congestion Segment and Upstream DMS Location
Beginning of Queue End of Queue
SR 408 Eastbound Queue
DMS Location

38
Table 4-3 SR 408 Westbound Congestion Area
Hour 7 8 9 Minute 20 25 30 35 40 45 50 55 0 5 10 15 20 25 30 35 40 45 50 55 0 5
Beginning of Queue 1 13.3 13.3 13.3 13.3 13.3 13.3 13.3 13.3 13.3 13.3 13.3 13.3 13.3 13.3 13.3 13.3 13.3 13.3 13.3 13.3
End of Queue 1 13.6 13.6 13.6 13.6 13.6 14.4 14.4 13.6 13.6 13.6 13.6 13.6 13.6 13.6 13.6 13.6 13.6 13.6 13.6 13.6
Beginning of Queue 2 10.3 10.3 10.3 10.3 10.3 10.3 10.3 10.3 10.3 10.3 10.3 10.3 10.3 10.3 10.3 10.3 10.3 10.3 10.3 10.3 10.3 10.3
End of Queue 2 10.6 10.6 10.6 11.6 12.1 12.6 12.6 12.6 12.6 12.1 11.6 11.6 11.6 11.6 11.6 11.6 11.6 11.6 11.6 10.9 10.6 10.6

39
Figure 4-2 SR 408 Westbound Congestion Segment 1 and Upstream DMS Location
End of Queue 1 Beginning of Queue 1
SR 408 Westbound Queue 1
DMS Location

40
Figure 4-3 SR 408 Westbound Congestion Segment 2 and Suggested DMS Area
Suggested
DMS Area
SR 408 Westbound Queue 2
Beginning of Queue 2 End of Queue 2
DMS Location

41
Congestion on SR 414, SR 417 and SR 528 and the existing or suggested DMS could be
found in Appendix Q. On specific expressways, only one detector reports congestion. For these
conditions, the place with congestion will be specified as congestion location. SR 414 Eastbound
experiences congestion near the end of the roadway segment. Only one MVDS sensor at the
interchange with Orange Blossom Trail detects congestion for around 15 minutes from 7:50 AM
to 8:05 AM. However, there is currently no DMS upstream to this congestion location.
Correspondingly, potential location for new DMS is suggested to be MP 7.3 to MP 8.3.
SR 417 Northbound experiences congestion on one segment and at one detection location.
The congested segment is located between the interchange with East Colonial Dr and the
interchange with University Blvd. The congested segment is relatively short and one upstream
DMS is located at MP 33.4 which can be used for queue warning. The congested location at 37.7
on SR 417 Northbound is at the boarder of Orange and Seminole County with no upstream DMS
nearby. It is suggested that a DMS at MP 35.7 to MP 36.7 might be considered in the future. The
detection location at Southbound MP31.9 near interchange with SR 408 is also identified as a
congested location. Congestion at this location might be due to the merging traffic from SR 417
Southbound and SR 408 Eastbound. Currently no DMS is located upstream to this congestion
location, thus potential DMS can be installed in the segment from MP 32.9 to MP 33.9.
On SR 528 Eastbound has evening congesting lasting for about one hour. The congested
segment is near interchange with Tradeport Dr and west to Beachline Airport Mainline Toll
Plaza. When vehicles approach the toll plaza, there is only one express lane on the cross-section.
And 35 mph speed limit is imposed on this lane. Therefore during the peak hours, queue can
build up on this lane. One DMS is to this segment at MP 8.6, about 0.4 mile upstream to the end
of the queue. On SR 528 Westbound at the interchange with SR 417, morning congestion is
observed. The morning congestion exists during from 7:45 AM to 8:10 AM and from 8:45 AM
to 8:55 AM. No existing DMS is located upstream to the SR 528 Westbound congestion area. As
a response, to warn the motorists of oncoming congestion, a DMS at MP 12.0 to MP 13.0 can be
considered.
Table 4-4 summarizes the congestion segment on each direction of the five expressways.
The congested time period is also given. For the DMS application for queue warning, existing
locations of DMS signs upstream to the identified congested area have been checked. In case a

42
DMS is found, its milepost is given. If no DMS is available at present, the suggested DMS area
is listed for consideration. In total, there are four locations that already have DMS which could
be used for queue warning and five locations where future implementation of DMS could be
considered for the purpose of congestion management.
Table 4-4 Mainline Congestion Segment and Location Identification and DMS Application for Congestion Management
Expressway Direction Congested Segment / Location Congested Time Period
Existing Upstream
DMS
DMS Location / Suggested DMS Area
SR 408
EB MP 18.4 (Interchange with Dean Rd) MP 17.7 (Interchange with SR417) 17:30--18:10 Yes 15.2
WB MP 13.3 (Close to Conway Rd) MP 14.4 (Interchange with Semoran Blvd) 07:20--09:00 Yes 15.2
WB MP 10.3 (Interchange with I4) MP 12.6 (Interchange with Crystal Lake Dr) 07:20--09:10 No 13.6--14.6
SR 414 EB MP 9.3 (Interchange with Orange Blossom Trail) 07:50--08:05 No 7.3--8.3
SR 417
NB MP 35.5 MP 35.2 (between East Colonial Dr and University Blvd) 17:20--18:00 Yes 33.4
NB MP 37.7 (near boarder between Orange and Seminole County) 17:20--18:00 No 35.7--36.7
SB MP 31.9 (south to Interchange with SR408) 17:20--18:00 No 32.9--33.9
SR 528 EB
MP 9.8 MP 9.0(Interchange with Tradeport Dr, west to Beachline Airport
Mainline Toll Plaza) 17:10--18:15 Yes 8.6
WB MP 10.3 MP11.0 (Interchange with Semoran Blvd)
07:45--08:10 08:45--08:55 No 12.0--13.0
In addition to mainline congestion management using DMS, congestion conditions on
ramps could also be informed to motorists via DMS. On the expressway system, four ramps are
found to experience congestion during the morning or evening peak hours as illustrated in Figure
4-4 to Figure 4-7. Three ramps are located on SR 408, and the fourth on SR 429. Upstream DMS
have been found for each of the ramp. Consequently, they can serve as queue warning signs. On
SR 408 Eastbound, the congested ramp is from I-4 Westbound to SR 408 Eastbound located at
MP 9.7. During 15:00 to 19:40, congestion exists on this ramp. The DMS at MP 7.7 can be used
to warn motorists on the mainline of potential congestion at the merging area near the ramp. On
SR 408 Westbound, two off-ramps, one connected with I-4 Eastbound and the other one
connected with I-4 Westbound are identified to be congested during in the morning peak hours.
When queues are building up on these ramps and affecting mainline traffic, the DMS at MP 11.8

43
can be considered for queue warning. The congested off-ramp on SR 429 Southbound is at the
interchange with Daniels Road. The region nearby is large shopping center and residential area.
Congestion is found from 17:00 PM to 18:20 PM. The nearest upstream DMS is located at MP
20.7, and can be used to warn the motorists about the congestion on this ramp in advance. Table
4-5 summarizes the information about ramp congestion and DMS application for queue warning
on ramps.
Figure 4-4 SR 408 Eastbound Congested Ramp and Upstream DMS Location
DMS Location
Congested Ramp

44
Figure 4-5 SR 408 Westbound Congested Ramp 1 and Upstream DMS Location
Figure 4-6 SR 408 Westbound Congested Ramp and Upstream DMS Location
DMS Location
Congested Ramp
DMS Location Congested Ramp

45
Figure 4-7 SR 429 Southbound Congested Ramp and Upstream DMS Location
Table 4-5 Ramp Congestion Identification and DMS Application for Congestion Management
Expressway Direction Ramp Location Congested Time Period
Upstream DMS Location
SR 408 EB MP 9.7 (I4 WB SR 408 EB ) 15:00 -- 19:40 7.7 SR 408 WB MP 9.9 (SR 408 WB I-4 WB) 07:25 -- 08:00 11.8 SR 408 WB MP 10.3 (SR 408 WB I-4 EB) 07:35 -- 09:05 11.8 SR 429 SB MP 19.8 (Interchange with Daniels Rd) 17:00 -- 18:20 20.7
DMS Location
Congested Ramp

46
5 RAMP CLOSURE PRACTICE ON THE EXPRESSWAYS Congestion alleviation on the mainline and ramps is expected to improve the performance of the
expressways system and to provide motorists with efficient services. However, in case of total
shut-down on the mainline, other strategies are in need to divert traffic from the mainline to local
roads and prevent vehicles from entering the expressway and worsening the congestion. Ramp
closure is a specific practice to alleviate mainline congestion in such cases. With the purpose of
understanding the toll and turnpike authorities’ procedures and practices for closing on-ramps in
case of total shut-down of the mainline travel lanes, a questionnaire containing twelve short
questions was designed. The survey was sent out to toll authorities in the United States and
countries around the world to learn from other agencies’ experience.
5.1 Introduction on Toll Authority Survey Response Ten domestic responses from eight states in the US, and seven international responses have been
received. Figure 5-1 presents the states from which we received responses. The domestic toll and
turnpike authorities are Delaware Department of Transportation (DelDOT, Delaware), Florida’s
Turnpike Enterprise (Florida’s Turnpike, Florida), Miami-Dade Expressway Authority
(MDXWay, Florida), Maryland Transportation Authority (MDTA, Maryland), Minnesota
Department of Transportation (MnDOT, Minnesota), New Hampshire Department of
Transportation Bureau of Turnpikes (NH Turnpike Bureau, New Hampshire), New Jersey
Turnpike Authority (New Jersey Turnpike, New Jersey), Richmond Metropolitan Authority
(RMA, Virginia), Pocahontas 895 (Virginia), and West Virginia Parkways Authority (WV
Parkways Authority, West Virginia).
Along with the survey response, DelDOT also provided us with the Toll Plaza Modified
Operations Plan for Closures and Waivers. The manual is to provide guidelines for 1)
temporarily suspending toll collection at the mainline toll plazas in the event of evacuation; 2) an
activated detour which utilizes the tolled facility to route traffic past or around an incident which
severely impacts another roadway. Although it’s not directly for ramp closure and traffic detour,
it offers valuable information about traffic management in case of emergency.
Seven international responding authorities as shown in Figure 5-2 are Attica Tollway
Operations Authority (Greece), Moreas Tollway Concessionaire (Greece), Olympia Odos
Operation S.A. (Greece), West Nippon Expressway Company, Ltd (Japan) and Korean

47
Expressway Corporation (KEC, South Korea). Two Belgian authorities responded: NV Tunnel
Liefkenshoek currently is the only organization in Belgium that operates a tolling system at
Liefkenshoek tunnel; PMO Duurzame Mobiliteit has plans to introduce a universal kilometer
charging system in 2016. Since one response is based on the authority’s experience of tunnel
operation and the other system is still at planning stage, their responses are listed in a separate
section.
Figure 5-1 Domestic States with Responses
Figure 5-2 International Responses (Belgium, Greece, Japan & South Korea)

48
5.2 Summary of the Questionnaire
The responses from the toll authorities (domestic or international) are given below. The
questionnaire is attached as Appendix R. Both the counts and percentages (in parentheses) are
summarized. In the questionnaire, a toll authority might skip specific questions in the absence of
concrete information. On the other hand, it is likely that multiple options of a question are
appropriate to be chosen. Tables 5-1 to 5-15 show the results of the survey questions. Both count
and percentage data are calculated and presented in the tables. Figures 5-3 to Figure 5-11 further
illustrate the results of these questions for the total domestic and international responses.
5.2.1 Existing Toll Collection System
The existing toll collection systems on each authority’s roadways have been investigated. From
the responses (Table 5-1 and Figure 5-3) we have collected, open tolling systems possess
obvious advantages over the traditional toll plazas. No domestic authorities in the survey
reported the exclusive use of plazas. The combination of open tolling and plazas represents the
majority of toll collection methods in the United States except in Minnesota which operates open
tolling system only. The international responses indicated that the involved countries still have a
higher portion of toll plazas. The Attica Tollway Operations Authority and West Nippon
Expressway Company have both open tolling and plazas in their systems. The KEC also stated
that they have plans to install open tolling systems.
The superiority of the open tolling systems over the traditional toll plazas lies in that they
need less manpower, and enhance the road capacity by removing bottle-necks. They also
improve travelers’ driving comfort and reduce the travel time. The application of open tolling is
advantageous for both toll authorities and the toll road users. In practice, the combination of
these two toll collection systems is most common. Compared with either open tolling system
only or toll plazas only, the combination of the two could accommodate the needs of both the
frequent and infrequent toll road users depending on whether or not they have the Electronic Toll
Collection (ETC) transponder.

49
Table 5-1 Question 1: Current Toll Collection System
Toll Collection Domestic International (1) Open tolling only 1 (10%) 0 (0%) (2) Combination of open tolling and plazas 9 (90%) 2 (40%) (3) Plazas only 0 (0%) 3 (60%)
Figure 5-3 Current Toll Collection Systems
In Florida, according to the CFX 2012 Toll Facilities Reference Manual (28), the
roadway segments operated by the CFX have open tolling system, self-service “Exact Coins”
payment, and artificial service “Change Receipts” payment. The toll collection methods on the
mainline or on ramps are combinations of open tolling and either one or both of the self-service
and manual service.
5.2.2 Practice of Ramp Closure
When incidents or congestions occur on the toll facility, total shut-down of the mainline travel
lanes can be the consequence. In this case, countermeasures have to be taken so that the queues
can dissipate in a relatively short time. One way to address this problem is to limit the traffic
entering the facility upstream of the shut-down area. More traffic entering the system would
worsen the situation.
All but one of the toll road authorities (domestic and international) claimed that in the
event of a major incident or congestion they implement the practice of closing the on-ramps and
inform the drivers of a shut-down of the mainline travel lanes as shown in Table 5-2 and Figure
5-4. NH Turnpike Bureau explained that in lack of this practice, they still follow the guidelines
7%
73%
20% Open tolling only
Combination ofopen tolling andplazasPlazas only

50
of the Manual on Uniform Traffic Control Devices (MUTCD). MUTCD states that ramps may
be closed by using signs and Type III barricades; early coordination with officials having
jurisdiction over the affected cross streets is needed before ramp closings. It is suggested that
portable DMS can be applied for ramp closure, and incident management in temporary traffic
control zones.
Table 5-2 Question 2: Ramp Closing Practices in Case of Total Shut-down
Closing ramps Domestic International (1) Yes 9 (90%) 5 (100%) (2) No 1 (10%) 0 (0%)
Figure 5-4 Ramp Closing Practices in Case of Total Shut-down
The practices that a toll authority would implement fall into two scenarios: 1) with frontage
road available; 2) with no frontage road available. The results from the authorities’ responses (in
Table 5-3, Figure 5-5, Table 5-4 and Figure 5-6) show that regardless of the availability of
frontage roads, the procedures are almost similar. For domestic toll authorities, DelDOT,
Florida’s Turnpike and MDXWay, Virginia’s Pocahontas 895 and RMA, MnDOT, and New
Jersey Turnpike do not differentiate their procedures based on frontage roads. MDTA reported
that for most of their toll road segments, there are no parallel frontage roads adjacent to their
facilities. WV Parkways Authority applies all of the procedures listed in the questionnaire but
further explained the minor difference of the procedures they use according to the availability of
frontage road. For international respondents, only KEC implements different strategies in the two
situations. For the authorities who shared with us the detailed information as how the procedures
93%
7%
Yes
No

51
are carried out or what they do according to the availability of frontage road, we outlined their
responses in the following paragraph.
Table 5-3 Question 3: Procedures When Frontage Road is Available
Procedures when frontage road available Domestic International (1) Re-route vehicles to downstream ramps 1 (10%) 1 (20%) (2) Detour to other surface streets 2 (20%) 0 (0%) (3) Treat on a case by case basis 5 (50%) 4 (80%) (4) Other 4 (40%) 0 (0%)
Figure 5-5 Procedures When Frontage Road is Available
Table 5-4 Question 4: Procedures When No Frontage Road is Available
Procedures when no frontage road available Domestic International (1) Re-route vehicles to downstream ramps 1 (10%) 0 (0%) (2) Detour to other surface streets 3 (30%) 1 (20%) (3) Treat on a case by case basis 5 (50%) 4 (80%) (4) Other 4 (40%) 0 (0%)
0
1
2
3
4
5
6
Re-route vehiclesto downstream
ramps
Detour to othersurface streets
Treat on a case bycase basis
Other
Cou
nt
Procedures
Domestic International

52
Figure 5-6 Procedures When No Frontage Road is Available
The detailed information regarding ramp closure procedures suggested by each authority
include:
• Route traffic through the open road tolling (ORT) lanes at each plaza (DelDOT)
• SOP (Standard Operating Procedure) will make decision if diversion of the travel lanes
and closures of on-ramps are needed for a long-term incident. Turnpike Roadway
Maintenance and Traffic Operations will also provide recommendations to the Incident
Command System (ICS). According to Federal Highway Administration (FHWA) "a
systematic tool used for the command, control, and coordination of emergency response".
The closure of mainline at diversion point as well as at the on-ramps is completed via
available troopers, per local law enforcement, road rangers, and contracted MOT
(Maintenance of Traffic) vendors. It is a case by case decision if the authority can route
traffic directly to a downstream ramp or is only able to divert vehicles to other surface
streets. (Florida’s Turnpike)
• Traffic is diverted from open lanes to toll lanes at the toll plaza, or to another ramp for
exit. (Pocahontas 895)
• Freeway Incident Traffic Management (FITM) plans have been established for each
segment (interchange to interchange) of the facilities. If the incident is of middle to long
term duration, exit ramp detours are posted via dynamic message signs. Entrance ramp
0
1
2
3
4
5
6
Re-route vehiclesto downstream
ramps
Detour to othersurface streets
Treat on a case bycase basis
Other
Cou
nt
Procedure
Domestic International

53
detours are typically only established for planned (construction, maintenance) detours.
For most of the continuous length facilities, there are signs installed on the cross streets to
guide motorists to the parallel roadways and signs on the parallel facility to guide
motorists back to the affected facility at the next cross street location. (MDTA)
• Emergency detours are designed with permanent signage when a frontage road is
available. Emergency gates are in place to run traffic around when no frontage road is
available. (WV Parkways Authority)
Even when no procedures/practices are prepared, the authorities confirmed that they do
provide information to motorists as shown in Table 5-5. DelDOT, Florida’s Turnpike, MDXWay
left this question blank. The reason could be due to that when the shut-down of mainline travel
lanes occurs, they always come up with the countermeasure procedures.
Table 5-5 Question 5: Providing Information to Motorists
Provide information to motorists Domestic International (1) Yes 7 (70%) 5 (100%) (2) No 0 (0%) 0 (0%)
5.2.3 Procedures of Ramp Closure After the questionnaire was distributed, another question was added and sent to the toll
authorities. This question emphasizes on the procedures of how the authorities close the ramps
and the devices they use for the closure. From this further communication, seven domestic and
four international toll authorities responded this question at detailed level shown as in Table 5-6
and Table 5-7.

54
Table 5-6 Ramp Closure Procedure by Domestic Toll Authority
Toll Authority State Ramp Closure Procedure
DelDOT Delaware
The traffic management team prepared a “Toll Plaza Modified Operations Plan for closures and waivers” booklet that describes in detail the methods used in shutting down the Cash lanes and ancillary ramps. They have provided a trailer for each plaza that has a supply of cones and other necessary equipment to aid in shutting down the lanes. The authority is currently planning to install permanent variable message boards to assist in MOT.
Florida’s
Turnpike Florida
Florida’s Turnpike has no fixed gates. Only exception to this has been through specific construction projects where that contract’s Incident Management Plan has included pre-staged MOT devices within the construction limits. The Turnpike indicated that these projects have typically been lengthy work zones where barrier wall has been placed limiting shoulder areas, etc.
Ramp closure is typically done initially and immediately by Florida Highway Patrol or mutual aid request to a local law enforcement unit to block an entrance ramp to the mainline. Law enforcement will block the directional ramp only, but will also block the interchange entrance at the arterial roadway as well. Road rangers will also be part of an initial ramp blockage either with or without law enforcement. The experience is that “blue lights” from law enforcement on scene with a road ranger MOT set-up is the most effective. Florida’s Turnpike stated that they have had occasions when a road ranger by themselves at this type of set-up does not deter motorists from going through or around cones and vehicle to enter the closed ramp.
From the information offered by Florida’s Turnpike, cone setup at rollover scene (lane blocking) is also illustrated (shown in appendix). The diagram may be of use if cones are also implemented in ramp closure.
Maryland
Transportation
Authority
Maryland Maryland Transportation Authority responded that they do not stage cones or
have permanently installed gates. However, they have their own police force and they help set up road block at the gore entrance.
New Jersey
Turnpike
New
Jersey
When the mainline needs to be closed due to unforeseen incident, a state police vehicle will block the ramp(s) until when maintenance trucks come to block the ramp(s). The turnpike stated that they have too many ramps to have cones at each location and would still need personnel there to put the cones out.
The New Jersey Turnpike will also check with the state DOT to have them post messages on their DMS to alert motorists of the closure.
Pocahontas 895 Virginia Pocahontas 895 in Virginia responded that they use cones and signage when they close the ramps.
Richmond
Metropolitan
Authority
Virginia
The RMA stated that they typically close their ramps with cones and barrels. And they usually put up DMS sign informing motorists the cause of the ramp closure and the expected duration. Police department may also close ramps on their system. In this case, a vehicle with lights will be parked at the entrance ramp.
WV Parkways West
Virginia
When frontage road is available, they close ramps and detour the traffic with permanent signage. When no frontage road is available, then emergency gates are in place to run traffic around.

55
Table 5-7 Ramp Closure Procedure by International Toll Authority
Toll Authority Country Ramp Closure Procedure
Attica Tollway Greece
Attica tollway system has 39 toll stations, out of which 4 are mainline toll
plazas and the remaining 35 are ramp toll plazas. In extreme cases, access to the
motorway can be completely closed. When the need to close entrance ramps arises,
Attica tollway uses simple pole and chain to deter vehicles from entering the ramp.
The detailed ramp closure procedure is that a heavy-duty yellow/black chain is
suspended between two hooks, one welded on a free-standing pole and one welded
on a safety barrier. An “Entrance Closed” sign is placed in front of the chain and
the entrance is hence closed. Closure of ramps is carried out by the patrol personnel
of operating company, with the presence and the assistance of the traffic police.
The traffic police remain present for the full duration of the ramp closure, providing
assistance to the motorists and ensuring that no vehicles enter the motorway.
Attica tollway also provides pictures illustrating the devices they use for ramp
closure. The pictures are attached in appendix.
Olympia Odos Greece The entrance ramps are closed by police force or closed physically. As to how
to close them physically, it is not mentioned.
Moreas Tollway Greece
The authority does not have gates or any other automated equipment nor
permanently staged cones or other similar material “waiting to be used”. They
stated that their closure practices rely on toll plazas (of which two toll plazas are on
entrance ramps). Police assistance is required in case of shut-down.
West Nippon
Expressway
Company
Japan
Some of the system’s ramps have fixed gates. The gates would be closed in
case of unusual event such as traffic crashes and/or extreme weather conditions
such as heavy rain. DMSs are located at all the toll gates to inform the passengers
of the event.
Other authorities in their responses reported whether they will re-route the vehicles to
downstream ramps, detour vehicles to other surface streets or treat the condition on case by case
basis. And the media they implement to distribute the closure or detour information.
Nevertheless, they do not provide detailed information as how they close the ramps.
Besides the responses collected from the toll road authorities via questionnaire and direct
communication, researchers at UCF also conducted an online literature search for ramp closing
procedures. It is found that on most DOT’s or Turnpike authorities’ website, only the ramp
closure schedule will be posted. FHWA’s Ramp Management and Control Handbook (29)
provide guidelines and case studies for ramp closures.

56
According to the handbook, there are three types of ramp closures: permanent, temporary,
and time-of-day. Temporary closures may be implemented due to construction activities, special
events or weather-related events. Time-of-day closures are typically focused on the morning or
afternoon peak periods. This type of closures facilitates mainline flow.
Some practical instances of these two types of closures include:
During the Tocoma Dome event in Washington State, Exit 133 was closed using
barricades and DMS to warn motorists.
MnDOT has been using gates since 1996 to prohibit freeway access during unsafe
driving conditions such as severe snowstorms and major crashes.
In Milwaukee, Wisconsin, I-43 southbound at State Street, the ramp was equipped with a
gate that automatically closed daily from 2 to 6 pm and opens immediately after. This was a peak
period closure. It was reported that the gate required extensive maintenance because it was often
broken (and broken within weeks of repair).
The various ways and devices to provide ramp closure are provided in the handbook.
Hawaii DOT used traffic cones to temporarily close the Lunalilo Street on-ramp and the
Vineyard Boulevard off-ramp along the westbound H-1 freeway.
Type III barricades are used in the Wisconsin example mentioned above. They are
suitable where closures are infrequent. The advantage of this type of barricade is the low cost
and high visibility to motorists.
Semi-permanent barriers (water-filled barrels or flexible pylons) can be used for full
ramp closures on a temporary basis. Long Island Expressway in New York utilizes “drag net”
devices (chain link fence with run-out cables) at on-ramps.
Automatic ramp gates can be used to prevent access to the facility. Washington State
DOT, Colorado DOT and Caltrans have the automatic gates. They work for peak-period ramp
closures, special events or closures due to poor visibility (e.g., fog). Tennessee DOT had an
automated gate system at ramp entrance to I-75 in conjunction with fog warning system in 1992.
However, the gates require frequent and timely maintenance.

57
Wisconsin DOT uses horizontal swing arms as traffic gates where closures are
anticipated to be more frequent.
5.2.4 Ramp-closure Information and Information Media When the decision of closing the on-ramps has been made, the shut-down information needs to
be delivered to the drivers. Most toll road authorities indicated that they apply multiple measures
to convey the ramp-closure information to drivers. Among them, Dynamic Message Signs (DMS)
are the most widely-used media. As shown in Table 5-8 and Figure 5-7, all authorities implement
DMS on their systems. Radio and fixed signs are also in use. As for other communication
channels in service, different authorities have their own strategies.
Table 5-8 Question 6: Media for Ramp-closure Information
How to provide ramp-closure information Domestic International (1) Dynamic Message Sign (DMS) 10 (100%) 5 (100%) (2) Radio 5 (50%) 1 (20%) (3) Fixed Signs 5 (50%) 3 (60%) (4) Other 6 (60%) 3 (30%)
Figure 5-7 Media for Ramp-closure Information
DelDOT closes off cash lanes with MOT. Florida’s Turnpike has maps and 511 services
available for drivers. MDXWay posts their advisories on a website and also distributes the
information via state 511 services. MDTA besides the above-mentioned methods also releases
the traffic conditions through TV and social media like Twitter and Facebook, etc. WV Parkways
0
2
4
6
8
10
12
(1) DynamicMessage Sign
(DMS)
(2) Radio (3) Fixed Signs (4) Other
Cou
nt
Media
Domestic International

58
Authority lets their toll personnel inform drivers at toll booths as well as internet
(www.WV511.org) and social networking. NH Turnpike Bureau also utilizes news media to
transfer the information to drivers.
The Moreas Tollway Concessionaire in Greece sends messages from toll staff to
motorists at plazas. Attica Tollway Operations Authority contacts the media to spread the
information. Olympia Odos Operation S.A. provides the news by both toll collectors and media.
The total percentage of the authorities which provide advice based on specific closure is
half of the authorities involved in the survey (Table 5-9 and Figure 5-8).
Table 5-9 Question 7: Whether Provide Advice Based on Specific Closure Condition
Whether provide advice based on specific closure condition Domestic International (1) Yes 5 (50%) 2 (40%) (2) No 4 (40%) 3 (60%)
Figure 5-8 Whether Advice Provided Based on Specific Closure Condition
For those authorities who provide suggestions to drivers, the advices provided are listed
below:
• DelDOT: Suggestions are based on declared state of emergency.
• Florida’s Turnpike: Traveler information is provided. Unless a clear detour is provided,
information may only include where the closure is, and that motorists need to seek
alternate routes to avoid delays and congestion.
50% 50% Yes
No

59
• Pocahontas 895: Alert the traveling public to the next available exit or travel lane
• MDTA: DMS notifies travelers of the general reason (crash, construction, etc.) and the
specific location of the closure. If the incident is of a long term nature, media advisories
will provide general information intended to assist motorists in making appropriate
decisions.
• KEC: Traffic condition is provided by DMS, traffic advisory radio, Digital Multimedia
Broadcasting (DMB) service.
• Moreas Tollway Concessionaire: Information regarding closure cause, forecast duration
if known is given.
Except two domestic authorities, the others in the survey provided to us information about
whether their procedures change depending on other traffic factors (Table 5-10 and Figure 5-9).
From the results, the factors affecting carrying-out the procedures include:
• Peak hour traffic volumes;
• Estimated duration of incidents;
• Time of day;
• Type of roadway (speed limit, number of lanes, etc.) ;
• Case by case evaluation.
Table 5-10 Question 8: Whether Procedure Changes Depending on Other Factors
Whether procedure changes depending on factors such as speed limit, number of lanes, time of day Domestic International
(1) Yes 4 (40%) 3 (60%) (2) No 4 (40%) 2 (40%)

60
Figure 5-9 Whether Procedure Changes Depending on Other Factors
Examples were given by the authorities. For instance, if the authority has a closure and
diversion at nearest arterial, however if it is approaching a peak hour and/or duration is estimated
to be longer than an hour, the authority may advise motorists to use the nearest expressway to
expressway interchange as a diversion instead of diverting to a signal controlled arterial. This is
not always an option depending on the location of the incident. Another example is that the
MDTA’s FITM plans identify when a particular detour route is preferable over another due to
time of day or vehicle restrictions, presence of large schools or churches, etc.
5.2.5 On-ramp Volume Control Strategy
The implementations of on-ramp volume control strategies are opposite for domestic and
international authorities. Out of the ten domestic toll authorities, only MnDOT has affirmative
response (Table 5-11 and Figure 5-10). It did not give further explanations about the strategies
they employ. KEC controls the on-ramp volume based on the travel speed of the mainline. If the
speed is less than 70km/h (43.5 mph), they operate traffic signal at 30 seconds interval. The
Attica Tollway Operations Authority controls the volume by lifting bars of each toll station. The
Olympia Odos Operation S.A.’s strategy is manually supported by the road patrollers and traffic
police. West Nippon Expressway Company indicated they occasionally apply ramp metering.
Table 5-11 Question 9: On-ramp Control Strategy
Do you have on-ramp control strategy Domestic International (1) Yes 1 (10%) 4 (80%) (2) No 9 (90%) 1 (20%)
54%
46%
Yes
No

61
Figure 5-10 On-ramp Control Strategy
5.2.6 Existing ITS System ITS systems utilize information and communication technologies in road infrastructure, vehicles
and users, and traffic management and operation. The toll authorities were asked about the
current ITS systems that they implement. The results are given in table 5-12 and Figure 5-11.
ETC ranks as number one. The DMS are also heavily used. DMS can be used for
multipurpose. Estimated travel time, congestion, incident, and other warning messages can all be
displayed on DMS. Remote Traffic Management Sensors (RTMS) are radars operating in the
microwave band. They are installed on road-side poles and each one can replace multiple
inductive loop detectors, thus making it very efficient. They can record traffic volume, lane
occupancy, vehicle speed, and aggregate the information on lane basis. Automatic Vehicle
Identification (AVI) systems have been around for a long time. They have proved their accuracy
and reliability in ETC system, and they also play a critical role in traffic surveillance. Travel time
estimation can be derived through the detection or measurement instruments installed along the
roadway such AVI, RTMS, loop detectors, etc. Active traffic management incorporates variable
speed limits, hard-shoulder running, queue warning and ramp-metering. These strategies aim at
smoother traffic flow and lower congestion. Recently researchers at UCF showed substantial
safety benefits of Active Traffic Management. Other systems reported by these agencies involve
radio advisory system and advanced patrolling system.
0123456789
10
Yes No
Cou
nt
Domestic
International

62
Table 5-12 Question 10: Current ITS Systems on Roadways
What ITS system do you use on roadways Domestic International (1) Automatic Vehicle Identification (AVI) 6 (60%) 1(20%) (2) Dynamic (Changeable or Variable) message signs 9 (90%) 5 (100%) (3) Remote Traffic Management Sensors 8 (80%) 3 (60%) (4) Active Traffic Management 3 (30%) 3 (60%) (5) Travel time estimation 6 (60%) 2 (40%) (6) Electronic Toll Collection (ETC) 10 (100%) 5 (100%) (7) Other 1 (10%) 1 (20%)
Figure 5-11 Current ITS System on Roadways
The following table (Table 5-13) summarizes the ITS systems used on each authority’s
roadway. The other ITS systems the authorities suggested include CB Radio Advisory System,
which focuses on commercial traffic with the intent of allowing truck operators to prepare for the
conditions ahead; Supervisory Control and Data Acquisition (SCADA) system for tunnel and
other M&E (Monitoring and Evaluation) equipment control and monitoring.
0
2
4
6
8
10
12
(1) AVI (2) DMS (3) RTMS (4) ATM (5) Traveltime
estimation
(6) ETC (7) Other
Domestic
International

63
Table 5-13 Existing ITS Systems Implemented by Toll Authorities
Toll Authority ITS systems
Domestic
Delaware Division of Motor Vehicles 2, 3, 6 Florida's Turnpike Enterprise 1, 2, 3, 5, 6, 7 Pocahontas 895 6 Miami-Dade Expressway Authority 2, 3, 5, 6 Maryland Transportation Authority 1, 2, 3, 4, 5, 6 Richmond Metropolitan Authority 1, 2, 6 West Virginia Parkway Authority 1, 2, 3, 6 Minnesota Department of Transportation 2, 3, 4, 5, 6 New Jersey Turnpike Authority 1, 2, 3, 5, 6 New Hampshire Turnpike Bureau 1, 2, 3, 4, 5, 6
International
Korean Expressway Corporation 2, 3, 5, 6 Moreas Tollway Concessionaire 2, 4, 6, 7 Attica Tollway Operations Authority 2, 4, 6 Olympia Odos Operation S.A. 1, 2, 3, 4, 6 West Nippon Expressway Company, Ltd. 2, 3, 5, 6
* The number shown above corresponds to the ITS systems in the survey question No.10
5.2.7 Average Spacing between Ramps
The spacing between two adjacent ramps heavily relies on the area (rural/urban) where the road
segment is located. Normally, a rural road section will have less access and the spacing between
ramps will be much longer than that in urban areas. In the questionnaire results, DelDOT
reported that the distance between their only two ramps is 12 miles. Florida’s Turnpike has 136
interchanges and 460 centerline miles, this calculates to an average interchange spacing of 3.5
miles. Nevertheless, in the most rural section of the Turnpike, the average interchange spacing is
44 miles (Exit 152, Exit 193, and Exit 240 = 88 centerline miles with only 3 interchanges).
Virginia’s Pocahontas 895 system has an average ramp spacing of 3 miles. MDXWay operates
their roadway with an average of 1 mile interval of ramps. MDTA indicated that on urban
Interstate facilities they manage, the spacing is less than one mile in some locations. On rural
portions, the spacing is closer to three miles or more. On RMA’s system, the spacing between
ramps ranges from 0.5 to 1 mile. WV Parkways Authority reported a 5 to 6 miles ramps interval.
MnDOT has an average of 1 mile ramp interval on their road. NH Turnpike Bureau stated that
the interval on their system depends on the location (rural/urban). The results from international
responses show that the average distances between two ramps are: 5.43 miles (KEC, Korea), 6.2

64
(Moreas Tollway Concessionaire, Greece), 4 or 5 miles (Attica Tollway Operations Authority,
Greece), 4.48 miles (Olympia Odos Operation S.A., Greece), 15 miles (West Nippon
Expressway Company, Japan).
5.3 Experience and Ideas on Safety and Traffic Management
At the end of the questionnaire, we asked the toll authorities to share their experience and
ideas about safety and/or traffic management on their systems. Table 5-14 lists the suggestions of
domestic toll authorities and Table 5-15 of international authorities.
Table 5-14 Domestic Toll Authorities on Safety and/or Traffic Management
Toll Authority Suggestions
Florida's Turnpike Enterprise
The Turnpike’s Traffic Management Center (TMC) is very pro-active in incident management and utilizes tools such as the Road Ranger program, RISC (Rapid Incident Scene Clearance) program, STARR (Specialty Towing and Roadside Repair) program. In addition, the Turnpike TMC coordinates well with other agencies including the districts, toll authorities, media, etc.
In terms of safety, the traffic engineering group reviews every fatal crash that occurs on the system and performs numerous safety analyses for projects and traffic safety initiatives on behalf of the Turnpike.
Pocahontas 895
Pocahontas 895 is a lightly traveled road, so little is needed in terms of traffic management. The authority does have roadway cameras to monitor for traffic issues. Safety is a top concern and they employ the DMS and fixed signage to convey safety information.
Miami Dade Expressway Authority
System wide DMS deployment about to commence. Road Rangers fleet contains DMS boards, system wide camera surveillance for incident management.
Maryland Transportation
Authority
Technology and traffic conditions are changing rapidly and require constant partnership between operations, enforcement, engineering, maintenance and construction teams. For optimal results all parties must support common goals.
West Virginia Parkways Authority
The WV Parkways Authority has an emergency detour plan in place with permanent signage and a standard operating procedure in place, which can be applied to each section of the highway, in the case that an emergency closure of the highway is needed.
Minnesota Department of Transportation
MnDOT have a High Occupancy Lane (HOT, MnPASS lane) in Minnesota on two of our corridors, I-394 and I-35W, both have direct connects into downtown Minneapolis. Our tolling is passed on dynamic pricings so the system is totally automated. The price of the toll can range from .25$ to $8.00 with the average around $1.75. The tolling is from 6-10am and 2-7pm.
New Hampshire Turnpike Bureau
NH Turnpike utilizes the DOT Traffic Management Center to communicate construction activity, accidents, and other

65
Table 5-15 International Toll Authorities on Safety and/or Traffic Management
Toll Authority Suggestions
Korean Expressway Corporation
To alleviate traffic congestion, the authority operates Lane Control System (LCS) in the metropolitan region. It uses right shoulder as driving way, if travel speed of main-line is less than 70km/h.
Moreas Tollway Concessionaire
ITS system is complemented by field personnel (patrol/intervention teams) in order to ensure coverage of incidents on segments (between interchanges) where CCTV and other ITS field equipment is not present.
Attica Tollway Operations Authority
Queue Warning, Junction Control, Dynamic Re-routing Information, Truck Restrictions, Ramp Metering
Olympia Odos Operation S.A.
On an interurban corridor under construction, close cooperation between all parties (constructor, operator, police, state administration) is needed. It is also quite vital to integrate the alternative routes to the relevant traffic management plans.
5.3.1 Response from Belgium On Tunnel Liefkenshoek’s system, open tolling only and combination of open tolling and plazas
coexist. In case of total shut-down of the mainline travel lanes, the authority will re-route and
detour the vehicles. Fixed signs are used to provide drivers with ramp-closure information. The
authority confirmed that their advice to drivers depend on the specific closure condition and the
closure procedure varies according to factors such as speed limit, number of lanes, time of day,
etc. without further information. The ITS systems employed on their system include AVI and
RTMS.
A universal kilometer charging system will be introduced in 2016 by PMO Duurzame
Mobiliteit. The system is planned to be an “open tolling only” system where no physical
obstacles (barriers, toll plazas) will be present. The ITS systems that are expected on the road
system are AVI, DMS, RTMS, Active Traffic Management, ETC, and travel time estimation.
Ramp closure practices and procedures are not available at this stage. The authority stated that
safety/traffic management is foreseen within the normal road operations.
5.4 Toll Plaza Modified Operations Plan for Closures and Waivers The ETC system of DelDOT can be temporarily turned off in the event an emergency
response requires the use of the toll plaza for routing traffic around an incident in order to get
through the area.
Suspended toll payment conditions include:

66
• Natural and man-made disasters • Major traffic incidents • HAZMAT spills (hazardous material spill) • Special events
Under one of the above four conditions, incident responses are needed. Some of the
response guidelines can serve as guidelines for ramp closures. In the response guidelines,
DelDOT suggests the districts should pre-position resources to their appropriate staging areas
according to the traffic control plan. The incident responder at the scene will shut down traffic
through the area and activate the appropriate detour. DMS and portable DMS are recommended
to display traveler messages in the area to alert motorists to the current conditions.
To carry out the procedures, traffic control point should be identified. The traffic control
point location is staffed to ensure the continued movement of traffic inside or outside an area of
risk during an emergency or disaster. The equipment for the traffic control includes: traffic cones,
traffic barricades, arrow boards, DelDOT trucks, DMS, and exit signs.
5.5 Preliminary Statistical Tests Results Preliminary statistical tests have been applied. Since the sample size is small, Fisher’s exact test
is applied. Test results on Question 1 reveal that the domestic and international choices of toll
collection system differed greatly (p=0.022). For Questions 3 and 4, test also indicates that the
procedures that the authorities implement do not vary significantly no matter frontage road is
available or not (p=0.8785). Paired t-test shows no significant of difference between domestic
and international selections of these procedures (t value = 0.64, p=0.544). The selections of
media to distribute information to drivers are also similar in Question 6 (t value = 1.21, p=0.312)
for domestic and international authorities. For Question 7 whether the authorities provide advice
based on the specific closure condition and Question 8 if the procedure changes depending on
factors such as speed limit, number of lanes, time, etc., Fisher’s tests confirms that no significant
distinctions have been found between the United States and other countries. In contrast, the
international application of ramp control strategy is much higher than that of the United States (p
value = 0.017). Finally, current ITS systems on each authority’s roadway have been examined. It
shows that the usage of the ITS systems listed in Question10 has similar pattern both at home
and abroad.

67
5.6 Summary and Conclusions
To better understand how the toll and turnpike authorities deal with total shut-down of the
mainline travel lanes, a questionnaire composed of twelve short questions was developed and
distributed to domestic and international toll authorities. In total, ten domestic responses from
eight states and seven international responses from three countries have been received.
The results of the survey are summarized. For the questions, some have only one
appropriate option that a toll authority is able to choose while others might have multiple
applicable options. Some authorities skipped certain questions in the absence of concrete
information. In all, the toll authorities participating in the survey shared precious information as
how they manage their system during a total shut-down of the mainline traffic lanes.
In the survey, it is reported that the combination of open tolling and plazas is the
predominant toll collection method in the United States. The implementation of open tolling is
also becoming more common overseas. When total shut-down of the mainline travel lanes occurs,
almost all domestic and international authorities claimed they have practices for closing on-
ramps. The practices are found not varying significantly with or without the presence of frontage
road. In most cases, the practices are carried out on a case by case basis. Authorities reported that
they would also re-route vehicles to downstream ramps or detour them to other surface streets.
Other specific strategies adopted by these authorities are reported, such as Florida’s Turnpike’s
SOP, Maryland Transportation Authority’s FITM plans and WV Parkways Authority’s
emergency detours.
An additional question was designed and sent to the toll authorities to gain insight on
how they close ramps in case of total shutdown. Six domestic and three international authorities
responded us with detailed information as how they close the ramps and the equipment they
implement closing the ramps.
Even when no procedures or practices are available for on-ramp closing, the authorities
still gave confirmative responses that they provide information to motorists. The media to
convey the information to drivers includes DMS, radio, fixed signs, and others like maps, TV,
websites, telephone (511 systems), and toll personnel, etc. Furthermore, if available, the

68
authorities send drivers detailed information about the cause of the shut-down, the location and
expected duration of the closure, and where the alternative routes would be. As for potential
factors affecting the procedures, the authorities pointed out that these factors can be the peak
hour traffic volumes, time of day, types of roadway (speed limit, number of lanes), and estimated
duration of incidents.
Despite the on-ramp closing procedures applied during shut-down of the mainline travel
lanes, on-ramp volume control strategies are not common in the United States. For international
countries, in contrast, certain forms of control practices have been reported by most of the
authorities.
From the survey, each authority’s system is equipped with multiple ITS systems.
Electronic Toll Collection, Dynamic Message Signs, Remote Traffic Management Sensors, and
Automatic Vehicle Identification systems are prevalent. Some other ITS systems like CB Radio
Advisory System, and Supervisory Control and Data Acquisition systems are also in use.
At the end of the survey, the toll authorities shared their experience and ideas about
safety and/or traffic management on their systems.

69
6 TRAFFIC SAFETY EVALUATION Traffic safety is also an important indicator of expressway performance and significantly related
with operation. On the one hand, turbulence in traffic flow will cause variation in traveling speed
thus posing risks to motorists. On the other hand, traffic crashes can reduce the roadway capacity
temporarily and lead to delay and congestion. Therefore, improvement in operation will have
positive effects on traffic safety and the same effects on operation are expected by improving
traffic safety. Traffic crash data from January 2011 to June 2014 were collected to evaluate the
traffic safety conditions on the expressway system. Selection of this time period is partly because
the issue of data completeness with 2010 crashes. In the data preparation section, it has been
explained that from July 2012 the crash records in S4A data is complete for whole Florida. As
for Orange County, by checking the number of crashes as shown in Table 6-1, the research team
also included data from 2011 since the total crash numbers of these years are comparable. All the
data used in the safety analysis is from S4A database.
6.1 Crash Data Preparation The crashes contained in S4A are geocoded data with longitude and latitude information.
Nevertheless, crash direction, and roadway milepost are not available. To locate these crashes
and assign the direction and milepost information to these crashes, a Geographic Information
System (GIS) network specifically for the expressways is created using ArcGIS. The original
GIS data is downloaded from FDOT website. The research team made adjustment to keep only
the expressways as shown in Figure 6-1.
Table 6-1 Crash Data Preparation for CFX Expressway System
Year Orange County Crashes
Expressway Mapped Crashes
Expressway Unmapped
Crashes
SR 408 Crashes
SR 414 Crashes
SR 417 Crashes
SR 429 Crashes
SR 528 Crashes
2011 32026 1379 52 666 30 337 83 263 2012 35847 1375 88 626 25 369 78 277 2013 40476 1484 79 700 40 355 76 313
2014 (Jan -- Jun) 21322 859 35 361 35 218 67 178
As seen in Table 6-1, a small portion of crashes during each year were unmapped and
could not be located. The research team referred to the original crash report for indications of
crash location and found several issues that might cause this issues. First of all, these unmapped
crashes lacked the coordinate information and were assigned with the location (0, 0). Second, the

70
description of these crashes was unclear therefore the location could not be identified. For
instance, one crash was described as “near Holland Toll Plaza” for which the toll plaza could not
be found on SR 408. Third, some crashes have conflicting descriptions about the crash site such
as that the crash street is recorded as SR 408. However, in the narrative part the police officer
described that the crash was on SR 414. In conclusion, these crashes were not used for the safety
analysis.
Figure 6-1 Expressway Network in GIS
To locate the crashes on the expressways, the crashes occurring within Orange County
during one year period were selected in the first place as shown in Figure 6-2. Then an initial
selection of crashes on the expressways was conducted. In the crash report, there is one column
indicating the crash street based on which crashes on expressways could be collected. However,
the naming of the expressways is not consistent. As a solution, several key words that can be
used for the same expressway were extracted using the Structured Query Language (SQL)
technique as shown in Table 6-2. The “%” means any string of zero or more characters and “_”
means any single character within the string in SQL. Using these criteria, the initial selection was
made as displayed in Figure 6-3.

71
Figure 6-2 Total Crashes of Orange County in 2011
Table 6-2 Key Words Used for Expressway Crash Selection
Expressway Key Words SR 408 “%408%”, “%E-W%”, “%E/W%”, “%EAST_WEST%”, “EW %”, “%EASTWEST%” SR 414 “%414%”, “%APOPKA EXPY%”, “%JOHN LAND%”, “%MAITLAND BLVD%” SR 417 “%417%”, “%CENTRAL_FL%”, “GREENEWAY” SR 429 “%429%”, “%BELTWAY%”, “%WEBSTER%” SR 528 “%528%”, “%BEELINE%”, “BEACHLINE”
As can be seen in Figure 6-3, the majority of the crashes after the initial selection are
located on the expressways. A few of the crashes that are not related to the expressways were
also included because they share the same key words that are used to filter the expressway
crashes. In addition, some crashes on the expressways occurred on the segments that are not
operated by CFX. These crashes would also not be included in further analysis. Therefore a final
selection based on the roadway segments that are operated by CFX was executed. The roadway
information for each expressway was archived in FDOT Interchange Report (30). It should be
noted that this report is last updated in 2012 therefore a few sections that underwent changes
might not be reflected in Table 6-3. For northern segment used to be part of SR 429 is now SR
451. And currently SR 414 and SR 429 share one segment together. Therefore SR 414 now
extends for 9.62 miles. The interchange of SR 408 and SR 417 was changed during these time

72
period, thus the segment from MP 16.649 to MP 17.090 no longer exists. For the other parts of
the system, most segments remain the same.
Figure 6-3 Initial Selection of Expressway Crashes in 2011
Table 6-3 Expressway Segment and Operation Authority
Route County Roadway ID Local Milepost Cumulative Milepost Authority SR 528 Orange 75471000 00.000 – 08.421 00.000 – 08.421 Florida's Turnpike
75002000 07.944 – 30.341 08.421 – 30.818 CFX
75005000 00.000 – 04.957 30.818 – 35.775 Florida's Turnpike
Brevard 70007000 00.000 – 09.956 35.775 – 45.731 Florida's Turnpike
70070000 05.200 – 12.968 45.731 – 53.499 Florida's Turnpike SR 408 Orange 75474000 00.000 – 00.759 00.000 – 00.759 Florida's Turnpike
75008170 01.417 – 05.132 00.759 – 04.474 CFX
75008000 00.382 – 11.852 04.474 – 15.944 CFX
75008160 00.000 – 06.260 15.944 – 22.204 CFX SR 414 Orange 75340000 00.000 – 09.620 00.000 – 09.620 CFX SR 417 Osceola 92472000 00.000 – 02.906 00.000 – 02.906 Florida's Turnpike
Orange 75472000 00.000 – 02.192 02.906 – 05.098 Florida's Turnpike
75301000 00.000 – 20.017 05.098 – 25.115 CFX
75300000 00.000 – 11.501 25.115 – 36.616 CFX
77470000 00.000 – 17.445 36.616 – 54.061 Florida's Turnpike SR 429 Osceola 92473000 00.000 – 04.528 00.000 – 04.528 Florida's Turnpike
Orange 75473000 00.000 – 05.325 04.528 – 09.853 Florida's Turnpike
75320000 18.000 – 40.000 09.853 – 31.853 CFX

73
The results of the final selection are illustrated in Figure 6-4. In this figure, the crashes
not related to expressways and those crashes not occurring on segments operated by CFX have
been excluded. In the final crash data, crashes on the mainline, ramps and toll plaza cash lanes on
the segments managed by CFX are selected. Figure 6-5 shows the detail about how these crashes
are assigned. Both crash direction and mileposts are assigned to the crashes using ArcGIS. For
each year, the same process was repeated to extract the expressway crash data from 2011 to June,
2014. The crash count for each expressway in each year is shown in Table 6-1. SR 408 has the
most crashes and SR 414 has the lowest crash count during each year. SR 417 has slight more
crashes than SR 528. Several factors can contribute to the crash pattern on the expressway
system. SR 408 is the spine of the system and carries the most traffic. SR 417 and SR 528 have
relatively long segment length. However, the eastern part of SR 528 is located in suburban area,
thus lighter traffic on this segment lead to fewer crashes compared with SR 417. SR 414 is the
shortest of the five expressways and most crashes on SR 414concentrate near the eastern end of
the roadway segment.
Figure 6-4 Final Selection of Expressway Crashes in 2011

74
Figure 6-5 Crash Match on Mainline, Ramp and Toll Plaza Cash Lanes
6.2 Expressway Safety Overview Traffic safety can be viewed by the type of lanes on which the crashes occurred since the crash
mechanism on these types of lanes can be distinct. On the expressways, there are three types of
lanes, namely the mainline including toll plaza express lanes, toll plaza cash lanes, and ramps.
Table 6-4 displays the crashes by the types of lane for each expressway in 2011. Table S-1 to
Table S-3 show the same information for other years.
For SR 408, most of the crashes occurred on the mainline. For SR 414, ramps have more
crashes than the mainline. On SR 417, in 2011 and 2012, mainline has the most crashes. In 2013
and the first half of 2014, crash count on ramps exceed the crashes on the mainline on SR 417.
SR 429 has slightly more crashes on the mainline. On SR 528, the majority of crashes occurred
on the mainline.
Table 6-4 Expressway Crash by Type of Lane in 2011
Expressway Total Crash Mainline Toll Plaza Cash Lane Ramp SR 408 666 476 20 170 SR 414 30 10 0 20 SR 417 337 204 15 118 SR 429 83 56 3 24 SR 528 263 208 13 42

75
Figure 6-6 and Table 6-5 show the crash count on SR 408 by the type of lanes in the three
and half years. The trend is relatively stable without significant changes. For each type of crashes,
there is a small increasing in the number of crashes at mainline toll plaza cash lanes on SR 408.
For SR 414, ramp crashes are the major crash type on the expressway as shown in Table T-1 and
Figure T-1. There is also an increasing trend in the total number of crashes on SR 414. This
might be because that in 2012, the construction of SR 414 had not yet been completed. As a
result, in 2013 and 2014, more crashes are expected on the whole segment of SR 414 when the
construction is finished. On SR 417, there is a decreasing trend of mainline and toll plaza crashes
during the past years (shown in Table T-2 and Figure T-2). However, the crashes on ramps are
increasing. Crashes on SR 429 decreased trend from 2011 to 2013. However, in the first half
year of 2014, the crash count is close to the number of crashes for the whole year of 2013 on SR
429 (Table T-3 and Figure T-3). On SR 528, there is also steady increase in crashes, with a
reduction of toll plaza crashes (Table T-4 and Figure T-4). Since complete 2014 crash data are
not available at this moment, only the first six months are used.
Figure 6-6 SR 408 Crash Count by Year

76
Table 6-5 SR 408 Annual Crash Count by Type of Lane
Lane Type Year 2011 2012 2013 2014 (Jan -- Jun)
Total Crash 666 626 700 361 Mainline 476 402 492 239
Toll Plaza Cash Lane 20 27 32 19 Ramp 170 197 176 103
Generally speaking, the crash trend is stable over the time period for SR 408 and SR 417.
SR 414 and SR 528 have small increase while crashes on SR 429 decreased. Since the complete
crash data for 2014 are unavailable currently, only the data of the first half year are used.
However, according to the six-month data, it is expected that in 2014 the crashes would increase.
This potential increase is probably due to the recovered economy or other reasons that are not
significant at this moment.
In addition to the general safety performance of CFX expressways in the recent three and
half years, the CFX system performance against other turnpike authorities was compared using
the 2012 mainline crashes data. In the safety performance comparison, the total crash counts are
useful indicators of the safety condition (and sometime even the operation condition) of a
particular location. However, due to the variation in roadway lengths, the traffic conditions, etc.,
comparing traffic safety levels between different routes based on crash frequency can be
misleading. Crash rates for each expressway during one year combine crash frequency and
vehicle exposure in evaluating the roadway safety:
𝑅 = 𝐶×100,000,000𝑉×365×∑𝐿𝑖
(4)
The variables in equation (4) are defined as:
𝑅 = Roadway Departure crash rate for the road segment expressed as crashes per 100 million vehicle-miles of travel (MVMT),
𝐶 = Total number of roadway departure crashes in the study period
𝑉 = Traffic volumes using Average Annual Daily Traffic (AADT) volumes
𝑁 = Number of years of data

77
𝐿 = Length of the roadway segment in miles
In the above equation, 𝐴𝐴𝐷𝑇 is used as traffic volume indicator. 𝐴𝐴𝐷𝑇 for the
expressway is derived according to the segment AADT and segment length.
𝐴𝐴𝐷𝑇 =∑(𝐴𝐴𝐷𝑇𝑖 × 𝐿𝑖)
∑𝐿𝑖
Where 𝐴𝐴𝐷𝑇𝑖 is the 𝐴𝐴𝐷𝑇 for segment 𝑖, 𝐿𝑖 is the length of the 𝑖𝑡ℎ segment. Crash rates in 2012
for major toll expressways across Florida were compared as shown in Table 6-6.
Table 6-6 Crash Rates in 2012 on Toll Expressways in Florida
Rank ROUTE Local Name Crash Count Length AADT Crash Rate (100MVMT)
1 SR 836 DOLPHIN EXPRESSWAY 1536 10.596 147706.71 268.87856
2 SR 821 HEFT 1779 47.572 88975.07 115.14984 3 SR 589 VETERANS EXPY 213 11.458 54591.91 93.293123
4 SR 408 (CFX) SR-408 402 22.591 66346 73.482342
5 SR 568 VETERANS EXPY 8 3.036 10418.18 69.295255 6 SR 91 TURNPIKE 3035 262.678 46607.47 67.918268
7 SR 408 (TURNPIKE) SR-408 7 0.759 38100 66.319069
8 SR 869 SAWGRASS EXPY 302 20.809 64114.71 62.016205
9 SR 528 (CFX) BEACHLINE 202 22.376 44547.5 55.520416
10 SR 417 (CFX) SR-417 193 31.518 37650.68 44.558747
11 SR 528 (TURNPIKE) BEACHLINE 171 24.242 44011.34 43.910685
12 SR 618 SELMON EXPY 83 14.132 37194.42 43.261723
13 SR 589 SUNCOAST PKWY 108 41.449 17611.24 40.534694
14 SR 417 (TURNPIKE) SR-417 103 22.543 32962.68 37.97608
15 SR 93 ALLIGATOR ALY 118 49.2 18017.2 36.470082
16 SR 429 (TURNPIKE) SR-429 12 9.853 10765.07 30.995814
17 SR 570 POLK PKWY 37 24.38 16166.23 25.71973
18 SR 429 (CFX) SR-429 43 20.404 21621.89 26.703404
19 SR 93 I-75 42 25.783 21753 20.516526
20 SR 414 (CFX) SR-414 6 5.662 15100 19.227002

78
According to the table above, among the toll and turnpike authorities' system across
Florida, CFX's expressway system has relatively good safety performance in terms of crash rate.
Compared with SR 836, SR 821, both of which travel through downtown Miami, and SR 589 in
Tampa metropolitan area, SR 408 extends through downtown Orlando, but has a lower crash rate.
Segments of SR 417 and SR 528 operated by CFX have the crash rates at median level. Crash
rate for SR 429 segment on CFX's system is among the lowest.
6.3 Categorical Analysis of Expressway Mainline Crashes More insights of the traffic safety conditions on expressways can be viewed through detailed
categorical analysis of crashes. Crash type is one of the most important factors to understand the
characteristics of crashes. On the mainline of the expressways, multiple types of crashes are
recorded. The most common types include rear end crashes, off -road crashes, sideswipe crashes,
rollover crashes and animal crashes. For some crashes that cannot be classified into these
common crash types, they are recorded as “Other”. Some other crashes that miss the crash type
information are recorded as “Unknown”. Table 6-7 shows the crash count in each year on the
five expressways by types of crashes. On SR 408, rear end crashes are the most common type of
crashes followed by off-road and sideswipe crashes. Off-road crashes are the majority crash type
on SR 414, SR 417 and SR 429. On SR 528, the number of rear-end crashes are similar to the
number of off-road crashes from 2011 to 2013. Furthermore, SR 417 and SR 528 have relatively
more animal related crashes compared to other expressways. This might be because part of both
SR 417 and SR 528 travel in the suburban areas around Orlando. By identifying the major
crashes on each expressway, corresponding safety countermeasures can be proposed.
By investigating into the number of vehicles involved in a crash, it is found that on
SR408, SR 417 and SR 528 most of the crashes are multi-vehicle crashes as shown in Table 6-8.
SR 414 and SR 429 have single-vehicle crashes. Of the multi-vehicle crashes, most of the
crashes involve two vehicles. On SR 408, the number of crashes involving more than two
vehicles is significantly higher than other expressways. This can be partly explained by the
heavy traffic load on SR 408. From the results of congestion evaluation, it is known that SR 408
has the higher congestion intensity compared with other expressways. In congested traffic flow,
the turbulence of speed is more likely to cause multi-vehicle crashes.

79
Table 6-7 Crash Types by Expressway and Year
Expressway Year Crash Type Total Rear End Off-Road Sideswipe Rollover Animal Other Unknown
SR 408
2011 191 125 74 11 5 38 32 476 2012 185 72 63 8 1 36 37 402 2013 245 93 79 5 1 44 25 492 2014
(Jan -- Jun) 130 34 49 1 0 16 9 239
SR 414
2011 1 6 1 0 0 2 0 10 2012 0 3 2 0 0 1 0 6 2013 2 7 2 0 0 3 0 14 2014
(Jan -- Jun) 4 6 2 0 0 2 0 14
SR 417
2011 46 63 33 9 4 29 20 204 2012 43 63 34 12 5 31 5 193 2013 42 41 25 8 2 27 7 152 2014
(Jan -- Jun) 25 33 13 2 1 23 6 103
SR 429
2011 11 18 4 7 2 12 2 56 2012 5 16 5 3 1 11 2 43 2013 12 19 7 2 0 6 1 47 2014
(Jan -- Jun) 12 14 6 3 0 12 2 49
SR 528
2011 74 72 22 3 5 19 13 208 2012 79 50 23 7 3 24 16 202 2013 88 71 30 14 11 16 12 242 2014
(Jan -- Jun) 60 30 28 4 1 18 2 143
Table 6-8 Number of Vehicles Involved in Crashes by Expressway and Year
Expressway Year Number of Vehicles Involved Total 1 2 3 ≥ 4
SR 408
2011 136 292 38 10 476 2012 75 266 47 14 402 2013 91 337 45 19 492
2014 (Jan -- Jun) 32 162 40 5 239
SR 414
2011 7 2 0 1 10 2012 4 2 0 0 6 2013 7 6 1 0 14
2014 (Jan -- Jun) 8 6 0 0 14
SR 417
2011 77 111 15 1 204 2012 83 96 10 4 193 2013 59 82 9 2 152
2014 (Jan -- Jun) 37 60 4 2 103
SR 429
2011 34 21 0 1 56 2012 25 16 2 0 43 2013 21 20 5 1 47
2014 (Jan -- Jun) 25 20 4 0 49
SR 528
2011 84 98 20 6 208 2012 64 113 21 4 202 2013 95 126 13 8 242
2014 (Jan -- Jun) 39 84 17 3 143

80
Crash severities on the expressways in Table 6-9 indicate that the expressways have few
fatal crashes in the past three and half years. This result implies relatively good safety
performance of the expressways from the perspective of social and economic losses. Most of
crashes on the expressway are property damage only crashes. Since SR 408 has the most crashes
in total, the number of injury related crashes on SR 408 is also the highest. Nevertheless, the
percentages of injury crashes in the total crashes on each expressway are similar.
Considering the weather effects on traffic safety, Table 6-10 shows that crashes under
clear weather condition are still the majority of the crashes. Crashes in rainy weather are the
second largest group of all. However, compared the probability of clear and rainy weather, it
should be interpreted as that rainy weather could increase the likelihood of crash occurrences.
Under rainy condition, both road friction and drivers’ visibility will be affected by precipitation.
Fog/smoke related crashes also exist during the studied time period but take only very small
portion.
Table 6-9 Crash Injury Severity by Expressway and Year
Expressway Year Crash Severity Total Property Damage Only Injury Fatality
SR 408
2011 346 128 2 476 2012 287 114 1 402 2013 323 166 3 492
2014 (Jan -- Jun) 172 67 0 239
SR 414
2011 3 7 0 10 2012 5 1 0 6 2013 9 5 0 14
2014 (Jan -- Jun) 10 4 0 14
SR 417
2011 146 57 1 204 2012 142 51 0 193 2013 99 53 0 152
2014 (Jan -- Jun) 80 23 0 103
SR 429
2011 33 23 0 56 2012 28 15 0 43 2013 32 15 0 47
2014 (Jan -- Jun) 34 14 1 49
SR 528
2011 136 71 1 208 2012 137 63 2 202 2013 173 67 2 242
2014 (Jan -- Jun) 88 55 0 143

81
Table 6-10 Weather Condition of Crashes by Expressway and Year
Expressway Year Weather Condition Total Clear Cloudy Rain Fog/Smoke Missing
SR 408
2011 304 67 93 5 3 472 2012 268 63 62 3 6 402 2013 332 78 77 1 4 492
2014 (Jan -- Jun) 170 31 37 1 0 239
SR 414
2011 3 1 6 0 0 10 2012 4 0 2 0 0 6 2013 3 4 6 0 1 14
2014 (Jan -- Jun) 6 2 6 0 0 14
SR 417
2011 131 36 33 4 0 204 2012 138 27 26 2 0 193 2013 92 35 24 1 0 152 2014 57 24 21 1 0 103
SR 429
2011 40 5 11 0 0 56 2012 24 11 7 1 0 43 2013 26 12 9 0 0 47
2014 (Jan -- Jun) 31 11 6 1 0 49
SR 528
2011 134 31 40 1 2 208 2012 124 28 45 1 4 202 2013 130 53 54 2 3 242
2014 (Jan -- Jun) 91 29 20 3 0 143
Lighting conditions can also affect traffic safety on the expressways. In the crash reports,
five categories about the lighting conditions are available. The five categories are dawn, daylight,
dusk, dark lighted and dark not lighted. A few records of crashes have missing lighting condition.
In the dark condition, most crashes on SR 408 and SR 414 are recorded as “dark lighted”
condition (Table 6-11). On SR 417, SR 429 and SR 528 have significant more crashes with “dark
not lighted”. The results are related to the location of the expressways. On the segments located
in the urban area, light poles are commonly installed. However, on the less traveled segments in
the suburban area, there might not be adequate light poles.
Road surface conditions have impact on the friction between pavement surface and the
tires thus affecting crash likelihood. After evaluating the recorded road surface conditions when
crashes occur, the research team found high percentage of wet pavement related crashes as
displayed in Table 6-12. For SR 408 and SR 417, there is small trend of decrease in wet
pavement related crashes. While for SR 429 and SR 528, the increase trend can be seen. This
pattern poses a challenge to bring down the wet surface related crashes on the two expressways.
The future safety measurement should not overlook this issue.

82
Table 6-11 Lighting Conditions of Crashes by Expressway and Year
Expressway Year Lighting Condition Total Dawn Daylight Dusk Dark Lighted Dark Not Lighted Unknown
SR 408
2011 3 321 11 130 4 3 472 2012 3 291 10 84 8 6 402 2013 11 368 10 98 0 4 491 2014
(Jan -- Jun) 3 191 4 40 1 0 239
SR 414
2011 0 5 1 4 0 0 10 2012 0 5 0 1 0 0 6 2013 0 11 1 2 0 0 14 2014
(Jan -- Jun) 0 10 0 4 0 0 14
SR 417
2011 6 143 7 36 12 0 204 2012 1 122 8 43 19 0 193 2013 2 98 2 42 8 0 152 2014
(Jan -- Jun) 1 78 1 13 10 0 103
SR 429
2011 0 35 3 14 4 0 56 2012 2 24 3 10 4 0 43 2013 0 30 0 11 6 0 47 2014
(Jan -- Jun) 3 33 1 8 4 0 49
SR 528
2011 3 129 12 28 34 2 208 2012 6 137 6 26 21 4 200 2013 7 143 6 48 35 3 242 2014
(Jan -- Jun) 4 93 4 24 18 0 143
Table 6-12 Road Surface Conditions of Crashes by Expressway and Year
Expressway Year Road Surface Condition Total Dry Wet Missing
SR 408
2011 334 135 3 472 2012 306 90 6 402 2013 372 115 4 491
2014 (Jan -- Jun) 184 55 0 239
SR 414
2011 3 7 0 10 2012 4 2 0 6 2013 4 10 0 14
2014 (Jan -- Jun) 8 6 0 14
SR 417
2011 156 48 0 204 2012 150 43 0 193 2013 113 39 0 152
2014 (Jan -- Jun) 70 33 0 103
SR 429
2011 45 11 0 56 2012 31 12 0 43 2013 33 14 0 47
2014 (Jan -- Jun) 40 9 0 49
SR 528
2011 146 60 2 208 2012 133 65 2 200 2013 158 81 3 242
2014 (Jan -- Jun) 100 43 0 143

83
6.4 Spatial Analysis of Expressway Crash With the preliminary categorical analysis of expressway crashes, the more urgent task is to
identify where each of these types of crashes are likely to occur. By identifying the distribution
of these crashes, appropriate treatment could be applied to locations that are impacted by these
specific issues.
For the total crashes on expressway system, the spatial pattern of crashes is examined
through crash density. The spatial distribution of crashes on the mainline, mainline toll plaza
cash lanes and ramps can be found in Figure 6-7 and Figure U-1 to Figure U-3 in Appendix U.
From the figures, the concentration of each type of crashes and the changes in the past three and
half years can be clearly identified. For the mainline crashes, the segment on SR 408 between the
interchange with Semoran Blvd and SR 417 is the most concentrated area of mainline crashes in
2011. After 2011, the mainline crashes began to shift to the interchange of SR 408 and I-4. In the
first six months of 2014, the segment that has the most mainline crashes is near the interchange
of SR 408 and I-4 while the interchange with SR 417 is no longer identified as the hot spot. This
reduction of crashes at the segment near SR 417 might be caused by the interchange
improvement project on this specific interchange. Also, in 2013 and 2014, the segment on SR
528 near the interchange with Semoran Blvd has become a crash hot post. This area is the same
segment that experiences congestion on SR 528. Fewer express lanes and lower speed limit on
the lanes might contribute to the crash occurrence.
The number of crashes on mainline toll plaza cash lanes is relatively small compared with
mainline and ramp crashes. As a result, the crash hot spots were not fixed in these years.
Nevertheless, Pine Hills Mainline Toll Plaza, Conway Road Mainline Toll Plaza on SR 408,
John Young Parkway Mainline Toll Plaza, University Mainline Toll Plaza on SR 417 and
Beachline Mainline Toll Plaza on SR 528 are found to be the toll plazas on the mainline that can
have more crashes on their cash lanes.

84
Figure 6-7 Spatial Pattern of Traffic Crashes by Types of Lane in 2011

85
For the ramp crashes, the similar pattern as mainline crashes on SR 408 can also be
detected. From 2011 to 2013, ramps at the interchange between SR 408 and SR 417 have the
highest crash density. However, this pattern changes in 2014 as that the interchange between SR
408 and I-4 becomes the concentration area of ramp crashes on SR 408. The interchange
between SR 417 and SR 528 is also a major area for ramp crashes. Also, the ramps on SR 417 at
John Young Parkway and Orange Blossom Trail are found to be more likely to have ramp
crashes.
The findings of mainline crashes, mainline toll plaza cash lane crashes and ramp crashes
shows the concentrated locations of each type of these crashes. Also the changes in crash density
on the expressway system are found. The results can be used for potential safety improvement
projects in the future.
Crash density by crash characteristics is also studied as shown in Figure 6-8 and Figure
U-4 to Figure U-6. The patterns found in the four figures are basically the same. The most
important finding is about the distribution of rear end crashes. In the congestion analysis, the
most congested segments of the expressways are located on SR 408 and SR 528. In the safety
analysis, the rear end crashes are found to most likely to occur on these congested segments. This
result confirms the relationship between congestion and rear end crashes, which also highlight
the importance of queue warning using DMS on the expressways.
The spatial distribution of crashes by the number of vehicles involved is similar to the
results found above. Off-road and rollover crashes are more likely to be single-vehicle crashes
while rear end and sideswipe crashes are the crashes involving at least two vehicles. One
interesting trend about the multi-vehicle crashes can be found in Figure 6-9 and Figure U-7 to
Figure U-9. In 2011, the multi-vehicle crashes are more concentrated near the interchange
between SR 408 and SR 417. In the following two and half years, the concentration shifted to the
interchange between SR 408 and I-4. This shows the significant effects of the interchange
improvement project, but also points out the current problematic site for future improvement.

86
Figure 6-8 Spatial Pattern of Traffic Crashes by Crash Type in 2011
By examining the crash severity on the five expressways, it is found that since the fatal
crashes are few, the spatial pattern of fatal crashes can be random as shown in Figure 6-10 and
Figure U-10 to Figure U-12. The characteristics of injury and PDO crashes are relatively easy to
be identified. The distributions of injury and PDO crashes are comparable. SR 408 contains the
most concentrated area for injury crashes which is the congested segment. On SR 528, on the
segment from Beachline Mainline Airport Mainline Toll Plaza to the interchange with SR 417 is
the major area of these two types of crashes.
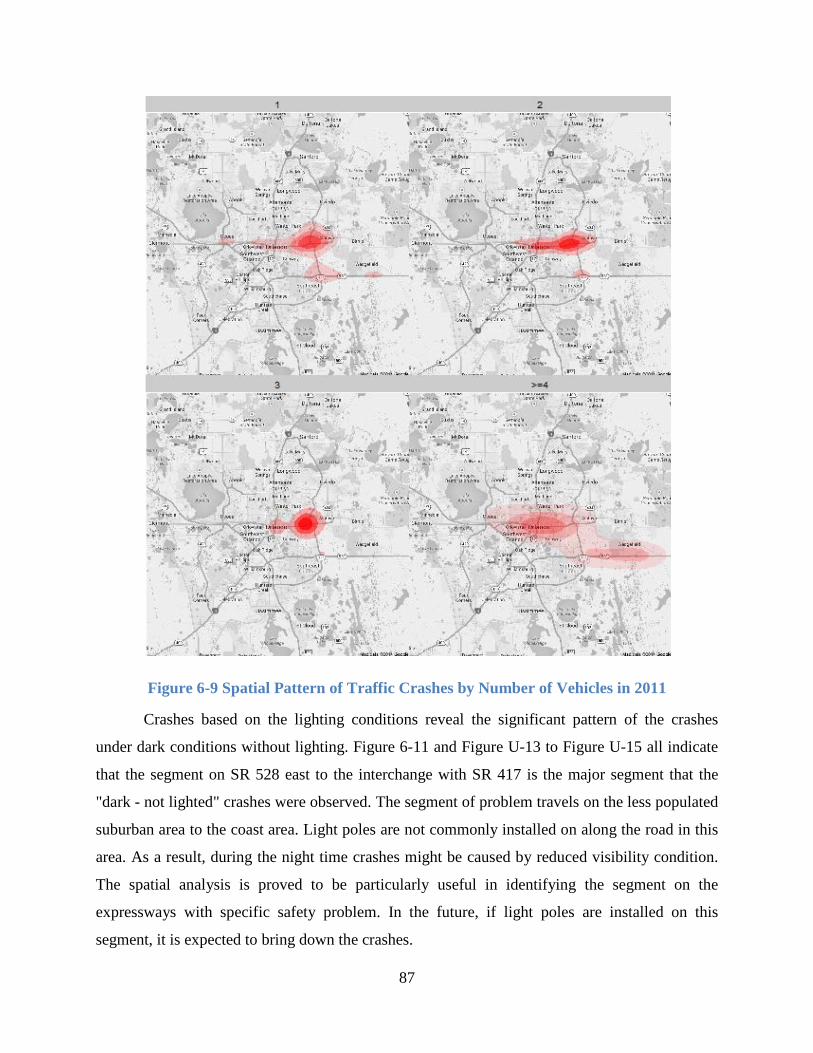
87
Figure 6-9 Spatial Pattern of Traffic Crashes by Number of Vehicles in 2011
Crashes based on the lighting conditions reveal the significant pattern of the crashes
under dark conditions without lighting. Figure 6-11 and Figure U-13 to Figure U-15 all indicate
that the segment on SR 528 east to the interchange with SR 417 is the major segment that the
"dark - not lighted" crashes were observed. The segment of problem travels on the less populated
suburban area to the coast area. Light poles are not commonly installed on along the road in this
area. As a result, during the night time crashes might be caused by reduced visibility condition.
The spatial analysis is proved to be particularly useful in identifying the segment on the
expressways with specific safety problem. In the future, if light poles are installed on this
segment, it is expected to bring down the crashes.

88
Figure 6-10 Spatial Pattern of Traffic Crashes by Crash Severity in 2011
Figure 6-11 Spatial Pattern of Traffic Crashes by Lighting Condition in 2011

89
Weather and road surface conditions are also considered to significantly affect the crash
occurrence. In Figure 6-12 and Figure 6-13, the spatial distributions by weather and road surface
conditions in 2011 are illustrated. It can be shown that under the rainy or wet pavement
conditions, the interchanges are the most affected area. In 2011 and 2012, the interchange
between SR 408 and SR 417 and the interchange between SR 528 and SR 417 have the highest
crash density under rainy and wet pavement condition. In 2013 and 2014, the area on SR 408
moves to the interchange with I-4. The issue with SR 417 -- SR 528 interchange remains the
same. Consequently, improving ramp safety should specifically focus on these two interchanges.
Figure 6-12 Spatial Pattern of Traffic Crashes by Weather Condition in 2011

90
Figure 6-13 Spatial Pattern of Traffic Crashes by Road Surface Condition in 2011
6.5 Temporal Analysis of Expressway Crashes Besides spatial characteristics of the crashes, the temporal properties of the crash distribution are
also evaluated. For each expressway, the total number of crashes is aggregated into each hour of
the day using three and half-year's crash data. All of the five expressways show the drastic
increase of crash frequencies during the peak hours on weekdays. Figure 6-14 indicates that for
SR 408, the morning and evening peak hours have the most crashes during the whole day on
weekdays. Compared with evening peak hours, significantly more crashes occurred during the
morning peak hours. ON SR 414, SR 417 and SR 528 as listed in Appendix W, both morning
and evening have high numbers of crashes. On SR 429, only crashes only increased in the
evening peak hours.

91
Figure 6-14 Temporal Distribution of Traffic Safety on SR 408
With the temporal distribution of the crashes known, the spatial-temporal distributions of
crashes are given to show how the crashes are distributed during different time periods of a day.
Each day is broken into four time periods, the morning peak hours (6:00 AM to 9:00 AM), non-
peak day (9:00 AM to 16:00 PM), evening peak hours (16:00 PM to 19:00 PM) and non-peak
night (19:00 PM to 6:00 AM).
During the morning peak hours, it is found that in 2011 the crashes mainly concentrated
on the interchange between SR 408 and SR 417 as shown in Figure 6-15. Later in 2013 and 2014,
the crash hotspot of morning peak hours is on the interchange between SR 408 and I-4. The same
pattern has been confirmed in several spatial patterns of different crash types in previous section.
Thus it can be stated that the interchange improvement project is significant to bring down
crashes. However, the spatial pattern for evening peak hour crashes remains the same during the
past three and half years. The interchange between SR 417 and SR 528 is the hot spot of evening
peak hour crashes. The reason might be the traffic demand during evening hours on this area
leading to more crashes. In the meantime, the congested segment on SR 528 is a segment where
crashes are more likely to occur as well. The findings prove the close relationship between

92
congestion and safety. In the future, it is best to have improvement projects considering both of
these two aspects together.
Figure 6-15 Spatial-Temporal Distribution of Traffic Crashes in 2011

93
7 CASE STUDY OF INTERCHANGE TRAFFIC SAFETY The above chapter identifies the interchanges as crash concentration areas, especially for the
interchange between SR 408 and SR 417 and interchange between SR 528 and SR 417. At the
interchange, ramps connect the mainline and lead vehicles from one expressway to the other.
Vehicles traveling on ramps often experience significant change of speed and sharp curves,
which could result in traffic safety issues. This report is a case study of ramp traffic safety for the
SR 417 – SR 528 interchange by the request of CFX. The objective of this work is to reveal
crash mechanisms on ramps and identify corresponding safety countermeasures.
7.1 Crash Data Crashes within the SR528-SR417 interchange from August, 2012 to September, 2013 were
collected from the Signal 4 Analytics data base. Figure 7-1 below shows the range of selection.
The range is selected to incorporate all the merging points between on-ramps and mainline and
all the diverging points between off-ramps and mainline. In this way, it is guaranteed that all the
crashes on ramps would be selected. In total, 106 crashes during this time period were geo-coded.
The 106 crashes within the selection range include both ramp crashes and mainline crashes. The
light blue dots stand for property damage only crashes; the blue dots represent injury crashes; the
purple dots are where more than one crashes overlaid.
Figure 7-1 Total Crashes Within the Region of SR 417 -- SR 528 Interchange
In order to uncover the crash mechanisms on ramps, the crashes occurred on mainlines of
SR 417 and SR 429 need to be excluded from the 106 total crashes within the interchange. After

94
selection, 80 crashes occurring on ramps were identified. Figure 7-2 to Figure 7-6 present the
locations of the 80 crashes. The dots in the five figures below indicate the locations of ramp
crashes, of which the lighted ones represent the crashes on a specific ramp. Among the 80
crashes, 37 were on the off-ramp from SR 417 Southbound to SR 528 Westbound (Figure 7-2);
22 crashes were on the ramp from SR 528 Eastbound to SR 417 Northbound (Figure 7-3); 11
crashes on the ramp from SR 417 Southbound to SR 528 Eastbound (Figure 7-4); 7 from SR 528
Westbound to SR 417 Northbound (Figure 7-5). Three crashes were on the ramp from SR 417
Northbound to SR 528 Westbound (Figure 7-6).
Figure 7-2 Ramp SR 417 SB -- SR 528 WB

95
Figure 7-3 Ramp SR 528 EB -- SR 417 NB
Figure 7-4 Ramp SR 417 SB -- SR 528 EB

96
Figure 7-5 Ramp SR 528 WB -- SR 417 NB
Figure 7-6 Ramp SR 417 NB -- SR 528 WB
7.2 Ramp Traffic Safety Overview The distribution of crash time as shown in Figure 7-7 showed that on the ramps at SR 417 – SR
528 interchange, it is more likely to observe a crash from 9:00 AM – 10:00 AM in the morning,
14:00 AM – 16:00 AM in the afternoon, and 17:00 PM – 19:00 PM in the evening. The majority
of the crashes were single vehicle crashes, accounting for 79% of all crashes. Seventeen crashes
involved more than one vehicle (Figure 7-8). No fatalities resulted from these crashes, 11 injuries
were found. Fourteen crashes were distraction related; however, only one of them led to injury.

97
Figure 7-7 Crash Time Distribution
Figure 7-8 Number of Vehicles Involved in Crashes
Out of the 80 crashes, 44 crashes (more than 50% percent) were under the rainy condition
compared with 27 crashes under cloudy and 9 clear condition. This is an unusual high rate for
rain-related crashes, indicating precipitation could drastically increase the crash likelihood.
Further investigation showed that for 25 crashes weather conditions were defined as contributing
factors. What is worth mentioning is that although 44 crashes were recorded as under rainy
weather, the information about road surface condition at the time of crash revealed 71 cases
(89%) had wet surface at the crash time. This pattern indicated that the effect of rain could last
longer. Regarding the light condition, thirteen crashes occurred when it was dark (8 with light,
and 5 without light). Around three quarters of crashes (61 crashes) were recorded to occur during
day light. The collision are recorded as “Angle” (angle crashes), “Front to Rear” (rear-end

98
crashes), “Sideswipe, Same Direction” (sideswipe crashes), “Other” (crashes of other types) and
“Unknown” (crash types unknown). The description about the manner of collision does not give
detailed information about the crashes as 52 and 16 crashes were recorded as “Other” and
“Unknown” respectively. By looking at the crash reports, it was found that among the total 68
crashes coded as “Other” or “Unknown”, most of them were related to hitting the guardrail face
(52 crashes); and others related to concrete traffic barrier, guardrail end, ditch, and fence. The
average estimated property damage amount was about $1,200 with average vehicle damage
amount $4,500 for each crash. Table 7-1 is a summary of potential factors for crashes on ramps.
Table 7-1 Distribution of Environmental, Roadway Factors on Ramps
Variable Levels Ramp Crashes (N=80)
Freq % Road Surface Condition
Dry 9 11% Wet 71 89%
Weather Condition Clear 9 11% Cloudy 27 34% Rain 44 55%
Light Condition Dark - Lighted 8 10% Dark - Not Lighted 5 6% Dawn 2 3% Daylight 61 76% Dusk 4 5%
Crash Type/Manner Angle 4 5% Front to Rear 4 5% Guardrail Face 52 65% Sideswipe, Same Direction 4 5% Concrete Traffic Barrier 4 5% Guardrail End 2 3% Other/Unknown 10 13%
Contributing Circumstances: Environment None 54 68% Other 1 1%
Weather Conditions 25 31%

99
7.3 Detailed Analysis
7.3.1 SR 417 Southbound – SR 528 Westbound Of the 37 crashes on SR 417 Southbound to SR 528 Westbound, 5 crashes involved vehicles or
drivers out of the state of Florida. The percentage of male drivers is 64.86% (24 cases), which
significantly higher than the percentage of female drivers. The distribution of weather and
roadway surface conditions for the crashes is that 5 crashes were under the clear weather and dry
pavement, 7 cases for cloudy weather and wet pavement and 24 cases for rainy weather and wet
pavement condition. The narrative part recorded by the officer at the scene in the crash report is
not recorded in the crash data base. Nevertheless, this part contains information that provides
further insights into the crash mechanisms, that’s why we did inspect each report. Under the
clear weather and dry pavement condition, the crashes more likely resulted from inappropriate
driver maneuvers, such as lane-changing or unable to stopped to hit a vehicle already been
involved in crashes. For the other situations both having wet pavements, the most common
explanation is that when drivers negotiated the curve, they lost control of vehicle on the wet
roadway and hydroplaned, and the collision manner is running into the guardrail. Thus, how to
lower drivers speed on the curves so that they have control over their vehicle is critical to solve
the safety problems with wet surface on ramps. Warning flashing lights or advisory speeds that is
triggered by rain sensors could be a suitable countermeasure. In addition, when a crash occurs,
moving the vehicle out of the roadway would certainly reduce the likelihood of secondary
crashes.
7.3.2 SR 528 Eastbound – SR 417 Northbound On the ramp from SR 528 Eastbound to SR 417 Northbound, it is found that only one crash out
of the total 22 crashes was related to driver out of Florida. Ten female and 12 male drivers were
deemed as drivers at fault. The ratio between the two genders is close to 1. Still, the road surface
conditions for these crash cases were dominated by wet pavement. Twenty crashes were related
to wet road surface. The crash mechanisms on this ramp are very similar to that on the ramp
from SR 417 Southbound to SR 528 Westbound. Secondary crashes were also observed. One
issue should be pointed out is that for several multi-vehicle crash cases, the crash report shows
that some vehicles didn’t stop after collision and left the scene without leaving or exchanging
any information. In cases of hit-and-run crashes, countermeasures might be needed in the future
to facilitate the investigation of crashes, e.g., cameras.

100
7.3.3 Other Ramps The other three ramps, namely SR 417S – SR 528E, SR 528W – SR 417N and SR 417N – SR
528W, account for 21 crashes. No crashes related to out-of-state drivers or vehicles were found.
Male drivers were at fault in 13 crashes and female drivers in the other 8 cases. The rain soaked
pavement remains the most significant contributing factor of crashes. The ramps at the
interchange are curves. When the pavement is wet, if the drivers do not slow down their speed in
advance, they might fail to slow and slide on the rain soaked surfaces. For crashes involving
single vehicle, the vehicles were eventually stopped by guardrails and rested on the shoulder.
The forms of multi-vehicle crashes can be grouped into sideswipe or rear-end. Sideswipe crashes
could be related to failure to negotiate the curve and slide into the adjacent lanes or inappropriate
lane-changing behavior. Rear-end crashes are often secondary crashes when the vehicles on the
ramps were unable to avoid hitting a stopped vehicle on roadway.
7.4 Potential Treatments The analysis revealed that the wet pavement due to precipitation is the leading factor to the
crashes on the studied ramps at the specific interchange. Rainy weather condition could greatly
increase the chance that a vehicle would hydroplane on the curved roadway. The effect of rain
could last even after the rain stops.
Potential treatments should include warning drivers during inclement weather condition
(rain) and when the roadway surface is wet. Monitoring the pavement conditions might be
considered since wet pavement is the most direct factor related to crash occurrence on this
interchange. The warning information could be about the weather/pavement condition and the
suggested speed during this time period.
In addition to alerting drivers about the roadway surface conditions, the more
fundamental treatment is to maintain appropriate amount of pavement friction on ramps. High
friction surface treatment (HFST) is an emerging technology that could reduce crashes on wet
pavements. According to Federal Highway Administration (FHWA), at least 39 states have
applied HFST on at least one project site to date. American Traffic Safety Services Association
(ATSSA) listed HFST case studies describing the safety issues, locations and treatments.
In Florida, the Florida Department of Transportation (FDOT) District 4 Traffic
Operations Office in consultation with the FDOT Central office and the FHWA has installed
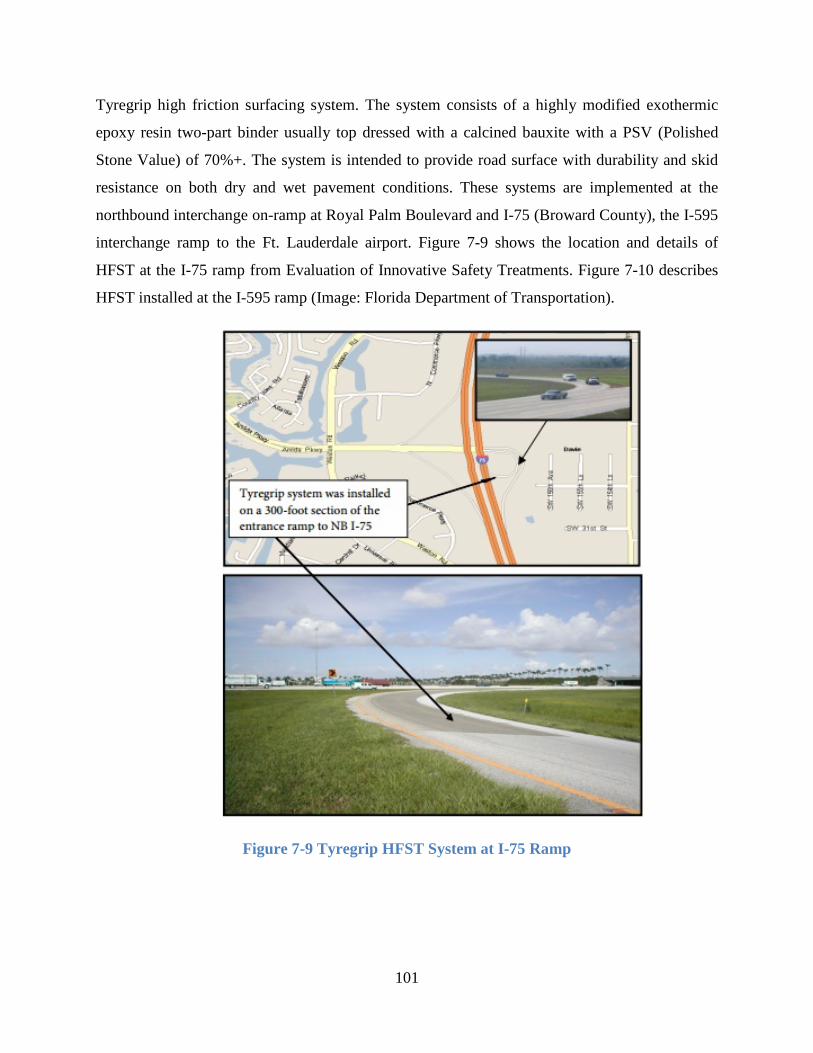
101
Tyregrip high friction surfacing system. The system consists of a highly modified exothermic
epoxy resin two-part binder usually top dressed with a calcined bauxite with a PSV (Polished
Stone Value) of 70%+. The system is intended to provide road surface with durability and skid
resistance on both dry and wet pavement conditions. These systems are implemented at the
northbound interchange on-ramp at Royal Palm Boulevard and I-75 (Broward County), the I-595
interchange ramp to the Ft. Lauderdale airport. Figure 7-9 shows the location and details of
HFST at the I-75 ramp from Evaluation of Innovative Safety Treatments. Figure 7-10 describes
HFST installed at the I-595 ramp (Image: Florida Department of Transportation).
Figure 7-9 Tyregrip HFST System at I-75 Ramp

102
Figure 7-10 Tyregrip HFST System at I-595 Ramp
These two locations involved sharply curved ramps and the restrictive geometries and
wet weather friction crashes. HFST was installed in 2006 and 2011 respectively. The Tyregrip
high friction surfacing system at the I-75 ramp is also included in the FDOT’s Report on
Evaluation of Innovative Safety Treatments. This particular ramp had a crash history of 12 run-
off-road crashes during 2002 to 2004. Among the 12 crashes, 83% were under wet road surface
conditions. According to the report, before-after friction test was conducted and it was found that
the friction number was much higher after the installation of Tyregrip surface system. Whether
the treatment significantly reduced crashes could not be statistically determined due to the data
limitations at the time when the report was composed. However, both vehicle speed and
proportion of vehicles encroaching either the outer or inner shoulder before and after the
application of the Tyregrip confirmed that vehicles slowed down on the ramps and the proportion
of encroaching vehicles were reduced especially in wet pavement conditions.
Since these two cases also involved interchange ramps and the locations are also in
Florida, their experience could be useful for potential treatment for the SR 417-SR528
interchange. The websites for High Friction Surface Treatment from FHWA and relevant case
studies from ATSSA are attached in the Appendix for more detailed information.
As for the road geometry, the guardrails prevent the vehicle running off the roadway and
the shoulders on both sides of the ramp provide vehicles temporary stopping spots. Several

103
secondary crashes have indicated that removing the vehicle quickly off the traveling lane could
help reduce the occurrence of this type of crash. Secondary crashes could be prevented by
installing detectors (camera or otherwise) that post warning messages on an upstream DMS once
a crash is detected.
When the pavement is dry, treatments for sideswipe crashes should be considered.
Sideswipe crashes are more likely due to improper lane-changing behavior of the drivers. This
maneuver should be taken with extra caution on ramps.
7.5 Conclusion This case study presented a detailed investigation into crash information at the individual-crash
level to shed light on the contributing factors leading to crashes on ramps at the interchange of
SR 417 and SR 528. In total 80 crashes from August, 2012 to September, 2013 were located on
the ramps during this time period.
Safety issues on ramps were examined from several points of view, including the drivers,
the weather, the roadway condition and the collision manner.
Weather and roadway conditions have significant impact on the safety performance of the
ramps at interchange. Since the ramps consist of curves, when the pavement is wet due to
precipitation, vehicles could hydroplane on the road surface. The crash reports confirmed the
issue. The majority (89%) of the total crashes occurred when the road surface was wet.
Crash types and collision manners show that single-vehicle crashes are the most common
crash type. Multi-vehicle crashes could be due to various reasons; sliding of the vehicles,
inappropriate lane-changing behavior, and hitting the rear of other vehicles, including secondary
crashes.
To alleviate crashes on the ramps, several countermeasures have been discussed.
Warning messages about the weather and roadway are the most direct method to raise the drivers
caution during their trip. When it is raining or when the pavement is wet, drivers should be
advised to travel at a safe speed. High Friction Surface Treatments have been widely used to
provide road users appropriate frictions on ramps and curves. Two implementations of the
Tyregrip systems are found in Florida. The installation of the system has been proved to

104
successfully increase frictions between road surface and tires. Speed and proportion of vehicles
encroaching the shoulders were both reduced. Guardrails and shoulders are useful to reduce the
crash severity and the chance of secondary crashes. When a crash occurs, the vehicles involved
should be removed from the traveling lane in time, and thus we suggest a detection system linked
to an upstream DMS. Warning flashing lights and advisory speed could be triggered in wet
conditions.
This report is aimed to benefit our understanding of crashes on ramps through detailed
examination of each crash. In future when more ramps on CFX’s system are considered, more
prevalent conclusions and hidden information could be revealed.

105
8 CONCLUSIONS AND RECOMMENDATIONS
8.1 General With the rapid development of traffic detection technology, more proactive traffic management
can be achieved using the precise and rich information generated by these systems. The real-time
nature of these data enables traffic managers to evaluate their system at more microscopic level
and pinpoint the specific issue that may exist for efficient treatment. The Central Florida
Expressway Authority (CFX) manages the expressway system in Orlando area and provides
motorists with fast connections for both commuting and leisure trips. On CFX’s expressway
network, five expressways are currently under management. On these expressways, multiple ITS
technologies are deployed. To minimize the inconvenience for drivers, Electronic Toll Collection
(ETC) technology is implemented so drivers with E-PASS or SunPass do not need to slow down
when they pass the toll plazas on the mainline. Automatic Vehicle Identification (AVI) system is
installed to detect the vehicles both for toll calculation and travel time estimation. Since 2012,
the authority has introduced Microwave Vehicle Detection System (MVDS) for better traffic
monitoring. Compared with the existing AVI system that is mainly used for tolling, MVDS is
specifically designed to keep records of traffic parameters on the traveling lanes of the
expressways. With the traffic information extracted from these detection systems, CFX informs
the road users about most up-to-date traveling information including estimated travel time,
congestion warning and incident warning, etc. through the Dynamic Message Signs (DMS)
installed at different locations on their expressways.
To take advantage of these systems and come up with more proactive traffic management
strategies, this project aims at fully exploration the potential use of these traffic data to evaluate
the performance of the expressway system. The current performance of expressway is evaluated
from two perspectives: operation and safety. Traffic operation efficiency is measured by the
congestion conditions on the expressways. The congestion intensity, congested segment and time
duration are carefully reviewed. Based on the results of congestion evaluation, countermeasures
especially by using DMS are proposed. The existing DMS that could be used for queue warning
and places in need of potential DMS will be provided. In addition of regular congestion
management, ramp closure procedures in case of emergency or total shutdown of mainline traffic
are also investigated. A survey is designed and conducted to learn from other expressway

106
authorities’ experience in ramp closure. Traffic safety is assessed based on the historical crash
data on the expressways. The crashes are analyzed by the crash types, severities and other
characteristics. Based on the results, spatial analysis is conducted to find out the segments that
have specific safety issues. Also, the crashes are also viewed from a temporal perspective to
show the distribution of crashes along time. Besides the safety evaluation for the whole system, a
case study focusing on ramp crashes at interchanges is provided to gain detailed insights about
ramp safety. Recommendations are also attached in hope to improve the traffic safety
performance on the expressways.
8.2 Congestion Evaluation Both the AVI and MVDS traffic data are utilized to evaluate the congestion conditions on the
expressways. Three different congestion measures are introduced based on the traffic parameters
available in the two detection systems. Travel Time Index (TTI) is a time-based congestion
indicator that uses the AVI data. Occupancy and Congestion Index (CI) are density-based and
speed-based congestion measures that employ MVDS traffic data.
Congestion evaluation is conducted both using the most current data to reflect up-to-date
congestion conditions and the longitudinal data over the past year to show the changes in
congestion. Mainline congestion is evaluated for weekdays using the 5-minute interval data. The
results show that because of recent upgrades in AVI system, the TTI measure suffers issues of
missing data at several segments. The MVDS system is more stable and due to the dense
deployment of MVDS sensors on the expressways. Complete spatial-temporal congestion profile
could be generated. In addition, a preliminary comparison between TTI and CI shows that CI
gives more detailed and perhaps more accurate estimation of congestion intensity on the
expressways. On the other hand, the performances of CI and occupancy are comparable since
they are both developed from the MVDS system.
The congested area for SR 408 is approximately from MP 17 to MP 19 on Eastbound in
the morning peak and from MP 10 to MP 13 on Westbound in the evening peak hours. For SR
414, only the Eastbound experiences moderate congestion during morning peak hours, the
congested segment is near MP 9.3. For SR 417, both directions experience moderate congestion
during evening peak hours. The congested segment is near the interchanges with University Blvd
which leads to University of Central Florida. No congestion was detected on SR 429. On SR 528,

107
congestion is detected on Eastbound in the evening and on Westbound in the morning near the
interchange between SR 417 and SR 528.
The longitudinal analysis confirms operation improvement on SR 408, SR 414 and
congested segments on SR 528. SR 417 and SR 429 remain stable during the past one year.
Considering SR 408 and SR 528 are the expressways that experience most congestion,
significant improvement on these two expressways indicate the successful management by the
CFX.
Since MVDS data can also monitor traffic on ramps, the ramp congestion is also
examined. Based on the results, three ramps on SR 408 and one ramp on SR 429 experience
congestion, among which three are off-ramps and one is on-ramp. The on-ramp at MP 9.7 on SR
408 Eastbound at the interchange of SR 408 and I-4 in downtown Orlando, the two off-ramps on
SR 408 Westbound at MP 9.9 and MP 10.3 both connected to I-4 are found congested on SR 408.
The off-ramp experiencing evening congestion is at MP 19.8 of SR 429 Southbound.
8.3 DMS Application in Congestion Management To inform the drivers of congestion at downstream, the DMS can be used for queue warning.
The benefit of providing queue warning information is mainly to prevent primary or secondary
crashes, and to delay the onset of congestion and improve travel time. Queue warning has been
implemented in several other countries including the United States. However, currently there are
no exact guidelines about the placement of queue warning signs. General principles of warning
signs, though, can be found from Manual on Uniform Traffic Control Devices (MUTCD).
To use the DMS on CFX’s expressways for queue warning, the accurate congested
segments are identified first. Based on the location of end of queue on the mainline, upstream
DMS that are within 1 to 2 miles of the queue end are located. These DMS can be used for queue
warning. If no DMS is found, then potential DMS can be considered in the future. For the
congested ramps, same procedures are implemented. For the mainline congestion, four existing
DMS are identified that can display queue warning messages. Five locations are also proposed
for future consideration in case of additional DMS is needed. For the ramp congestion warning,
all the four ramps have existing DMS upstream that can inform motorists of the ramp congestion.

108
8.4 Ramp Closure Practice
The survey about ramp closure practice is composed of twelve short questions. In total, ten
domestic responses from eight states and five international responses from three countries have
been received. The toll authorities participating in the survey shared precious information as how
they manage their system during a total shut-down of the mainline traffic lanes.
The combination of open tolling and plazas is the predominant toll collection method in
the United States as found in the survey. The implementation of open tolling is also becoming
more common overseas. Almost all domestic and international authorities claimed they have
practices for closing on-ramps in case of total shut-down on the mainline. In most cases, the
practices are carried out on a case by case basis. Specific strategies such as Florida’s Turnpike’s
SOP, Maryland Transportation Authority’s FITM plans and WV Parkways Authority’s
emergency detours are reported. An additional question was designed and sent to the toll
authorities to gain insight on how they close ramps in case of total shut-down. Six domestic and
three international authorities responded us with detailed information as how they close the
ramps and the equipment they implement closing the ramps.
Even when no procedures or practices are available for on-ramp closing, the authorities
still gave confirmative responses that they provide information to motorists. The media to
convey the information to drivers includes DMS, radio, fixed signs, and others like maps, TV,
websites, telephone (511 systems), and toll personnel, etc. If available, the authorities send
drivers detailed information about the cause of the shut-down, the location and expected duration
of the closure, and where the alternative routes would be.
From the survey, each authority’s system is equipped with multiple ITS systems.
Electronic Toll Collection, Dynamic Message Signs, Remote Traffic Management Sensors, and
Automatic Vehicle Identification systems are prevalent. Some other ITS systems like CB Radio
Advisory System, and Supervisory Control and Data Acquisition systems are also in use.
CFX’s system is also equipped with these ITS systems. By learning from other
authorities’ experience, CFX can make the most of their system and provide motorists with
valuable information in extreme cases to enhance customer satisfaction.

109
8.5 Expressway Traffic Safety Performance Traffic safety as an important indicator of expressway performance is also evaluated. The other
motivation for safety evaluation is that it is widely believed that traffic safety is significantly
related with operation. Improving either of them will have beneficial effects on the other. Traffic
crash data from January 2011 to June 2014 were collected from S4A database to fulfill this task.
Much effort has been made in the data preparation process to ensure the accurate
selection of crashes on the expressways. Data contain the crashes on the mainline, mainline toll
plaza cash lanes and ramps. The data for the past three and half years indicate stable trend of
safety performance on SR 408 and SR 417. For these two expressways, the crash counts for each
year do not vary significantly. For the other three expressways, SR 414 and SR 528 have small
increase while crashes on SR 429 decrease. Compared with other toll and turnpike authorities,
the mainline safety conditions on CFX’s expressway network perform relatively well. Compared
with SR 836, SR 821, both of which travel through downtown Miami, and SR 589 in Tampa
metropolitan area, SR 408 extends through downtown Orlando, but has a lower crash rate.
Segments of SR 417 and SR 528 operated by CFX have the crash rates at median level. Crash
rate for SR 429 segment on CFX's system is among the lowest.
Further analysis of safety by crash characteristics and the spatial patterns reveal
significant features of the crashes on the expressway network. The rear end crashes are found to
most likely to occur on these congested segments. This result confirms the relationship between
congestion and rear end crashes, which also highlight the importance of queue warning using
DMS on the expressways. Crashes based on the lighting conditions reveal that the segment on
SR 528 east to the interchange with SR 417 is the major segment for the crashes occurring under
dark without lighting condition. In the future, if light poles are installed on this segment, it is
expected to bring down the crashes. Under the rainy or wet pavement conditions, the
interchanges are the most affected area. . The issue with SR 408 – I-4 interchange and SR 417 --
SR 528 interchange are most significant. Consequently, improving ramp safety should
specifically focus on these two interchanges. The temporal distribution of crashes indicates that
most of the expressway crashes occur during morning and evening peak hours. And the crashes
during peak hours are found to concentrate on the congested segments. This proves the close
110
relationship between congestion and safety. Consequently, in the future it is best to have
improvement projects considering both of these two aspects together.
8.6 Case Study of Interchange Traffic Safety The results of traffic safety analysis suggest that crashes on the interchanges should be reviewed
carefully. By the request of CFX, a case study focusing on the ramp traffic safety at the
interchange between SR 528 and SR 417 is conducted.
To have comprehensive understanding about ramp crashes, information regarding the
drivers, the weather, the roadway condition and the collision manner were extracted from
original crash reports.
It is found that weather and roadway conditions have significant impact on the safety
performance of the ramps at interchange. Ramps are normally constructed using curves.
Therefore when the pavement is wet, vehicles could hydroplane on the road surface. Narratives
by the drivers involved in the ramp crashes reports confirmed the issue. The majority (89%) of
the total crashes occurred when the road surface was wet. Single-vehicle crashes are the most
common crash type on the ramps due to hydroplane. Multi-vehicle crashes could be due to
various reasons; sliding of the vehicles, inappropriate lane-changing behavior, and hitting the
rear of other vehicles, including secondary crashes.
Several countermeasures have been discussed to reduce crashes on the ramps. Warning
messages about the weather and roadway are the most direct method to raise the drivers’ caution
especially when it is raining or when the pavement is wet. High Friction Surface Treatments
have been widely used to provide road users appropriate frictions on ramps and curves. The
installation of the system has been proved to successfully increase frictions between road surface
and tires in two application cases in Florida. Guardrails and shoulders are useful to reduce the
crash severity and the chance of secondary crashes. When a crash occurs, the vehicles involved
should be removed from the traveling lane in time, and thus we suggest a detection system linked
to an upstream DMS. Warning flashing lights and advisory speed could be triggered in wet
conditions.

111
9 POTENTIAL ITS IMPLEMENTATION ON THE EXPRESSWAYS Besides the utilization of current ITS data reported in this project, further implementation of
these data can be envisioned. The rich information recorded in real-time is not limited to the
congestion evaluation elaborated in this report. Potential extensions of the usage of the data
include travel time estimation and micro-simulation network construction.
9.1 Travel Time Estimation Providing reliable estimated travel time to motorists not only improves the customer experience
on the expressways but also help smooth the traffic flow by adjusting the motorists traveling
speed on the expressways.
Travel time estimation relies heavily on the proper functioning of the traffic detection
system. The accuracy and reliability of estimated travel time might also be challenged. CFX has
the advantage of having both AVI and MVDS detection system. Using both of them for travel
time estimation is expected to generate more accurate and reliable prediction. Appropriate data
fusion techniques might be necessary for developing travel time calculation algorithm. Real-time
estimation is an important field given the power of ITS technology. The AVI and MVDS data
can be used to test the candidate algorithms for travel time estimation and validate the prediction
accuracy and reliability.
9.2 Micro-Simulation using ITS Data The data collected from MVDS and AVI systems can also provide adequate traffic information
to build simulation network for expressways. MVDS sensors collect traffic volume on each on-
ramp and off-ramp, which serve an essential input for simulation. Also, MVDS record the traffic
volume by vehicle types. Thus, truck percentage, an important factor for traffic performance, can
be obtained. Moreover, MVDS data provide speed information at one minute interval and AVI
can be used to calculate travel time. Hence, the process of simulation validation can be
successfully completed based on the speed or travel time.
VISSIM is one of the most widely used and indispensable tool to simulate the field traffic
performance. It’s a microscopic, behavior-based, multi-purpose traffic simulation program which
has already been used for various purposes such as evaluating geometric changes or the benefit
estimation of new ITS instrument. The aggregated traffic data at 15-minute interval can reflect
traffic fluctuates especially during the peak hours. After the calibration and validation of

112
VISSIM network, engineers can implement it to Active Traffic Management (ATM) system, e.g.,
the optimal Dynamic Message Signs (DMS) location, and the efficiency of traffic management
strategies before actual field implementations.

113
APPENDIX A. AVI SENSOR DEPLOYMENT Table A-1 SR 408 Eastbound AVI Sensor Deployment
Sensor ID 2012 2013 2014 09 10 11 12 01 02 03 04 05 06 07 08 09 10 11 12 01 02 03 05 06 07
AVI-0408E-AlafayaTr AVI-0408E-BumbyAve AVI-0408E-ChickasawExi ● ● ● ● ● ● ● ● ● ● ● ● ● ● ● ● ● ● ● AVI-0408E-ChickasawTr AVI-0408E-ConwayRd ● ● ● AVI-0408E-DeanRd AVI-0408E-EColonialDr AVI-0408E-EconTr ● AVI-0408E-GoldenrodRd ● AVI-0408E-Goldnrd_DMS AVI-0408E-GoodHomesRd ● ● AVI-0408E-HiawasseeRd ● ● AVI-0408E-I4 AVI-0408E-I4_Ramp AVI-0408E-JYP AVI-0408E-KirkmanRd AVI-0408E-MillsAve AVI-0408E-MillsAve_DMS AVI-0408E-OBT AVI-0408E-Orange_Ramp AVI-0408E-PineHillsRd AVI-0408E-RouseRd ● AVI-0408E-SR417 ● ● ● ● ● ● ● ● ● ● ● ● ● ● ● ● ● ● ● AVI-0408E-SemoranBlvd AVI-0408E-TampaAve AVI-0408E-WBoundary ● ● ● AVI-0408E-WColonl_DMS ● AVI data not available in this month

114
Table A-2 SR 408 Westbound AVI Sensor Deployment
Sensor ID 2012 2013 2014 9 10 11 12 1 2 3 4 5 6 7 8 9 10 11 12 1 2 3 5 6 7
AVI-0408W-AlafayaTr AVI-0408W-BumbyAve AVI-0408W-CrystalLkDr ● ● ● AVI-0408W-DeanRd ● ● ● AVI-0408W-EColonialDr AVI-0408W-FergusonRd AVI-0408W-GoldenrodRd AVI-0408W-GoodHomesRd AVI-0408W-HiawasseeRd ● ● ● AVI-0408W-I4 AVI-0408W-I4_Ramp AVI-0408W-JYP AVI-0408W-KirkmanRd AVI-0408W-Kirkman_DMS AVI-0408W-MillsAve AVI-0408W-OBT AVI-0408W-OxalisAv_DMS AVI-0408W-PineHillsRd AVI-0408W-RouseRd AVI-0408W-SR417 AVI-0408W-SemoranBlvd ● AVI-0408W-SummerlinAve AVI-0408W-WBoundary ● AVI-0408W-WColonl_Ramp ● ● ●
● AVI data not available in this month

115
Table A-3 SR 414 Eastbound AVI Sensor Deployment
Sensor ID 2012 2013 2014 9 10 11 12 1 2 3 4 5 6 7 8 9 10 11 12 1 2 3 5 6 7
AVI-0414E-HiawasseeDMS ● ● ● ● ● ● ● ● ● ● ● ● ● ● ● ● ● ● ● AVI-0414E-HiawasseeRd AVI-0414E-KeeneRd AVI-0414E-MardenRd ● ● ● ● ● ● ● ● ● ● ● ● ● ● ● ● ● ● ● AVI-0414E-OBT AVI-0414E-SR429 ● ● ● AVI-0414E-SR451 ● ● ● ● ● ● ● ● ● ● ● ● ● ● ● ● ● ● ● ● AVI data not available in this month
Table A-4 SR 414 Westbound AVI Sensor Deployment
Sensor ID 2012 2013 2014 9 10 11 12 1 2 3 4 5 6 7 8 9 10 11 12 1 2 3 5 6 7
AVI-0414W-HiawasseeRd AVI-0414W-KeeneDMS ● ● ● ● ● ● ● ● ● ● ● ● ● ● ● ● ● ● ● AVI-0414W-KeeneRd AVI-0414W-OBT AVI-0414W-SR429 ● ● ● AVI-0414W-SR451 ● ● ● ● ● ● ● ● ● ● ● ● ● ● ● ● ● ● ● ● AVI data not available in this month

116
Table A-5 SR 417 Northbound AVI Sensor Deployment
Sensor ID 2012 2013 2014 9 10 11 12 1 2 3 4 5 6 7 8 9 10 11 12 1 2 3 5 6 7
AVI-0417N-BoggyCreek ● ● AVI-0417N-BoggyCrk_DMS AVI-0417N-CurryFordRd AVI-0417N-EColonialDr ● ● ● ● ● ● ● ● ● ● ● ● ● ● ● ● ● ● ● ● AVI-0417N-IDrive_DMS AVI-0417N-InnovationWy ● ● ● AVI-0417N-JYP AVI-0417N-LakeNona AVI-0417N-LandstarBlvd AVI-0417N-LeeVistaBlvd ● ● AVI-0417N-MossParkRd AVI-0417N-Narcooss_DMS ● ● ● AVI-0417N-Narcoossee AVI-0417N-OBT AVI-0417N-SR408 ● ● ● AVI-0417N-SR528 AVI-0417N-Seminole_DMS AVI-0417N-University AVI-0417N-Valencia ● ● ● ● ● ● ● ● ● ● ● ● ● ● ● ● ● ● ● ● ● AVI data not available in this month

117
Table A-6 SR 417 Southbound AVI Sensor Deployment
Sensor ID 2012 2013 2014 9 10 11 12 1 2 3 4 5 6 7 8 9 10 11 12 1 2 3 5 6 7
AVI-0417S-BoggyCreek ● ● ● AVI-0417S-BoggyCrk_DMS ● ● AVI-0417S-CurryFordRd AVI-0417S-CuryFord_DMS AVI-0417S-EColonial AVI-0417S-EColonl_DMS ● ● ● AVI-0417S-IDrive_DMS AVI-0417S-InnovationWy AVI-0417S-JYP ● ● AVI-0417S-JYP_DMS AVI-0417S-LakeNona AVI-0417S-LandstarBlvd AVI-0417S-Landstar_DMS ● ● AVI-0417S-LeeVistaBlvd AVI-0417S-MossParkRd AVI-0417S-NarcoosseeRd ● AVI-0417S-OBT ● AVI-0417S-SR408_E AVI-0417S-SR408_W ● ● ● ● ● ● ● ● ● ● ● ● ● ● ● ● ● ● ● AVI-0417S-SR528 ● ● AVI-0417S-Seminole_DMS AVI-0417S-SofEColonial ● ● ● ● ● ● ● ● ● ● ● ● ● ● ● ● ● ● ● ● AVI-0417S-University ● ● ●
● AVI data not available in this month

118
Table A-7 SR 429 Northbound AVI Sensor Deployment
Sensor ID 2012 2013 2014 9 10 11 12 1 2 3 4 5 6 7 8 9 10 11 12 1 2 3 5 6 7
AVI-0429N-CR535 AVI-0429N-CR535_DMS AVI-0429N-Independence ● ● ● AVI-0429N-McCormickRd ● ● ● ● ● ● ● ● ● ● ● ● ● ● ● ● ● ● ● AVI-0429N-OBT ● ● ● AVI-0429N-OBTa ● ● ● AVI-0429N-PlantSt_DMS AVI-0429N-SR414 ● ● ● ● ● ● ● ● ● ● ● ● ● ● ● ● ● ● ● AVI-0429N-SR437A ● ● ● ● ● ● ● ● ● ● ● ● ● ● ● ● ● ● ● AVI-0429N-SR438 ● ● ● AVI-0429N-SeidelRd_DMS AVI-0429N-Trnpike_Ramp ● ● AVI-0429N-Turnpike_N ● ● ● AVI-0429N-Turnpike_S AVI-0429N-US441 ● ● ● ● ● ● ● ● ● ● ● ● ● ● ● ● ● ● ● AVI-0429N-WestRd ● ● ●
● AVI data not available in this month

119
Table A-8 SR 429 Southbound AVI Sensor Deployment
Sensor ID 2012 2013 2014 9 10 11 12 1 2 3 4 5 6 7 8 9 10 11 12 1 2 3 5 6 7
AVI-0429S-CR437A ● ● ● ● ● ● ● ● ● ● ● ● ● ● ● ● ● ● ● AVI-0429S-CR535 AVI-0429S-CR535_DMS AVI-0429S-Independence ● AVI-0429S-LustRd_DMS ● ● ● ● ● ● ● ● ● ● ● ● ● ● ● ● ● ● ● AVI-0429S-OBT ● ● ● AVI-0429S-OBTa ● ● ● AVI-0429S-SR414 ● ● ● ● ● ● ● ● ● ● ● ● ● ● ● ● ● ● ● AVI-0429S-SR438 ● ● ● AVI-0429S-SeidelRd AVI-0429S-Turnpike_N AVI-0429S-Turnpike_S AVI-0429S-US441 ● ● ● ● ● ● ● ● ● ● ● ● ● ● ● ● ● ● ● AVI-0429S-WColonialDr AVI-0429S-WestRd ● ● ●
● AVI data not available in this month

120
Table A-9 SR 528 Eastbound AVI Sensor Deployment
Sensor ID 2012 2013 2014 9 10 11 12 1 2 3 4 5 6 7 8 9 10 11 12 1 2 3 5 6 7
AVI-0528E-DallasBlvd AVI-0528E-GoldenrodRd AVI-0528E-ICP AVI-0528E-NarcoosseeRd AVI-0528E-SR417 ● ● ● AVI-0528E-SR436 ● ● ● AVI-0528E-SR520 ● AVI-0528E-TradeportDr ● AVI-0528E-WBndry_DMS ● ● AVI data not available in this month
Table A-10 SR 528 Westbound AVI Sensor Deployment
Sensor ID 2012 2013 2014 9 10 11 12 1 2 3 4 5 6 7 8 9 10 11 12 1 2 3 5 6 7
AVI-0528W-Dallas_DMS ● ● ● ●
AVI-0528W-GoldenrodRd ● ● ●
AVI-0528W-ICP ● ● ●
AVI-0528W-NarcoosseDMS ● ● ●
AVI-0528W-SR417 ● ● ● ● ●
AVI-0528W-SR436_W ● ● ● ● ● ● ●
AVI-0528W-SR520 ● ● ● ● ● ● ● ●
AVI-0528W-SR520_DMS ● ● ● ● ●
AVI-0528W-TradeportDr
● ● ● ● ● ● ● ● AVI-0528W-WBndry_DMS
● ● ● ● ● ● ● ●
● AVI data not available in this month

121
APPENDIX B. AVI SYSTEM SEGMENTATION Table B-1 SR 408 Eastbound AVI System Segmentation
Link Up_station Down_station Up_milepost Down_milepost Direction 1 AVI-0408E-WBoundary AVI-0408E-GoodHomesRd 1.456 2.155 EB 2 AVI-0408E-GoodHomesRd AVI-0408E-HiawasseeRd 2.155 3.468 EB 3 AVI-0408E-HiawasseeRd AVI-0408E-KirkmanRd 3.468 4.632 EB 4 AVI-0408E-KirkmanRd AVI-0408E-PineHillsRd 4.632 5.937 EB 5 AVI-0408E-PineHillsRd AVI-0408E-JYP 5.937 7.619 EB 6 AVI-0408E-JYP AVI-0408E-TampaAve 7.619 8.338 EB 7 AVI-0408E-TampaAve AVI-0408E-OBT 8.338 8.859 EB 8 AVI-0408E-OBT AVI-0408E-I4 8.859 9.347 EB 9 AVI-0408E-OBT AVI-0408E-I4_Ramp 8.859 9.347 EB
10 AVI-0408E-I4 AVI-0408E-Orange_Ramp 9.347 10.191 EB 11 AVI-0408E-Orange_Ramp AVI-0408E-MillsAve 10.191 10.809 EB 12 AVI-0408E-MillsAve AVI-0408E-MillsAve_DMS 10.809 11.099 EB 13 AVI-0408E-MillsAve_DMS AVI-0408E-BumbyAve 11.099 11.447 EB 14 AVI-0408E-BumbyAve AVI-0408E-ConwayRd 11.447 12.841 EB 15 AVI-0408E-ConwayRd AVI-0408E-SemoranBlvd 12.841 13.328 EB 16 AVI-0408E-SemoranBlvd AVI-0408E-Goldnrd_DMS 13.328 15.181 EB 17 AVI-0408E-Goldnrd_DMS AVI-0408E-GoldenrodRd 15.181 15.614 EB 18 AVI-0408E-GoldenrodRd AVI-0408E-ChickasawTr 15.614 16.416 EB 19 AVI-0408E-ChickasawTr AVI-0408E-EconTr 16.416 17.966 EB 20 AVI-0408E-EconTr AVI-0408E-DeanRd 17.966 18.472 EB 21 AVI-0408E-DeanRd AVI-0408E-RouseRd 18.472 19.424 EB 22 AVI-0408E-RouseRd AVI-0408E-AlafayaTr 19.424 20.669 EB 23 AVI-0408E-AlafayaTr AVI-0408E-EColonialDr 20.669 22.266 EB

122
Table B-2 SR 408 Westbound AVI System Segmentation
Link Up_station Down_station Up_milepost Down_milepost Direction 1 AVI-0408W-GoodHomesRd AVI-0408W-WColonl_Ramp 2.2362 1.0522 WB 2 AVI-0408W-GoodHomesRd AVI-0408W-WBoundary 2.2362 1.5222 WB 3 AVI-0408W-HiawasseeRd AVI-0408W-GoodHomesRd 4.5232 2.2362 WB 4 AVI-0408W-Kirkman_DMS AVI-0408W-HiawasseeRd 4.8552 4.5232 WB 5 AVI-0408W-KirkmanRd AVI-0408W-Kirkman_DMS 5.4092 4.8552 WB 6 AVI-0408W-PineHillsRd AVI-0408W-KirkmanRd 6.008 5.4092 WB 7 AVI-0408W-FergusonRd AVI-0408W-PineHillsRd 7.347 6.008 WB 8 AVI-0408W-JYP AVI-0408W-FergusonRd 8.072 7.347 WB 9 AVI-0408W-OBT AVI-0408W-JYP 9.298 8.072 WB 10 AVI-0408W-I4 AVI-0408W-OBT 10.488 9.298 WB 11 AVI-0408W-SummerlinAve AVI-0408W-I4 10.964 10.488 WB 12 AVI-0408W-SummerlinAve AVI-0408W-I4_Ramp 10.964 10.488 WB 13 AVI-0408W-MillsAve AVI-0408W-SummerlinAve 11.399 10.964 WB 14 AVI-0408W-BumbyAve AVI-0408W-MillsAve 11.806 11.399 WB 15 AVI-0408W-CrystalLkDr AVI-0408W-BumbyAve 12.605 11.806 WB 16 AVI-0408W-SemoranBlvd AVI-0408W-CrystalLkDr 14.563 12.605 WB 17 AVI-0408W-OxalisAv_DMS AVI-0408W-SemoranBlvd 15.245 14.563 WB 18 AVI-0408W-GoldenrodRd AVI-0408W-OxalisAv_DMS 16.488 15.245 WB 19 AVI-0408W-SR417 AVI-0408W-GoldenrodRd 18.033 16.488 WB 20 AVI-0408W-DeanRd AVI-0408W-SR417 18.538 18.033 WB 21 AVI-0408W-RouseRd AVI-0408W-DeanRd 19.706 18.538 WB 22 AVI-0408W-AlafayaTr AVI-0408W-RouseRd 20.815 19.706 WB 23 AVI-0408W-EColonialDr AVI-0408W-AlafayaTr 22.331 20.815 WB

123
Table B-3 SR 414 Eastbound AVI System Segmentation
Link Up_station Down_station Up_milepost Down_milepost Direction 1 AVI-0414E-MardenRd AVI-0414E-KeeneRd 4.313 6.335 EB 2 AVI-0414E-KeeneRd AVI-0414E-HiawasseeRd 6.335 7.263 EB 3 AVI-0414E-HiawasseeRd AVI-0414E-OBT 7.263 8.9 EB
Table B-4 SR 414 Westbound AVI System Segmentation
Link Up_station Down_station Up_milepost Down_milepost Direction 1 AVI-0414W-KeeneRd AVI-0429S-WestRd 6.62 -0.191 WB 2 AVI-0414W-KeeneDMS AVI-0414W-KeeneRd 6.97 6.62 WB 3 AVI-0414W-HiawasseeRd AVI-0414W-KeeneDMS 8.127 6.97 WB 4 AVI-0414W-OBT AVI-0414W-HiawasseeRd 9.59 8.127 WB

124
Table B-5 SR 417 Northbound AVI System Segmentation
Link Up_station Down_station Up_milepost Down_milepost Direction 1 AVI-0417N-IDrive_DMS AVI-0417N-JYP 6.453 9.43 NB 2 AVI-0417N-JYP AVI-0417N-OBT 9.43 10.638 NB 3 AVI-0417N-OBT AVI-0417N-LandstarBlvd 10.638 13.004 NB 4 AVI-0417N-LandstarBlvd AVI-0417N-BoggyCrk_DMS 13.004 14.653 NB 5 AVI-0417N-BoggyCrk_DMS AVI-0417N-BoggyCreek 14.653 16.663 NB 6 AVI-0417N-BoggyCreek AVI-0417N-LakeNona 16.663 18.82 NB 7 AVI-0417N-LakeNona AVI-0417N-Narcooss_DMS 18.82 20.581 NB 8 AVI-0417N-Narcooss_DMS AVI-0417N-Narcoossee 20.581 21.332 NB 9 AVI-0417N-Narcoossee AVI-0417N-MossParkRd 21.332 22.519 NB 10 AVI-0417N-MossParkRd AVI-0417N-InnovationWy 22.519 23.602 NB 11 AVI-0417N-InnovationWy AVI-0417N-SR528 23.602 24.905 NB 12 AVI-0417N-SR528 AVI-0417N-LeeVistaBlvd 24.905 27.203 NB 13 AVI-0417N-LeeVistaBlvd AVI-0417N-CurryFordRd 27.203 29.515 NB 14 AVI-0417N-CurryFordRd AVI-0417N-SR408 29.515 32.495 NB 15 AVI-0417N-SR408 AVI-0417N-University 32.495 36.343 NB 16 AVI-0417N-University AVI-0417N-Seminole_DMS 36.343 37.796 NB

125
Table B-6 SR 417 Southbound AVI System Segmentation
Link Up_station Down_station Up_milepost Down_milepost Direction 1 AVI-0417S-JYP_DMS AVI-0417S-IDrive_DMS 8.057 6.447 SB 2 AVI-0417S-JYP AVI-0417S-JYP_DMS 10.287 8.057 SB 3 AVI-0417S-OBT AVI-0417S-JYP 11.294 10.287 SB 4 AVI-0417S-LandstarBlvd AVI-0417S-OBT 13.871 11.294 SB 5 AVI-0417S-Landstar_DMS AVI-0417S-LandstarBlvd 14.648 13.871 SB 6 AVI-0417S-BoggyCreek AVI-0417S-Landstar_DMS 17.746 14.648 SB 7 AVI-0417S-BoggyCrk_DMS AVI-0417S-BoggyCreek 18.243 17.746 SB 8 AVI-0417S-LakeNona AVI-0417S-BoggyCrk_DMS 19.564 18.243 SB 9 AVI-0417S-NarcoosseeRd AVI-0417S-LakeNona 22.14 19.564 SB
10 AVI-0417S-MossParkRd AVI-0417S-NarcoosseeRd 23.527 22.14 SB 11 AVI-0417S-InnovationWy AVI-0417S-MossParkRd 24.461 23.527 SB 12 AVI-0417S-SR528 AVI-0417S-InnovationWy 26.321 24.461 SB 13 AVI-0417S-LeeVistaBlvd AVI-0417S-SR528 27.924 26.321 SB 14 AVI-0417S-CurryFordRd AVI-0417S-LeeVistaBlvd 30.241 27.924 SB 15 AVI-0417S-CuryFord_DMS AVI-0417S-CurryFordRd 30.936 30.241 SB 16 AVI-0417S-SR408_E AVI-0417S-CuryFord_DMS 32.709 30.936 SB 17 AVI-0417S-EColonial AVI-0417S-SR408_E 34.899 32.709 SB 18 AVI-0417S-EColonl_DMS AVI-0417S-EColonial 35.277 34.899 SB 19 AVI-0417S-University AVI-0417S-EColonl_DMS 36.99 35.277 SB 20 AVI-0417S-Seminole_DMS AVI-0417S-University 37.79 36.99 SB

126
Table B-7 SR 429 Northbound AVI System Segmentation
Link Up_station Down_station Up_milepost Down_milepost Direction 10 AVI-0429N-SeidelRd_DMS AVI-0429N-Independence 11.808 14.734 NB 11 AVI-0429N-Independence AVI-0429N-CR535 14.734 19.005 NB 12 AVI-0429N-CR535 AVI-0429N-CR535_DMS 19.005 20.710 NB 13 AVI-0429N-CR535_DMS AVI-0429N-Turnpike_S 20.710 21.792 NB 14 AVI-0429N-Turnpike_S AVI-0429N-Turnpike_N 21.792 22.496 NB 15 AVI-0429N-Turnpike_N AVI-0429N-SR438 22.496 23.668 NB 16 AVI-0429N-Turnpike_S AVI-0408E-WBoundary 21.792 25.252 NB 17 AVI-0429N-Trnpike_Ramp AVI-0429N-SR438 22.795 23.668 NB 18 AVI-0429N-SR438 AVI-0429N-PlantSt_DMS 23.668 24.972 NB 19 AVI-0429N-PlantSt_DMS AVI-0429N-WestRd 24.972 26.421 NB
Table B-8 SR 429 Southbound AVI System Segmentation
Link Up_station Down_station Up_milepost Down_milepost Direction 1 AVI-0429S-Independence AVI-0429S-SeidelRd 15.454 11.808 SB 2 AVI-0429S-CR535 AVI-0429S-Independence 19.990 15.454 SB 3 AVI-0429S-CR535_DMS AVI-0429S-CR535 20.710 19.990 SB 4 AVI-0429S-Turnpike_S AVI-0429S-CR535_DMS 21.909 20.710 SB 5 AVI-0429S-Turnpike_N AVI-0408E-WBoundary 22.927 18.971 SB 6 AVI-0429S-Turnpike_N AVI-0429S-Turnpike_S 22.927 21.909 SB 7 AVI-0429S-WColonialDr AVI-0429S-Turnpike_N 23.541 22.927 SB 8 AVI-0429S-SR438 AVI-0429S-WColonialDr 24.692 23.541 SB 9 AVI-0429S-WestRd AVI-0429S-SR438 27.076 24.692 SB

127
Table B-9 SR 528 Eastbound AVI System Segmentation
Link Up_station Down_station Up_milepost Down_milepost Direction 1 AVI-0528E-WBndry_DMS AVI-0528E-TradeportDr 8.659 8.988 EB 2 AVI-0528E-TradeportDr AVI-0528E-SR436 8.988 10.257 EB 3 AVI-0528E-SR436 AVI-0528E-GoldenrodRd 10.257 11.663 EB 4 AVI-0528E-GoldenrodRd AVI-0528E-NarcoosseeRd 11.663 13.128 EB 5 AVI-0528E-NarcoosseeRd AVI-0528E-SR417 13.128 15 EB 6 AVI-0528E-SR417 AVI-0528E-ICP 15 19.467 EB 7 AVI-0528E-ICP AVI-0528E-DallasBlvd 19.467 23.519 EB 8 AVI-0528E-DallasBlvd AVI-0528E-SR520 23.519 30.577 EB
Table B-10 SR 528 Westbound AVI System Segmentation
Link Up_station Down_station Up_milepost Down_milepost Direction 1 AVI-0528W-TradeportDr AVI-0528W-WBndry_DMS 9.82 8.501 WB 2 AVI-0528W-SR436_W AVI-0528W-TradeportDr 10.806 9.82 WB 3 AVI-0528W-GoldenrodRd AVI-0528W-SR436_W 12.475 10.806 WB 4 AVI-0528W-NarcoosseDMS AVI-0528W-GoldenrodRd 14.019 12.475 WB 5 AVI-0528W-SR417 AVI-0528W-NarcoosseDMS 16.253 14.019 WB 6 AVI-0528W-ICP AVI-0528W-SR417 20.139 16.253 WB 7 AVI-0528W-Dallas_DMS AVI-0528W-ICP 23.246 20.139 WB 8 AVI-0528W-SR520 AVI-0528W-Dallas_DMS 30.843 23.246 WB 9 AVI-0528W-SR520_DMS AVI-0528W-SR520 31.704 30.843 WB

128
APPENDIX C. MVDS SYSTEM AND LANE MANAGEMENT Table C-1 SR 408 Eastbound MVDS System and Lane Management
Eastbound Number of lanes Eastbound Number of lanes
ID Milepost Mainline (w/ TP Express) TP Cash Ramp ID Milepost Mainline (w/ TP
Express) TP Cash Ramp
1 1.2 2 30 11.5 5 1 2 1.4 2 31 12.1 5 3 1.7 2 2 32 12.5 5 1 4 2.2 3 1 33 12.9 5 2 5 2.4 3 1 34 13.3 5 2 6 2.7 3 2 35 13.7 3 3 7 3.2 2 1 36 14.2 3 2 8 3.6 2 1 37 14.5 4 9 4.3 3 1 38 14.7 4 2 10 4.6 4 39 15 5 11 4.9 3 1 40 15.7 4 2 12 5.3 3 1 41 15.8 4 1 13 6 3 2 1 42 16.1 4 1 14 6.4 3 1 43 16.5 5 15 6.8 3 44 17.3 3 3 16 7 3 1 45 17.7 2 1 17 7.4 3 46 18 2 1 18 7.6 3 1 47 18.4 2 1 19 8 3 1 48 18.8 2 1 20 8.4 3 1 49 19 2 2 21 8.9 3 1 50 19.4 2 1 22 9.2 3 1 51 19.5 2 1 23 9.4 4 1 52 20.1 2 1 24 9.6 3 1 53 20.3 2 25 9.7 1 54 20.8 2 1 26 10.3 3 1 55 21.8 2 27 10.6 4 1 56 22.3 2 2 28 10.8 5 1 57 22.7 2 29 11.2 5 1

129
Table C-2 SR 408 Westbound MVDS System and Lane Management
Westbound Number of lanes Westbound Number of lanes
ID Milepost Mainline (w/ TP Express) TP Cash Ramp ID Milepost Mainline (w/ TP
Express) TP Cash Ramp
1 1.2 2 29 11.6 4 1 2 1.4 2 30 12.1 5 3 1.6 3 2 31 12.6 5 2 4 2 3 1 32 13 5 1 5 2.4 3 1 33 13.3 3 2 6 2.7 2 1 34 13.6 3 4 1 7 3.2 2 2 35 14.2 5 1 8 3.6 2 1 36 14.4 4 1 9 4.3 3 2 37 14.5 5 10 4.6 4 38 15.2 5 11 4.9 3 1 39 15.7 5 1 12 5.3 3 1 40 15.9 4 1 13 5.9 3 2 1 41 16.1 4 2 14 6.3 3 2 42 16.5 5 15 6.8 3 43 17 3 2 16 7.3 3 1 44 17.8 3 1 17 7.4 4 45 18 3 1 18 7.6 3 1 46 18.4 2 1 19 8.1 3 1 47 18.8 2 1 20 8.4 3 1 48 19 2 1 21 8.9 3 1 49 19.4 2 2 22 9.2 3 1 50 19.7 3 1 23 9.7 3 1 51 19.9 2 1 24 9.9 2 2 52 20.7 3 25 10.3 3 1 53 20.8 2 1 26 10.6 4 54 21.8 2 27 10.9 4 2 55 22.3 2 1 28 11.3 5 1 56 22.7 2 1

130
Table C-3 SR 414 Eastbound MVDS System and Lane Management
Eastbound Number of lanes ID Milepost Mainline (w/ TP Express) TP Cash Ramp 1 3.6 2 3 2 3.8 2 2 3 4.3 3 1 4 4.9 3 5 5.4 3 2 6 5.8 3 1 7 6.3 3 8 6.6 3 1 9 7.2 3
10 7.4 3 1 11 8.1 3 1 12 8.3 4 13 8.9 3 2 14 9.3 2 1
Table C-4 SR 414 Westbound MVDS System and Lane Management
Westbound Number of lanes ID Milepost Mainline (w/ TP Express) TP Cash Ramp 1 3.8 2 3 2 4.3 3 1 3 4.9 3 4 5.4 3 1 5 5.8 3 2 6 6.3 3 7 6.6 3 1 8 7.2 3 9 7.4 3 1 10 8.1 3 2 11 8.3 4 12 9.2 2 13 9.3 3 1

131
Table C-5 SR 417 Northbound MVDS System and Lane Management
Northbound Number of lanes Northbound Number of lanes
ID Milepost Mainline (w/ TP Express) TP Cash Ramp ID Milepost Mainline (w/ TP
Express) TP Cash Ramp
1 5.9 2 29 23.9 2 1 2 6.2 2 2 30 24.5 2 3 7.2 2 2 31 25 2 1 4 7.5 2 1 32 26.1 2 3 5 8.2 2 33 26.9 4 6 9.4 2 1 34 27.3 3 2 7 10.1 2 1 35 27.9 3 1 8 10.6 2 1 36 28.1 3 2 9 11 2 2 37 28.5 3 1 10 12.2 2 38 28.7 4 11 13.1 3 2 39 29.5 3 1 12 13.9 2 1 40 30.2 2 1 13 14.5 2 41 31.2 2 14 15.2 4 42 31.9 2 15 15.6 2 1 43 32.5 2 1 16 16.4 2 44 33 1 17 16.6 2 1 45 33.3 4 1 18 17.9 2 1 46 33.6 4 19 18.2 2 47 34 3 2 20 18.8 2 1 48 34.6 3 1 21 19.3 2 1 49 35.2 3 22 20.4 2 50 35.5 2 2 23 20.9 2 51 36 3 2 24 21.3 2 1 52 36.4 4 2 25 22 2 1 53 36.7 3 1 26 22.5 2 1 54 36.9 3 1 27 23 2 1 55 37.2 3 28 23.6 2 1 56 37.7 2

132
Table C-6 SR 417 Southbound MVDS System and Lane Management
Southbound Number of lanes Southbound Number of lanes
ID Milepost Mainline (w/ TP Express) TP Cash Ramp ID Milepost Mainline (w/ TP
Express) TP Cash Ramp
1 5.9 2 29 24.2 2 1 2 6.2 2 2 30 24.5 2 1 3 7.2 2 1 31 24.9 2 1 4 7.5 2 2 32 26.1 3 2 5 8.2 2 33 26.9 4 6 9.4 2 1 34 27.3 3 1 7 10.3 2 2 35 27.9 4 1 8 10.7 2 1 36 28.1 3 1 9 11.2 3 1 37 28.5 3 2 10 12.2 2 38 28.7 4 11 13.2 2 1 39 29.5 3 1 12 13.9 2 1 40 30.2 2 1 13 14.7 2 41 31.2 2 14 15.2 3 42 31.9 2 15 15.6 2 2 43 32.5 2 1 16 16.4 2 44 32.9 1 17 16.6 2 1 45 33.1 3 2 18 17.7 2 1 46 33.6 3 2 19 18.2 2 47 34.5 3 1 20 18.8 2 1 48 34.8 3 1 21 19.5 2 1 49 35.2 3 22 20.4 2 50 35.5 2 1 23 20.9 2 51 36 2 2 24 21.3 2 1 52 36.4 3 1 25 22.2 2 1 53 36.7 2 1 26 23 3 54 37 2 1 27 23.2 2 1 55 37.2 2 28 23.5 2 1 56 37.7 2

133
Table C-7 SR 429 Northbound MVDS System and Lane Management
Northbound Number of lanes Northbound Number of lanes
ID Milepost Mainline (w/ TP Express) TP Cash Ramp ID Milepost Mainline (w/ TP
Express) TP Cash Ramp
1 10.9 2 16 22.8 2 1 2 13.7 2 17 23.2 2 2 3 14.6 2 1 18 23.6 3 2 4 15.3 2 1 19 24.5 2 1 5 16.1 2 20 24.7 2 6 16.7 2 1 21 26 2 7 17.2 2 1 22 26.3 2 1 8 18.4 2 23 26.8 2 1 9 18.9 2 1 24 27.7 2 2 10 19.8 2 1 25 27.9 2 1 11 20.4 2 26 28.9 2 1 12 21.7 2 1 27 29.4 2 1 13 21.9 2 2 28 29.6 3 14 22.4 2 1 29 30 2 2 15 22.6 3

134
Table C-8 SR 429 Southbound MVDS System and Lane Management
Southbound Number of lanes Southbound Number of lanes
ID Milepost Mainline (w/ TP Express) TP Cash Ramp ID Milepost Mainline (w/ TP
Express) TP Cash Ramp
1 10.9 2 16 22.7 2 2 2 11.5 2 17 23.2 2 1 3 14.6 2 1 18 24.2 2 1 4 15.3 2 1 19 24.5 3 5 16.1 2 20 24.7 2 6 16.7 2 1 21 26 2 7 17.2 2 2 22 26.3 2 1 8 18.4 2 23 26.8 2 1 9 18.9 2 1 24 27.7 2 1 10 19.8 2 1 25 27.9 2 2 11 20.7 2 26 28.9 2 1 12 21.9 2 1 27 29.4 3 1 13 22.2 2 28 29.6 4 14 22.4 2 1 29 29.8 2 2 15 22.5 2

135
Table C-9 SR 528 Eastbound MVDS System and Lane Management
Eastbound Number of lanes Eastbound Number of lanes
ID Milepost Mainline (w/ TP Express) TP Cash Ramp ID Milepost Mainline (w/ TP
Express) TP Cash Ramp
1 8.5 3 1 16 15.3 3 2 9 3 1 17 15.7 2 3 9.5 3 1 18 15.9 2 2 4 9.8 3 19 16.6 2 2 5 10.3 2 3 20 17.2 2 2 6 10.7 2 1 21 19.5 2 1 7 10.8 1 22 20.2 2 1 8 11.1 2 1 23 23.2 2 9 11.7 3 1 24 23.5 2 1 10 12.5 3 1 25 25.9 2 2 11 12.8 4 26 26.3 2 1 12 13.2 3 2 27 28.6 2 13 13.8 2 1 28 30.6 2 1 14 14.5 2 29 31.9 2 15 15 2 2
Table C-10 SR 528 Westbound MVDS System and Lane Management
Westbound Number of lanes Westbound Number of lanes
ID Milepost Mainline (w/ TP Express) TP Cash Ramp ID Milepost Mainline (w/ TP
Express) TP Cash Ramp
1 8.5 3 1 16 15.3 2 2 2 9.4 3 1 17 15.6 2 1 3 9.5 3 1 18 15.9 2 2 4 9.8 3 19 16.6 2 2 5 10.3 4 20 17.2 2 2 6 10.5 2 2 21 19.5 2 1 7 10.9 2 1 22 20.2 2 1 8 11 3 2 23 23.3 2 9 12 4 1 24 23.5 2 1 10 12.2 3 1 25 25.9 2 1 11 12.5 3 1 26 26.3 2 2 12 12.8 3 27 28.6 2 13 13.2 3 1 28 30.6 2 1 14 13.8 3 1 29 31.9 2 15 14.5 2

136
APPENDIX D. DMS LOCATIONS ON EXPRESSWAYS Table D-1 DMS Locations on Expressway System
ID DMS ID Expressway Direction Milepost Type 1 SR 408 EB @ MM 01.0 Ramp SR 408 EB 1.0 Ramp 2 SR 408 EB @ MM 01.4 SR 408 EB 1.4 Mainline 3 SR 408 EB @ MM 04.4 SR 408 EB 4.4 Mainline 4 SR 408 EB @ MM 07.7 SR 408 EB 7.7 Mainline 5 SR 408 EB @ MM 11.1 SR 408 EB 11.1 Mainline 6 SR 408 EB @ MM 15.2 SR 408 EB 15.2 Mainline 7 SR 408 EB @ MM 20.6 SR 408 EB 20.6 Mainline 8 SR 408 WB @ MM 04.9 SR 408 WB 4.9 Mainline 9 SR 408 WB @ MM 09.3 SR 408 WB 9.3 Mainline
10 SR 408 WB @ MM 11.8 SR 408 WB 11.8 Mainline 11 SR 408 WB @ MM 15.2 SR 408 WB 15.2 Mainline 12 SR 408 WB @ MM 20.6 SR 408 WB 20.6 Mainline 13 SR 414 WB @ MM 09.6 SR 414 WB 9.6 Mainline 14 SR 417 NB @ MM 06.5 SR 417 NB 6.5 Mainline 15 SR 417 NB @ MM 14.7 SR 417 NB 14.7 Mainline 16 SR 417 NB @ MM 20.6 SR 417 NB 20.6 Mainline 17 SR 417 NB @ MM 27.0 SR 417 NB 27.0 Mainline 18 SR 417 NB @ MM 33.4 SR 417 NB 33.4 Mainline 19 SR 417 SB @ MM 08.1 SR 417 SB 8.1 Mainline 20 SR 417 SB @ MM 14.7 SR 417 SB 14.7 Mainline 21 SR 417 SB @ MM 18.2 SR 417 SB 18.2 Mainline 22 SR 417 SB @ MM 30.9 SR 417 SB 30.9 Mainline 23 SR 417 SB @ MM 35.3 SR 417 SB 35.3 Mainline 24 SR 417 SB @ MM 37.8 SR 417 SB 37.8 Mainline 25 SR 429 NB @ MM 11.8 SR 429 NB 11.8 Mainline 26 SR 429 NB @ MM 20.7 SR 429 NB 20.7 Mainline 27 SR 429 NB @ MM 25.0 SR 429 NB 25.0 Mainline 28 SR 429 SB @ MM 20.7 SR 429 SB 20.7 Mainline 29 SR 429 SB @ MM 25.0 SR 429 SB 25.0 Mainline 30 SR 451 SB @ MM 01.5 SR 451 SB 1.5 Mainline 31 SR 520 WB @ SR 528 SR 520 WB -- Mainline 32 SR 528 EB @ MM 08.6 SR 528 EB 8.6 Mainline 33 SR 528 EB @ MM 11.8 SR 528 EB 11.8 Mainline 34 SR 528 EB @ MM 23.2 SR 528 EB 23.2 Mainline 35 SR 528 WB @ MM 14.0 SR 528 WB 14 Mainline 36 SR 528 WB @ MM 23.2 SR 528 WB 23.2 Mainline 37 SR 528 WB @ MM 31.7 SR 528 WB 31.7 Mainline

137
APPENDIX E. EXPRESSWAY MAINLINE OPERATION OVERVIEW
Figure E-1 Weekday Hourly Volume along SR 408 Westbound

138
Figure E-2 Weekday Hourly Volume along SR 414 Eastbound
Figure E-3 Weekday Hourly Volume along SR 414 Westbound

139
Figure E-4 Weekday Hourly Volume along SR 417 Northbound
Figure E-5 Weekday Hourly Volume along SR 417 Southbound

140
Figure E-6 Weekday Hourly Volume along SR 429 Northbound
Figure E-7 Weekday Hourly Volume along SR 429 Southbound

141
Figure E-8 Weekday Hourly Volume along SR 528 Eastbound
Figure E-9 Weekday Hourly Volume along SR 528 Westbound

142
APPENDIX F. EXPRESSWAY MAINLINE TRAFFIC PATTERN
(a) (b)
Figure F-1 Spatial-Temporal Hourly Volume Distribution on SR 414 (a) Eastbound and (b) Westbound
(a) (b)
Figure F-2 Spatial-Temporal Hourly Volume Distribution on SR 417 (a) Northbound and (b) Southbound

143
(a) (b)
Figure F-3 Spatial-Temporal Hourly Volume Distribution on SR 429 (a) Northbound and (b) Southbound
(a) (b)
Figure F-4 Spatial-Temporal Hourly Volume Distribution on SR 528 (a) Eastbound and (b) Westbound

144
APPENDIX G. MAINLINE TOLL PLAZA CASH LANES TRAFFIC VOLUME
Figure G-1 SR 408 Westbound Toll Plaza Cash Lanes Traffic Volume

145
Figure G-2 SR 414 Eastbound Toll Plaza Cash Lanes Traffic Volume
Figure G-3 SR 414 Westbound Toll Plaza Cash Lanes Traffic Volume

146
Figure G-4 SR 417 Northbound Toll Plaza Cash Lanes Traffic Volume
Figure G-5 SR 417 Southbound Toll Plaza Cash Lanes Traffic Volume

147
Figure G-6 SR 429 Northbound Toll Plaza Cash Lanes Traffic Volume
Figure G-7 SR 429 Southbound Toll Plaza Cash Lanes Traffic Volume
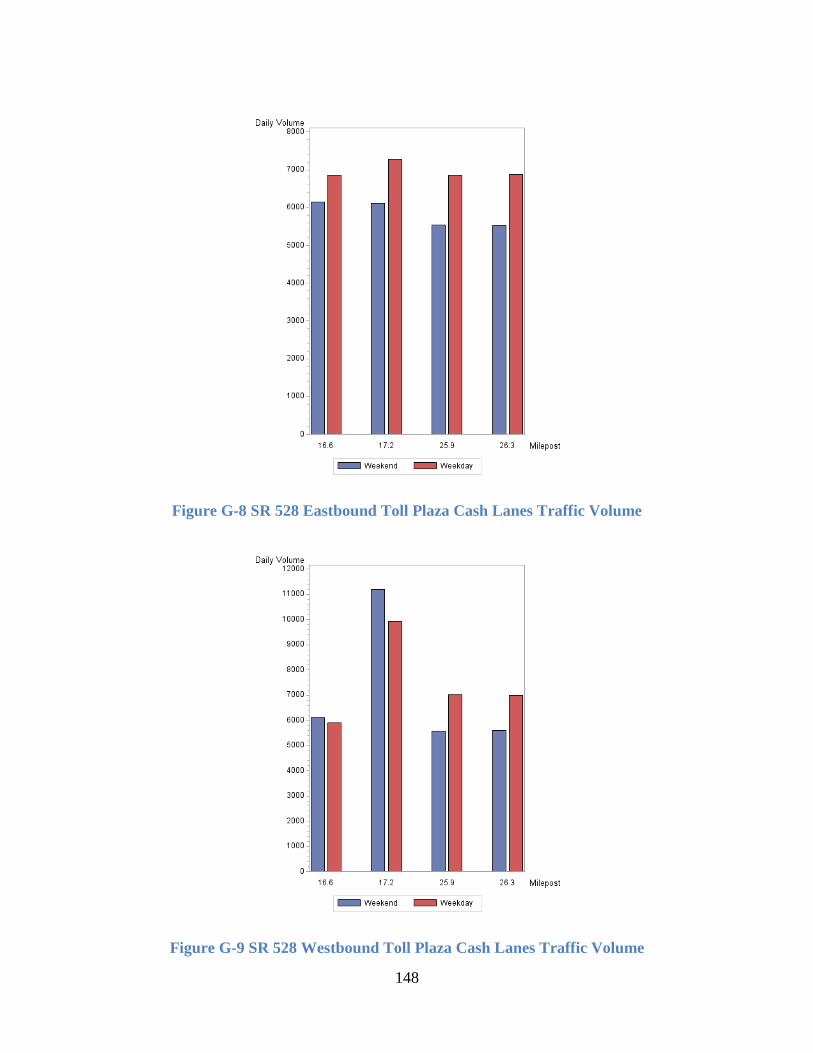
148
Figure G-8 SR 528 Eastbound Toll Plaza Cash Lanes Traffic Volume
Figure G-9 SR 528 Westbound Toll Plaza Cash Lanes Traffic Volume

149
APPENDIX H. EXPRESSWAY RAMP WEEKDAY TRAFFIC
Figure H-1 SR 408 Westbound Weekday Ramp Traffic Volume
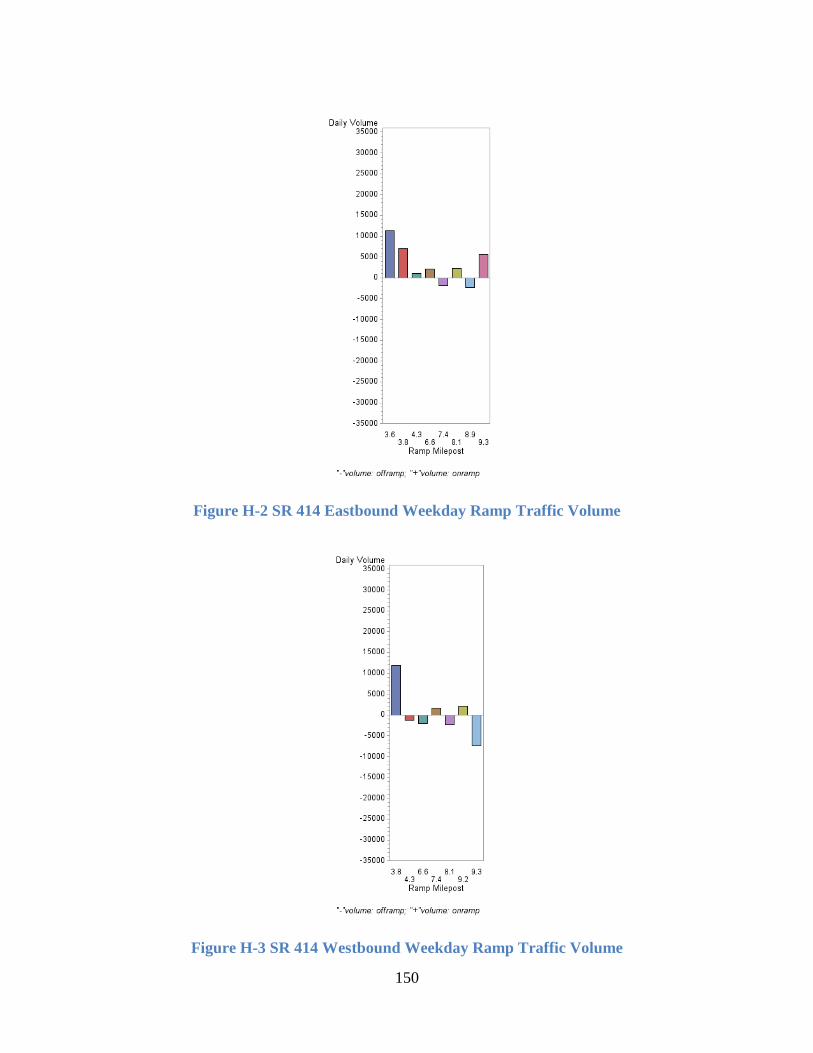
150
Figure H-2 SR 414 Eastbound Weekday Ramp Traffic Volume
Figure H-3 SR 414 Westbound Weekday Ramp Traffic Volume

151
Figure H-4 SR 417 Northbound Weekday Ramp Traffic Volume
Figure H-5 SR 417 Southbound Weekday Ramp Traffic Volume

152
Figure H-6 SR 429 Northbound Weekday Ramp Traffic Volume
Figure H-7 SR 429 Southbound Weekday Ramp Traffic Volume
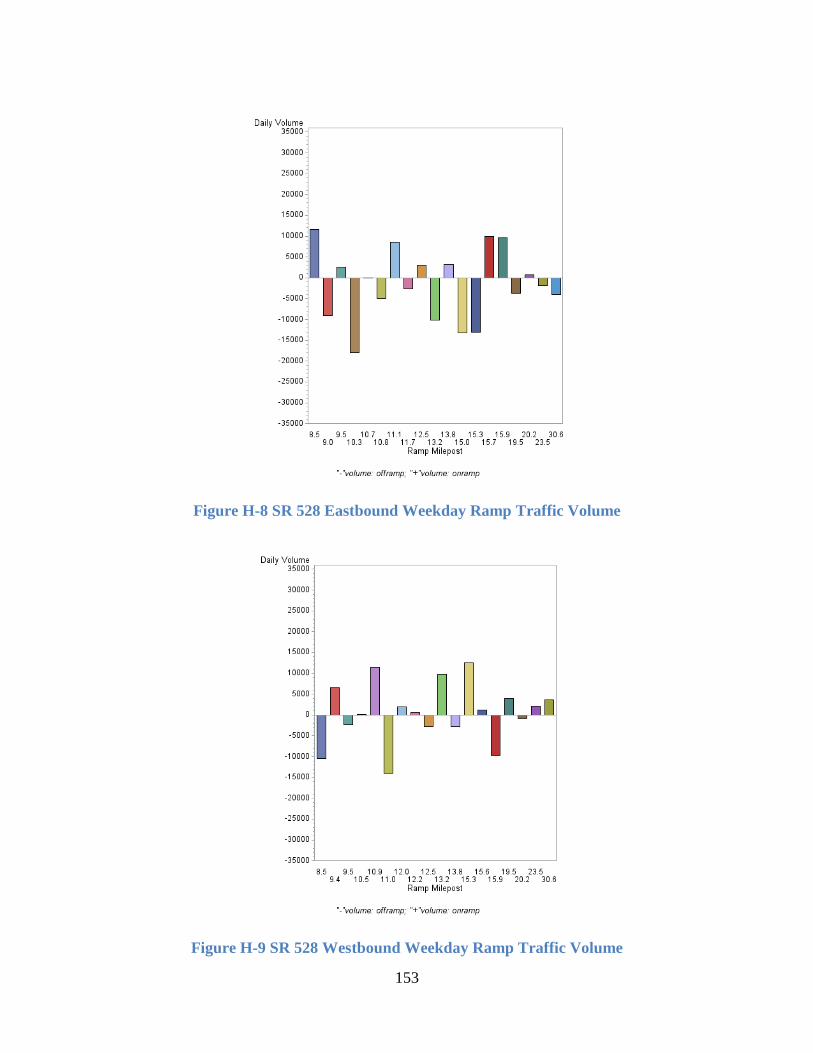
153
Figure H-8 SR 528 Eastbound Weekday Ramp Traffic Volume
Figure H-9 SR 528 Westbound Weekday Ramp Traffic Volume

154
APPENDIX I. MAINLINE CONGESTION MEASUREMENT (1) OCCUPANCY
(a) (b)
Figure I-1 Mainline Weekday Occupancy of SR 414 (a) Eastbound and (b) Westbound
(a) (b)
Figure I-2 Mainline Weekday Occupancy of SR 417 (a) Northbound and (b) Southbound

155
(a) (b)
Figure I-3 Mainline Weekday Occupancy of SR 429 (a) Northbound and (b) Southbound
(a) (b)
Figure I-4 Mainline Weekday Occupancy of SR 528 (a) Eastbound and (b) Westbound

156
APPENDIX J. MAINLINE CONGESTION MEASUREMENT (2) CONGESTION INDEX
(a) (b)
Figure J-1 Mainline Weekday Congestion Index of SR 414 (a) Eastbound and (b) Westbound
(a) (b)
Figure J-2 Mainline Weekday Congestion Index of SR 417 (a) Northbound and (b) Southbound

157
(a) (b)
Figure J-3 Mainline Weekday Congestion Index of SR 429 (a) Northbound and (b) Southbound
(a) (b)
Figure J-4 Mainline Weekday Congestion Index of SR 528 (a) Eastbound and (b) Westbound

158
APPENDIX K. MAINLINE SYSTEM OCCUPANCY AND TREND OF CONGESTION
Figure K-1 SR 408 Westbound System Occupancy and Trend of Congestion

159
Figure K-2 SR 414 Eastbound System Occupancy and Trend of Congestion
Figure K-3 SR 414 Westbound System Occupancy and Trend of Congestion

160
Figure K-4 SR 417 Northbound System Occupancy and Trend of Congestion
Figure K-5 SR 417 Southbound System Occupancy and Trend of Congestion

161
Figure K-6 SR 429 Northbound System Occupancy and Trend of Congestion
Figure K-7 SR 429 Southbound System Occupancy and Trend of Congestion

162
Figure K-8 SR 528 Eastbound System Occupancy and Trend of Congestion
Figure K-9 SR 528 Westbound System Occupancy and Trend of Congestion

163
APPENDIX L. PEAK HOUR OCCUPANCY PROFILE AND TREND OF CONGESTION
Figure L-1 SR 408 Westbound Peak Hour Occupancy and Trend of Congestion

164
Figure L-2 SR 417 Northbound Peak Hour Occupancy and Trend of Congestion
Figure L-3 SR 417 Southbound Peak Hour Occupancy and Trend of Congestion

165
Figure L-4 SR 528 Eastbound Peak Hour Occupancy and Trend of Congestion
Figure L-5 SR 528 Westbound Peak Hour Occupancy and Trend of Congestion

166
APPENDIX M. MAINLINE SYSTEM CONGESTION INDEX AND TREND OF CONGESTION
Figure M-1 SR 408 Westbound System Congestion Index and Trend of Congestion

167
Figure M-2 SR 414 Eastbound System Congestion Index and Trend of Congestion
Figure M-3 SR 414 Westbound System Congestion Index and Trend of Congestion

168
Figure M-4 SR 417 Northbound System Congestion Index and Trend of Congestion
Figure M-5 SR 417 Southbound System Congestion Index and Trend of Congestion

169
Figure M-6 SR 429 Northbound System Congestion Index and Trend of Congestion
Figure M-7 SR 429 Southbound System Congestion Index and Trend of Congestion

170
Figure M-8 SR 528 Eastbound System Congestion Index and Trend of Congestion
Figure M-9 SR 528 Westbound System Congestion Index and Trend of Congestion

171
APPENDIX N. PEAK HOUR CONGESTION INDEX PROFILE AND TREND OF CONGESTION
Figure N-1 SR 408 Westbound Peak Hour Congestion Index and Trend of Congestion

172
Figure N-2 SR 417 Northbound Peak Hour Congestion Index and Trend of Congestion
Figure N-3 SR 417 Southbound Peak Hour Congestion Index and Trend of Congestion

173
Figure N-4 SR 528 EB Peak Hour Congestion Index and Trend of Congestion
Figure N-5 SR 528 WB Peak Hour Congestion Index and Trend of Congestion

174
APPENDIX O. RAMP OCCUPANCY PROFILE
Figure O-1 SR 408 WB Ramp Occupancy Profile

175
Figure O-2 SR 414 EB Ramp Occupancy Profile
Figure O-3 SR 414 WB Ramp Occupancy Profile

176
Figure O-4 SR 417 NB Ramp Occupancy Profile
Figure O-5 SR417 SB Ramp Occupancy Profile

177
Figure O-6 SR 429 NB Ramp Occupancy Profile
Figure O-7 SR 429 SB Ramp Occupancy Profile

178
Figure O-8 SR 528 EB Ramp Occupancy Profile
Figure O-9 SR 528 WB Ramp Occupancy Profile

179
APPENDIX P. RAMP CONGESTION INDEX PROFILE
Figure P-1 SR 408 Westbound Ramp Congestion Index Profile

180
Figure P-2 SR 414 Eastbound Ramp Congestion Index Profile
Figure P-3 SR 414 Westbound Ramp Congestion Index Profile

181
Figure P-4 SR 417 Northbound Ramp Congestion Index Profile
Figure P-5 SR 417 Southbound Ramp Congestion Index Profile

182
Figure P-6 SR 429 Northbound Ramp Congestion Index Profile
Figure P-7 SR 429 Southbound Ramp Congestion Index Profile

183
Figure P-8 SR 528 Eastbound Ramp Congestion Index Profile
Figure P-9 SR 528 Westbound Ramp Congestion Index Profile

184
APPENDIX Q. EXPRESSWAY CONGESTION AREA IDENTIFICATION AND DMS SUGGESTION
Table Q-1 SR 414 Eastbound Congestion Area
Hour 7 8 Minute 50 55 0
Congested Location 9.3 9.3 9.3
Figure Q-1 SR 414 Eastbound Congested Location and Suggested DMS Area
Suggested DMS
Area
SR 414 Eastbound Congested Location
Congested Location

185
Table Q-2 SR 417 Northbound Congestion Area
Hour 17 Minute 20 25 30 35 40 45 50 55
Beginning of Queue 35.2 35.2 35.2 35.2 35.2 35.2 35.2 35.2 End of Queue 35.5 35.5 35.5 35.5 35.5 35.5 35.5 35.5
Congested Location 37.7 37.7 37.7 37.7 37.7 37.7 37.7 37.7

186
Figure Q-2 SR 417 Northbound Congested Segment and DMS Location
Beginning of Queue
End of Queue
SR 417 Northbound Queue
DMS Location

187
Figure Q-3 SR 417 Northbound Congested Location and Suggested DMS Area
SR417 Northbound Congested Location
Congested Location
Suggested DMS
Area

188
Table Q-3 SR 417 Southbound Congestion Area
Hour 17 Minute 20 25 30 35 40 45 50 55
Congested Location 31.9 31.9 31.9 31.9 31.9 31.9 31.9 31.9
Figure Q-4 SR 417 Southbound Congested Location and Suggested DMS Area
Congested Location
SR417 Southbound Congested Location
Suggested
DMS Area

189
Table Q-4 SR 528 Eastbound Congestion Area
Hour 17 18 Minute 10 15 20 25 30 35 40 45 50 55 0 5 10
Beginning of Queue 9.5 9.5 9 9 9 9 9 9 9 9 9.5 9.5 9.5 End of Queue 9.8 9.8 9.8 9.8 9.8 9.8 9.8 9.8 9.8 9.8 9.8 9.8 9.8
Figure Q-5 SR 528 Eastbound Congested Segment and DMS Location
End of Queue
Beginning of Queue
SR528 Eastbound Queue
DMS Location

190
Table Q-5 SR 528 Westbound Congestion Area
Hour 7 8 Minute 45 50 55 0 5 45 50
Beginning of Queue 10.9 11 11 10.9 10.9 10.9 10.9 End of Queue 10.5 10.3 10.5 10.5 10.5 10.5 10.5
Figure Q-6 SR 528 Westbound Congested Segment and Suggested DMS Area
SR528 Westbound Queue
Beginning of Queue End of Queue
Suggested DMS
Area

191
APPENDIX R. THE QUESTIONNAIRE 1. Which of the following tolling system does your agency operate for toll collection?
(1) Open tolling only
(2) Combination of open tolling and plazas
(3) Plazas only
2. Are there any procedures and practices for closing on ramps in case of total shut-down
of the main-line travel lanes?
(1) Yes
(2) No
3. If yes, what are these procedures/practices in case of the availability of a frontage road?
(1) Re-route vehicles to downstream ramps
(2) Detour to other surface streets
(3) Treat on a case by case basis
(4) Other, please specify ……………………………………………………………………
4. If yes but there is no frontage road or alternative available?
(1) Re-route vehicles to downstream ramps
(2) Detour to other surface streets
(3) Treat on a case by case basis
(4) Other, please specify ……………………………………………………………………
5. If there are no procedures or practices, do you provide any information to motorists?
(1) Yes
(2) No
6. How do you provide ramp-closure (detour) information to the drivers?
(1) Dynamic Message Sign (DMS)
(2) Radio
(3) Fixed Signs
(4) Other, please specify ……………………………………………………………………
7. Do you provide advice based on the specific closure condition?
(1) Yes, please explain ……………………………………………………………………
(2) No

192
8. Does this procedure change depending on factors such as speed limit, number of lanes,
time of day, etc?
(1) Yes, how ……………………………………………………………………
(2) No
9. Do you have any on-ramp volume control strategy (like ramp metering)?
(1) Yes, how ……………………………………………………………………
(2) No
10. What ITS systems do you use on your roadways? Check all that apply
(1) Automatic Vehicle Identification (AVI)
(2) Dynamic (Changeable or Variable) message signs
(3) Remote Traffic Management Sensors (e.g., Wavetronix)
(4) Active Traffic Management, e.g., queue warning, please specify ………………………….
(5) Travel time estimation
(6) Electronic Toll Collection (ETC)
(7) Other, please specify ……………………………………………………………………
11. What is the average spacing between ramps? ……………….. mile
12. In the space below, please provide any relevant information that you can share with us
about safety and/or traffic management on your system.
13. (Added Question) Is there any knowledge of how you close the ramps in case of shut-
down of the main line? Do you take proactive measures such as staging cones at
strategic locations, installing fixed gates, staging other MOT signage, etc?
* Photo provided by Florida’s Turnpike
Figure R-1 Florida’s Turnpike Rollover Scene (Lane Blocking) Cone Setup

193
* Photo provided by Attica Tollway Operations Authority, Greece
Figure R-2 Heavy Yellow/Black Chain and Free-standing Pole
* Photo provided by Attica Tollway Operations Authority, Greece
Figure R-3 Chain and Safety Barrier

194
* Photo provided by Attica Tollway Operations Authority, Greece
Figure R-4 “Entrance Closed” Sign

195
APPENDIX S. EXPRESSWAY CRASH BY TYPE OF LANE Table S-1 Expressway Crash by Type of Lane in 2012
Expressway Total Mainline Toll Plaza Cash Ramp SR 408 626 402 27 197 SR 414 25 6 0 19 SR 417 369 193 13 163 SR 429 78 43 4 31 SR 528 277 202 5 70
Table S-2 Expressway Crash by Type of Lane in 2013
Expressway Total Mainline Toll Plaza Cash Ramp SR 408 700 492 32 176 SR 414 40 14 1 25 SR 417 365 152 11 192 SR 429 76 47 1 28 SR 528 313 242 5 66
Table S-3 Expressway Crash by Type of Lane in 2014 (Jan – Jun)
Expressway Total Mainline Toll Plaza Cash Ramp SR 408 361 239 19 103 SR 414 35 14 1 20 SR 417 218 103 6 109 SR 429 67 49 0 18 SR 528 178 143 2 33

196
APPENDIX T. CRASH BY YEAR Table T-1 SR 414 Annual Crash Count by Type of Lane
Lane Type 2011 2012 2013 2014 (Jan – Jun) Total Crash 30 25 40 35
Mainline 10 6 14 14 Toll Plaza Cash Lane 0 0 1 1
Ramp 20 19 25 20
Figure T-1 SR 414 Crash Count by Year

197
Table T-2 SR 417 Annual Crash Count by Type of Lane
Lane Type 2011 2012 2013 2014 (Jan – Jun) Total Crash 337 369 365 218
Mainline 204 193 152 103 Toll Plaza Cash Lane 15 13 11 6
Ramp 118 163 192 109
Figure T-2 SR 417 SR 414 Crash Count by Year

198
Table T-3 SR 429 Annual Crash Count by Type of Lane
Lane Type 2011 2012 2013 2014 (Jan – Jun) Total Crash 83 78 76 67
Mainline 56 43 47 49 Toll Plaza Cash Lane 3 4 1 0
Ramp 24 31 28 18
Figure T-3 SR 429 SR 414 Crash Count by Year

199
Table T-4 SR 528 Annual Crash Count by Type of Lane
Lane Type 2011 2012 2013 2014 (Jan -- Jun) Total Crash 263 277 313 178
Mainline 208 202 242 143 Toll Plaza Cash Lane 13 5 5 2
Ramp 42 70 66 33
Figure T-4 SR 528 SR 414 Crash Count by Year
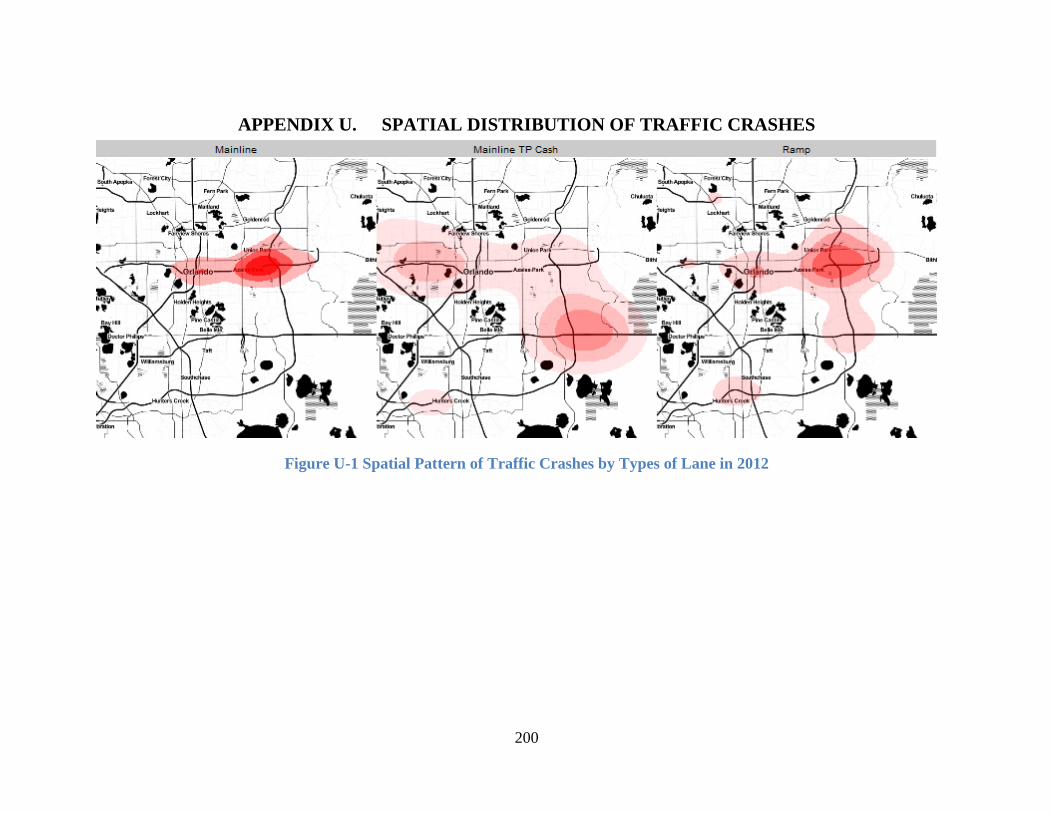
200
APPENDIX U. SPATIAL DISTRIBUTION OF TRAFFIC CRASHES
Figure U-1 Spatial Pattern of Traffic Crashes by Types of Lane in 2012

201
Figure U-2 Spatial Pattern of Traffic Crashes by Types of Lane in 2013

202
Figure U-3 Spatial Pattern of Traffic Crashes by Types of Lane in 2014 (Jan -- Jun)

203
Figure U-4 Spatial Pattern of Traffic Crashes by Crash Type in 2012

204
Figure U-5 Spatial Pattern of Traffic Crashes by Crash Type in 2013

205
Figure U-6 Spatial Pattern of Traffic Crashes by Crash Type in 2014 (Jan – Jun)

206
Figure U-7 Spatial Pattern of Traffic Crashes by Number of Vehicles in 2012

207
Figure U-8 Spatial Pattern of Traffic Crashes by Number of Vehicles in 2013

208
Figure U-9 Spatial Pattern of Traffic Crashes by Number of Vehicles in 2014 (Jan – Jun)
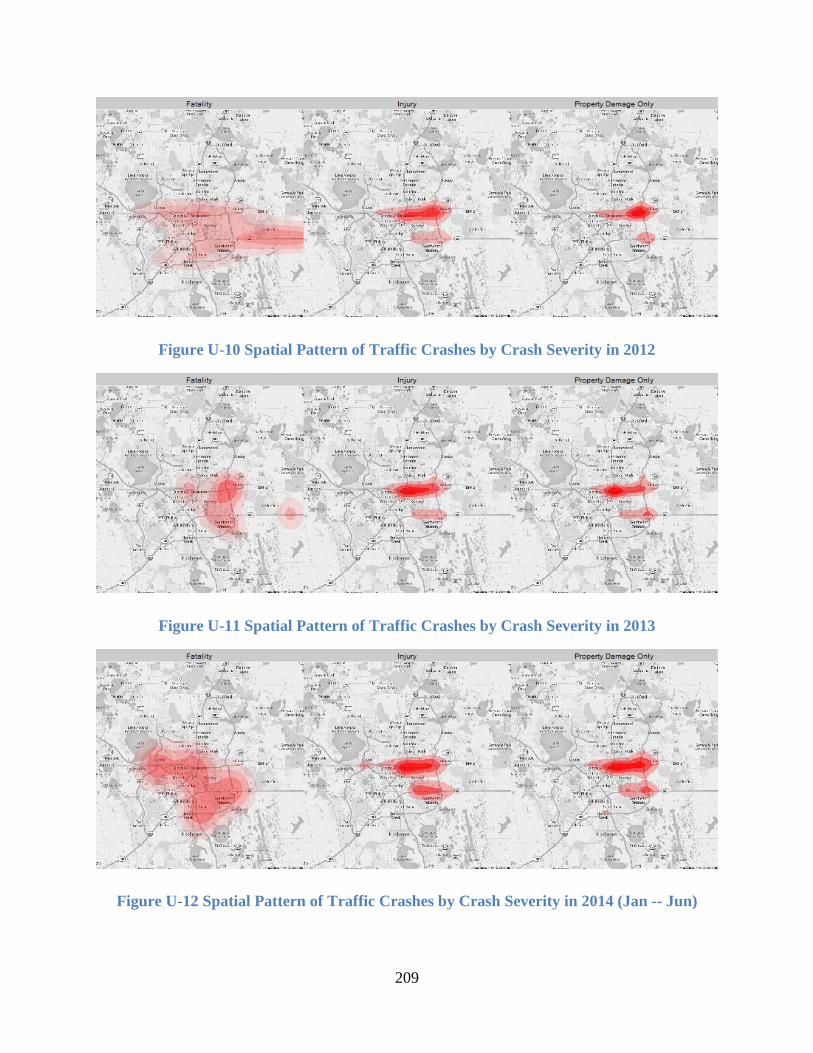
209
Figure U-10 Spatial Pattern of Traffic Crashes by Crash Severity in 2012
Figure U-11 Spatial Pattern of Traffic Crashes by Crash Severity in 2013
Figure U-12 Spatial Pattern of Traffic Crashes by Crash Severity in 2014 (Jan -- Jun)

210
Figure U-13 Spatial Pattern of Traffic Crashes by Lighting Condition in 2012

211
Figure U-14 Spatial Pattern of Traffic Crashes by Lighting Condition in 2013

212
Figure U-15 Spatial Pattern of Traffic Crashes by Lighting Condition in 2014 (Jan – Jun)

213
Figure U-16 Spatial Pattern of Traffic Crashes by Weather Condition in 2012

214
Figure U-17 Spatial Pattern of Traffic Crashes by Weather Condition in 2013

215
Figure U-18 Spatial Pattern of Traffic Crashes by Weather Condition in 2014 (Jan -- Jun)

216
Figure U-19 Spatial Pattern of Traffic Crashes by Road Surface Condition in 2012
Figure U-20 Spatial Pattern of Traffic Crashes by Road Surface Condition in 2013

217
Figure U-21 Spatial Pattern of Traffic Crashes by Road Surface Condition in 2014 (Jan -- Jun)

218
APPENDIX V. TEMPORAL DISTRIBUTION OF CRASHES
Figure V-1 Temporal Distribution of Traffic Safety on SR 414

219
Figure V-2 Temporal Distribution of Traffic Safety on SR 417
Figure V-3 Temporal Distribution of Traffic Safety on SR 429

220
Figure V-4 Temporal Distribution of Traffic Safety on SR 528

221
Figure V-5 Spatial-Temporal Distribution of Traffic Crashes in 2012
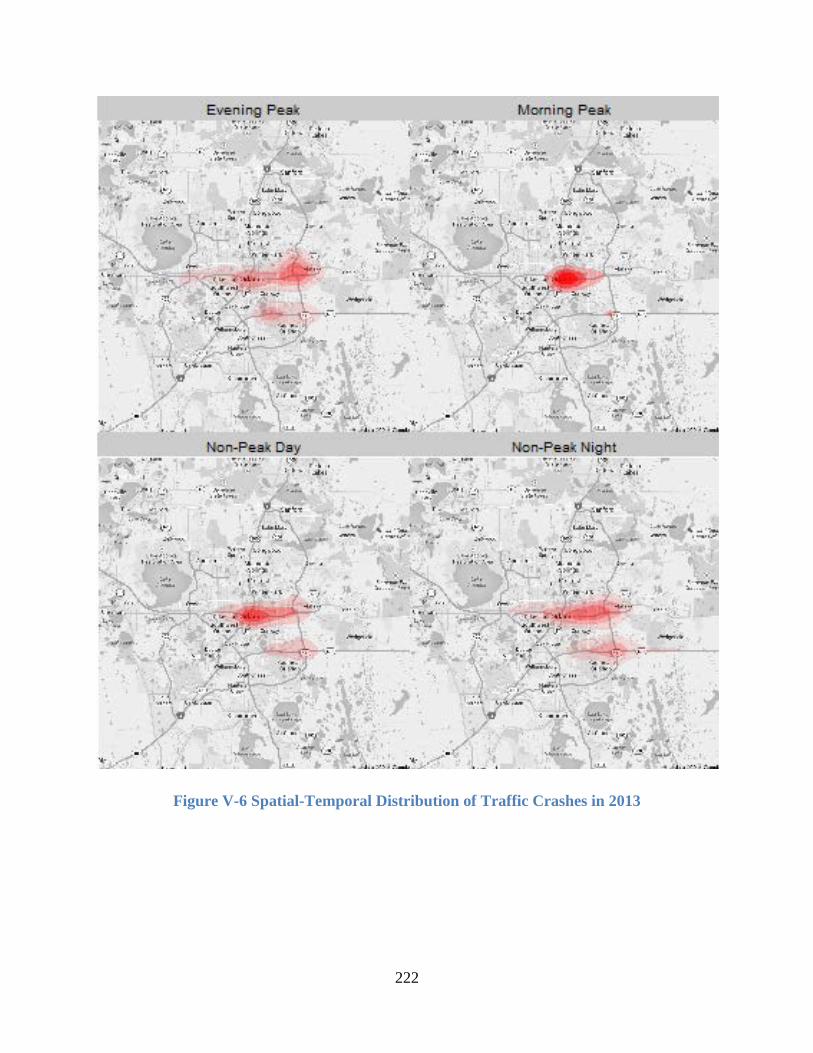
222
Figure V-6 Spatial-Temporal Distribution of Traffic Crashes in 2013

223
Figure V-7 Spatial-Temporal Distribution of Traffic Crashes in 2014 (Jan -- Jun)

224
REFERENCES [1] Central Florida Expressway Authority. Central Florida Expressway Authority. https://www.oocea.com/. Accessed 8/15/2014, 2014.
[2] Central Florida Expressway Map. Central Florida Expressway Authority. https://www.oocea.com/TravelersExpressways/TravelResources/Maps.aspx. Accessed 8/15/2014, 2014.
[3] Spessard Lindsay Holland East-West Expressway. Central Florida Expressway Authority. https://www.oocea.com/TravelersExpressways/Expressways/CurrentExpressways/408EastWestExpressway.aspx. Accessed 8/15/2014, 2014.
[4] John Land Apopka Expressway. Central Florida Expressway Authority. https://www.oocea.com/TravelersExpressways/Expressways/CurrentExpressways/414ApopkaExpressway.aspx. Accessed 8/15/2014, 2014.
[5] Central Florida GreeneWay. Central Florida Expressway Authority. https://www.oocea.com/TravelersExpressways/Expressways/CurrentExpressways/417EasternBeltway.aspx. Accessed 8/15/2014, 2014.
[6] Daniel Webster Western Beltway. Central Florida Expressway Authority. https://www.oocea.com/TravelersExpressways/Expressways/CurrentExpressways/429WesternBeltway.aspx. Accessed 8/15/2014, 2014.
[7] Martin B. Andersen Beachline Expressway. Central Florida Expressway Authority. https://www.oocea.com/TravelersExpressways/Expressways/CurrentExpressways/528BeachLine.aspx. Accessed 8/15/2014, 2014.
[8] Christoforou, Z., S. Cohen, and M. G. Karlaftis. Identifying crash type propensity using real-time traffic data on freeways. Journal of Safety Research, Vol. 42, No. 1, 2011, pp. 43-50.
[9] Ahmed, M., H. Huang, M. Abdel-Aty, and B. Guevara. Exploring a Bayesian hierarchical approach for developing safety performance functions for a mountainous freeway. Accident Analysis & Prevention, Vol. 43, No. 4, 2011, pp. 1581-1589.
[10] Milton, J., and F. Mannering. The relationship among highway geometrics, traffic-related elements and motor-vehicle accident frequencies. Transportation, Vol. 25, No. 4, 1998, pp. 395-413.
[11] Yu, R., and M. Abdel-Aty. Multi-level Bayesian analyses for single- and multi-vehicle freeway crashes. Accident Analysis & Prevention, Vol. 58, No. 0, 2013, pp. 97-105.
[12] Hossain, M., and Y. Muromachi. A Bayesian network based framework for real-time crash prediction on the basic freeway segments of urban expressways. Accident Analysis & Prevention, Vol. 45, No. 0, 2012, pp. 373-381.
[13] Venkataraman, N., G. Ulfarsson, V. Shankar, J. Oh, and M. Park. Model of Relationship Between Interstate Crash Occurrence and Geometrics. Transportation research record: journal of the transportation research board, Vol. 2236, No. -1, 2011, pp. 41-48.

225
[14] Shankar, V., F. Mannering, and W. Barfield. Effect of roadway geometrics and environmental factors on rural freeway accident frequencies. Accident Analysis & Prevention, Vol. 27, No. 3, 1995, pp. 371-389.
[15] Le, T., and R. Porter. Safety Evaluation of Geometric Design Criteria for Spacing of Entrance-Exit Ramp Sequence and Use of Auxiliary Lanes. Transportation research record: journal of the transportation research board, Vol. 2309, No. -1, 2012, pp. 12-20.
[16] Park, B.-J., and D. Lord. Application of finite mixture models for vehicle crash data analysis. Accident Analysis & Prevention, Vol. 41, No. 4, 2009, pp. 683-691.
[17] Grant, M., B. Bowen, M. Day, R. Winick, J. Bauer, and A. Chavis. Congestion Management Process: A Guidebook.In, Washington, DC: United States Department of Transportation-Federal Highway Administration, 2011.
[18] Systematics, C. Traffic congestion and reliability: Trends and advanced strategies for congestion mitigation. Federal Highway Administration, 2005.
[19] Griffin, L. A. Enhancing Expressway Operations Using Travel Time Performance Data.In Facilities Management and Maintenance Workshop, Nashville, TN, 2011.
[20] Hall, F. L. Traffic stream characteristics. Traffic Flow Theory. US Federal Highway Administration, 1996.
[21] Gerlough, D. L., and M. J. Huber. Traffic flow theory: a monograph. Transportation Research Board, National Research Council Washington, DC, 1975.
[22] Hamad, K., and S. Kikuchi. Developing a measure of traffic congestion: fuzzy inference approach. Transportation Research Record: Journal of the Transportation Research Board, Vol. 1802, No. 1, 2002, pp. 77-85.
[23] Schrank, D., B. Eisele, and T. Lomax. TTI’s 2012 Urban Mobility Report.In Texas A&M Transportation Institute. The Texas A&M University System, 2012.
[24] Mirshahi, M., J. T. Obenberger, C. A. Fuhs, C. E. Howard, R. A. Krammes, B. T. Kuhn, R. M. Mayhew, M. A. Moore, K. Sahebjam, and C. J. Stone. Active traffic management: the next step in congestion management.In, 2007.
[25] Nygårdhsand, S., and G. Helmers. VMS-Variable Message Signs. A Literature Review. Swedish National Road and Transport Research Institue VTI rapport 570A, 2007.
[26] Browne, R., and A. Byrne. Highway 402 Queue Warning System (Wireless Long Haul Application).In 2008 Annual Conference of the Transportation Association of Canada, 2008.
[27] California Manual on Uniform Traffic Control Devices, 2006.
[28] Toll Facilities Reference Manual. Central Florida Expressway Authority. https://www.oocea.com/Portals/0/docs/Toll%20Facilities/2012%20Toll%20Facilities%20Reference%20Manual.pdf. Accessed 5/6/2013, 2013.

226
[29] Jacobson, L., J. Stribiak, L. Nelson, and D. Sallman. Ramp management and control handbook.In, 2006.
[30] Interchange Report.In, Florida Department of Transportation, 2012.