eglinton west lrt extension technical & planning update · eglinton west lrt extension...
TRANSCRIPT

1
ATTACHMENT 2 EGLINTON WEST LRT EXTENSION TECHNICAL & PLANNING UPDATE 1. Introduction In July 2016, City Council approved a SmartTrack project scope that includes an Eglinton West LRT extension with 8 to 12 stops between Mount Dennis and Renforth Gateway, and potential grade separations at Martin Grove Road, Kipling Avenue and Eglinton Flats (Jane Street and Scarlett Road), Islington Avenue and Royal York Road and a review of their associated costs.1
City Council's direction was based on the results of the Eglinton West LRT Initial Business Case (IBC), which examined a range of rapid transit options along the Eglinton West corridor from a strategic, economic, financial and deliverability case perspective, including:
• At-grade LRT with targeted grade separations at Eglinton Flats (Jane and Scarlett), Martin Grove, and Kipling;
• At-grade LRT with grade separations at all arterials; • Fully-grade separated LRT with six stops total (three in Toronto); and • At-grade Bus Rapid Transit (BRT) option.
In November 2016, City Council adopted EX19.1 Transit Network Update and Financial Strategy, which included an update on analysis of stop locations and a framework for the grade separations analysis. City Council also approved the SmartTrack stage gate process with timelines and next steps for completing the planning and technical analysis for the Eglinton West LRT. In particular, City Council directed City staff to work in partnership with TTC, Metrolinx, and the Province of Ontario to complete the planning and technical analysis for the project to finalize the number of stops and grade separations for the project. Extensive work is underway to refine the LRT concept from Mount Dennis to Renforth Station (at Commerce Boulevard, formerly referred to as "Renforth Gateway"). This work includes:
• a completed assessment of potential grade separations to mitigate the perceived impacts of an at-grade LRT to traffic;
• an ongoing study of the alignment and road network west of Martin Grove Road to address congestion at the Martin Grove Road/Eglinton Avenue West intersection; and
• ongoing traffic modelling and analysis of the corridor. Work is also underway to determine the connection from Renforth Station (Commerce Boulevard) to Toronto Pearson International Airport. Work on this segment is being 1 EX16.1 Developing Toronto's Transit Network Plan to 2031 (http://app.toronto.ca/tmmis/viewAgendaItemHistory.do?item=2016.EX16.1).
EX29.1

2
coordinated by Metrolinx and includes the City of Mississauga and the Greater Toronto Airports Authority. This attachment includes a summary of the work completed on the grade separations and stop locations for the Toronto Segment from Mount Dennis to Renforth Station (Commerce Boulevard), and an update on other work that is underway, including the Toronto Pearson Airport connection. The final LRT concept that will be advanced to amend the 2010 EA/TPAP will be reported in Q2 2018. 2. Toronto Segment (Mount Dennis to Renforth Station) 2.1 Stop Locations Attachment 52 of EX19.1 Transit Network Plan Update and Financial Strategy included an update on work to refine the stop locations from Mount Dennis to Commerce Station (at Renforth Station, the eastern terminus of the Mississauga Transitway). Current staff analysis is consistent with the November 2016 report with stops at Renforth Road, Rangoon Drive and the East Mall being removed from consideration. This report recommends that City Council approve an LRT concept for the Toronto Segment with 10 stops, as illustrated in Figure 1 below. The findings from work underway, including the Martin Grove/Eglinton West transportation study, may impact the stop locations. Any impacts on stop locations will be reported in Q2 2018. Figure 1: Recommended Stop Locations for Toronto Segment
2.2 Grade Separations Analysis
As directed by City Council, an assessment of potential grade separations at up to six locations, including a review of their associated costs and benefits has been completed. This includes grade separations at the following locations:
● Eglinton Flats (two grade separations were examined at this location; both Scarlett Road and Jane Street)
● Martin Grove Road ● Kipling Avenue
2 http://www.toronto.ca/legdocs/mmis/2016/ex/bgrd/backgroundfile-97898.pdf

3
● Islington Avenue ● Royal York Road
Grade separations at Eglinton Flats (Jane and Scarlett), Martin Grove Road and Kipling Avenue were included in the IBC reported to Council in July 2016. In July 2016, Council directed staff to consider two additional grade separations, at Islington Avenue and Royal York Road. Targeted grade separations at these locations were to be considered to mitigate potential traffic impacts and improve LRT travel times. Each grade separation has been evaluated through the framework reported to City Council in November 20163. Part 1: Feasibility Assessment The first part of the analysis included an initial review of the technical feasibility of implementing a grade separation at each location, including constructability and natural environment considerations. Six possible grade separation configurations were considered for each intersection. These options are illustrated in Figure 2. Each possible configuration was examined for feasibility at each location, in order to determine the preferred configuration to advance to further analysis. Feasibility analysis focussed on:
● impacts on floodplains; ● slope of track, to meet transit operational requirements; ● conflicts with major utilities; ● impacts on existing stable neighbourhoods or land uses such as schools and parks;
and ● ability to service adjacent stops.
As a result of this analysis, the preferred configuration for each potential grade separation was selected. The results of this analysis are summarized in Table 1. Visualizations of each potential grade separation are shown in Appendix 1. The full report on the Feasibility Assessment is available at the following link: http://www.eglintonwestlrt.ca/wp-content/uploads/2017/10/Stage-One-Report.pdf. The preferred configuration identified in this stage was carried forward for a full evaluation.
3 EX19.1 Transit Network Update and Financial Strategy (Attachment 5 – Eglinton West LRT Technical and Planning Update)

4
Table 1: Summary of Grade Separations Selected for Further Review
Intersection Preferred Configuration
Rationale
Jane Street above-grade / north of right-of-way
● Below-grade not feasible due to floodplain ● North of ROW selected due to fewer property
impacts
Scarlett Avenue above-grade / north of right-of-way
● Below-grade not feasible due to floodplain ● North of ROW selected due to fewer property
impacts and costs of widening existing bridge
Royal York Road
below-grade / centre of right-of-way
● Selected based on property impacts and opportunities for stop access
Islington Avenue
above-grade / centre of right-of-way
● Below-grade not feasible due to grade of corridor ● Centre of ROW selected due to property impacts
Kipling Avenue below-grade / centre of right-of-way
● Above-grade not preferred due to property impacts ● Centre of ROW selected due to utility conflicts (gas
main)
Martin Grove Road
below-grade / centre of right-of-way
● Above-grade not feasible due to utility conflicts (hydro corridor)
● Centre of ROW selected due to utility conflicts (water reservoir and gas main)
Figure 2: Possible Grade Separation Configurations

5
Part 2: Evaluation of Technically Feasible Options Each grade separation was evaluated through the City's Rapid Transit Evaluation Framework (RTEF). The grade separation was evaluated individually in order to isolate the cost and benefits and compared to the corresponding at-grade LRT alignment and stop option. Benefits included both economic benefits (based on estimated travel time savings for all road users) and non-monetized strategic benefits. RTEF criteria that addresses how transit serves people (Experience, Choice and Social Equity), how transit strengthens places (Healthy Neighbourhoods, Shaping the City and Public Health & Environment) and how transit supports prosperity (Supports Growth) were included the strategic evaluation. RTEF criteria regarding Affordability were analyzed through a comparison of estimated costs and benefits. The evaluation indicates relatively low strategic and economic benefits and high costs associated with each grade separation, as summarized in Figure 3 and Figure 4. Strategic Evaluation
The following summarizes the strategic evaluation for the six potential grade separations, compared to the corresponding at-grade LRT alignment and stop. The detailed Strategic Evaluation is available at http://www.eglintonwestlrt.ca/wp-content/uploads/2017/10/Stage-3-Evaluation-Matrix.pdf. Serving People – Choice (develop integrated network that connects different modes) In all cases, the potential grade separation and corresponding at-grade LRT alignment performed equally well, as a grade separation would not significantly change the choices that people would have for moving around the city. Serving People – Experience (make travel more reliable, safe and enjoyable) In all cases, the at-grade LRT alignment are preferred over the potential grade separation. There would be some improvement in safety for some transit users who would not need to cross the street to access the LRT stop. However, grade separations introduce vertical transfers between the street level and the stop itself. This increases the complexity of the stops and forms a barrier for transit users. If an elevator is out of service, the stop may not be accessible at all for some users. Sightlines for drivers were also considered under the Experience category. In the cases where the LRT would be below-grade (Royal York, Kipling and Martin Grove) there would be an improvement to sightlines for drivers compared to the corresponding at-grade LRT alignment. In the cases where the LRT would be above-grade (Jane, Scarlett and Islington) sightlines for drivers would be reduced. Serving People – Social Equity (allows everyone good access to work, school and other activities) In all cases except Jane, the vertical transfer between the street level and the grade-separated stop would increase the risk that transit riders with mobility challenges would not be able to access the LRT (i.e. in the case that an elevator is out of service). The at-grade LRT alignment is preferred in all of these cases.

6
The Jane Street grade separation design requires redundant elevators, which would significantly reduce the risk of the LRT being inaccessible. As a result, both the grade-separated and at-grade alignments performed equally well from a Social Equity perspective. Strengthening Places – Shaping the City (impact on residential development) In two cases, Scarlett and Islington, the potential grade separations would have impacts on adjacent residential property that would reduce development potential. As such, the at-grade LRT alignment is preferred. In all other cases, both the grade-separated and at-grade alignments performed equally well from a Shaping the City perspective. Strengthening Places – Healthy Neighbourhoods (strengthen and enhance existing neighbourhoods) In all cases, the at-grade LRT alignment is preferred over the potential grade separation. At all six locations, the potential grade separation would likely require the acquisition of private property, and would significantly increase the construction impacts on the surrounding community. Grade separated stops would also increase the opportunity for criminal activity by reducing natural surveillance of the platform. Further, grade separations at Scarlett, Islington and Kipling would have a negative visual impacts on the surrounding community, while grade separations at Jane, Scarlett and Islington would have a negative impact on the public realm and place-making opportunities. Strengthening Places – Public Health & Environment (supports and enhances natural areas) In all cases except Martin Grove, the at-grade LRT alignment is preferred over the potential grade separation. Grade separations at Jane and Scarlett would have increased impacts to the Humber River Natural Heritage System compared to the corresponding at-grade LRT alignment. Grade separations at Royal York, Islington and Kipling would likely require more tree removal than the corresponding at-grade alignment due to larger construction footprints. Supporting Prosperity – Supports Growth (impact on economic development) In all cases, the potential grade separation and corresponding at-grade LRT alignment performed equally well, as a grade separation would not significantly change the economic development opportunities or impact employment lands.

7
Figure 3: Summary of Grade Separations Findings (Jane, Scarlett and Royal York)
8
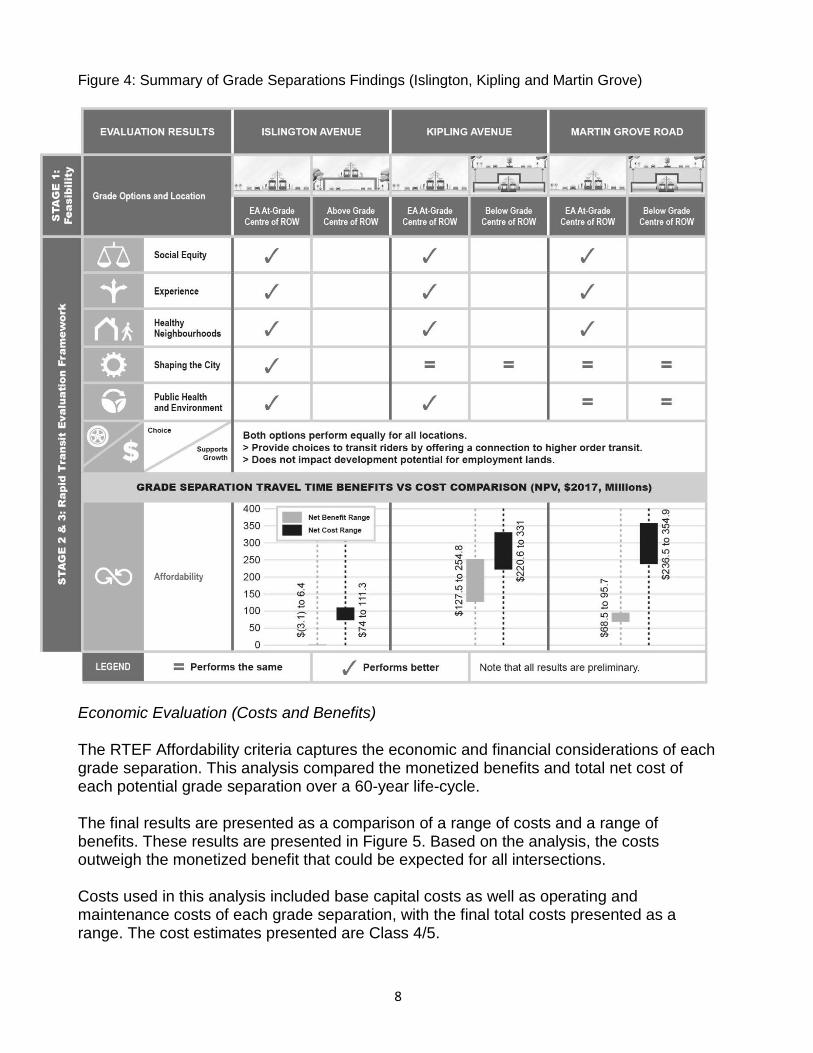
Figure 4: Summary of Grade Separations Findings (Islington, Kipling and Martin Grove)
Economic Evaluation (Costs and Benefits) The RTEF Affordability criteria captures the economic and financial considerations of each grade separation. This analysis compared the monetized benefits and total net cost of each potential grade separation over a 60-year life-cycle. The final results are presented as a comparison of a range of costs and a range of benefits. These results are presented in Figure 5. Based on the analysis, the costs outweigh the monetized benefit that could be expected for all intersections. Costs used in this analysis included base capital costs as well as operating and maintenance costs of each grade separation, with the final total costs presented as a range. The cost estimates presented are Class 4/5.

9
Benefits used in the analysis were based on travel time savings for each grade separation. Advanced traffic modelling software was used to estimate future traffic movements and the impacts of each grade separation to determine the potential travel time savings for each grade separation. This result was then converted to a monetized benefit to enable comparison to the total costs. The benefits were are also presented as a range. A detailed memorandum on the methodology for this work is included as Appendix 2. Figure 5: Range of Net Costs versus the range of Net Benefits (NPV $2017, Millions)
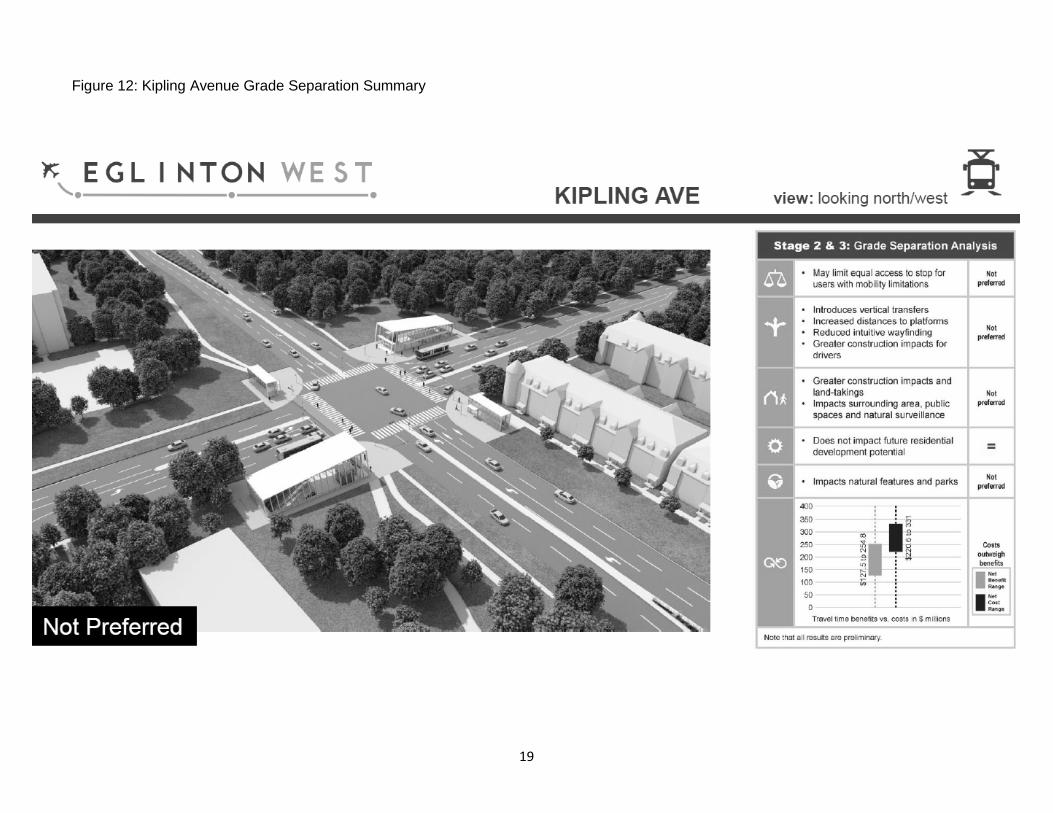
In all cases the estimated net benefit of the grade separation was low compared to the estimated net cost. In all cases except Kipling, the maximum estimated benefit was well below the minimum estimated cost. In the case of Kipling, benefits would be greater than costs only if the low end of the estimated cost range and the high end of the benefit range was achieved.
In this case, it is important to note that relatively high benefits are realized because of the high left-turn volumes at Eglinton and Kipling, due to the transportation network configuration west of Martin Grove. A study of the Martin Grove/Eglinton Ave intersection is currently underway to assess options for improvements to the transportation network in this area. The study aims to address existing traffic issues and could result in substantially different traffic volumes from Kipling. The introduction of such an improvement would reduce the potential benefits of a grade separation at Kipling.
Benefits for LRT Users While grade separations would mean that the LRT would not need to proceed through the major intersection, the LRT travel time benefit is small. First, LRT vehicles are required to stop at all of the identified locations for passenger pickup and drop-off, which minimizes
10
the additional delay due to a red signal. Second, the signal timings along the corridor are coordinated to prioritize LRT movements. This coordination of signals results in very short delays caused by signals in the at-grade scenario, and minimal benefit to removing the signal altogether, through grade separation.
Benefits for General Traffic Introducing the LRT would eliminate permissive left turns along Eglinton Avenue and require all traffic to turn left only on a dedicated signal. An example of this operation occurs on the Queensway between Roncesvalles and Humber Loop, where general traffic must wait for a left turn signal before crossing the transit corridor. Grade separating allows for permissive left turns, which allows traffic to make left turns when there are gaps in the opposing traffic. Traffic modelling results indicate that intersections with significant turning volumes benefit most from a grade separation (e.g. Kipling and Martin Grove). However, even at these intersections, the estimated lifecycle benefits do not outweigh the estimated lifecycle costs of implementing a grade separation. Recommendation In all cases the estimated costs of a grade separation is greater than the estimated benefits of the asset over the 60-year lifecycle. It is anticipated that there will be added costs for property acquisition required for a grade separation, which are not accounted for in the cost estimates that are presented in this report. As a result of this analysis, this report recommends that targeted grade separations at Eglinton Flats, Kipling, Martin Grove, Islington and Royal York be removed from further consideration. Public Consultation A public consultation program has been undertaken, including stakeholder and public meetings, a dedicated website, online survey and social media campaign. The stakeholders and public were consulted on the preliminary findings that form the recommendation for this report to City Council. A Stakeholder Advisory Group (SAG) has been established to provide organizations representing a broad range of interests with the opportunity to learn about and provide input into the study. A total of 71 organizations are represented. The first SAG meeting was held on October 23, 2017, where questions focused on the development of travel time benefits and how travel time was modelled. Some SAG members identified their desire to have a fully grade separated line (above- or below-grade) and expressed concern about traffic infiltration, while others were supportive of an at-grade option and expressed a desire for good bicycle infrastructure at the LRT stops. Public meetings were held in Etobicoke/York on November 13 and 15, 2017, with approximately 400 people in attendance in total. The most common feedback received during the public meetings was a strong desire for a completely below grade transit line (subway or LRT). Other themes included:

11
• Do not remove the stop at Rangoon, particularly due to the neighbourhoods west of Highway 427 and south of Eglinton;
• There is not enough room to expand the right-of-way to include all existing traffic lanes and the LRT;
• Do not implement Michigan Lefts; • The traffic issues along the Eglinton corridor are already severe, and traffic issues
will worsen with the introduction of the LRT; • Consider pedestrian safety along the Eglinton corridor; • The Eglinton West corridor is similar to the St. Clair corridor; • Realign the LRT via Weston and Dixon; • Confirm the connection to the airport; • Build the at-grade LRT to provide more transit options in Etobicoke; • The at-grade LRT option is the most aesthetically pleasing; • The LRT should be the fastest mode of transportation to encourage and increase
ridership; • Study the addition of protected cycle lanes along Eglinton Avenue West; • Implement traffic calming measures and a traffic redirection strategy at intersections
such as Martin Grove Road and Eglinton Avenue West along with the implementation of the LRT to ensure traffic issues are solved;
• Keep the existing bus service along Eglinton when the LRT is implemented; and • The introduction of the LRT will require more parking facilities.
The online survey was launched on Friday, November 10, 2017. As of November 16, a total of 152 responses had been received. 2.3 Further Work to Mitigate Potential Traffic Impacts Further work is being completed to address the surrounding communities' concerns and mitigate potential traffic impacts of an at-grade LRT along this corridor. This work includes analysis of signal timing optimization and innovative intersection operations. Martin Grove/Eglinton West Avenue Functional Planning Study A study is being completed to examine the underlying issues causing traffic congestion at the western end of the Eglinton West corridor and propose more comprehensive solutions. The study is assessing opportunities to improve the overall transportation network to address existing traffic congestion and better enable the implementation of the LRT through this segment. Inherent in this study is the alignment of the LRT between Martin Grove Road and Commerce Boulevard. Recommendations from this work, including the alignment of the LRT west of Martin Grove Road, will become part of the project concept of the Eglinton West LRT. The Eglinton/Martin Grove intersection has long been identified as experiencing significant traffic congestion. This is largely due to the design of the interchange between Highways 401 and 427 and Highway 27. This interchange ineffectively transfers very large volumes of traffic onto Eglinton Avenue, while the through-movement along Eglinton is forced to turn across this volume of traffic. As a result, traffic is subject to merging, weaving and turning as illustrated in Figure 6.

12
The City is working with MTO to identify solutions to these underlying issues, focusing on adding network connections and the separation of the LRT and general traffic through the interchange. Once potential solutions have been identified, stakeholders and the public will be consulted. A final report on these solutions, including LRT alignment west of Martin Grove Road, will be included in the final report on the Eglinton West LRT concept in Q2 2018. That report will include a comparison of benefits and costs similar to the evaluation completed on the grade separations. 3. Airport Connection (Renforth Station to Pearson Airport) 3.1 Metrolinx Airport Segment Study Metrolinx, in partnership with the City of Toronto, City of Mississauga and Greater Toronto Airport Authority (GTAA), is undertaking a feasibility study for the Airport Segment of the extension of the Eglinton West LRT to Pearson International Airport. The Airport Segment is the western-most segment of the proposed Eglinton West LRT, from Renforth Station at Commerce Blvd. to the Regional Transit Centre at the Airport. The first portion of the corridor was identified in the 2010 Environmental Assessment. This section includes the stop on Commerce Boulevard, a new bridge over the 401, a stop at Convair Drive, and a stop at Silver Dart as illustrated in Figure 7.
Figure 6: Key Issues Affecting Eglinton Avenue/Martin Grove Intersection Area

13
Figure 7: Airport Options Study Area
The 2010 Environmental Assessment did not recommend an alignment for the section into the Airport. The EA looked at possible alignments and how service could be brought to the Terminals but left the details to future work. The feasibility study includes identifying the alignment for the section into the Airport. Identifying a viable alignment is made challenging by the complex web of highway infrastructure, airport height restrictions, and the existing and future land needs of the airport. Alignments under review include both sides of the 427. The study area also straddles the Mississauga/Toronto boundary as it approaches the airport. The recommended alignment will need to balance the directness of the route and minimizing highway crossings, with the potential to serve the area surrounding the airport. Metrolinx is undertaking the study using a Business Case approach that assesses the strategic, economic, financial, deliverability and operations cases for a range of alternative alignments and potential stop locations. These options were developed based on findings from previous studies, and in consultation with stakeholders and a consulting team. The requirement and merits of segments below or above grade are also being examined. There is an opportunity for an LRT alignment along Silver Dart on the west side of Highway 427. For comparison, alignments are also being developed on east side of Highway 427 along Carlingview Drive in the City of Toronto, and the merits of new stops are being assessed. Similarly, alternative alignments are being reviewed for the approach

14
into the Regional Transit Centre, with Airport Road and Campus Road/Viscount Road under consideration.
The analysis will include ridership forecasts for any additional stops. Their value would be compared against the costs of implementing a stop. A refined list of alignment and stop location options will then be evaluated using a range of criteria, including measures from the City's RTEF. The study results are anticipated for early 2018, and will be fed into a broader business case update for the Eglinton West LRT from Mount Dennis to the Airport. 3.2 GTAA Regional Transit Centre In February 2017, the GTAA released their vision for a Regional Transit Centre (RTC) at Toronto Pearson International Airport, to be located in the vicinity of the Viscount LINK Station. The RTC is now envisioned as the terminus for the Eglinton West LRT and potential extension of the Finch West LRT, providing an opportunity for transit riders to link with the airport and with other transit services including the Union Pearson Express and bus services offered by the Toronto Transit Commission, MiWay, Brampton Transit and GO Transit. The RTC is planned to be part of a multi-phased development by GTAA on the site across Airport Road from current Terminals 1 and 3. Included in Phase 1 is the initial phase of a new Terminal, which would include check-in facilities for airport passengers arriving via the RTC. A Request for Proposals for Consulting Services to undertake the Phase 1 RTC design is currently underway, and the work is expected to be completed in late 2018. 4. Next Steps
City and Metrolinx staff will continue to work in partnership to complete the planning and technical studies for the Toronto and Airport Segments.
A report to Council on the recommended project concept and updated business case is anticipated in Q2 2018. This report will include any alignment changes and impacts to stop locations to the Toronto Segment resulting from the recommended solution for the Martin Grove intersection. The results of the airport segment study will also be reported. If required, the TPAP to amend the existing EA could commence in Q4 2018.

15
Appendix 1 – Grade Separations Summary Please note: All cost and benefits are shown in Net Present Value, 2017 dollars, and are for a grade separation over and above the cost/benefit of an at-grade stop. Cost estimates are Class 4/5.
Figure 8: Jane Street Grade Separation Summary

16
Figure 9: Scarlett Road Grade Separation Summary

17
Figure 10: Royal York Road Grade Separation Summary

18
Figure 11: Islington Avenue Grade Separation Summary
19
Figure 12: Kipling Avenue Grade Separation Summary

20
Figure 13: Martin Grove Grade Separation Summary
21
Appendix 2 Benefits and Costs of Potential Grade Separation at Selected Locations

22
1. Introduction In response to an Initial Business Case (IBC) considering Enhanced Eglinton West Rapid Transit, presented to City Council in July 2016 (EX16.1), Council directed City staff, in partnership with the TTC and Metrolinx, to study optimizing the Eglinton West LRT project concept by assessing potential grade separations at up to six major intersections. These six intersections were:
• Jane Street, • Scarlett Road, • Royal York Road, • Islington Avenue, • Kipling Avenue, and • Martin Grove Road.
The potential grade separations were intended to address traffic network delay introduced by implementing the LRT. The overall benefit or disbenefit of the grade separations was determined by comparing the monetized benefits to the total net costs of the potential grade separations. The cost of each grade separation was estimated in accordance with a Class D cost estimate or a Class 4/5 according to the AAECI (See Schedule 1). Advanced traffic modelling software was used to estimate future traffic movements and the impacts of each grade separation, in isolation, to determine the potential benefits. This result was then converted to a monetized benefit to enable comparison to the costs. Table 1 summarizes the estimated cost ranges for each potential grade separation. Table 1: Range of total net Costs used in the Benefits/Costs calculations
Grade Separation Estimated Cost Range, for comparison of grade separation options (NPV4 2017$, Millions)
Jane $ 70.6 - $ 106.0 Scarlett $ 93.0 - $ 139.6 Royal York $ 187.1 - $ 280.8 Islington $ 74.1 - $ 111.3 Kipling $ 220.6 - $ 331.0 Martin Grove $ 236.5 - $ 354.9
Table 2 summarizes the estimated travel time benefit ranges for each potential grade separation.
4 Net Present Value (NPV)

23
Table 2: Range of Monetized Benefits used in Benefits/Cost calculations
Grade Separation Range of Monetized Benefits (NPV,$2017, Millions)
Jane $5.4 - 25.9 Scarlett $2.2 - 22.8 Royal York $(8.3) - 15.7 Islington $(3.1) - 6.4 Kipling $127.5 - 254.8 Martin Grove $68.5 - 95.7
Figure 1 compares the resulting estimated cost range to the estimated benefit range for each potential grade separation.
This report explains in detail, the approach to and results of, the estimation of both benefits and costs of each potential grade separation.
Figure 1: Range of total net Costs versus the range of net travel time Benefits

24
2. Costs Costs used in this analysis were based on inputs that included base capital costs as well as the operating and maintenance costs of each grade separation, with the final total costs presented as a range. Details on how the range of costs were developed are outlined below. 2.1 Base Capital Construction Costs Third party cost estimators (Marshall & Murray) produced capital cost estimates for the construction of the six potential grade separations. Cost estimates were produced for technically feasible alternatives, based on the drawings and specifications produced by Third party designers (Urban Strategies and HDR Inc.) as per the Stage 1 report on feasibility of potential grade separations. Cost estimates include demolition, site preparation, elevated/underground rail corridor construction, stop construction, rail construction, and mechanical/electrical site installation. Cost estimates are only for essential elements of the stop, required for operational service of the LRT. Enhancements or additional elements beyond those noted in the designs, such as: washrooms, concourses, additional ventilation or flood protection are not included, and therefore would result in higher costs. Assumptions made:
● Capital costs for each grade separation are in 2017$ NPV (there is no escalation allowance provision made in any capital costs)
● All cost estimates are identified as Class D (Class 4/5) (see Schedule 1) ● There is a 30% total contingency for design, pricing, phasing and construction ● There is no risk contingency allowance. ● Estimates do not include HST, nor do they account for tax breaks or deductions ● Capital costs exclude property acquisitions, property tax, legal fees, survey costs,
risk assessment, RFQ/RFP costs, premium time, investigations and studies, client management and overhead, utility connection charges, building permits, relocation of existing equipment, loose furniture and equipment, computer equipment, security equipment and installation, smart board and A/V Equipment
The base capital construction costs of each grade separation are shown in Table 3. Table 3: Base capital construction cost estimates (source: Marshall & Murray) Grade Separation Estimated Construction Cost
(Class D/5, 2017$, Millions) Jane Street $85 Scarlett Avenue $113 Royal York Road $232 Islington Avenue $90 Kipling Avenue $274 Martin Grove Road $294

25
2.2 Net Base Costs In order to compare to the net benefits, the net costs for each grade separation were calculated. The net costs represent the incremental cost over and above the costs that would be incurred to implement the at-grade LRT. The net costs include capital construction costs, as well as annual operations and maintenance (O&M) costs. At-grade Costs The comparable at-grade LRT capital construction costs were developed by WSP/MMM as part of the IBC for the Eglinton Crosstown Light Rail Transit – Phase 2 work. It was determined that the at-grade LRT cost is $11.9 million. To determine the differential between the at-grade and grade separated costs, an 800 metre track length was assumed based on the average length of track needed for the grade separations, as listed in the estimates from M&M. The following summarizes the basis for the at-grade costs used in the cost analysis:
● Base case values are in 2017$ Net Present Value ● There is no escalation allowance provision made in any capital costs; ● All cost estimates are classified as Class D/Class 4/5 (see Schedule 1); ● Costs were validated by the Metrolinx Capital Projects Group; ● Quantities and costs are based on an assumed typical layout and representative
unit costs/allowances; and ● A 28% contingency for design, pricing and construction is included in the cost.
Operations and Maintenance Costs The Capital Projects Group at Metrolinx in conjunction with a third party consultant (CH2M Hill) produced O&M costs for grade separated stops. Without any data to differentiate between the O&M of various stops, all the stops are assumed to have the same O&M for each of the grade separations. The O&M cost for each grade separation was estimated at $0.65 million. The following summarizes the basis for the operations and maintenance costs used in the cost analysis:
• Costs were produced in 2017$ Net Present Value; • All cost estimates are classified as Class D/Class 4/5 (see Schedule 1); • O&M costs are based on square meters and elevator provision from Marshall &
Murray Inc. estimates (discussed above); • O&M costs are broken into two categories – stop utilities (non-propulsion) and
stop maintenance/repair and cleaning

26
• Cost data is originally derived from TTC 2010 cost data with an application of AFP reduction factor; assuming a 2.5% annual escalation rate from $2010 to 2017$ NPV; and
• Annual O&M costs do not include life-cycle asset replacement costs.
Net costs for each grade separation, all in NPV 2017$ are shown in Table 4. Table 4: Net Costs for each grade separation Grade Separation Estimated Net Costs
(Class 4/5, $2017, Millions) Jane $ 70.6 Scarlett $ 93.0 Royal York $ 187.1 Islington $ 74.1 Kipling $ 220.6 Martin Grove $ 236.5
2.3 Range of Total Costs Class 4/5 capital construction cost estimates produced for each potential grade separation were reviewed by the City, TTC and a 3rd party consultant (AECOM Canada). This independent peer review validation exercise was inconclusive due to limited documentation available. While as a whole, the validation exercise was inconclusive, the review identified that the unit costs or allowances for several items were considered low or very low, while not identifying any corresponding unit costs or allowances as high. The internal review of the costs came to a similar conclusion. Any Class 4/5 cost estimate is considered accurate to between -50% and +100% (see Schedule 1). Given that the review of cost estimates only identified upward pressures on the costs, the level of design detail, and the fact that the base capital construction estimates provided do not include any risk contingency, a conservative range of potential costs has been assigned. The base net costs represents the bottom of the range and an additional 50% was applied above the base net costs to determine the top of the range. The resulting estimated cost ranges are shown in Table 5. This range of possible costs should only be used for comparing options, and is not for budgeting purposes. Table 5 Range of total net costs for comparison of grade separation options Grade Separation Estimated Cost Range, for comparison of options
(NPV, 2017$, Millions) Jane $ 70.6 - $ 106.0 Scarlett $ 93.0 - $ 139.6 Royal York $ 187.1 - $ 280.8

27
Grade Separation Estimated Cost Range, for comparison of options (NPV, 2017$, Millions)
Islington $ 74.1 - $ 111.3 Kipling $ 220.6 - $ 331.0 Martin Grove $ 236.5 - $ 354.9
3. Benefits Benefits used in the analysis were based on travel time savings for each grade separation and were monetized to enable comparison to the total costs presented above, with monetized benefits presented as a range. Details on how the range of monetized benefits were developed is outlined below. 3.1 Modelling Approach The AIMSUN microsimulation software package was used by 3rd party expert traffic modellers (WSP) to estimate traffic movements. Table 6 summarizes the model runs created. Table 6: Model Run Scenarios
Scenario Year Description
1 2011 Baseline conditions
2 2031 Do nothing - without implementation of the LRT
3 2031 With implementation of the fully at-grade LRT, with standard left turns at major intersections
4-9 2031 With implementation of the at-grade LRT with a grade separation at a single major intersection and standard left turns at all major intersections
Comparison of scenarios 1 and 2 estimate the impacts (travel delay for motorists) on the traffic network due to background growth in traffic volumes. Comparison of scenarios 2 and 3 estimate the further impacts (travel delay for motorists) due to the introduction of an at-grade LRT. Comparison of each scenario, 4 through 9, to scenario 3, estimate the net benefit (travel time savings, which includes reduction in travel delay for motorists and reduction in travel time for LRT riders) of each grade separation in isolation. This allows the estimated net benefit to be compared to estimated costs for that grade separation.
Each grade separation was studied in isolation to allow for the analysis of each separation on its own merits. This comparison is one consideration that City staff will
28
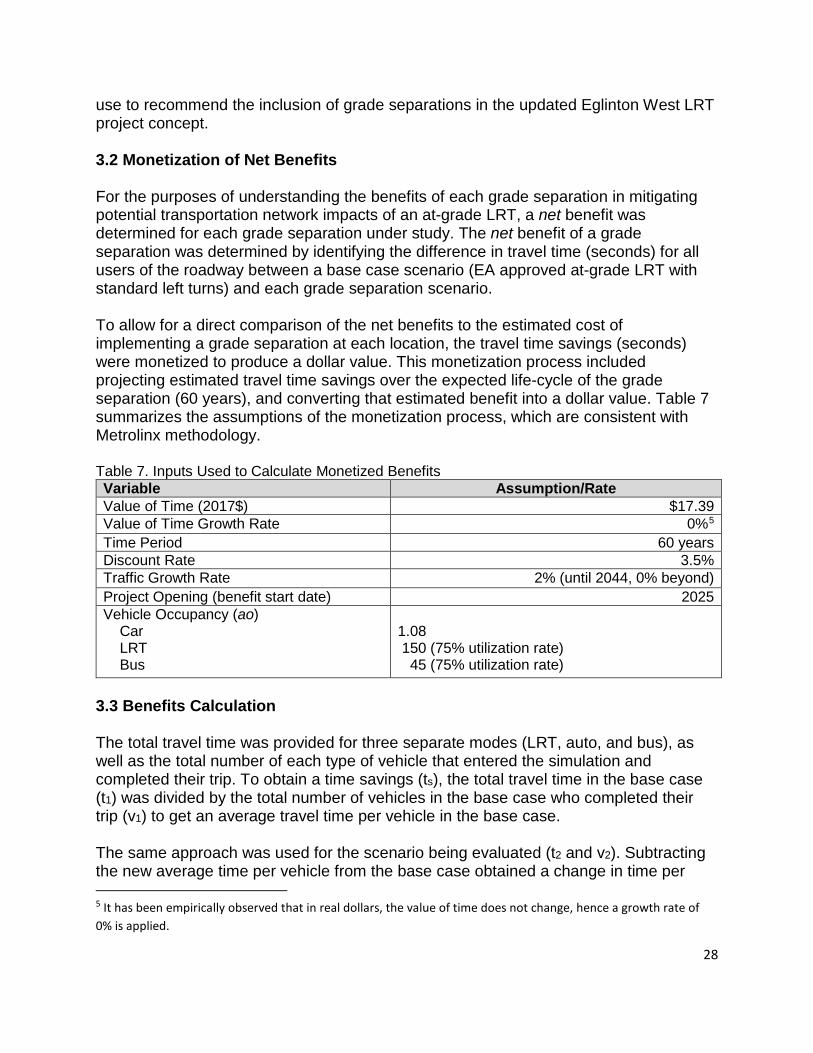
use to recommend the inclusion of grade separations in the updated Eglinton West LRT project concept. 3.2 Monetization of Net Benefits For the purposes of understanding the benefits of each grade separation in mitigating potential transportation network impacts of an at-grade LRT, a net benefit was determined for each grade separation under study. The net benefit of a grade separation was determined by identifying the difference in travel time (seconds) for all users of the roadway between a base case scenario (EA approved at-grade LRT with standard left turns) and each grade separation scenario. To allow for a direct comparison of the net benefits to the estimated cost of implementing a grade separation at each location, the travel time savings (seconds) were monetized to produce a dollar value. This monetization process included projecting estimated travel time savings over the expected life-cycle of the grade separation (60 years), and converting that estimated benefit into a dollar value. Table 7 summarizes the assumptions of the monetization process, which are consistent with Metrolinx methodology. Table 7. Inputs Used to Calculate Monetized Benefits Variable Assumption/Rate Value of Time (2017$) $17.39 Value of Time Growth Rate 0%5 Time Period 60 years Discount Rate 3.5% Traffic Growth Rate 2% (until 2044, 0% beyond) Project Opening (benefit start date) 2025 Vehicle Occupancy (ao) Car LRT Bus
1.08 150 (75% utilization rate) 45 (75% utilization rate)
3.3 Benefits Calculation The total travel time was provided for three separate modes (LRT, auto, and bus), as well as the total number of each type of vehicle that entered the simulation and completed their trip. To obtain a time savings (ts), the total travel time in the base case (t1) was divided by the total number of vehicles in the base case who completed their trip (v1) to get an average travel time per vehicle in the base case. The same approach was used for the scenario being evaluated (t2 and v2). Subtracting the new average time per vehicle from the base case obtained a change in time per 5 It has been empirically observed that in real dollars, the value of time does not change, hence a growth rate of 0% is applied.

29
vehicle, which was multiplied against the assumed average occupancy of the vehicle (ao) and the number of vehicles that traveled through the simulated network in the scenario being evaluated (v2) to get a total travel time in the weekday PM peak hour in 2031.
𝑡𝑡𝑡𝑡 = �𝑡𝑡1𝑣𝑣1−𝑡𝑡2𝑣𝑣2� × 𝑎𝑎𝑎𝑎 × 𝑣𝑣2
The total time per person is then projected over a whole year to come up with a total time savings for the network on an annual basis. This is done by multiplying the peak hour results of the microsimulation work to convert to a representative day, and further to a representative year (shown below):
𝐴𝐴𝐴𝐴𝐴𝐴𝐴𝐴𝑎𝑎𝐴𝐴 𝑇𝑇𝑇𝑇𝑎𝑎𝑣𝑣𝑇𝑇𝐴𝐴 𝑇𝑇𝑇𝑇𝑇𝑇𝑇𝑇 (𝑑𝑑𝑇𝑇𝐴𝐴𝑎𝑎𝑑𝑑)= 𝑁𝑁𝐴𝐴𝑇𝑇𝑁𝑁𝑇𝑇𝑇𝑇 𝑎𝑎𝑜𝑜 𝑊𝑊𝑎𝑎𝑇𝑇𝑊𝑊𝑇𝑇𝐴𝐴𝑊𝑊 𝐷𝐷𝑎𝑎𝑑𝑑𝑡𝑡 𝑝𝑝𝑇𝑇𝑇𝑇 𝑑𝑑𝑇𝑇𝑎𝑎𝑇𝑇 ∗ 𝑃𝑃𝑇𝑇𝑎𝑎𝑊𝑊 𝐻𝐻𝑎𝑎𝐴𝐴𝑇𝑇 𝑡𝑡𝑎𝑎 𝐷𝐷𝑎𝑎𝑑𝑑 𝐹𝐹𝑎𝑎𝐹𝐹𝑡𝑡𝑎𝑎𝑇𝑇∗ 𝑃𝑃𝑇𝑇𝑎𝑎𝑊𝑊 𝐻𝐻𝑎𝑎𝐴𝐴𝑇𝑇 𝑇𝑇𝑇𝑇𝑎𝑎𝑣𝑣𝑇𝑇𝐴𝐴 𝑇𝑇𝑇𝑇𝑇𝑇𝑇𝑇 (𝐷𝐷𝑇𝑇𝐴𝐴𝑎𝑎𝑑𝑑)
A value of 300 for the number of working days per year was applied. This value is industry accepted and in accordance with best practice. The value ts is multiplied against standard values of time used in the Metrolinx guidance to obtain a total time saving benefit for 2031. The value of time represents how much a person is willing to pay in order to save travel time. The Metrolinx value of time is computed from StatsCan income survey data. The travel time calculations from the microsimulation work were converted to a dollar value, which can directly be compared with cost, based on the value of time formula. The annual net benefits over the 60 year life-cycle of the grade separation being analyzed are converted to a net present value (NPV) using a Metrolinx standard discount rate. This allows for a direct comparison between the lifecycle benefits of the project and the lifecycle costs. 3.4 Range of Total Benefits Uncertainties inherent in modelling future scenarios have been addressed by providing a range of possible benefits for each potential grade separation. First, two separate annualization rates were used to address uncertainties around the peak hour to day factor. WSP recommended a peak hour to day factor of 2.5, because the travel along the corridor is fairly uncongested during the off-peak periods. Based on observed 2012 delay data (all day data by time period) from the Eglinton corridor, Metrolinx calculated a more aggressive peak hour to day factor of 5. From the literature, typical values range from 2-10. Second, two separate methodologies were used to model pedestrian behaviour. Uncertainty around pedestrian behaviour was largely due to the fact that there are low

30
numbers of pedestrians crossing the corridor today, but the implementation of an at-grade LRT would create higher pedestrian usage as people would cross the street to board the LRT, either from buses or land uses surrounding the stop locations. Both annualization rates, and both pedestrian modelling methodologies, have been used to create a range of possible benefits (See Table 8). Table 8: Range of net benefits using both a 2.5 Annualization rate and a 5 Annualization rate under two different methodologies for modelling pedestrian behaviour
Estimated Net Benefits ($NPV 2017)
Grade Separation
Pedestrian Method 1,
2.5 Annualizatio
n
Pedestrian Method 1,
5 Annualizatio
n
Pedestrian Method 2,
2.5 Annualization
Pedestrian Method 2,
5 Annualizatio
n
Range (Millions, Rounded)
Jane $14.9 $25.9 $13.1 $5.4 $5.4 - 25.9
Scarlett $13.2 $22.8 $9.2 $2.2 $2.2 - 22.8
Royal York $10.2 $15.8 $(8.3) $(7.0) $(8.3) - 15.7
Islington $5.8 $6.5 $(3.1) $(0.4) $(3.1) - 6.4
Kipling $132.8 $254.8 $251.6 $127.5 $127.5 - 254.8
Martin Grove $69.0 $95.0 $95.7 $68.5 $68.5 - 95.7
3.5 Limitations of Benefits Calculations The benefits monetized in this work accounts for travel time savings for all users associated with grade separating the LRT at a specific intersection. The addition of a piece of infrastructure such as a grade separation also has impacts on the built form of a roadway. There are also a number of potential benefits and disbenefits not captured in this analysis due to limitations in modelling resolution, data inputs and difficulty in assigning monetary value. Elements not captured include:
• Change in frequency or severity of vehicle (all types) collisions • GHG emission changes • Transit user access time changes • Change in frequency or severity of vehicle (all types) and pedestrian collisions
All benefits are evaluated using the City's Rapid Transit Evaluation Framework (RTEF), with non-monetized benefits being addressed through a strategic assessment of each grade separation. This overall RTEF evaluation informs the recommendations for including grade separations in the final project concept.

31
4. Benefit Cost Ratio Findings and Discussion The final results are presented as a range of ratio values to reflect the range of inputs from both the costs and the benefits, and is presented above in Figure 1. Overall, the grade separations do not provide net benefits in the same magnitude of their costs. In particular, in all grade separation scenarios, except for one location, a very low or negative benefit was indicated. The single scenario that had a potential positive benefit was at Kipling Avenue, where the benefits would only be achieved when assuming the lower end of the cost estimate range and an aggressive annualization rate. However, it is important to note that the potential benefits from a grade separation at Kipling is tied to traffic patterns at the Martin Grove intersection. A separate study is underway to assess options for improvements at the Martin Grove/Eglinton Avenue West intersection which may recommend large-scale improvement that could result in substantially different traffic volumes from Kipling. The introduction of such an improvement would reduce the potential benefits of a grade separation at Kipling. For LRT users, a grade separation was seen as beneficial as it allows the LRTs to proceed through the intersection without incurring signal delays, since the LRT would not have to go through the intersection. The LRT travel time benefit of grade separating the intersection is not significant because the signal timings along the at-grade corridor are coordinated to prioritize transit and LRT vehicles are required to stop at all of the identified locations for passenger pickup and drop-off. This coordination of signals results in very short delays caused by signals in the at-grade scenario. Therefore, removing the very short signal delays, does not result in a significant added benefit of grade separating the LRT. For auto users, grade separating allows for permissive left turns. Permissive lefts allow people to make left turns when there are gaps in the opposing traffic which would otherwise not be possible in the base-case scenario (where the LRT movement prohibits the permissive lefts). From the results, it is observed that intersections with significant turning volumes benefit from a grade separation (e.g. Kipling). The benefit of grade separating the intersection results in more available green time to Eglinton Avenue (due to less Flashing Don’t Walk time required for the cross streets), which allows more protected green time for the left turns and more green time for the eastbound/westbound movements. Cross street bus movements may marginally suffer from grade separations as they experience less green time for their north/south movements. In summary, in all cases the grade separations do not show benefits that outweigh the costs over the 60-year lifecycle of the asset. It is also anticipated that there will be added costs for land takings required for a grade separation which are not accounted for in the cost estimates that are presented in this report. Although this benefits-cost analysis does not suggest grade separations are favourable at any intersection, there may be some strategic benefits in a grade separation.
32
Schedule 1 PPP Canada Schematic Design Estimate Guide (2014)6 The quality and accuracy of estimates depends on the level of advancement of the design for the project (refer to Table 9). For this reason, different sets of cost estimates will be prepared at different stages of design development. At an early stage, estimates will be at a high level. As the design becomes more specific with needs and requirements identified, more detailed cost estimates directly linked to the design specifications will be prepared. As the project definition and design evolve, cost estimates become more accurate. This Guide recommends that P3 cost estimates provide a level of cost accuracy of +/-15%, which typically requires that they be prepared on the basis of a Schematic Design. A Schematic Design encompasses plans, elevations, sections, and palettes of materials that generally represents 30% design completion. These inputs are used by Cost Consultants to prepare a Schematic Design Estimate, which is at a Class C level. This approach allows for the development of robust project cost estimates for decision-making, while minimizing any potential to impede innovation and duplicate the efforts undertaken by the Project Sponsor. Traditionally, cost estimates in Canada have been classified into one of four categories, using Classes A, B, C and D. Class D estimates are conceptual estimates based on the project scope (the work that needs to be accomplished to deliver the project) and functional requirements (the output specifications/ deliverables of a project), and are usually presented in unit cost analysis format (applying a monetary rate to an element, sub-element or component per unit of measurement), such as cost per m2.Class D estimates are conceptual estimates based on the project scope (the work that needs to be accomplished to deliver the project) and functional requirements (the output specifications/ deliverables of a project), and are usually presented in unit cost analysis format (applying a monetary rate to an element, sub-element or component per unit of measurement), such as cost per m2.
6 http://www.p3canada.ca/~/media/english/resources-library/ppp_dseg_eng_pf7.pdf

33
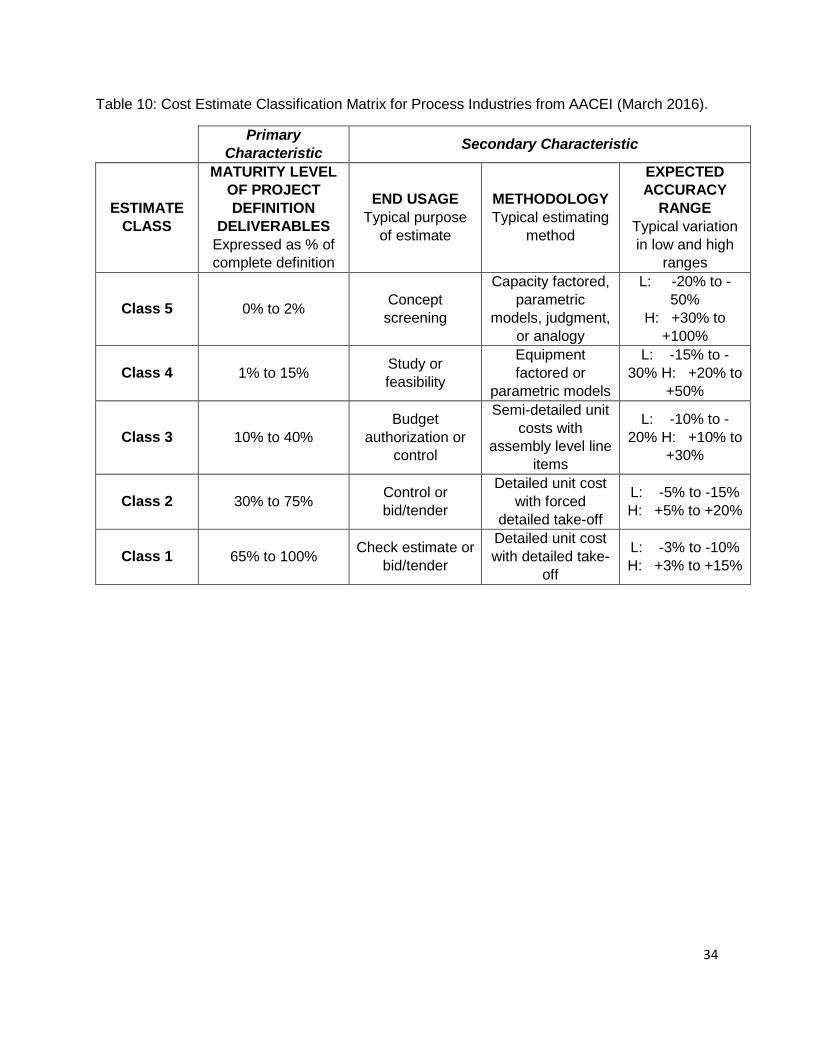
Cost Estimate Classification System - As Applied in Engineering, Procurement and Construction for the Process Industries (2016) AACEI7 The AACE International Cost Estimate Classification System provides guidelines for applying the general principles of estimate classification to project cost estimates (i.e., cost estimates that are used to evaluate, approve, and/or fund projects). Depending upon the technical complexity of the project, the availability of appropriate cost reference information, the degree of project definition, and the inclusion of appropriate contingency determination, a typical Class 4/5 estimate for a process industry project may have an accuracy range as broad as -50% to +100%, or as narrow as -20% to +30%., as shown below in Table 10.
7 https://web.aacei.org/docs/default-source/toc/toc_18r-97.pdf?sfvrsn=4
Table 9: Class System from Generic Design and Cost Estimate Table from PPP Canada
34
Table 10: Cost Estimate Classification Matrix for Process Industries from AACEI (March 2016).
Primary Characteristic Secondary Characteristic
ESTIMATE CLASS
MATURITY LEVEL OF PROJECT DEFINITION
DELIVERABLES Expressed as % of complete definition
END USAGE Typical purpose
of estimate
METHODOLOGY Typical estimating
method
EXPECTED ACCURACY
RANGE Typical variation in low and high
ranges
Class 5 0% to 2% Concept screening
Capacity factored, parametric
models, judgment, or analogy
L: -20% to -50%
H: +30% to +100%
Class 4 1% to 15% Study or feasibility
Equipment factored or
parametric models
L: -15% to -30% H: +20% to
+50%
Class 3 10% to 40% Budget
authorization or control
Semi-detailed unit costs with
assembly level line items
L: -10% to -20% H: +10% to
+30%
Class 2 30% to 75% Control or bid/tender
Detailed unit cost with forced
detailed take-off
L: -5% to -15% H: +5% to +20%
Class 1 65% to 100% Check estimate or bid/tender
Detailed unit cost with detailed take-
off
L: -3% to -10% H: +3% to +15%