ehpenvironmental health perspectives · 0.94-1.10 per 20 µg/m3 increase in no ... (eneroth et al....
TRANSCRIPT
ENVIRONMENTALHEALTH PERSPECTIVES
Note to readers with disabilities: EHP will provide a 508-conformant version of this article upon final publication. If you require a 508-conformant version before then, please contact [email protected]. Our staff will work with you to assess and meet your accessibility needs within 3 working days.
http://www.ehponline.org
ehpPerinatal Exposure to Traffic-Related Air Pollution and
Autism Spectrum Disorders
Tong Gong, Christina Dalman, Susanne Wicks, Henrik Dal, Cecilia Magnusson, Cecilia Lundholm, Catarina Almqvist,
and Göran Pershagen
http://dx.doi.org/10.1289/EHP118
Received: 16 March 2016Revised: 23 June 2016Accepted: 12 July 2016
Published: 5 August 2016
Environ Health Perspect DOI: 10.1289/EHP118
1
Perinatal Exposure to Traffic-Related Air Pollution and Autism Spectrum Disorders
Tong Gong1, Christina Dalman2,3, Susanne Wicks2,3, Henrik Dal2,3, Cecilia Magnusson2,
Cecilia Lundholm1, Catarina Almqvist1,4,and Göran Pershagen5,6
1 Department of Medical Epidemiology and Biostatistics, Karolinska Institutet
2 Department of Public Health Sciences, Karolinska Institutet
3 Center for Epidemiology and Community Medicine, Stockholm County Council
4 Astrid Lindgren Children’s Hospital, Karolinska University Hospital
5 Institute of Environmental Medicine, Karolinska Institutet
6 Center for Occupational and Environmental Medicine, Stockholm County Council
Stockholm, Sweden
Corresponding author:
Tong Gong Department of Medical Epidemiology and Biostatistics Karolinska Institutet SE-171 77 Stockholm, Sweden T. +46 8 524 84450 Email. [email protected]
Running title: Exposure to air pollution and autism spectrum disorders
Acknowledgements:
Financial support was provided through the Swedish Research Council for Health, Working Life and Welfare (FORTE 2012-0573 and 2015-00289), the Swedish Research Council (VR) 2011-3060, VR in partnership with FORTE, FORMAS and VINNOVA [Cross-disciplinary research program concerning children’s and young people’s mental health], VR through the Swedish Initiative for Research on Microdata in the Social And Medical Sciences (SIMSAM) framework grant 340-2013-5867, HKH Kronprinsessan Lovisas förening för barnasjukvård, and the Strategic Research Program in Epidemiology at Karolinska Institutet.
Conflict of interestion: None.
Environ Health Perspect DOI: 10.1289/EHP118
2
Abstract
Background: Studies from the United States indicate that exposure to air pollution in early
life is associated with autism spectrum disorders (ASD) in children, but the evidence is not
consistent with European data.
Method: Children born and residing in Stockholm during 1993-2007 with an ASD diagnosis
were identified through multiple health registers and classified as cases (n=5,136). A
randomly selected sample of 18,237 children from the same study base constituted controls.
Levels of nitrogen oxides (NOx) and particulate matter with diameters <10µm (PM10) from
road traffic were estimated at residential addresses during mother’s pregnancy and the child’s
first year of life by dispersion models. Odds ratios (OR) and 95% confidence intervals (CI) for
ASD with or without intellectual disability (ID) were estimated using logistic regression
models after conditioning on municipality and calendar year of birth as well as adjustment for
potential confounders.
Result: Air pollution exposure during the prenatal period was not associated with ASD
overall (OR 1.00, 95% CI 0.86-1.15 per 10 µg/m3 increase in PM10 and OR 1.02, 95% CI
0.94-1.10 per 20 µg/m3 increase in NOx during mother’s pregnancy). Similar results were seen
for exposure during the first year of life, and for ASD in combination with ID. An inverse
association between air pollution exposure and ASD risk was observed among children of
mothers who moved to a new residence during pregnancy.
Conclusion: Early life exposure to low levels of NOx and PM10 from road traffic does not
appear to increase the risk of ASD.
Environ Health Perspect DOI: 10.1289/EHP118
3
Introduction
Autism spectrum disorders (ASD) are a range of childhood neurodevelopmental disorders
characterized by deficits in communication and social interaction as well as restricted
repetitive behaviors (American Psychiatric Association. 2013). The global prevalence appears
to have increased over the past decades (Baird et al. 2006; Centers for Disease Control and
Prevention 2014; Lauritsen et al. 2004; Nassar et al. 2009), partially due to the increased
awareness and changes of clinical practices. In Sweden, 1.5% of children are currently
diagnosed with ASD compared to 0.8% a decade ago (Idring et al. 2015; Lundstrom et al.
2015). Among ASD-affected children, intellectual disability (ID) is relatively common and
those children often display significant clinical impairment (Buescher et al. 2014).
Early twin and family studies suggested ASD to be highly heritable (Bailey et al. 1995;
Lichtenstein et al. 2010; Ritvo et al. 1989), however, recent studies have shown a moderate
heritability for ASD (Ronald et al. 2011; Sandin et al. 2014), suggesting a substantial non-
genetic component contributing to the etiology of the disorder. Moreover, twin studies have
recently reported a modest genetic component but a significant environmental contribution to
the correlation between ASD and ID (Hoekstra et al. 2009, 2010). Some maternal factors such
as infections during pregnancy and a history of depression or antidepressant use have been
associated with ASD (Lee et al. 2015; Rai et al. 2013). There is also growing evidence that
perinatal and neonatal risk factors e.g. small for gestational age, preterm birth, low birth
weight and cesarean delivery may affect the development of ASD (Buchmayer et al. 2009;
Hultman et al. 2002) . However, a recent meta-analysis did not indicate any specific
pregnancy or delivery condition explaining the etiology of autism (Gardener et al. 2011).
Exposure to various air pollutants including ozone (Becerra et al. 2013; Jung et al. 2013; Volk
et al. 2013), carbon monoxide (Becerra et al. 2013; Jung et al. 2013), nitrogen oxides (NOx)
(Becerra et al. 2013; Jung et al. 2013; Volk et al. 2013), sulfur dioxide (Jung et al. 2013),
Environ Health Perspect DOI: 10.1289/EHP118
4
particulate matter (PM) (Becerra et al. 2013; Jung et al. 2013; Kalkbrenner et al. 2010;
Kalkbrenner et al. 2015; Raz et al. 2014; Windham et al. 2006; Volk et al. 2013), metals
(Kalkbrenner et al. 2010; Palmer et al. 2009; Windham et al. 2006), and other hazardous air
pollutants (Kalkbrenner et al. 2010; Windham et al. 2006) have been linked to a modestly
increased risk of ASD, which may be explained by systemic inflammation affecting the
central nervous system development in utero (Allen et al. 2014). However, a recent European
meta-analysis could not confirm this from those exposed by NOx and PM during perinatal life
(Guxens et al. 2016). One explanation of the discrepant findings could be residual
confounding from socioeconomic factors (Braveman et al. 2005; Hajat et al. 2013;
Magnusson et al. 2012; Rai et al. 2012; Thomas et al. 2012). For example, a previous register-
based study in Sweden found that lower familial socioeconomic status (SES) was associated
with an increased risk of ASD through multiple dimensions of SES measures (Rai et al. 2012),
which is contrary to findings from the United States (Thomas et al. 2012). Pollutant-specific
effects could also contribute to the discrepant findings. In one study, the positive association
was found for prenatal exposure to particulate matter with an aerodynamic diameter ≤2.5
micrometer (PM2.5) but not to particulate matter with a diameter of ≤10 micrometer (PM10)
(Raz et al. 2014). Additionally, associations may differ for ASD with or without
accompanying intellectual impairment, although this was not seen in a recent US study
(Kalkbrenner et al. 2015).
Our aim was to investigate the association between exposure to air pollution from road traffic
and the risk of ASD in children with or without presence of ID, with careful adjustment for
individual- and area-level SES as well as other potential confounders. We selected a very
large study base, allowing for more informative subgroup analyses than in earlier studies.
Environ Health Perspect DOI: 10.1289/EHP118
5
Methods
Population and study design
We conducted a case-control study based on the Stockholm Youth Cohort (SYC), a
prospective cohort study including all children who resided in Stockholm County for at least
four years during 2001-2007 (Idring et al. 2012). To investigate the effect of air pollution
during prenatal and postnatal periods, we selected a sub-population from SYC including
children born and living in Stockholm County all the time between 1993 and 2007 and with
biological mothers living in Stockholm County one year before and one year after the child’s
birth (n=277, 478). Each child born in Sweden or each immigrant staying in Sweden for at
least one year is assigned a unique personal identity number, which enables accurate linkage
from different health registers to various socio-demographic background information while
maintaining individual anonymity (Ludvigsson et al. 2009).
The cases constituted children with ASD (n=5,529) identified from the National Patient
Register (NPR), the Clinical Database for Child and Adolescent Psychiatry in Stockholm
(PASTILL), the Habilitation Register (HAB), and the Stockholm Regional Health Care Data
warehouse (VAL) until December 31, 2011. These registers cover all public-financed health
seeking pathways for ASD, with or without presence of ID, in Stockholm County during the
whole study period, described in detail in a validation study (Idring et al. 2012). Diagnosis
and care for ASD and ID was based on the International Classification of Diseases 9th or 10th
revisions (ICD-9/10 codes: 299/F81 for ASD and 317-319/F70-79 for ID), the Diagnostic and
Statistical Manual of mental disorders 4th version (DSM-IV code: 299 for ASD and 317-319
for ID), or any utilization of habilitation services followed by an ASD diagnosis. Cases were
further divided into ASD with and without ID, regardless of whichever diagnosis came first.
We excluded adopted children (n=2, 0.04%), multiple births (n=162, 3.1%), and births which
were not recorded in the Medical Birth Register (n=229, 4.1%).
Environ Health Perspect DOI: 10.1289/EHP118
6
We selected a random sample of 20,000 children from the sub-population of SYC as controls
and further excluded 420 (2.1%) who developed ASD during follow-up. Among the
remaining 19,580 controls, we excluded adopted children (n=15, 0.1%), multiple births
(n=585, 3.1%), and births which were not recorded in the Medical Birth Register (n=743,
3.8%).
Exposure assessment
Detailed descriptions of the air pollution exposure assessment methodology are available in
previous publications (Bellander et al. 2001; Gruzieva et al. 2012). Briefly, a Gaussian air
quality dispersion model was used to estimate the temporal and spatial distribution of NOx
and PM10 in Stockholm County during the study period. This was based on emission
databases for NOx in 1990, 1995, 2000, 2002-2004, and interpolations estimated levels during
the remaining years of the exposure period. PM10 did not show any time trends during this
period and model calculations were based on the year 2004. A street canyon contribution was
added for the most polluted street segments in the inner city of Stockholm with multistory
houses on both sides. Comparisons between model estimated and monitoring station measured
NOx levels during the exposure period provided an R2 of 0.74-0.80, indicating a moderate-to-
high model performance (Johansson et al. 2008). For PM10 the R2 was 0.61 (Eneroth et al.
2006). Relevant residential addresses of the study subjects were geocoded and pollutant levels
emanating from road traffic were estimated at these coordinates from the dispersion models
and used to calculate annual average concentrations for NOx and PM10. NOx is used as a
marker for tail pipe emissions, such as fine particles, while PM10 reflects coarse particulates,
mainly originating from road dust. To account for changes in exposure levels among those
moving to another residence, time-weighted NOx and PM10 concentrations related to road
traffic emissions were calculated based on all registered addresses during the pregnancy and
the child’s first year of life.
Environ Health Perspect DOI: 10.1289/EHP118
7
Covariates
Information on child characteristics including birth year, gender, sib order, gestational age,
birth weight, congenital malformation and maternal characteristics including season of
conception, smoking during pregnancy, and marital status at child birth were obtained from
the Medical Birth Register. Data regarding family characteristics at child birth including
disposable income within household, maternal and paternal education as well as employment
of the mother and father were retrieved from the longitudinal integration database for health
insurance and labor market studies, originally from Statistics Sweden. Information on
maternal and paternal age at child birth, municipality of the mother at child birth, and parental
birth countries was retrieved from the Total Population Register. Furthermore, area-based
socioeconomic characteristics at birth year were measured by a neighborhood deprivation
index (Sariaslan et al. 2013). Neighborhood was defined by the small-area market statistics
(SAMS), which is based on small socioeconomically homogeneous areas with on average
1000 residents. Information on welfare beneficiaries, unemployment, immigrants, divorce rate,
income, education, residential mobility, and criminal conviction rate from Statistics Sweden
were linked with each SAMS area to calculate a neighborhood deprivation index using
principal component analysis (Sariaslan et al. 2013). The neighborhood deprivation index was
further categorized into tertiles. Information on family history of psychiatric disorders
including schizophrenia, bipolar disorders, ID, non-affective psychosis, and other diagnoses in
the mental and behavioral disorders chapter from ICD-10 (F-diagnoses) was obtained through
NPR, VAL and PASTILL (see Table S1 for diagnostic codes).
Statistical analyses
To estimate the independence of pollutants over time, we calculated correlation coefficients
for NOx and PM10 over the pregnancy period of the mother and child’s first year of life. Socio-
demographic characteristics were compared among cases and controls using the t-test or chi-
Environ Health Perspect DOI: 10.1289/EHP118
8
square test. To assess the association between exposure to pollutants during each specific
period and ASD in children and account for differences in diagnostic practices over time and
across municipalities, we used conditional logistic regression models and conditioned on
calendar year and municipality of birth (see Table S2 for detailed information on classification
of municipalities). First, the two air pollution components were treated as continuous
variables and fixed exposure increments per 20µg/m3 for NOx and per 10µg/m3 for PM10 were
used in all models to estimate the risk of ASD overall, with and without ID. Second,
pollutants were categorized into quartiles based on their distribution in each time period and
the lowest quartiles served as reference group when modeling the association with ASD
overall. To assess effect modification, we examined the association between continuous
exposure to either pollutant and ASD overall, with and without ID by gender, sib order,
mother’s marital status, neighborhood deprivation, highest education between parents at child
birth, mother’s smoking status during pregnancy as well as residential mobility during
mother’s pregnancy via inclusion of the interaction terms in the regression models. Wald tests
were used to examine the statistical significance of interaction terms, using p<0.05 as
significance level. In sensitivity analyses, we excluded children with ASD diagnoses before 2
years of age, those born before year 2003 (when we have complete coverage on ASD
diagnosis from birth from all registers), children with congenital malformation, those with
either parent having any psychiatric disorders, children of foreign-born parents, children born
to mothers with pre-eclampsia, pre-gestational and gestational diabetes, premature rupture of
the membranes, placental abruption, children born before 37 weeks of gestation, or children
born with a birth weight < 2,500g, as they are often at greater risk of ASD. To further explore
the potential spatial over-adjustment, we provided estimates of the association between
pollutants and ASD without conditioning on municipality of birth. We also ran a sensitivity
Environ Health Perspect DOI: 10.1289/EHP118
9
analysis by including multiple births, for which the information on sib order and birth weight
was ambiguous (The Swedish National Board of Health and Welfare. 2003).
We used a directed acyclic graph to determine potential confounders of the investigated
associations (see Figure S1 in the supplementary materials). A series of models were run step-
wise to assess the gradual changes of risk estimates by further adjustment for potential
confounders. We present odds ratios (OR) and 95% confidence intervals (CI) from crude
models and models adjusted for gender, birth month, sib order, maternal age, paternal age,
mother's marital status, parents' birth countries, mother's education, father's education,
mother's employment, father's employment, disposable income within household, and
neighborhood deprivation. Statistical analyses were conducted using SAS version 9.4 (SAS
Institute, NC, USA).
The study protocol was reviewed and approved by the regional ethical review board in
Stockholm, Sweden.
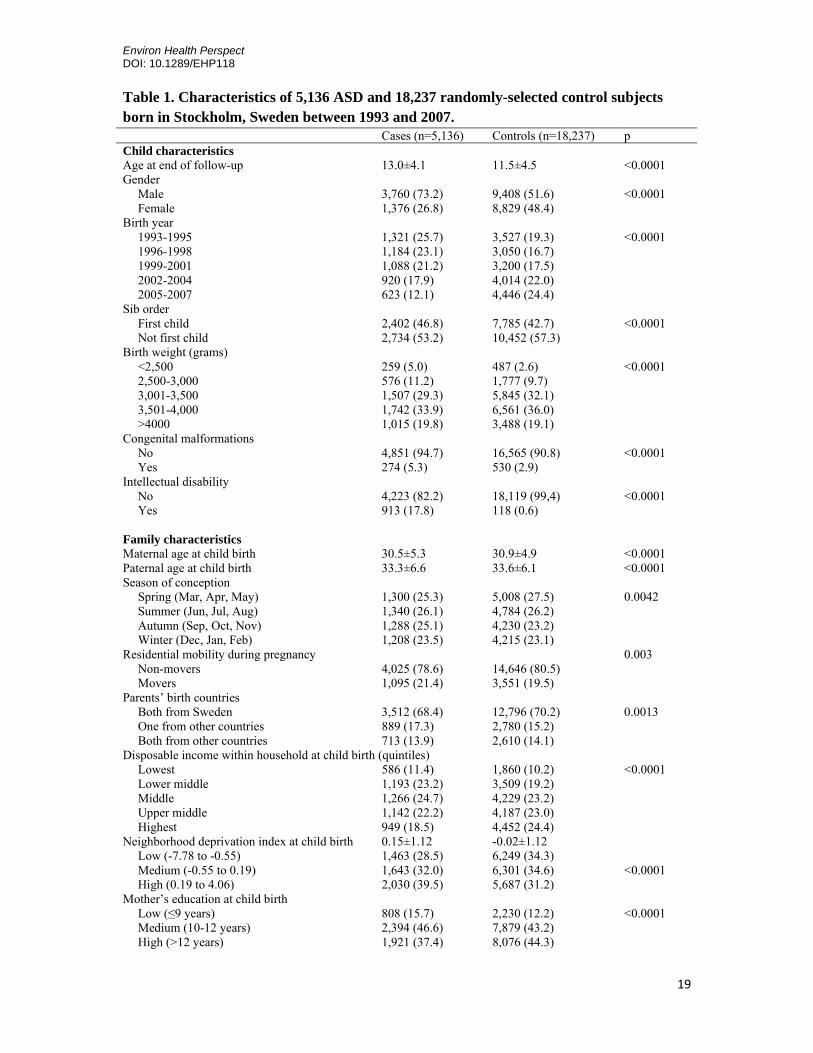
Result Table 1 lists characteristics of the study population. Compared to controls, ASD cases were on
average 2 years younger, more likely to be boys, have a parent with less than 12 years of
education, being unemployed, or with psychiatric disorders. Maternal characteristics were also
slightly different between cases and controls. For example, mothers of cases were less often
married or cohabiting, but more often smoked during pregnancy.
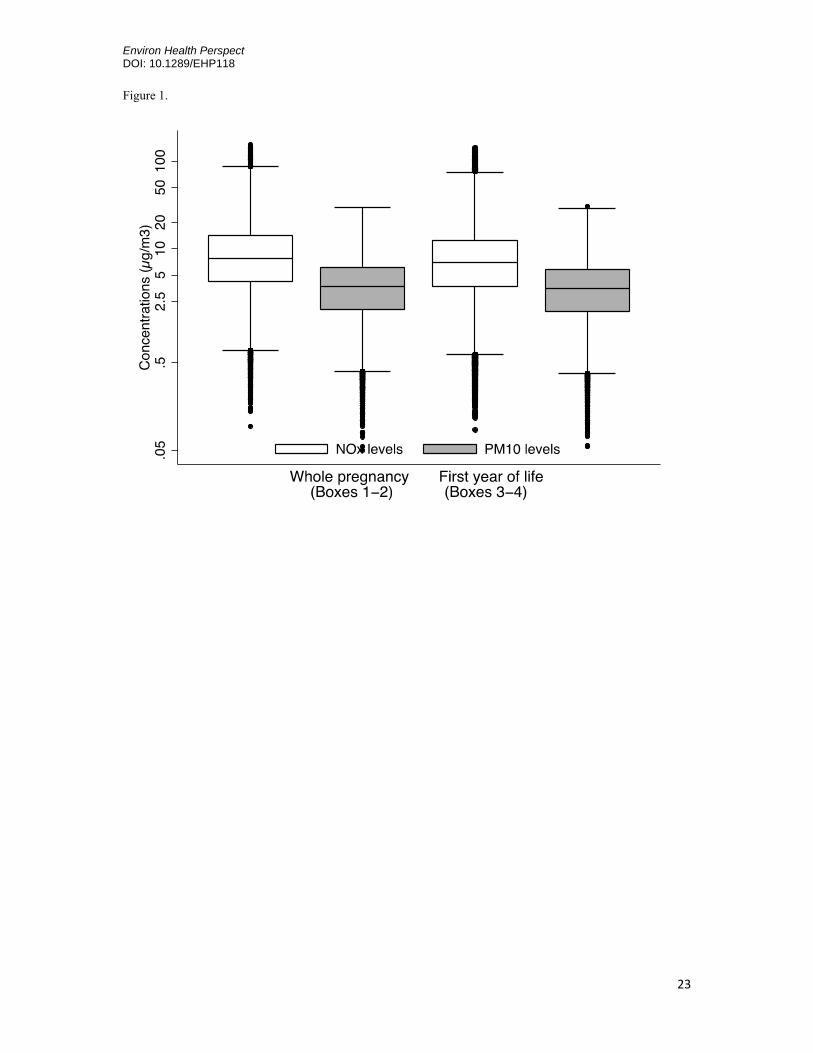
Figure 1 shows boxplots of air pollutant levels during the pregnancy and the child’s first year
of life, respectively. The arithmetic mean levels of NOx from local traffic were 11.0 µg/m3
during mother’s pregnancy, and dropped somewhat to 9.8 µg/m3 during the postnatal period
(see Table S3). On the other hand, the yearly arithmetic mean levels of PM10 were relatively
Environ Health Perspect DOI: 10.1289/EHP118
10
constant (4.2-4.4 µg/m3). NOx was closely correlated with PM10 (r2≥0.7) over the study period
as both has local traffic as the major source.
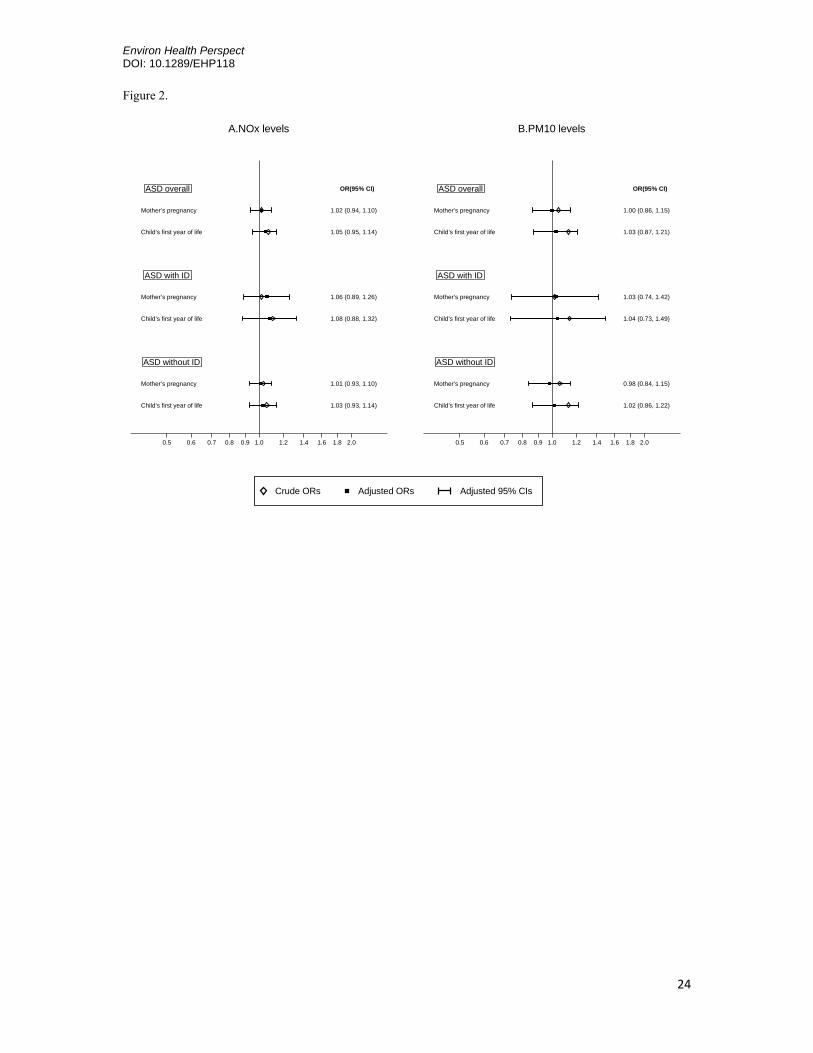
The associations between air pollution exposure as a continuous measure and the risk of ASD
overall, with and without ID are shown in Figure 2. We did not observe any differences in risk
of ASD overall, with or without ID by exposure during pregnancy to NOx or PM10 after
adjusting for potential confounders (e.g. adjusted OR was 1.02 (95% CI 0.94-1.10) for ASD
overall by per 20 µg/m3 increase of NOx and 1.06 (95% CI 0.89-1.26) for ASD with ID, and
1.01 (95% CI 0.93-1.10) for ASD without ID). Corresponding ORs for an increment of 10
µg/m3 of PM10 were 1.00 (95% CI 0.86-1.15), 1.03 (95% CI 0.74-1.42) and 0.98 (95% CI
0.84-1.15), respectively. Results were similar for exposure during the child’s first year of life
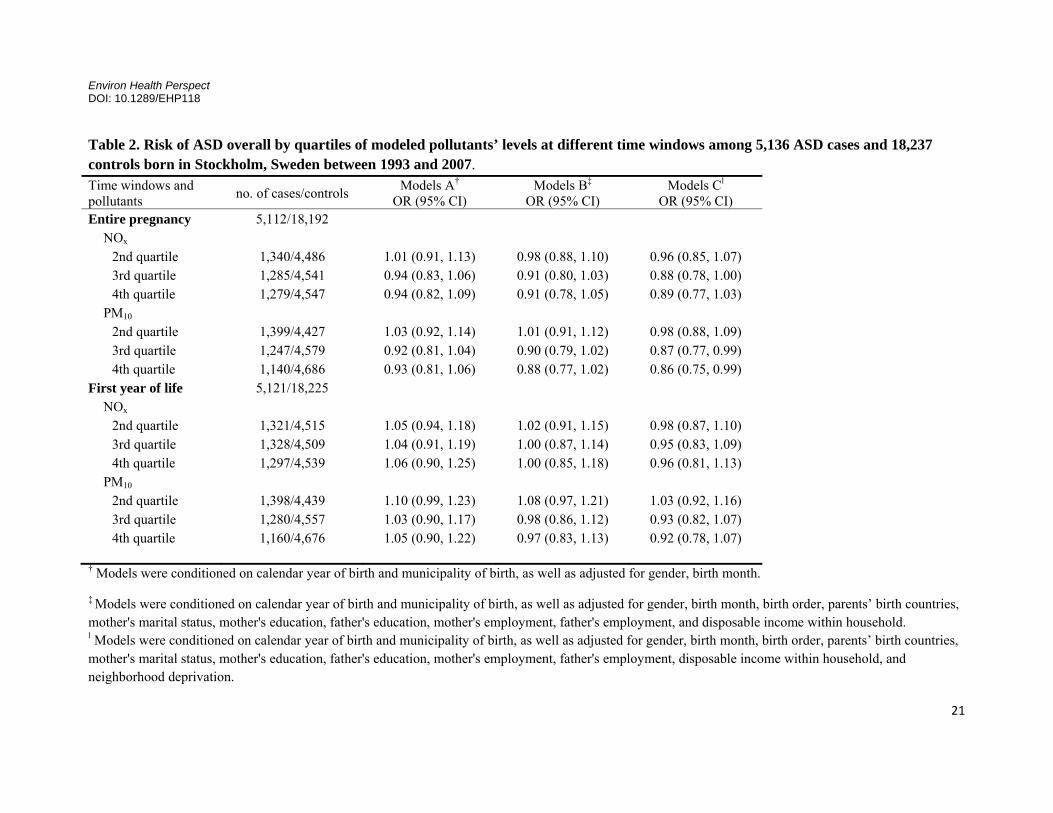
(see Figure 2 and Table S4). However, when pollutants were categorized into quartiles,
children living in areas within the 3rd and 4th quartiles of air pollution exposure had a slightly
lower risk of ASD overall compared to those living in areas within the least polluted quartile,
especially in relation to exposure during pregnancy (Table 2). We observed no major
confounding by individual or neighborhood covariates on the association between pollutant
levels and ASD (see Table 2 and Table S4). However, the adjustments consistently generated
somewhat lower ORs for ASD without ID, which constituted the major group among the
cases.
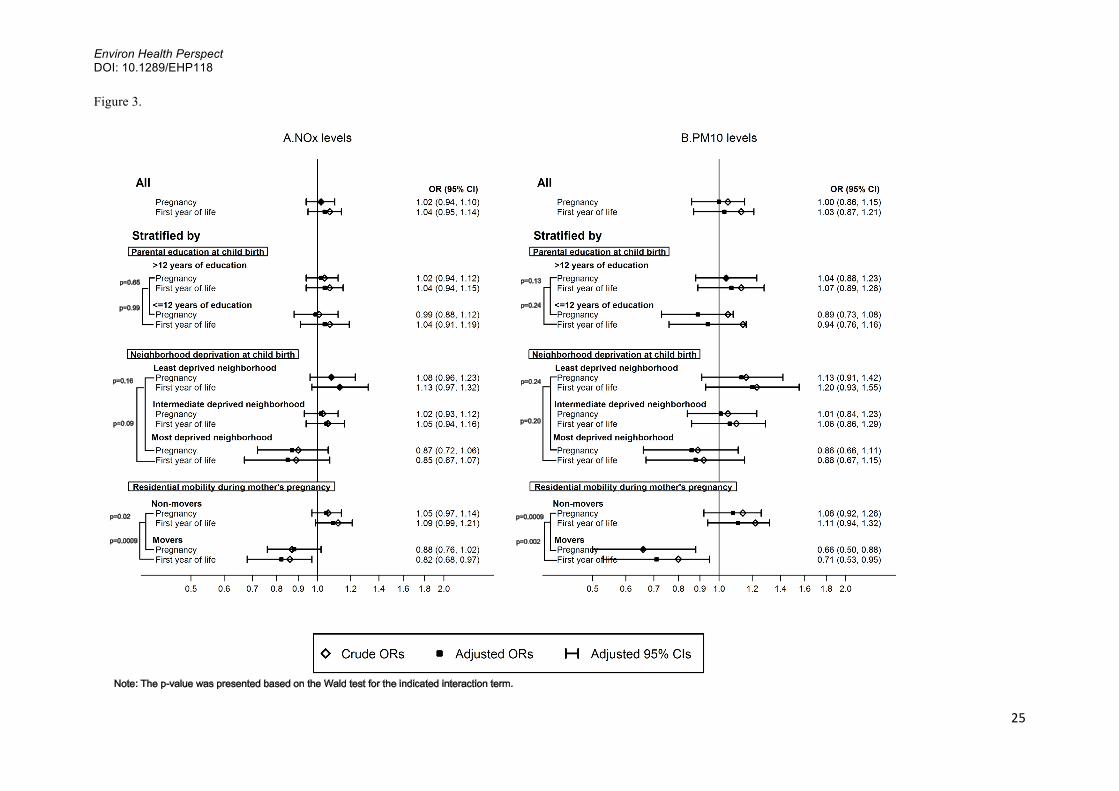
We observed a similar pattern of associations in subgroups based on parental education
(Figure 3 for ASD overall, Figures S2 and S3 for ASD with and without ID). There was a
suggested inverse relation between air pollution exposure and ASD for those in the most
deprived neighborhoods, especially for ASD without ID. A statistically significant interaction
was seen for residential mobility, where a decreased risk for ASD with air pollution exposure
pre- or postnatally was only seen among those changing residential address during pregnancy
(all p-interactions <0.03). Further analyses showed that moving patterns were related to SES
Environ Health Perspect DOI: 10.1289/EHP118
11
and psychiatric illness among the parents (Table S5). Interactions with air pollution exposure
in relation to ASD were also investigated for several other characteristics, including gender,
sib order, mother’s smoking and marital status, but no statistically significant effect
modification was observed (data not shown).
In sensitivity analyses including multiple births (see Table S6) or excluding children born to
mothers with changing residential address during pregnancy, cases diagnosed before 2 years
of age, children with congenital malformation, children born before 2003, children born to
mothers with pre-eclampsia, pre-gestational and gestational diabetes, premature rupture of the
membranes, placental abruption, children of foreign-born parents, children born with a <37
weeks of gestation or with a birth weight <2,500 gram, we found similar patterns of results for
both pollutants as in our main analysis (Table S7). Furthermore, in analyses not conditioning
on municipality of birth, we observed that exposure to NOx and PM10 during pre- or post-natal
period appeared to be associated with a decreased risk of ASD (Table S8).
Discussion Among children born between 1993-2007 in Stockholm County, we found that pre- and post-
natal exposure to either NOx or PM10 was not associated with ASD overall, with or without ID.
There was an inverse association between air pollution exposure and ASD risk for children of
mothers who changed residential addresses during pregnancy, which could be partly
explained by confounding by SES and psychiatric diseases in the parents.
We previously reported no association between traffic-related air pollution during pre- or
post-natal periods and sub-clinical ASD outcomes using a twin cohort from Stockholm,
however, risk estimates tended to lie below one with wide confidence intervals (Gong et al.
2014). The current study showed a similar result using a much larger sample but contradict
the positive associations reported in several previous studies from the United States
(Kalkbrenner et al. 2010; Kalkbrenner et al. 2015; Raz et al. 2014; A. L. Roberts et al. 2013;
Environ Health Perspect DOI: 10.1289/EHP118
12
Volk et al. 2011; Volk et al. 2013). One possible explanation for the inconsistent results could
be the lower levels of air pollution in Stockholm. For example, mean levels of PM10 in
California, USA and Taiwan were reported at about 25-36 and 58 µg/m3 (Becerra et al. 2013;
Jung et al. 2013; Kalkbrenner et al. 2015; Volk et al. 2013). However, the local traffic related
PM10 concentrations in the current study was 4.3 µg/m3 during mother’s pregnancy and
child’s first year of life and the background PM10 level generated from long-distance
transportation near Stockholm County has remained at a rather stable level at 10 µg/m3 across
the whole study period (Burman and Norman 2013). Previous studies have generally reported
on nitrogen dioxide (NO2) with mean levels in California, US and Taiwan of 32-43 µg/m3
(converted from 17 and 28.8 ppb with temperature at 25 Celsius degrees) (Becerra et al. 2013;
Jung et al. 2013; Volk et al. 2013). We used NOx as a marker since it better reflects the tail
pipe emissions but it is less often measured or reported. The average urban background levels
of NO2 during the study period in Stockholm decreased from around 20 to 14 µg/m3 (Durant
et al. 2014), and were thus considerably lower than the levels in the areas reported in earlier
publications. Furthermore, the air pollution levels in Stockholm County, constituting the
catchment area for our cohort and another cohort included in a recent European meta-analysis,
are lower than in most (NOx) or all (PM10) other areas included this meta-analysis (Guxens et
al. 2016). It is possible that we may have missed an association that is primarily seen at higher
levels of exposure.
Residential mobility during pre- and post-natal life could also contribute to the inconsistent
results. Young maternal age, being unmarried, having psychiatric diseases, and low
socioeconomic status have been associated with residential mobility during pregnancy (Bell
and Belanger 2012; Fell et al. 2004; Miller et al. 2010; Tulloch et al. 2010) and may thereby
affect offspring’s ASD risk estimates (Rai et al. 2012; Andrea L. Roberts et al. 2013; Thomas
et al. 2012). Most previous studies have not investigated the potential impact by residential
Environ Health Perspect DOI: 10.1289/EHP118
13
mobility (Jung et al. 2013; Kalkbrenner et al. 2015; A. L. Roberts et al. 2013; Volk et al.
2013). One report from the Nurses’ Health Study II found that the positive association of
PM2.5 and ASD was stronger among non-movers, although no interaction test was performed
based on moving status (Raz et al. 2014). We observed an inverse association among families
that changed their residential addresses during mother’s pregnancy. The reason for this is
unclear and the influence of moving on the association between air pollution and ASD, which
was related to SES and psychiatric disorders among the parents, should be investigated in
further studies. Furthermore, misclassification of municipality at delivery among movers
could contribute to the observed inverse association as we did not take into account the effect
of municipalities where the mother lived prior to delivery.
Another explanation of the inconsistent results could be different proportions of high- and
low-functioning ASD in different study settings. For example, one study in USA reported 40%
of the ASD cases also report having ID (Kalkbrenner et al. 2015), but there were only 19% of
ASD cases with co-existing ID diagnosis in our study. If the positive association could only
be seen in this subtype of ASD, the higher proportion of ASD without ID in our study might
have resulted in diluted associations.
Residual confounding could also contribute to the inconsistent findings by e.g. socioeconomic
indicators. Children from higher SES families were more likely to be diagnosed with ASD in
previous studies and the OR estimates for both air pollutants appeared slightly lower after
adjusting for confounders including birth year, birth order, parental age, income, education,
and ethnicity (Becerra et al. 2013; Kalkbrenner et al. 2015; Raz et al. 2014; A. L. Roberts et al.
2013; Thomas et al. 2012; Volk et al. 2013). Family and contextual SES covariates had
relatively small effects on the association between air pollutants and ASD in our study.
Sweden has a rather universal healthcare system compared to the private sector dominated
Environ Health Perspect DOI: 10.1289/EHP118
14
healthcare system in the US (Anell et al. 2012), which may lead to differences in case
ascertainment and bias related to SES.
We could not completely rule out the possibility of an association in certain subgroups, such
as in those born to mothers not moving during pregnancy and among children of parents
without any psychiatric diagnoses. As noted above residential mobility, SES and psychiatric
disorders were related, making it difficult to disentangle their specific influence on the
associations between air pollution exposure and ASD. A familial aggregation of ASD and
other psychiatric conditions has been documented (Daniels et al. 2008). Our data suggest that
the effect of air pollution on ASD could be masked by confounding from psychiatric
diagnoses, partly related to differential moving patterns and SES.
Our study has several strengths. Firstly, the linkage of encrypted data from multiple registers
enabled us to include cases and controls from the same study base, and to retrieve detailed
information on validated outcomes (Idring et al. 2012) and highly reliable measures at
individual level. Secondly, the air pollution exposure assessment methodology has been
validated and generated positive associations for several outcomes in children of our study
area, such as asthma, allergy and lung function disturbances (Melen et al. 2008; Nordling et al.
2008; Schultz et al. 2012). Using register-based information on moving dates for each
residential address, time-weighted estimates of pollutant levels based on the duration of stay
at the respective address was also taken into consideration. Thirdly, because of the large
sample size, we had sufficient statistical power to perform subgroup specific analyses.
Our study also has some limitations. Due to the late establishment of PASTILL, HAB and
VAL registers, we did not have a full age coverage of the diagnoses for all children in the
study base. However, we found a similar result on the association of pollutant levels and ASD
in the sub-population where complete information on ASD diagnoses from all registers was
Environ Health Perspect DOI: 10.1289/EHP118
15
available among children born since 2003. Furthermore, there was no data on maternal
exposure prior to conception or on paternal exposure during the child’s early life. The
analyses conditioned on municipality (and birth year) to minimize risks for differences in
diagnostic practices influencing the results. This may have led to some over-adjustment in
relation to the air pollution effects. However, we did not observe an increased risk by
exposure to either pollutant in sensitivity analysis not conditioning on municipality.
In conclusion, our results indicate that exposure to NOx and PM10 during the pre- and post-
natal period is not associated with ASD. The absence of positive associations in our study
may be related to comparatively low air pollutant levels.
Environ Health Perspect DOI: 10.1289/EHP118
16
Reference Allen JL, Liu X, Pelkowski S, Palmer B, Conrad K, Oberdorster G, et al. 2014. Early postnatal exposure to ultrafine particulate matter air pollution: Persistent ventriculomegaly, neurochemical disruption, and glial activation preferentially in male mice. Environmental health perspectives 122:939‐945. American Psychiatric Association. 2013. Diagnostic and statistical manual of mental disorders : Dsm‐5. 5th ed. Washington, D.C.:American Psychiatric Association. Anell A, Glenngård AH, Merkur S. 2012. Health systems in transition: Sweden‐a health system review. World Health Organization, on behalf of the European Observatory on Health Systems and Policies. Bailey A, Le Couteur A, Gottesman I, Bolton P, Simonoff E, Yuzda E, et al. 1995. Autism as a strongly genetic disorder: Evidence from a british twin study. Psychological medicine 25:63‐77. Baird G, Simonoff E, Pickles A, Chandler S, Loucas T, Meldrum D, et al. 2006. Prevalence of disorders of the autism spectrum in a population cohort of children in south thames: The special needs and autism project (snap). Lancet 368:210‐215. Becerra TA, Wilhelm M, Olsen J, Cockburn M, Ritz B. 2013. Ambient air pollution and autism in los angeles county, california. Environ Health Perspect 121:380‐386. Bell ML, Belanger K. 2012. Review of research on residential mobility during pregnancy: Consequences for assessment of prenatal environmental exposures. Journal of exposure science & environmental epidemiology 22:429‐438. Bellander T, Berglind N, Gustavsson P, Jonson T, Nyberg F, Pershagen G, et al. 2001. Using geographic information systems to assess individual historical exposure to air pollution from traffic and house heating in stockholm. Environmental health perspectives 109:633‐639. Braveman PA, Cubbin C, Egerter S, Chideya S, Marchi KS, Metzler M, et al. 2005. Socioeconomic status in health research: One size does not fit all. JAMA 294:2879‐2888. Buchmayer S, Johansson S, Johansson A, Hultman CM, Sparen P, Cnattingius S. 2009. Can association between preterm birth and autism be explained by maternal or neonatal morbidity? Pediatrics 124:e817‐825. Buescher AV, Cidav Z, Knapp M, Mandell DS. 2014. Costs of autism spectrum disorders in the united kingdom and the united states. JAMA pediatrics 168:721‐728. Burman L, Norman M. 2013. The air quality in stockholm: Annual report 2012. Available: http://www.slb.nu/slb/rapporter/pdf8/slb2013_005.pdf [accessed Feb 07 2014]. Centers for Disease Control and Prevention. 2014. Prevalence of autism spectrum disorder among children aged 8 years — autism and developmental disabilities monitoring network, 11 sites, united states, 2010. Morbidity and Mortality Weekly Report 2014; 63 (2). Daniels JL, Forssen U, Hultman CM, Cnattingius S, Savitz DA, Feychting M, et al. 2008. Parental psychiatric disorders associated with autism spectrum disorders in the offspring. Pediatrics 121:e1357‐1362. Durant JL, Beelen R, Eeftens M, Meliefste K, Cyrys J, Heinrich J, et al. 2014. Comparison of ambient airborne pm(2).(5), pm(2).(5) absorbance and nitrogen dioxide ratios measured in 1999 and 2009 in three areas in europe. The Science of the total environment 487:290‐298. Eneroth K, Johansson C, Bellander T. 2006. Comparison between measurements and calculations based on dispersion modelling (expose). 2006:12.Stockholm Environment and Health Protection Administration. Fell DB, Dodds L, King WD. 2004. Residential mobility during pregnancy. Paediatric and perinatal epidemiology 18:408‐414. Gardener H, Spiegelman D, Buka SL. 2011. Perinatal and neonatal risk factors for autism: A comprehensive meta‐analysis. Pediatrics 128:344‐355. Gong T, Almqvist C, Bolte S, Lichtenstein P, Anckarsater H, Lind T, et al. 2014. Exposure to air pollution from traffic and neurodevelopmental disorders in swedish twins. Twin Res Hum Genet 17:553‐562.
Environ Health Perspect DOI: 10.1289/EHP118
17
Gruzieva O, Bellander T, Eneroth K, Kull I, Melen E, Nordling E, et al. 2012. Traffic‐related air pollution and development of allergic sensitization in children during the first 8 years of life. J Allergy Clin Immunol 129:240‐246. Guxens M, Ghassabian A, Gong T, Garcia‐Esteban R, Porta D, Giorgis‐Allemand L, et al. 2016. Air pollution exposure during pregnancy and childhood autistic traits in four european population‐based cohort studies: The escape project. Environ Health Perspect 124:133‐140. Hajat A, Diez‐Roux AV, Adar SD, Auchincloss AH, Lovasi GS, O'Neill MS, et al. 2013. Air pollution and individual and neighborhood socioeconomic status: Evidence from the multi‐ethnic study of atherosclerosis (mesa). Environ Health Perspect 121:1325‐1333. Hoekstra RA, Happe F, Baron‐Cohen S, Ronald A. 2009. Association between extreme autistic traits and intellectual disability: Insights from a general population twin study. The British journal of psychiatry : the journal of mental science 195:531‐536. Hoekstra RA, Happe F, Baron‐Cohen S, Ronald A. 2010. Limited genetic covariance between autistic traits and intelligence: Findings from a longitudinal twin study. American journal of medical genetics Part B, Neuropsychiatric genetics : the official publication of the International Society of Psychiatric Genetics 153b:994‐1007. Hultman CM, Sparen P, Cnattingius S. 2002. Perinatal risk factors for infantile autism. Epidemiology (Cambridge, Mass) 13:417‐423. Idring S, Rai D, Dal H, Dalman C, Sturm H, Zander E, et al. 2012. Autism spectrum disorders in the stockholm youth cohort: Design, prevalence and validity. PLoS One 7:e41280. Idring S, Lundberg M, Sturm H, Dalman C, Gumpert C, Rai D, et al. 2015. Changes in prevalence of autism spectrum disorders in 2001–2011: Findings from the stockholm youth cohort. Journal of autism and developmental disorders 45:1766‐1773. Johansson C, Andersson C, Bergström R, Krecl P. 2008. Exposure to particles due to local and non‐local sources in stockholm ‐ estimates based on modelling and measurements 1997 ‐ 2006. 175.Department of Applied Environmental Science, Stockholm University, Stockholm Sweden. Jung CR, Lin YT, Hwang BF. 2013. Air pollution and newly diagnostic autism spectrum disorders: A population‐based cohort study in taiwan. PLoS One 8:e75510. Kalkbrenner AE, Daniels JL, Chen JC, Poole C, Emch M, Morrissey J. 2010. Perinatal exposure to hazardous air pollutants and autism spectrum disorders at age 8. Epidemiology 21:631‐641. Kalkbrenner AE, Windham GC, Serre ML, Akita Y, Wang X, Hoffman K, et al. 2015. Particulate matter exposure, prenatal and postnatal windows of susceptibility, and autism spectrum disorders. Epidemiology 26:30‐42. Lauritsen MB, Pedersen CB, Mortensen PB. 2004. The incidence and prevalence of pervasive developmental disorders: A danish population‐based study. Psychological medicine 34:1339‐1346. Lee BK, Magnusson C, Gardner RM, Blomstrom A, Newschaffer CJ, Burstyn I, et al. 2015. Maternal hospitalization with infection during pregnancy and risk of autism spectrum disorders. Brain Behav Immun 44:100‐105. Lichtenstein P, Carlstrom E, Rastam M, Gillberg C, Anckarsater H. 2010. The genetics of autism spectrum disorders and related neuropsychiatric disorders in childhood. The American journal of psychiatry 167:1357‐1363. Ludvigsson JF, Otterblad‐Olausson P, Pettersson BU, Ekbom A. 2009. The swedish personal identity number: Possibilities and pitfalls in healthcare and medical research. European journal of epidemiology 24:659‐667. Lundstrom S, Reichenberg A, Melke J, Rastam M, Kerekes N, Lichtenstein P, et al. 2015. Autism spectrum disorders and coexisting disorders in a nationwide swedish twin study. Journal of child psychology and psychiatry, and allied disciplines 56:702‐710. Magnusson C, Rai D, Goodman A, Lundberg M, Idring S, Svensson A, et al. 2012. Migration and autism spectrum disorder: Population‐based study. Br J Psychiatry 201:109‐115. Melen E, Nyberg F, Lindgren CM, Berglind N, Zucchelli M, Nordling E, et al. 2008. Interactions between glutathione s‐transferase p1, tumor necrosis factor, and traffic‐related air pollution for development of childhood allergic disease. Environmental health perspectives 116:1077‐1084.
Environ Health Perspect DOI: 10.1289/EHP118
18
Miller A, Siffel C, Correa A. 2010. Residential mobility during pregnancy: Patterns and correlates. Matern Child Health J 14:625‐634. Nassar N, Dixon G, Bourke J, Bower C, Glasson E, de Klerk N, et al. 2009. Autism spectrum disorders in young children: Effect of changes in diagnostic practices. International journal of epidemiology 38:1245‐1254. Nordling E, Berglind N, Melen E, Emenius G, Hallberg J, Nyberg F, et al. 2008. Traffic‐related air pollution and childhood respiratory symptoms, function and allergies. Epidemiology (Cambridge, Mass) 19:401‐408. Palmer RF, Blanchard S, Wood R. 2009. Proximity to point sources of environmental mercury release as a predictor of autism prevalence. Health Place 15:18‐24. Rai D, Lewis G, Lundberg M, Araya R, Svensson A, Dalman C, et al. 2012. Parental socioeconomic status and risk of offspring autism spectrum disorders in a swedish population‐based study. J Am Acad Child Adolesc Psychiatry 51:467‐476 e466. Rai D, Lee BK, Dalman C, Golding J, Lewis G, Magnusson C. 2013. Parental depression, maternal antidepressant use during pregnancy, and risk of autism spectrum disorders: Population based case‐control study. BMJ 346:f2059. Raz R, Roberts AL, Lyall K, Hart JE, Just AC, Laden F, et al. 2014. Autism spectrum disorder and particulate matter air pollution before, during, and after pregnancy: A nested case‐control analysis within the nurses' health study ii cohort. Environmental health perspectives. Ritvo ER, Jorde LB, Mason‐Brothers A, Freeman BJ, Pingree C, Jones MB, et al. 1989. The ucla‐university of utah epidemiologic survey of autism: Recurrence risk estimates and genetic counseling. The American journal of psychiatry 146:1032‐1036. Roberts AL, Lyall K, Hart JE, Laden F, Just AC, Bobb JF, et al. 2013. Perinatal air pollutant exposures and autism spectrum disorder in the children of nurses' health study ii participants. Environmental health perspectives 121:978‐984. Roberts AL, Lyall K, Rich‐Edwards JW, Ascherio A, Weisskopf MG. 2013. Maternal exposure to childhood abuse is associated with elevated risk of autism. JAMA psychiatry 70:508‐515. Ronald A, Larsson H, Anckarsater H, Lichtenstein P. 2011. A twin study of autism symptoms in sweden. Molecular psychiatry 16:1039‐1047. Sandin S, Lichtenstein P, Kuja‐Halkola R, Larsson H, Hultman CM, Reichenberg A. 2014. The familial risk of autism. JAMA 311:1770‐1777. Sariaslan A, Långström N, D’Onofrio B, Hallqvist J, Franck J, Lichtenstein P. 2013. The impact of neighbourhood deprivation on adolescent violent criminality and substance misuse: A longitudinal, quasi‐experimental study of the total swedish population. International Journal of Epidemiology 42:1057‐1066. Schultz ES, Gruzieva O, Bellander T, Bottai M, Hallberg J, Kull I, et al. 2012. Traffic‐related air pollution and lung function in children at 8 years of age: A birth cohort study. Am J Respir Crit Care Med 186:1286‐1291. The Swedish National Board of Health and Welfare. 2003. The swedish medical birth register‐a summary of content and quality. 2003‐112‐3. Thomas P, Zahorodny W, Peng B, Kim S, Jani N, Halperin W, et al. 2012. The association of autism diagnosis with socioeconomic status. Autism 16:201‐213. Tulloch AD, Fearon P, Fahy T, David A. 2010. Residential mobility among individuals with severe mental illness: Cohort study of uk700 participants. Social psychiatry and psychiatric epidemiology 45:767‐777. Windham GC, Zhang L, Gunier R, Croen LA, Grether JK. 2006. Autism spectrum disorders in relation to distribution of hazardous air pollutants in the san francisco bay area. Environ Health Perspect 114:1438‐1444. Volk HE, Hertz‐Picciotto I, Delwiche L, Lurmann F, McConnell R. 2011. Residential proximity to freeways and autism in the charge study. Environmental health perspectives 119:873‐877. Volk HE, Lurmann F, Penfold B, Hertz‐Picciotto I, McConnell R. 2013. Traffic‐related air pollution, particulate matter, and autism. JAMA Psychiatry 70:71‐77.
Environ Health Perspect DOI: 10.1289/EHP118
19
Table 1. Characteristics of 5,136 ASD and 18,237 randomly-selected control subjects born in Stockholm, Sweden between 1993 and 2007. Cases (n=5,136) Controls (n=18,237) p Child characteristics Age at end of follow-up 13.0±4.1 11.5±4.5 <0.0001 Gender
Male 3,760 (73.2) 9,408 (51.6) <0.0001 Female 1,376 (26.8) 8,829 (48.4)
Birth year 1993-1995 1,321 (25.7) 3,527 (19.3) <0.0001 1996-1998 1,184 (23.1) 3,050 (16.7) 1999-2001 1,088 (21.2) 3,200 (17.5) 2002-2004 920 (17.9) 4,014 (22.0) 2005-2007 623 (12.1) 4,446 (24.4)
Sib order First child 2,402 (46.8) 7,785 (42.7) <0.0001 Not first child 2,734 (53.2) 10,452 (57.3)
Birth weight (grams) <2,500 259 (5.0) 487 (2.6) <0.0001 2,500-3,000 576 (11.2) 1,777 (9.7) 3,001-3,500 1,507 (29.3) 5,845 (32.1) 3,501-4,000 1,742 (33.9) 6,561 (36.0) >4000 1,015 (19.8) 3,488 (19.1)
Congenital malformations No 4,851 (94.7) 16,565 (90.8) <0.0001Yes 274 (5.3) 530 (2.9)
Intellectual disability No 4,223 (82.2) 18,119 (99,4) <0.0001Yes 913 (17.8) 118 (0.6)
Family characteristics Maternal age at child birth 30.5±5.3 30.9±4.9 <0.0001 Paternal age at child birth 33.3±6.6 33.6±6.1 <0.0001 Season of conception
Spring (Mar, Apr, May) 1,300 (25.3) 5,008 (27.5) 0.0042 Summer (Jun, Jul, Aug) 1,340 (26.1) 4,784 (26.2) Autumn (Sep, Oct, Nov) 1,288 (25.1) 4,230 (23.2) Winter (Dec, Jan, Feb) 1,208 (23.5) 4,215 (23.1)
Residential mobility during pregnancy 0.003 Non-movers 4,025 (78.6) 14,646 (80.5) Movers 1,095 (21.4) 3,551 (19.5)
Parents’ birth countries Both from Sweden 3,512 (68.4) 12,796 (70.2) 0.0013
One from other countries 889 (17.3) 2,780 (15.2) Both from other countries 713 (13.9) 2,610 (14.1)
Disposable income within household at child birth (quintiles) Lowest 586 (11.4) 1,860 (10.2) <0.0001 Lower middle 1,193 (23.2) 3,509 (19.2) Middle 1,266 (24.7) 4,229 (23.2) Upper middle 1,142 (22.2) 4,187 (23.0) Highest 949 (18.5) 4,452 (24.4)
Neighborhood deprivation index at child birth 0.15±1.12 -0.02±1.12 Low (-7.78 to -0.55) 1,463 (28.5) 6,249 (34.3) Medium (-0.55 to 0.19) 1,643 (32.0) 6,301 (34.6) <0.0001 High (0.19 to 4.06) 2,030 (39.5) 5,687 (31.2)
Mother’s education at child birth Low (≤9 years) 808 (15.7) 2,230 (12.2) <0.0001Medium (10-12 years) 2,394 (46.6) 7,879 (43.2) High (>12 years) 1,921 (37.4) 8,076 (44.3)
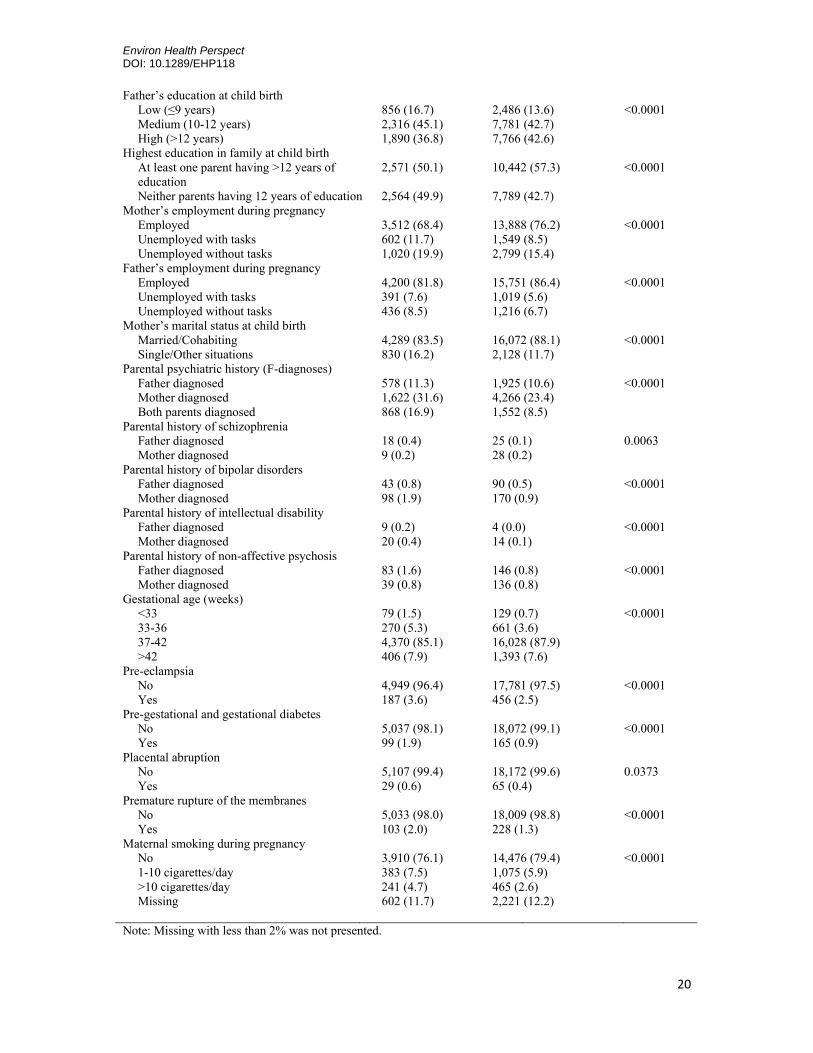
Environ Health Perspect DOI: 10.1289/EHP118
20
Father’s education at child birth Low (≤9 years) 856 (16.7) 2,486 (13.6) <0.0001 Medium (10-12 years) 2,316 (45.1) 7,781 (42.7) High (>12 years) 1,890 (36.8) 7,766 (42.6)
Highest education in family at child birth At least one parent having >12 years of education
2,571 (50.1) 10,442 (57.3) <0.0001
Neither parents having 12 years of education 2,564 (49.9) 7,789 (42.7) Mother’s employment during pregnancy
Employed 3,512 (68.4) 13,888 (76.2) <0.0001 Unemployed with tasks 602 (11.7) 1,549 (8.5) Unemployed without tasks 1,020 (19.9) 2,799 (15.4)
Father’s employment during pregnancy Employed 4,200 (81.8) 15,751 (86.4) <0.0001 Unemployed with tasks 391 (7.6) 1,019 (5.6) Unemployed without tasks 436 (8.5) 1,216 (6.7)
Mother’s marital status at child birth Married/Cohabiting 4,289 (83.5) 16,072 (88.1) <0.0001 Single/Other situations 830 (16.2) 2,128 (11.7)
Parental psychiatric history (F-diagnoses) Father diagnosed 578 (11.3) 1,925 (10.6) <0.0001Mother diagnosed 1,622 (31.6) 4,266 (23.4) Both parents diagnosed 868 (16.9) 1,552 (8.5)
Parental history of schizophrenia Father diagnosed 18 (0.4) 25 (0.1) 0.0063 Mother diagnosed 9 (0.2) 28 (0.2)
Parental history of bipolar disorders Father diagnosed 43 (0.8) 90 (0.5) <0.0001 Mother diagnosed 98 (1.9) 170 (0.9)
Parental history of intellectual disability Father diagnosed 9 (0.2) 4 (0.0) <0.0001 Mother diagnosed 20 (0.4) 14 (0.1)
Parental history of non-affective psychosis Father diagnosed 83 (1.6) 146 (0.8) <0.0001 Mother diagnosed 39 (0.8) 136 (0.8)
Gestational age (weeks) <33 79 (1.5) 129 (0.7) <0.0001 33-36 270 (5.3) 661 (3.6) 37-42 4,370 (85.1) 16,028 (87.9) >42 406 (7.9) 1,393 (7.6)
Pre-eclampsia No 4,949 (96.4) 17,781 (97.5) <0.0001 Yes 187 (3.6) 456 (2.5)
Pre-gestational and gestational diabetes No 5,037 (98.1) 18,072 (99.1) <0.0001 Yes 99 (1.9) 165 (0.9)
Placental abruption No 5,107 (99.4) 18,172 (99.6) 0.0373 Yes 29 (0.6) 65 (0.4)
Premature rupture of the membranes No 5,033 (98.0) 18,009 (98.8) <0.0001 Yes 103 (2.0) 228 (1.3)
Maternal smoking during pregnancy No 3,910 (76.1) 14,476 (79.4) <0.0001 1-10 cigarettes/day 383 (7.5) 1,075 (5.9) >10 cigarettes/day 241 (4.7) 465 (2.6) Missing 602 (11.7) 2,221 (12.2)
Note: Missing with less than 2% was not presented.
Environ Health Perspect DOI: 10.1289/EHP118
21
Table 2. Risk of ASD overall by quartiles of modeled pollutants’ levels at different time windows among 5,136 ASD cases and 18,237 controls born in Stockholm, Sweden between 1993 and 2007. Time windows and pollutants
no. of cases/controls Models A†
OR (95% CI) Models B‡
OR (95% CI) Models Cǁ
OR (95% CI) Entire pregnancy 5,112/18,192
NOx 2nd quartile 1,340/4,486 1.01 (0.91, 1.13) 0.98 (0.88, 1.10) 0.96 (0.85, 1.07) 3rd quartile 1,285/4,541 0.94 (0.83, 1.06) 0.91 (0.80, 1.03) 0.88 (0.78, 1.00) 4th quartile 1,279/4,547 0.94 (0.82, 1.09) 0.91 (0.78, 1.05) 0.89 (0.77, 1.03)
PM10 2nd quartile 1,399/4,427 1.03 (0.92, 1.14) 1.01 (0.91, 1.12) 0.98 (0.88, 1.09) 3rd quartile 1,247/4,579 0.92 (0.81, 1.04) 0.90 (0.79, 1.02) 0.87 (0.77, 0.99) 4th quartile 1,140/4,686 0.93 (0.81, 1.06) 0.88 (0.77, 1.02) 0.86 (0.75, 0.99)
First year of life 5,121/18,225 NOx
2nd quartile 1,321/4,515 1.05 (0.94, 1.18) 1.02 (0.91, 1.15) 0.98 (0.87, 1.10) 3rd quartile 1,328/4,509 1.04 (0.91, 1.19) 1.00 (0.87, 1.14) 0.95 (0.83, 1.09) 4th quartile 1,297/4,539 1.06 (0.90, 1.25) 1.00 (0.85, 1.18) 0.96 (0.81, 1.13)
PM10 2nd quartile 1,398/4,439 1.10 (0.99, 1.23) 1.08 (0.97, 1.21) 1.03 (0.92, 1.16) 3rd quartile 1,280/4,557 1.03 (0.90, 1.17) 0.98 (0.86, 1.12) 0.93 (0.82, 1.07) 4th quartile 1,160/4,676 1.05 (0.90, 1.22) 0.97 (0.83, 1.13) 0.92 (0.78, 1.07)
† Models were conditioned on calendar year of birth and municipality of birth, as well as adjusted for gender, birth month.
‡ Models were conditioned on calendar year of birth and municipality of birth, as well as adjusted for gender, birth month, birth order, parents’ birth countries, mother's marital status, mother's education, father's education, mother's employment, father's employment, and disposable income within household. ǁ Models were conditioned on calendar year of birth and municipality of birth, as well as adjusted for gender, birth month, birth order, parents’ birth countries, mother's marital status, mother's education, father's education, mother's employment, father's employment, disposable income within household, and neighborhood deprivation.
Environ Health Perspect DOI: 10.1289/EHP118
22
Figure legends
Figure 1 Box plot describing the distribution of NOx (white) and PM10 (grey) concentrations
(µg/m3) from local traffic in study population during mother’s pregnancy and first year after
child birth. The box and whiskers denotes the 5th, 25th, 50th, 75th, 95th percentile and outlier
values of pollutants’ distributions.
Figure 2 Odds ratios and 95% confidence intervals for ASD overall, ASD with or without ID
by residential address-based NOx (per 10 µg/m3 increase) and PM10 (per 20 µg/m3 increase)
levels during mother’s pregnancy and child’s first year of life. All models were conditioned
on calendar year of birth and municipality of birth, as well as adjusted for gender, birth month,
sib order, maternal age, paternal age, mother's marital status, parents' birth countries, mother's
education, father's education, mother's employment, father's employment, disposable income
within household, and neighborhood deprivation.
Figure 3 Odds ratios and 95% confidence intervals ASD overall by residential address-based
NOx (per 10 µg/m3 increase) and PM10 (per 20 µg/m3 increase) levels during mother’s
pregnancy and child’s first year of life in stratified samples. All models were conditioned on
calendar year of birth and municipality of birth, as well as adjusted for gender, birth month,
sib order, maternal age, paternal age, mother's marital status, parents' birth countries, mother's
education, father's education, mother's employment, father's employment, disposable income
within household, and neighborhood deprivation as covariates.
Environ Health Perspect DOI: 10.1289/EHP118
23
Figure 1.
Environ Health Perspect DOI: 10.1289/EHP118
24
Figure 2.
1.02 (0.94, 1.10)
1.05 (0.95, 1.14)
1.06 (0.89, 1.26)
1.08 (0.88, 1.32)
1.01 (0.93, 1.10)
1.03 (0.93, 1.14)
Mother’s pregnancy
Child’s first year of life
Mother’s pregnancy
Child’s first year of life
Mother’s pregnancy
Child’s first year of life
ASD overall
ASD with ID
ASD without ID
OR(95% CI)
0.5 0.6 0.7 0.8 0.9 1.0 1.2 1.4 1.6 1.8 2.0
A.NOx levels
1.00 (0.86, 1.15)
1.03 (0.87, 1.21)
1.03 (0.74, 1.42)
1.04 (0.73, 1.49)
0.98 (0.84, 1.15)
1.02 (0.86, 1.22)
Mother’s pregnancy
Child’s first year of life
Mother’s pregnancy
Child’s first year of life
Mother’s pregnancy
Child’s first year of life
ASD overall
ASD with ID
ASD without ID
OR(95% CI)
0.5 0.6 0.7 0.8 0.9 1.0 1.2 1.4 1.6 1.8 2.0
B.PM10 levels
Crude ORs Adjusted ORs Adjusted 95% CIs
Environ Health Perspect DOI: 10.1289/EHP118
25
Figure 3.
p=0.65
p=0.99
p=0.16
p=0.09
p=0.02
p=0.0009
p=0.13
p=0.24
p=0.24
p=0.20
p=0.0009
p=0.002
Note: The p-value was presented based on the Wald test for the indicated interaction term.