eight new milky way companions discovered in first-year...
TRANSCRIPT

Eight new Milky Way companions discovered in firstyear Dark Energy Survey Data
Article (Published Version)
http://sro.sussex.ac.uk
Romer, Kathy and The DES Collaboration, et al (2015) Eight new Milky Way companions discovered in first-year Dark Energy Survey Data. Astrophysical Journal, 807 (1). ISSN 0004-637X
This version is available from Sussex Research Online: http://sro.sussex.ac.uk/id/eprint/61756/
This document is made available in accordance with publisher policies and may differ from the published version or from the version of record. If you wish to cite this item you are advised to consult the publisher’s version. Please see the URL above for details on accessing the published version.
Copyright and reuse: Sussex Research Online is a digital repository of the research output of the University.
Copyright and all moral rights to the version of the paper presented here belong to the individual author(s) and/or other copyright owners. To the extent reasonable and practicable, the material made available in SRO has been checked for eligibility before being made available.
Copies of full text items generally can be reproduced, displayed or performed and given to third parties in any format or medium for personal research or study, educational, or not-for-profit purposes without prior permission or charge, provided that the authors, title and full bibliographic details are credited, a hyperlink and/or URL is given for the original metadata page and the content is not changed in any way.
EIGHT NEW MILKY WAY COMPANIONS DISCOVERED IN FIRST-YEAR DARK ENERGY SURVEY DATA
K. Bechtol1, A. Drlica-Wagner
2, E. Balbinot
3,4, A. Pieres
4,5, J. D. Simon
6, B. Yanny
2, B. Santiago
4,5, R. H. Wechsler
7,8,9,
J. Frieman1,2, A. R. Walker
10, P. Williams
1, E. Rozo
9,11, E. S. Rykoff
9, A. Queiroz
4,5, E. Luque
4,5, A. Benoit-Lévy
12,
D. Tucker2, I. Sevilla
13,14, R. A. Gruendl
13,15, L. N. da Costa
4,16, A. Fausti Neto
4, M. A. G. Maia
4,16, T. Abbott
10,
S. Allam2,17
, R. Armstrong18, A. H. Bauer
19, G. M. Bernstein
18, R. A. Bernstein
6, E. Bertin
20,21, D. Brooks
12,
E. Buckley-Geer2, D. L. Burke
9, A. Carnero Rosell
4,16, F. J. Castander
19, R. Covarrubias
15, C. B. D’Andrea
22,
D. L. DePoy23, S. Desai
24,25, H. T. Diehl
2, T. F. Eifler
18,26, J. Estrada
2, A. E. Evrard
27, E. Fernandez
28,29, D. A. Finley
2,
B. Flaugher2, E. Gaztanaga
19, D. Gerdes
27, L. Girardi
16, M. Gladders
1,28, D. Gruen
30,31, G. Gutierrez
2, J. Hao
2,
K. Honscheid32,33
, B. Jain18, D. James
10, S. Kent
2, R. Kron
1, K. Kuehn
34,35, N. Kuropatkin
2, O. Lahav
12, T. S. Li
23, H. Lin
2,
M. Makler36, M. March
18, J. Marshall
23, P. Martini
33,37, K. W. Merritt
2, C. Miller
27,38, R. Miquel
29,39, J. Mohr
24,
E. Neilsen2, R. Nichol
22, B. Nord
2, R. Ogando
4,16, J. Peoples
2, D. Petravick
15, A. A. Plazas
26,40, A. K. Romer
41,
A. Roodman7,10
, M. Sako18, E. Sanchez
14, V. Scarpine
2, M. Schubnell
27, R. C. Smith
10, M. Soares-Santos
2, F. Sobreira
2,4,
E. Suchyta32,33
, M. E. C. Swanson15, G. Tarle
27, J. Thaler
42, D. Thomas
22, W. Wester
2, and J. Zuntz
43
(The DES Collaboration)1 Kavli Institute for Cosmological Physics, University of Chicago, Chicago, IL 60637, USA; [email protected], [email protected]
2 Fermi National Accelerator Laboratory, P.O. Box 500, Batavia, IL 60510, USA3 Department of Physics, University of Surrey, Guildford GU2 7XH, UK
4 Laboratório Interinstitucional de e-Astronomia—LIneA, Rua Gal. José Cristino 77, Rio de Janeiro, RJ—20921-400, Brazil5 Instituto de Física, UFRGS, Caixa Postal 15051, Porto Alegre, RS—91501-970, Brazil
6 Carnegie Observatories, 813 Santa Barbara St., Pasadena, CA 91101, USA7 Kavli Institute for Particle Astrophysics & Cosmology, P.O. Box 2450, Stanford University, Stanford, CA 94305, USA
8 Department of Physics, Stanford University, 382 Via Pueblo Mall, Stanford, CA 94305, USA9 SLAC National Accelerator Laboratory, Menlo Park, CA 94025, USA
10 Cerro Tololo Inter-American Observatory, National Optical Astronomy Observatory, Casilla 603, La Serena, Chile11 University of Arizona, Department of Physics, 1118 E. Fourth St., Tucson, AZ 85721, USA
12 Department of Physics & Astronomy, University College London, Gower Street, London, WC1E 6BT, UK13 Department of Astronomy, University of Illinois, 1002 W. Green Street, Urbana, IL 61801, USA
14 Centro de Investigaciones Energéticas, Medioambientales y Tecnológicas (CIEMAT), Madrid, Spain15 National Center for Supercomputing Applications, 1205 West Clark St., Urbana, IL 61801, USA
16 Observatório Nacional, Rua Gal. José Cristino 77, Rio de Janeiro, RJ—20921-400, Brazil17 Space Telescope Science Institute, 3700 San Martin Drive, Baltimore, MD 21218, USA
18 Department of Physics and Astronomy, University of Pennsylvania, Philadelphia, PA 19104, USA19 Institut de Ciències de l’Espai, IEEC-CSIC, Campus UAB, Facultat de Ciències, Torre C5 par-2, E-08193 Bellaterra, Barcelona, Spain
20 Sorbonne Universités, UPMC Univ Paris 06, UMR 7095, Institut d’Astrophysique de Paris, F-75014, Paris, France21 CNRS, UMR 7095, Institut d’Astrophysique de Paris, F-75014, Paris, France
22 Institute of Cosmology & Gravitation, University of Portsmouth, Portsmouth, PO1 3FX, UK23 George P. and Cynthia Woods Mitchell Institute for Fundamental Physics and Astronomy, and Department of Physics and Astronomy,
Texas A&M University, College Station, TX 77843, USA24 Department of Physics, Ludwig-Maximilians-Universitat, Scheinerstr.1, D-81679 Munich, Germany
25 Excellence Cluster universe, Boltzmannstr.2, D-85748 Garching, Germany26 Jet Propulsion Laboratory, California Institute of Technology, 4800 Oak Grove Dr., Pasadena, CA 91109, USA
27 Department of Physics, University of Michigan, Ann Arbor, MI48109, USA28 Department of Astronomy and Astrophysics, University of Chicago, Chicago IL 60637, USA
29 Institució Catalana de Recerca i Estudis Avançats, E-08010, Barcelona, Spain30 Max Planck Institute for Extraterrestrial Physics, Giessenbachstrasse, D-85748 Garching, Germany
31 University Observatory Munich, Scheinerstrasse 1, D-81679 Munich, Germany32 Department of Physics, The Ohio State University, Columbus, OH 43210, USA
33 Center for Cosmology and Astro-Particle Physics, The Ohio State University, Columbus, OH 43210, USA34 Australian Astronomical Observatory, North Ryde, NSW 2113, Australia
35 Argonne National Laboratory, 9700 S. Cass Avenue, Lemont IL 60639 USA36 ICRA, Centro Brasileiro de Pesquisas Físicas, Rua Dr. Xavier Sigaud 150, CEP 22290-180, Rio de Janeiro, RJ, Brazil
37 Department of Astronomy, The Ohio State University, Columbus, OH 43210, USA38 Department of Astronomy, University of Michigan, Ann Arbor, MI, 48109, USA
39 Institut de Física d’Altes Energies, Universitat Autònoma de Barcelona, E-08193 Bellaterra, Barcelona, Spain40 Brookhaven National Laboratory, Bldg 510, Upton, NY 11973, USA
41 Astronomy Centre, University of Sussex, Falmer, Brighton, BN1 9QH, UK42 Department of Physics, University of Illinois, 1110 W. Green St., Urbana, IL 61801, USA
43 Jodrell Bank Center for Astrophysics, School of Physics and Astronomy, University of Manchester,Oxford Road, Manchester, M13 9PL, UK
Received 2015 March 9; accepted 2015 April 30; published 2015 June 30
ABSTRACT
We report the discovery of eight new Milky Way companions in ~1800 deg2 of optical imaging data collectedduring the first year of the Dark Energy Survey (DES). Each system is identified as a statistically significant over-density of individual stars consistent with the expected isochrone and luminosity function of an old and metal-poorstellar population. The objects span a wide range of absolute magnitudes (MV from-2.2 to-7.4 mag), physical
The Astrophysical Journal, 807:50 (16pp), 2015 July 1 doi:10.1088/0004-637X/807/1/50© 2015. The American Astronomical Society. All rights reserved.
1

sizes ( -10 170 pc), and heliocentric distances ( -30 330 kpc). Based on the low surface brightnesses, large physicalsizes, and/or large Galactocentric distances of these objects, several are likely to be new ultra-faint satellite galaxiesof the Milky Way and/or Magellanic Clouds. We introduce a likelihood-based algorithm to search for andcharacterize stellar over-densities, as well as identify stars with high satellite membership probabilities. We alsopresent completeness estimates for detecting ultra-faint galaxies of varying luminosities, sizes, and heliocentricdistances in the first-year DES data.
Key words: galaxies: dwarf – Local Group
1. INTRODUCTION
Milky Way satellite galaxies provide a unique opportunity tostudy the low-luminosity threshold of galaxy formation and tobetter connect the baryonic component of galaxies with thedark matter halos in which they reside. Prior to the SloanDigital Sky Survey (SDSS), the faintest known galaxies hadluminosities of~ L105 , and it was clear that the population of12 “classical” Milky Way satellites was orders of magnitudesmaller than would be naively expected in the cold dark matterparadigm (Klypin et al. 1999; Moore et al. 1999). Over the pastdecade, systematic searches of wide-field SDSS imaging haverevealed 15 additional arcminute-scale, resolved stellar over-densities (Willman et al. 2005a, 2005b; Belokurovet al. 2006, 2007, 2008, 2009, 2010; Grillmair 2006, 2009;Sakamoto & Hasegawa 2006; Zucker et al. 2006a, 2006b;Irwin et al. 2007; Walsh et al. 2007) that have been eitherphotometrically classified or spectroscopically confirmed asgravitationally bound “ultra-faint” galaxies (Kleyna et al. 2005;Muñoz et al. 2006; Martin et al. 2007; Simon & Geha 2007;Adén et al. 2009; Belokurov et al. 2009; Carlin et al. 2009;Geha et al. 2009; Koch et al. 2009; Walker et al. 2009;Koposov et al. 2011; Simon et al. 2011; Willman et al. 2011;Kirby et al. 2013). These ultra-faint galaxies are the smallest,least luminous, least chemically enriched, and most dark matterdominated galaxies in the known universe.
Since all known ultra-faint Milky Way satellite galaxies werediscovered in SDSS, the census of these objects is almostcertainly incomplete due to the partial sky coverage(~14, 000 deg2) and photometric magnitude limit (95%complete to ~r 22 mag) of that survey. While only 27 MilkyWay satellite galaxies are currently known, extrapolations ofthe luminosity function suggest that hundreds of luminousMilky Way satellites remain to be found in current and near-future wide-field optical imaging surveys (Tollerud et al. 2008;Hargis et al. 2014; He et al. 2015).
The Dark Energy Survey (DES) is in the process of imaging5000 deg2 of the southern Galactic cap in five photometricbands (Abbott et al. 2005; Diehl et al. 2014). The deepphotometry of DES ( ~r 24 mag) will enable the detection ofthe faintest known satellite galaxies out to~120 kpc (comparedto the SDSS limit of ~50 kpc), and more luminous satellitegalaxies out to the Milky Way virial radius (Rossettoet al. 2011). We have completed an initial search ofthe first year of DES data and report here on the eight mostsignificant dwarf galaxy candidates discovered therein(Table 1). Since the physical nature of these candidates cannotbe definitively determined with photometry alone, we refer tothem by their discovery coordinates. If these candidatesare later confirmed to be Local Group galaxies, theyshould be renamed after the constellation in which theyreside: DES J0335.6−5403 (Reticulum II), DES J0344.3−4331(Eridanus II), DES J2251.2−5836 (Tucana II), DES J0255.4
−5406 (Horologium I), DES J2108.8−5109 (Indus I),DES J0443.8−5017 (Pictor I), DES J2339.9−5424(Phoenix II), and DES J0222.7−5217 (Eridanus III). If anyare instead globular clusters, they would be known as DES 1through N. After the completion of this work, we learned thatDES J2108.8−5109 was previously identified by Kim et al.(2015) in data from the Stromlo Milky Way Satellite Surveyand designated as a likely star cluster, Kim 2.
2. DATA SET
DES is a wide-field optical imaging survey in the grizYbands performed with the Dark Energy Camera (DECam;Flaugher et al. 2010, 2015; Diehl 2012). The DECam focalplane comprises 74 CCDs: 62 2k × 4k CCDs dedicated toscience imaging and 12 2k × 2k CCDs for guiding, focus, andalignment. DECam is installed at the prime focus of the 4 mBlanco telescope at Cerro Tololo Inter-American Observatory.In this configuration, DECam has a hexagonal 2 ◦. 2-wide fieldof view and a central pixel scale of 0.263 arcseconds. The fullDES survey is scheduled for 525 nights distributed over5 years. Here, we consider data collected between 2013 August15 and 2014 February 9 during the first year of DES.The first internal annual release of DES data (Y1A1)
consists of ~12,000 science exposures processed by the DESdata management (DESDM) infrastructure (R. A. Gruendlet al. 2015, in preparation).44 Most of the Y1A1 footprint iscovered by 2–4 overlapping exposures, or “tilings,” in eachfilter. Single exposures in a tiling are 90 s in griz and 45 s in Y.Here, we rely on the g- and r-band images for photometry, anduse the i-band for star–galaxy separation.The DESDM image processing pipeline consists of image
detrending, astrometric calibration, nightly photometric cali-bration, global calibration, image coaddition, and object catalogcreation, as recently summarized in Balbinot et al. (2015). Werefer to Sevilla et al. (2011), Desai et al. (2012), and Mohret al. (2012) for a more detailed description of the DES single-epoch and coadd image processing. The SExtractortoolkitis used to create object catalogs from the processed andcoadded images (Bertin & Arnouts 1996; Bertin et al. 2011).The Y1A1 data release contains a catalog of ~131 millionunique objects detected in the coadd imaging which aredistributed over 1800 deg2. This area includes ~200 deg2
overlapping with the Stripe 82 region of SDSS, as well as acontiguous region of ~1600 deg2 overlapping the South PoleTelescope (SPT) footprint (Carlstrom et al. 2011). The DESimaging in the SPT region is unprecedented in depth. Figure 1shows the coverage of Y1A1 in Galactic coordinates.We selected stars from the Y1A1 coadd object catalog based
on the spread model_ quantity output by SExtractor (Desaiet al. 2012). To avoid issues arising from fitting the point-spread function (PSF) across variable-depth coadded images,
44 http://data.darkenergysurvey.org/aux/releasenotes/DESDMrelease.html
2
The Astrophysical Journal, 807:50 (16pp), 2015 July 1 Bechtol et al.

we utilized the weighted-average (wavg) of the spread model_measurements from the single-epoch exposures. Our stellarsample consists of well-measured objects with∣wavg_ <∣spread model i_ _ 0.003, <flags g r i_{ , , } 4, andmagerr <auto g r i_ _{ , , } 1. We also removed objects forwhich the mag psf_ and mag auto_ measurements differ bymore than 0.5 mag because this is indicative of poor objectcharacterization.
We estimated the stellar completeness on a statistical basisover the full Y1A1 footprint by creating a test sample of highstellar purity using a color-based selection of - >r i 1.7. Wethen applied the morphology-based star selection criteria abovethat uses imaging in only a single band to evaluate the stellarcompleteness for the test sample. This approach is unbiasedsince the two star selection criteria are orthogonal, and benefitsfrom a large statistical sample that is representative of the fullY1A1 data set. The stellar completeness was found to be>90%to ~g 22 mag and falls to ~50% by ~g 23 mag. We
validated this completeness estimate with matched spectro-scopic data in the overlap region between Y1A1 and SDSSStripe 82. Based on studies with the DAOPHOT45 softwarepackage optimized for photometry in crowded stellar fields, wedo not expect this stellar completeness to be reduced in thevicinity of DES satellite galaxy candidates relative to the Y1A1footprint at large.For point-like objects and a well-estimated PSF, the
SExtractor mag psf_ variables are expected to give thebest measurement of stellar fluxes. However, due to theaforementioned difficulties with PSF estimation on deepcoadded images, we chose instead to use the mag auto_measurements. The mag auto_ measurements are found to givea less biased estimate of flux when compared to a stellarcalibration sample from Pan-STARRS (Schlafly et al. 2012).Measured magnitudes are extinction corrected using the
Table 1Detection of New Satellite Galaxy Candidates in DES Y1A1
Name a2000 d2000 -m M Map Sig TS Scan TS Fit rh ϵ ϕ Spi
(deg) (deg) s( ) (deg) (deg)
DES J0335.6–5403 (Ret II) 53.92 −54.05 17.5 24.6 1466 1713 -+0.10 0.01
0.01-+0.6 0.2
0.1-+72 7
7 338.1
DES J0344.3–4331 (Eri II) 56.09 −43.53 22.6 23.0 322 512 -+0.03 0.01
0.01-+0.19 0.16
0.16-+90 30
30 96.9
DES J2251.2–5836 (Tuc II) 343.06 −58.57 18.8 6.4 129 167 -+0.12 0.03
0.03 L L 114.9
DES J0255.4–5406 (Hor I) 43.87 −54.11 19.7 8.2 55 81 -+0.04 0.02
0.05 L L 30.6
DES J2108.8–5109 (Ind I) 317.20 −51.16 19.2 5.5 L 75 -+0.010 0.002
0.002 L L 26.6
DES J0443.8–5017 (Pic I) 70.95 −50.28 20.5 7.1 L 63 -+0.02 0.01
0.07 L L 19.1
DES J2339.9–5424 (Phe II) 354.99 −54.41 19.9 5.1 L 61 -+0.02 0.01
0.01 L L 19.4
DES J0222.7–5217 (Eri III) 35.69 −52.28 19.9 5.4 L 57 -+0.007 0.003
0.005 L L 8.9
Note. Best-fit parameters from the maximum-likelihood fit assuming the composite isochrone described in Section 3.2. Uncertainties are calculated from the thehighest density interval containing 90% of the posterior distribution. “Map Sig” refers to detection significance of the candidate from the stellar density map searchmethod (Section 3.1). “TS Scan” refers to the significance (Equation (4)) from the likelihood scan using a Plummer model spatial kernel with half-light radius= ◦r 0. 1h (Section 3.2). “TS Fit” denotes the significance of the likelihood method using the set of best-fit parameters. Ellipticities and position angles are not quoted
for lower significance candidates where they are not well constrained by the data. For objects with significant ellipticity, the half-light radius is measured along theelliptical semimajor axis. Spi is the estimated number of satellite member stars with <g 23 in the stellar catalog.
Figure 1. Locations of 27 known Milky Way satellite galaxies (blue; McConnachie 2012a) and eight DES dwarf galaxy candidates (red) in Galactic coordinates(Mollweide projection). The coordinate grid shows the equatorial coordinate system with solid lines for the equator and zero meridian. The gray scale indicates thelogarithmic density of stars with <r 22 from SDSS and DES. The large contiguous region in the northern equatorial hemisphere shows the coverage of SDSS (Ahnet al. 2014). The full DES footprint is outlined in red, and is now partially filled in by a region of~1600 deg2 near to the Magellanic Clouds and a region of~200 deg2
overlapping with the SDSS Stripe 82 field along the celestial equator. Both fields were observed during the first year of DES and that compose the Y1A1 data set.
45 http://www.star.bris.ac.uk/~mbt/daophot/
3
The Astrophysical Journal, 807:50 (16pp), 2015 July 1 Bechtol et al.

-E B V( ) dust maps from Schlegel et al. (1998). The relativecalibration uncertainties are estimated via stellar-locus regres-sion (Kelly et al. 2014) and are found to be ~2% across thesurvey footprint. Uncertaities in the offsets between the DESphotometric system and the AB system are estimated to be~1%.
3. SEARCH METHODS
Ultra-faint galaxies are discovered as arcminute-scale over-densities of individually resolved stars. The Y1A1 stellar objectcatalog is of such quality and depth that numerous stellar over-densities are immediately apparent from a visual scan. Severalof these over-densities are not associated with any known starcluster, globular cluster, or satellite galaxy. To formalize theprocess of identifying new candidate satellite galaxies, weapplied both (1) a simple spatial binning algorithm to facilitateinspection of the stellar density field, and (2) a matched-filtermaximum-likelihood technique. These complementaryapproaches validated one another and the resultant list ofcandidates was vetted by both methods.
3.1. Stellar Density Maps
Several independent searches of the stellar density field wereconducted. One approach involved direct visual inspection ofcoadded images. Other searches used binned stellar densitymaps constructed from the coadd object catalogs. As anexample, we detail below how one of these maps was built andanalyzed.
We began by spatially binning the stellar catalog into equal-area pixels using the HEALPix scheme (Górski et al. 2005).46
We considered HEALPix pixel sizes of~ ◦0 . 06 (nside= 1024)and ~ ◦0 . 11 (nside= 512) to optimize sensitivity to satellitespossessing different angular sizes. Since the stellar density isgreatly enhanced in regions of the Y1A1 footprint near theLMC and Galactic plane, we further grouped the stars intolarger regions of ~13 deg2 (nside = 16) to estimate the localfield density of stars. We corrected the effective solid angle ofeach pixel using the survey coverage, as estimated by mangleas part of DESDM processing (Swanson et al. 2008).47 Severalconspicuous stellar over-densities were immediately apparentafter this simple spatial binning procedure.
We increase our sensitivity to ultra-faint satellite galaxies byfocusing our search on regions of color–magnitude spacepopulated by old, low-metallicity stellar populations (Koposovet al. 2008; Walsh et al. 2009). As a template, we used aPARSEC isochrone corresponding to a stellar population ofage 12 Gyr and metallicity =Z 0.0002 (Bressan et al. 2012).Sensitivity to satellites at varying distances was enhanced byconsidering 20 logarithmically spaced steps in heliocentricdistance ranging from 20 to 400 kpc (distance moduli
< - <M m16.5 23.0). For each step in distance, all starswithin 0.2 mag of the isochrone in magnitude–magnitude spacewere retained while those outside the isochrone template werediscarded. We then created a significance map for each~13 deg2 region by computing the Poisson likelihood offinding the observed number of stars in each map pixel given abackground level characterized by the local field density.
3.2. Matched-filter Maximum-likelihood Method
The simple approach described above is computationallyefficient and easily generalizable. However, a more sensitivesearch can be performed by simultaneously modeling thespatial and photometric distributions of stars and incorporatingdetailed characteristics of the survey (variable depth, photo-metric uncertainty, etc.). One way to incorporate this informa-tion is through a maximum-likelihood analysis (Fisher 1925;Edwards 1972). Likelihood-based analyses have found broadapplicability in studies of Milky Way satellites (e.g.,Dolphin 2002; Martin et al. 2008a). Here we extend themaximum-likelihood approach to a wide-area search for MilkyWay satellites. Similar strategies have been applied to createcatalogs of galaxy clusters over wide-field optical surveys (e.g.,Rykoff et al. 2014).Our maximum-likelihood search begins by assuming that the
stellar catalog in a small patch of sky represents a Poissonrealization of (1) a field contribution including Milky Wayforeground stars, mis-classified background galaxies, andimaging artifacts, and (2) a putative satellite galaxy. Theunbinned Poisson log-likelihood function is given by
ål= - + -( )f plog 1 , (1)i
i
where i indexes the objects in the stellar sample. The value pican be interpreted as the probability that star i is a member ofthe satellite, and is computed as
ll
º+
pu
u b. (2)i
i
i i
Here, u represents the signal probability density function(PDF) for the satellite galaxy and is normalized to unity overthe spatial and magnitude domain, ; specifically,
ò =u d 1all
. The corresponding background density functionfor the field population is denoted by b.We define the richness, λ, to be a normalization parameter
representing the total number of satellite member stars withmass > M0.1 . In Equation (1), òºf u d
obsrepresents the
fraction of satellite member stars that are within the observablespatial and magnitude domain of the survey, and lf denotes theexpected number of observable satellite member stars.48
Maximizing the likelihood with respect to the richness impliesl = åf pi i. This condition makes clear that the satellitemembership probability for each star in the catalog is a naturalproduct of the maximum-likelihood approach. These member-ship probabilities can be used to prioritize targeting whenplanning spectroscopic follow-up observations. Figure 2 high-lights the use of membership probabilities to visualize a low-surface-brightness satellite galaxy candidate.To characterize a candidate satellite galaxy, we explore the
likelihood of the data, , as a function of a set of input modelparameters, q. The signal PDF is assumed to be separable intotwo independent components,
q q q= ´( ) ( ) ( )u u u . (3)i s s i s c c i c, ,
46 http://healpix.sourceforge.net47 http://space.mit.edu/~molly/mangle/
48 Mangle maps of the survey coverage are used in the calculation of theobservable fraction at each position in the sky.
4
The Astrophysical Journal, 807:50 (16pp), 2015 July 1 Bechtol et al.

The first component, us, depends only on the spatial properties,while the second component, uc, depends only on thedistribution in color–magnitude space.
We modeled the spatial distribution of satellite member starswith an elliptical Plummer profile (Plummer 1911), followingthe elliptical coordinate prescription of Martin et al. (2008a).The Plummer profile is sufficient to describe the spatialdistribution of stars in known ultra-faint galaxies (Muñozet al. 2012b). The spatial data for catalog object i consist ofspatial coordinates, a d= { , }s i i i, , while the parametersof our elliptical Plummer profile are the centroid coordinates,half-light radius, ellipticity, and position angle, q =s
a d fr{ , , , , }0 0 h .We modeled the color–magnitude component of the signal
PDF with a set of representative isochrones for old, metal-poorstellar populations, specifically by taking a grid of isochronesfrom Bressan et al. (2012) spanning < <Z0.0001 0.001 and
t< <1 Gyr 13.5 Gyr. Our spectral data for star i consist of themagnitude and magnitude error in each of two filters, s s= g r{ , , , }c i i g i i r i, , , , while the model parameters arecomposed of the distance modulus, age, and metallicitydescribing the isochrone, q t= -M m Z{ , , }c . To calculatethe spectral signal PDF, we weight the isochrone by a Chabrier(2001) initial mass function (IMF) and densely sample inmagnitude–magnitude space. We then convolve the photometricmeasurement PDF of each star with the PDF of the weightedisochrone. The resulting distribution represents the predictedprobability of finding a star at a given position in magnitude–magnitude space given a model of the stellar system.
The background density function of the field population isempirically determined from a circular annulus surroundingeach satellite candidate ( < <◦ ◦r0 . 5 2 . 0). The inner radius ofthe annulus is chosen to be sufficiently large that the stellarpopulation of the candidate satellite does not bias the estimateof the field population. Stellar objects in the backgroundannulus are binned in color–magnitude space using a cloud-in-cells algorithm and are weighted by the inverse solid angle of
the annulus. The effective solid angle of the annulus iscorrected to account for regions that are masked or fall belowour imposed magnitude limit of <g 23 mag. The resultingtwo-dimensional histogram for the field population providesthe number density of stellar objects as a function of observedcolor and magnitude ( - -deg mag2 2). This empirical determina-tion of the background density incorporates contaminationfrom unresolved galaxies and imaging artifacts.The likelihood formalism above was applied to the Y1A1
data set via an automated analysis pipeline.49 For the searchphase of the algorithm, we used a radially symmetric Plummermodel with half-light radius = ◦r 0 . 1h as the spatial kernel, anda composite isochrone model consisting of four isochronesbracketing a range of ages, t = {12, 13.5 Gyr}, and metalli-cities, =Z {0.0001, 0.0002}, to bound a range of possiblestellar populations. We then tested for a putative satellitegalaxy at each location on a three-dimensional grid of skyposition (0.7 arcmin resolution; nside = 4096) and distancemodulus ( < - <M m16 24; -16 630 kpc).The statistical significance at each grid point can be
expressed as a Test Statistic (TS) based on the likelihood ratiobetween a hypothesis that includes a satellite galaxy versus afield-only hypothesis:
l l l= éëê
= - = ùûú( ) ( )TS 2 log ˆ log 0 . (4)
Here, l̂ is the value of the stellar richness that maximizes thelikelihood. In the asymptotic limit, the null-hypothesisdistribution of the TS will follow a c 22 distribution withone bounded degree of freedom (Chernoff 1954). We haveverified that the output distribution of our implementationagrees well with the theoretical expectation by testing onsimulations of the stellar field. In this case, the local statisticalsignificance of a given stellar over-density, expressed in
Figure 2. Left: false color gri coadd image of the ´◦ ◦0. 3 0. 3 region centered on DES J0335.6−5403. Right: stars in the same field of view with membershipprobability >p 0.01i are marked with colored circles. In this color map, red signifies high-confidence association with DES J0335.6−5403 and blue indicates lowermembership probability. The membership probabilities have been evaluated using Equation (2) for the best-fit model parameters listed in Table 1.
49 The Ultra-faint Galaxy Likelihood (UGALI) code; detailed methodologyand performance to be presented elsewhere.
5
The Astrophysical Journal, 807:50 (16pp), 2015 July 1 Bechtol et al.

Gaussian standard deviations, is approximately the square rootof the TS.
4. CANDIDATE SELECTION AND CHARACTERIZATION
The two search methods described in Section 3 each producesignificance maps of the full Y1A1 footprint, where peaks inthese maps represent the three-dimensional seed positions(a2000, d2000, -M m) of possible satellite galaxies. Seeds wereselected from the union of the search methods. Statisticalsignificance thresholds were set at s>5 for the stellar densitymap method and >TS 45 for the matched-filter maximum-likelihood method, yielding ~50 seeds. Most of these werediscarded as being attributed to steep gradients in the stellardensity field, numerical effects near the survey boundaries,imaging artifacts, and large nearby galaxies resolved intomultiple closely spaced catalog objects. For this reason, we didnot pursue investigation at lower significance thresholds.
The resulting seed list was compared against catalogs ofknown star clusters (Harris 1996, 2010 edition; Kharchenkoet al. 2013) and Milky Way satellite galaxies (McConnachie2012a) as well as catalogs of other astrophysical objects thatcan produce false positives, such as large nearby galaxies(Nilson 1973; Corwin 2004) or galaxy clusters (Rykoffet al. 2014). Associated seeds include the Reticulum globularcluster, the Phoenix dwarf galaxy, AM 1, NGC 1261,NGC 1291, NGC 1553, NGC 1851, NGC 7089, NGC 7424,ESO 121-SC 003, and ESO 201-SC 010.
We explored the multi-dimensional parameter space for eachunassociated seed using the emceemodule for Markov ChainMonte Carlo (MCMC; Foreman-Mackey et al. 2013),50 and thelikelihood function described in Section 3.2 with flat priors oneach of the input parameters. For each seed, we ran an MCMCchain with 100 walkers that each make 1000 steps including aburn-in stage of 50 steps. This is sufficient to sample the regionof parameter space near the maximum-likelihood estimate.Only seeds with well-constrained posterior distributions enterour candidate list of new Milky Way companions.
Table 1 presents the eight most significant stellar over-densities in the Y1A1 data set consistent with being previouslyunknown dwarf galaxies. When comparing the significancesobtained with the map-based and likelihood scan algorithms, itis worth noting that the two methods were applied assumingdifferent size scales for the target satellites, and that kernel
assumed for the likelihood scan ( = ◦r 0 . 1h ) is larger than themajority of candidates listed in Table 1. After fitting the spatialparameters of the candidates, all are detected with highsignificance using the likelihood-based method. The depen-dence of detection efficiency on assumed kernel size isdiscussed is Section 5.2.The physical characteristics of these objects, as determined
by the follow-up MCMC likelihood analysis, are summarizedin Table 2. The best-fit values and uncertainties are determinedfrom the peak of the posterior distribution and the 90% highestposterior density interval (Box & Tiao 1973). A significantcorrelation was observed between the age of the stellarisochrone and the heliocentric distance—a degeneracy thatmay be expected given the evolution of the main sequenceturnoff. For some DES candidates, the posterior distribution forthe distance is multi-modal. The distance estimates provided inTable 2 indicate the peaks in the posterior distribution.To compare with previously known Milky Way satellite
galaxies, we convert from DES g- and r-band magnitudes tovisual magnitudes using
= - - +
= - - +
= - - -
( )( )( )
g g g r
r r g r
V g g r
0.104 0.01 mag
0.102 0.02 mag
0.487 0.025 mag. (5)
DES SDSS SDSS SDSS
DES SDSS SDSS SDSS
DES DES DES
This transform from DES g and r magnitudes to V-bandmagnitudes was derived using an SDSS stellar calibrationsample and the equations from Jester et al. (2005). Theabsolute magnitude of each satellite is calculated using thesampling formalism of Martin et al. (2008a). For brightsatellites, this formalism yields a very similar estimate to theintegration of the stellar luminosity function for the best-fitmodel. However, for fainter satellites, the uncertainty in thetotal magnitude can be dominated by shot noise arising fromsparse sampling of the stellar population. In this case, theadditional association of a single bright star can have a stronginfluence on the measured magnitude of a satellite. Similarly,the evolution of individual member stars can substantiallychange the total luminosity. To quantify the impact of shotnoise on the derived luminosity estimates, we use arepresentative isochrone weighted by a Chabrier IMF tosimulate an ensemble of satellites with similar characteristicsto the observed candidates. The quoted uncertainty on the
Table 2Properties of DES Satellite Galaxy Candidates
Name Distance M* MV r1 2 tlog ( )10 Z(kpc) M(10 )3 (mag) (pc) log (Gyr)10
DES J0335.6–5403 (Ret II) 32 -+2.6 0.2
0.2 −3.6 ± 0.1 -+55 5
5 10.08 ± 0.21 <0.0003
DES J0344.3–4331 (Eri II) 330 -+83 14
17 −7.4 ± 0.1 -+172 57
57 10.10 ± 0.23 <0.0006
DES J2251.2–5836 (Tuc II) 58 -+3 1
7 −3.9 ± 0.2 -+120 30
30 L LDES J0255.4–5406 (Hor I) 87 -
+2.4 0.71.4 −3.5 ± 0.3 -
+60 3076 9.96 ± 0.21 <0.0005
DES J2108.8–5109 (Ind I) 69 -+0.8 0.4
0.4 −2.2 ± 0.5 -+12 2
2 L LDES J0443.8–5017 (Pic I) 126 -
+2.8 1.75.0 −3.7 ± 0.4 -
+43 21153 10.00 ± 0.16 <0.0004
DES J2339.9–5424 (Phe II) 95 -+2.8 0.7
1.2 −3.7 ± 0.4 -+33 11
20 L LDES J0222.7–5217 (Eri III) 95 -
+0.9 0.70.9 −2.4 ± 0.6 -
+11 58 L L
Note. Uncertainties are calculated from the the highest density interval containing 90% of the posterior distribution. Stellar masses are computed for a Chabrier initialmass function.
50 emcee v2.1.0: http://dan.iel.fm/emcee/current/.
6
The Astrophysical Journal, 807:50 (16pp), 2015 July 1 Bechtol et al.

luminosity reflects the expected shot noise from stars in themagnitude range visible to DES, < <g17 mag 23 mag.
The angular and physical half-light radii listed in Tables 1and Table 2 are both given as two-dimensional quantities. Thedeprojected (three-dimensional) half-light radius is a factor∼1.3 larger than the projected half-light radius for a variety ofcommon density profiles (Wolf et al. 2010). For objects withmeasured ellipticity, we report the half-light radius measuredalong the semimajor axis.
As illustrated in Figure 1, the DES candidates are distributedthroughout the Y1A1 footprint and occupy a portion of thecelestial sphere in the direction of the Magellanic Cloudswhere no ultra-faint galaxies were previously known. TheDES candidates are widely distributed in heliocentric distancefrom ~30 kpc (DES J0335.6−5403) to >300 kpc (DESJ0344.3−4331).
5. DISCUSSION
Galaxies are distinguished from star clusters by having adynamical mass that is substantially larger than the massinferred from the luminous stellar population and/or asignificant dispersion in metallicities indicative of multiplegenerations of star formation and a deep enough gravitationalpotential to retain supernova ejecta (Willman & Strader 2012).While devoted spectroscopic follow up observations arenecessary to unambiguously classify these objects, the proper-ties given in Table 2 already provide strong clues as to whichcandidates are most likely to be galaxies. First, the largephysical sizes of most of these objects are more consistent withthe locus occupied by known satellite galaxies of the LocalGroup than with globular clusters of the Milky Way, as shownin Figure 3. All of the DES candidates are of comparable
surface brightness to the ultra-faint galaxies detected in SDSS(McConnachie 2012a). The two most compact systems,DES J2108.8−5109 and DES J0222.7−5217, fall in betweenthe known ultra-faint galaxies and the faintest Milky Way starclusters, e.g., Koposov 1 and Koposov 2 (Koposov et al. 2007;Paust et al. 2014), Segue 3 (Belokurov et al. 2010; Fadelyet al. 2011; Ortolani et al. 2013), Muñoz 1 (Muñozet al. 2012a), Balbinot 1 (Balbinot et al. 2013), and Kim 1(Kim & Jerjen 2015). For the most significant DES candidates,it is possible to estimate the ellipticity. Whereas globularclusters tend to have ellipticity 0.2 (Martin et al. 2008a; vanden Bergh 2008), the best measured candidate, DESJ0335.6−5403, has an ellipticity ∼0.6, which is more consistentwith the population of known ultra-faint galaxies.Further insight can be gained by fitting isochrones to the
observed stellar distribution in color–magnitude space. Twoindependent maximum-likelihood implementations confirm thatthe DES candidates are generally consistent with old ( t 10Gyr) and metal-poor stellar populations ~Z( 0.0002). The firstof these analyses is the pipeline described in Section 3.2 used ina mode that varies age and metallicity in addition to spatialparameters and distance modulus in a simultaneous fit. Thesecond color–magnitude fitting procedure adopts a similarlikelihood formalism, but fits the spatial and photometricdistributions of the stars in two separate phases. Instead ofassuming an IMF, the second method weights the starsaccording to their proximity to the best-fit centroid location,and then evaluates the consistency between each star and a givenisochrone in color–magnitude space given the photometricuncertainty for that star. The second method is more robust tocomplications that might arise from stellar incompleteness and/or imperfect modeling of the IMF. Age estimates and metallicityupper limits for four of the more significant DES candidates arereported in Table 2. Like the previously known ultra-faintdwarfs, the new DES systems are old and metal-poor (e.g.,Brown et al. 2014). The latter fitting procedure has also beenapplied to non-extinction corrected magnitudes to independentlyvalidate the extinction values from Schlegel et al. (1998).
5.1. Review of Individual Candidates.
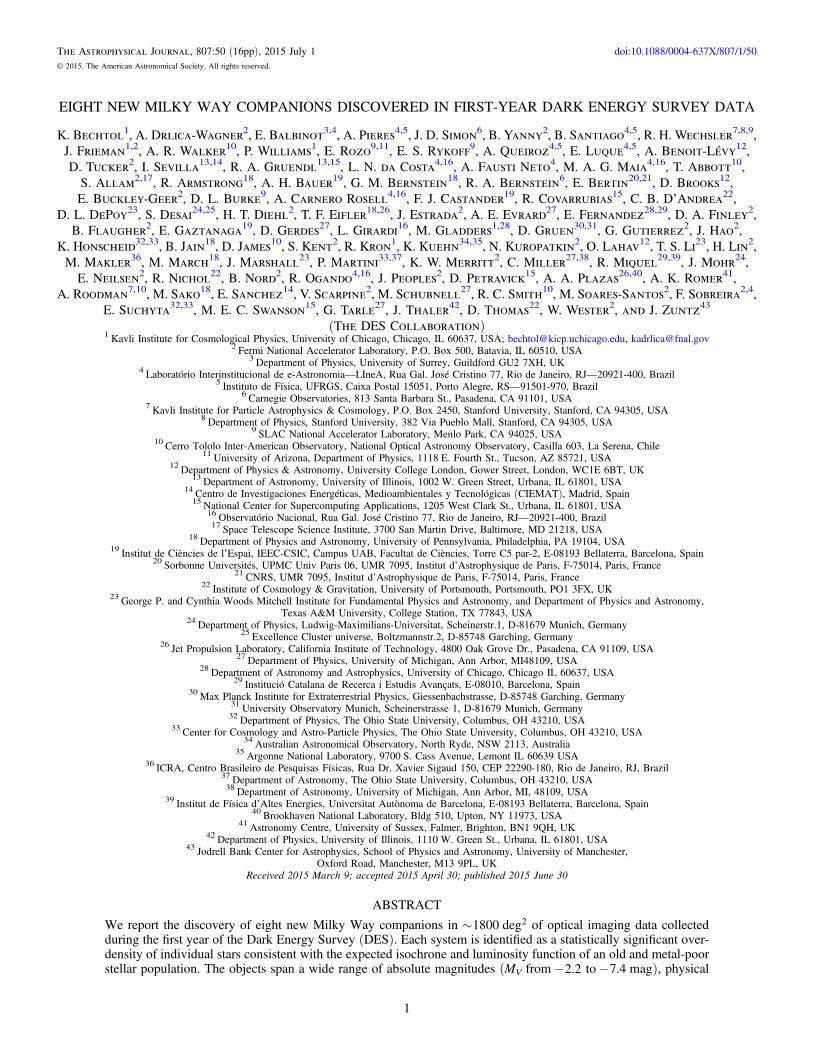
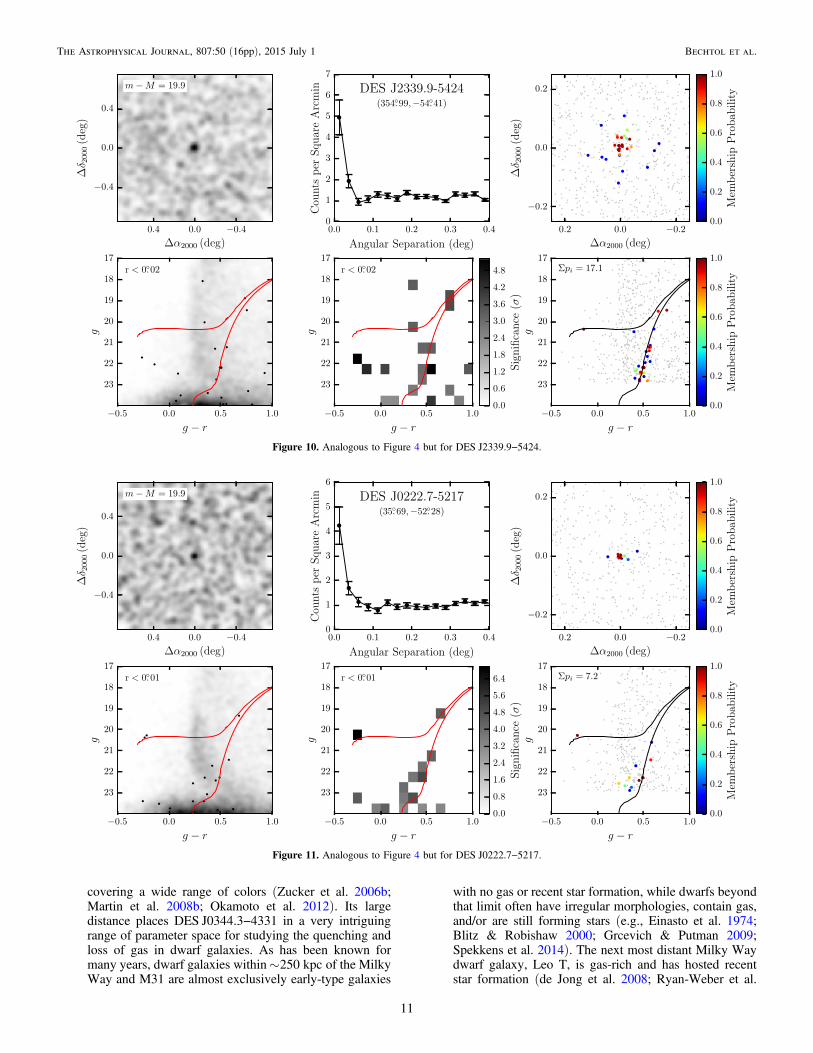
Brief comments on the individual galaxy candidates areprovided below, and spatial maps and color–magnitude diagramsfor each candidate are provided in Figures 4–11. The rightmostpanels of these Figures show the satellite membership prob-abilities of individual stars that are assigned by the likelihood fitusing a single representative isochrone with t = 13.5 Gyr and=Z 0.0001. Stars with high membership probabilities contribute
most to the statistical significance of each candidate. Theconstellation designation, should these candidates be confirmedas dwarf galaxies, is listed in parenthesis.
1. DES J0335.6–5403 (Reticulum II, Figure 4): as thenearest and most significant candidate, DESJ0335.6−5403 is highly conspicuous in the Y1A1 stellardensity maps, with ~300 member stars brighter than~g 23 mag. In fact, an over-density of faint stars at this
position is even visible in the much shallower DigitizedSky Survey images, although it was not detected byWhiting et al. (2007) and other searches of photographicmaterial. Note that like the previously known ultra-faintdwarfs, DES J0335.6−5403 very likely contains severalblue horizontal branch stars identified by the likelihood
Figure 3. Local Group galaxies (McConnachie 2012a) and globular clusters(Harris 1996, 2010 edition) occupy distinct regions in the plane of physicalhalf-light radius (geometric mean of the major and minor axes) and absoluteluminosity. The majority of DES satellite candidates (red dots) are moreconsistent with the locus of Local Group galaxies (empty blue shapes) thanwith the population of Galactic globular clusters (black crosses). Several of thefaintest globular clusters and systems of ambiguous classification are indicatedwith×marks: Koposov 1 and Koposov 2 (Koposov et al. 2007; Paustet al. 2014), Segue 3 (Belokurov et al. 2010; Fadely et al. 2011; Ortolaniet al. 2013), Muñoz 1 (Muñoz et al. 2012a), Balbinot 1 (Balbinot et al. 2013),PSO J174.0675–10.8774/Crater I (Laevens et al. 2014; Belokurov et al. 2014),and Kim 1 (Kim & Jerjen 2015). Dashed lines indicate contours of constantsurface brightness at m = -{25, 27.5, 30} mag arcsec 2.
7
The Astrophysical Journal, 807:50 (16pp), 2015 July 1 Bechtol et al.

Figure 4. Stellar density and color–magnitude diagrams for DES J0335.6−5403. Top left: spatial distribution of stars with <g 24 mag that are within 0.1 mag of theisochrone displayed in the lower panels. The field of view is ´◦ ◦1. 5 1. 5 centered on the candidate and the stellar distribution has been smoothed with a Gaussiankernel with standard deviation ◦0. 027. Top center: radial distribution of stars with - <g r 1 mag and <g 24 mag. Top right: spatial distribution of stars with highmembership probabilities within a ´◦ ◦0. 5 0. 5 field of view. Small gray points indicate stars with membership probability less than 5%. Bottom left: the color–magnitude distribution of stars within 0 ◦. 1 of the centroid are indicated with individual points. The density of the field within a 1° annulus is represented by thebackground two-dimensional histogram in grayscale. The red curve shows a representative isochrone for a stellar population with t = 13.5 Gyr and =Z 0.0001located at the best-fit distance modulus listed in the upper left panel. Bottom center: binned significance diagram representing the Poisson probability of detecting theobserved number of stars within the central 0 ◦. 1 for each bin of the color–magnitude space given the local field density. Bottom right: color–magnitude distribution ofhigh membership probability stars.
Figure 5. Analogous to Figure 4 but for DES J0344.3−4331. A large number of stars, including several probable horizontal branch members, are present atmagnitudes fainter than the <g 23 mag threshold of our likelihood analysis. This threshold was set by the rapidly decreasing stellar completeness at faintermagnitudes. However, it is likely that extending to fainter magnitudes would cause the best-fit distance modulus of DES J0344.3−4331 to increase. Better constraintson the properties of DES J0344.3−4331 require the stellar completeness to be robustly quantified in this regime.
8
The Astrophysical Journal, 807:50 (16pp), 2015 July 1 Bechtol et al.

procedure, two of which are relatively far from the centerof the object. Given its luminosity, radius, and ellipticity,DES J0335.6−5403 is almost certainly a dwarf galaxyrather than a globular cluster. As illustrated in Figure 3, itis significantly more extended than any known faintglobular cluster, and its elongated shape would also make
it an extreme outlier from the Milky Way clusterpopulation. Among known dwarfs, DES J0335.6−5403appears quite comparable to Ursa Major II (Zuckeret al. 2006a; Muñoz et al. 2010). DES J0335.6−5403 isonly ~23 kpc from the LMC, and measurements of itsradial velocity and proper motion will provide strong
Figure 6. Analogous to Figure 4 but for DES J2251.2−5836.
Figure 7. Analogous to Figure 4 but for DES J0255.4−5406.
9
The Astrophysical Journal, 807:50 (16pp), 2015 July 1 Bechtol et al.

clues as to whether it originated as a Milky Way satelliteor fell into the Milky Way halo as part of a Magellanicgroup.
2. DES J0222.7–5217 (Eridanus II, Figure 5): at a distanceof >330 kpc, DES J0344.3−4331 is nearly a factor ofthree more distant than any known outer halo globular
cluster, and its half-light radius of~170 pc is inconsistentwith the sizes of globular clusters. It is therefore verylikely that this object is a new dwarf galaxy. The color–magnitude diagram of DES J0344.3−4331 closely resem-bles that of another distant Milky Way satellite, CanesVenatici I, with a well-populated horizontal branch
Figure 8. Analogous to Figure 4 but for DES J2108.8−5109.
Figure 9. Analogous to Figure 4 but for DES J0443.8−5017.
10
The Astrophysical Journal, 807:50 (16pp), 2015 July 1 Bechtol et al.
covering a wide range of colors (Zucker et al. 2006b;Martin et al. 2008b; Okamoto et al. 2012). Its largedistance places DES J0344.3−4331 in a very intriguingrange of parameter space for studying the quenching andloss of gas in dwarf galaxies. As has been known formany years, dwarf galaxies within~250 kpc of the MilkyWay and M31 are almost exclusively early-type galaxies
with no gas or recent star formation, while dwarfs beyondthat limit often have irregular morphologies, contain gas,and/or are still forming stars (e.g., Einasto et al. 1974;Blitz & Robishaw 2000; Grcevich & Putman 2009;Spekkens et al. 2014). The next most distant Milky Waydwarf galaxy, Leo T, is gas-rich and has hosted recentstar formation (de Jong et al. 2008; Ryan-Weber et al.
Figure 10. Analogous to Figure 4 but for DES J2339.9−5424.
Figure 11. Analogous to Figure 4 but for DES J0222.7−5217.
11
The Astrophysical Journal, 807:50 (16pp), 2015 July 1 Bechtol et al.

2008); deeper optical and H I imaging to search forneutral gas and young stars in DES J0344.3−4331 has thepotential to provide new insight into how gas is strippedfrom low-mass dwarfs and reveal the minimum mass formaintaining star formation over many Gyr. A radialvelocity measurement will also shed light on ifDES J0344.3−4331 has already passed close to the MilkyWay or whether it is infalling for the first time. Givenits distance, it is unlikely to be associated withthe Magellanic Clouds. Like DES J0335.6−5403, DESJ0344.3−4331 is clearly detected in Digitized Sky Surveyimages dating as far back as 1976.
3. DES J2251.2-5836 (Tucana II, Figure 6): DESJ2251.2−5836 is the third new satellite with a largeenough size (120 pc) to be tentatively identified as adwarf galaxy with DES multi-band photometry alone. Ithas a similar luminosity to DES J0335.6−5403, but is amuch lower surface brightness system and is a factor of~2 farther away. DES J2251.2−5836 is~19 kpc from theLMC and ~37 kpc from the SMC, making it a strongcandidate for another member of the Magellanic group. Inthe surface density map in the upper left panel ofFigure 6, the outer regions of DES J2251.2−5836 appearelongated and distorted. However, these features arelikely a result of noise rather than real distortions (Martinet al. 2008a; Muñoz et al. 2010). The distribution oflikely member stars in the upper right panel is muchrounder. The high detection significance of this objectdemonstrates the power of the likelihood analysis tosimultaneously combine spatial and color–magnitudeinformation.
4. DES J0255.4–5406 (Horologium I, Figure 7): DESJ0255.4−5406, at a distance of~87 kpc, has only a sparsepopulation of red giant branch and horizontal-branch starsvisible in the DES photometry (a hint of the mainsequence turnoff may be present at the detection limit).Given the small number of stars visible in the DES data,deeper imaging and spectroscopy will be needed tocharacterize the system more fully. Its Plummer radius of~60 pc establishes it as a likely dwarf galaxy, twice asextended as the largest globular clusters with comparableluminosities. DES J0255.4−5406 (perhaps along withDES J0443.8−5017 and DES J2339.9−5424; see below)is significantly farther from the Milky Way than anypreviously known dwarf galaxy with -M 4V , suggest-ing that tidal stripping may not be needed to explain thelow luminosities of the faintest dwarfs. On its own, theGalactocentric distance is not necessarily a good indicatorof the past importance of Galactic tides in shaping thephotometric and spectroscopic properties of satellites.The most important factor is the peri-Galacticon distance,which is not yet known for the new satellites.DES J0255.4−5406 is ~40 kpc away from the Magella-nic Clouds and a factor ∼2 closer to them than to theMilky Way, making it a potential Magellanic satellite. Ifit is (or was) associated with the Magellanic group, it ispossible that tides from the LMC could have beenrelevant to its evolution. A measurement of the systemicvelocity will help clarify whether DES J0255.4−5406 iscurrently near apocenter, infalling, or associated with theMagellanic system.
5. DES J2108.8–5109 (Indus I, Figure 8): we identifyDES J2108.8−5109 with Kim 2 (Kim et al. 2015).DES J2108.8−5109 is one of the faintest ( ~ -MV2.2 mag) and most compact ( ~r 12h pc) of the satellitesdiscussed here. The object is visible in the coadded DESimages. If it is a globular cluster, as argued by Kim et al.(2015), DES J2108.8−5109 is fainter and more extendedthan most of the other outer halo clusters, such as AM 1,Eridanus, Pal 3, Pal 4, and Pal 14. DES J2108.8−5109 is~37 kpc from the SMC, ~55 kpc from the LMC, and~69 kpc from the much more massive Milky Way, so itis more likely a satellite of the Milky Way than of theMagellanic Clouds.
6. DES J0443.8-5017 (Pictoris I, Figure 9): DESJ0443.8−5017 has a large enough radius to be a likelydwarf galaxy, but the uncertainty on the radius measure-ment is large enough to make it also consistent with theglobular cluster population. DES J0443.8−5017 has aprominent blue horizontal branch and hints of an ellipticalshape, but fewer member stars are detected in the DESdata. More accurate measurements of size and shape fromdeeper imaging, and kinematics and chemical abundancesfrom spectroscopy, will be required to determine thenature of this object. The large distance of DES J0443.8−5017 places it far enough behind the Magellanic Cloudsthat it is less likely to be a Magellanic satellite than manyof the other new discoveries.
7. DES J2339.9–5424 (Phoenix II, Figure 10): DESJ2339.9−5424 is quite similar to DES J0443.8−5017,but slightly smaller and closer. Again, we cannot drawfirm conclusions on its nature without additional data, At~43 kpc from the SMC and ~65 kpc from the LMC, it isunclear whether DES J2339.9−5424 could plausibly be aMagellanic satellite.
8. DES J0222.7–5217 (Eridanus III, Figure 11): DESJ0222.7−5217 is the most compact of the newly discoveredobjects in both angular and physical units. Along withDES J2108.8−5109, it is the most likely of the newdiscoveries to be a distant globular cluster rather than adwarf galaxy. However, they could also be consistent withan extension of the dwarf galaxy locus to fainter magnitudesand smaller sizes. Even though it is one of the lowestluminosity system identified in the DES data so far, itscompactness gives it a relatively high surface brightness,and like DES J2108.8−5109 and DES J0443.8−5017, it isclearly visible in coadded images. However, only a handfulof likely member stars are resolved at the depth of theY1A1 data, and significantly deeper imaging will be neededto better constrain its physical properties and stellarpopulation.
5.2. Detection Completeness
Given that no additional ultra-faint Milky Way satellitegalaxies have been confirmed outside of the SDSS DR7footprint, despite the large areas of sky subsequently observedby SDSS and Pan-STARRS, it is interesting that multiplecandidates have been found within the comparatively smallarea explored by DES thus far.51 Without definite classifica-tions, it is difficult to incorporate the DES candidates into
51 The classification of PSO J174.0675–10.8774/Crater I as a globular clusteror dwarf galaxy is currently ambiguous (Belokurov et al. 2014; Laevenset al. 2014).
12
The Astrophysical Journal, 807:50 (16pp), 2015 July 1 Bechtol et al.

constraints on the luminosity function of Milky Way satellitegalaxies. However, it is still possible to quantify the sensitivityof the first-year DES search using simple semi-analyticestimates of the completeness.
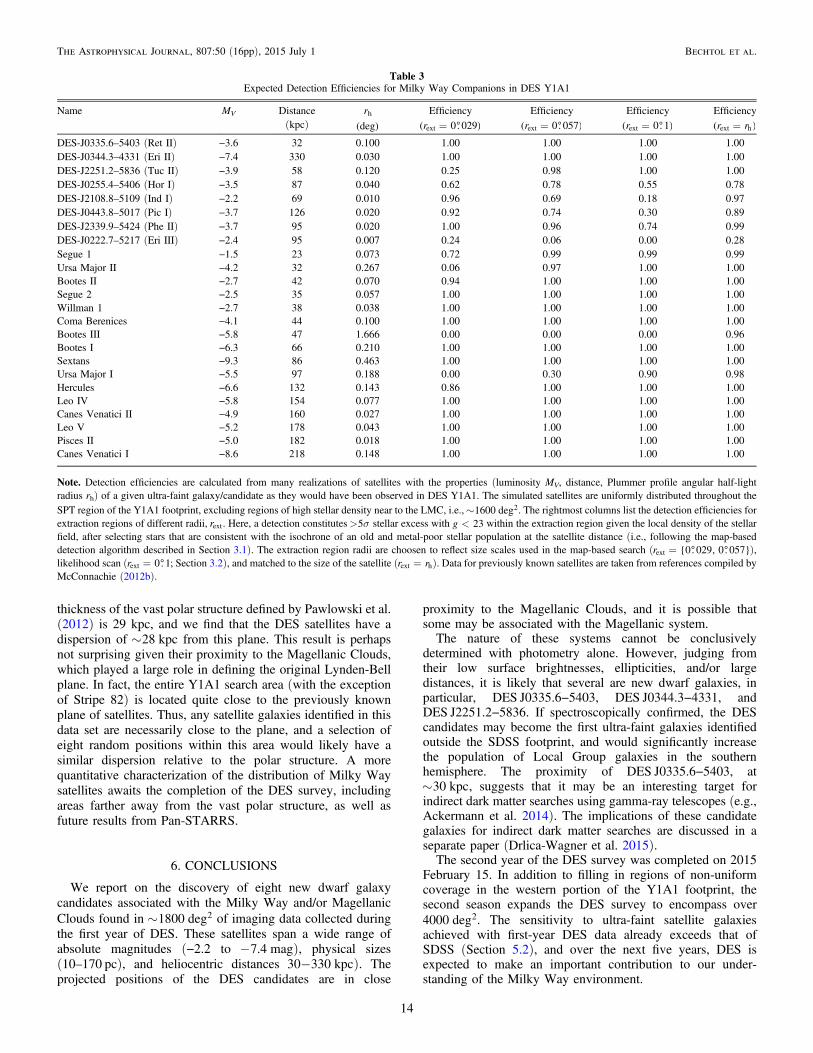
First, we calculated the probability that each new satellitecould have been detected in the Y1A1 data. We began bygenerating a large number of realizations of each galaxycandidate distributed uniformly over the Y1A1 footprint. Thecandidates were modeled using radially symmetric Plummerprofiles and the realizations included shot noise due to thelimited number of stars expected to be in the observablemagnitude range of DES. We then applied the simple map-based detection algorithm described in Section 3.1 to evaluatethe detection efficiency. To be “detected,” the satellite mustpossess at least 10 stars brighter than our imposed magnitudelimit ( <g 23) and a large enough surface brightness to passthe visual search selection criteria. Specifically, we consideredextraction of varying sizes and computed the Poissonprobability of detecting +n nsatellite field stars when expectingnfield stars based on the local field surface density. We testedextraction regions with sizes corresponding to the pixel areas inthe map-based search algorithm ( = ◦ ◦r {0 . 029, 0 . 057}ext ;Section 3.1) and the kernel size from the likelihood scan( = ◦r 0 . 1ext ; Section 3.2), as well as an extraction radius set tothe angular half-light radius of the simulated satellite. Whencomputing the local field density, we selected only stars alongthe isochrone at the distance of the satellite with t = 12 Gyrand =Z 0.0002 (see Section 3.1). Table 3 summarizes theexpected detection efficiencies for the DES candidates whenapplying a s5 statistical significance threshold, as in our seedselection procedure for the map-based search. The results showthat all of the DES candidates would have been identified overa substantial fraction of the Y1A1 footprint with non-negligibleprobability, and for several candidates, near certainty.
Table 3 also shows that the detection efficiency is sensitiveto the size of the extraction region. Extended systems such asDES J2251.2−5836 are unlikely to found using the smallestextraction regions considered here, whereas the reverse is truefor compact systems such as DES J0222.7−5217 andDES J2108.8−5109. This size dependence accounts for thelow significance of the two most compact candidates,DES J0222.7−5217 and DES J2108.8−5109, in the likelihoodscan (Table 1). After allowing their spatial extensions to be fit,the detection significances of these candidates increase to alevel well above the our imposed threshold.
For comparison, Table 3 also provides detection efficiencyestimates for previously known ultra-faint galaxies (assumingthey were located in the SPT region of Y1A1 instead of theiractual locations). We find that all of the SDSS ultra-faintgalaxies, with the exception of the highly extended Boötes III,could have been readily detected in Y1A1. We attribute thesehigh detection efficiencies to the deeper imaging of DESrelative to SDSS and note that DES J2251.2−5836,DES J0255.4−5406, DES J2108.8−5109, and DESJ0222.7−5217 have a substantially reduced detection prob-ability when the magnitude limit is raised to <r 22 mag,comparable to the stellar completeness limit of SDSS.
Our Y1A1 search sensitivity can be quantified in a moregeneral way by considering an ensemble of satellites spanninga range of luminosities, physical sizes, and heliocentricdistances. Figure 12 presents the discovery potential of ourY1A1 search expressed as the detection efficiency with respect
to these galaxy properties, estimated by the same methoddescribed above with =r rext h. Nearby, luminous, and compactobjects have a high probability of being significantly detectedwhereas objects that are more distant, faint, and extended areless likely to be found. The detection threshold in the plane ofphysical size and luminosity is nearly parallel to contours ofconstant surface brightness, and is weakly dependent on thedistance, provided that a sufficient number of stars are detected.Since the Y1A1 search procedure described in Section 3 is a
combination of the map-based and likelihood-based searchtechniques, the actual completeness of our search is likelyslightly higher than estimated here. We expect the likelihoodmethod to be more sensitive to extended low surface brightnesssystems because it combines spatial and color–magnitudeinformation simultaneously. As the depth of DES imagingincreases (2 to 4 tilings in Y1A1 compared to 10 tilingsplanned after 5 years) and more advanced techniques areapplied to separate stars and galaxies at faint magnitudes (e.g.,Fadely et al. 2012; Soumagnac et al. 2013), we anticipate thatlower surface brightness satellites will become accessible. Ourpresent study is optimized for the detection of relativelycompact ( ◦r 0 . 20 ) and radially symmetric stellar over-densities. The search for extended low surface brightnessfeatures in the stellar distribution will be the focus offuture work.
5.3. Total Number and Spatial Distributionof Milky Way Satellite Galaxies
The discovery of eight new dwarf galaxy candidates in~1600 deg2 of Y1A1 not overlapping with SDSS Stripe 82 isconsistent with expectations from the literature (Tollerudet al. 2008; Rossetto et al. 2011; Hargis et al. 2014; He et al.2015). By empirically modeling the incompleteness of SDSS,Tollerud et al. 2008 predicted that 19–37 satellite galaxiescould be found over the full DES footprint. More recentestimates based on high-resolution N-body simulations (Hargiset al. 2014) and semi-analytic galaxy formation models thatinclude baryonic physics (He et al. 2015) predict ~10 newdetectable satellite galaxies in DES. Large uncertainties areassociated with each of these estimates due to weak constraintson the luminosity function in the ultra-faint regime. Addition-ally, as noted in Section 5.1, some of the DES candidates may beglobular clusters or may be associated with the MagellanicClouds. In the latter case, it becomes more challenging todirectly compare our results to the predictions above, whichassume an isotropic distribution of Milky Way satellite galaxies.A number of studies, beginning with Lynden-Bell (1976), note
that many Milky Way satellite galaxies appear to be distributedon the sky along a great circle, indicating a planar three-dimensional structure rather than an ellipsoidal or sphericaldistribution. This great circle has a polar orientation relative to thedisk of the Milky Way. The discovery of most of the SDSS ultra-faint dwarfs in the north Galactic cap region increased theapparent significance of this alignment. However, since theprimary region surveyed by SDSS is located in the direction ofthis so-called vast polar structure (Pawlowski et al. 2012), thetrue anisotropy of the Milky Way satellite population is not yetclear. The next generation of deep wide-field surveys should beable to address this issue with wider sky coverage.In this context, it is interesting to consider the locations of
the eight new satellites reported here, which may increase theknown Milky Way dwarf galaxy population by ~30%. The
13
The Astrophysical Journal, 807:50 (16pp), 2015 July 1 Bechtol et al.
thickness of the vast polar structure defined by Pawlowski et al.(2012) is 29 kpc, and we find that the DES satellites have adispersion of ~28 kpc from this plane. This result is perhapsnot surprising given their proximity to the Magellanic Clouds,which played a large role in defining the original Lynden-Bellplane. In fact, the entire Y1A1 search area (with the exceptionof Stripe 82) is located quite close to the previously knownplane of satellites. Thus, any satellite galaxies identified in thisdata set are necessarily close to the plane, and a selection ofeight random positions within this area would likely have asimilar dispersion relative to the polar structure. A morequantitative characterization of the distribution of Milky Waysatellites awaits the completion of the DES survey, includingareas farther away from the vast polar structure, as well asfuture results from Pan-STARRS.
6. CONCLUSIONS
We report on the discovery of eight new dwarf galaxycandidates associated with the Milky Way and/or MagellanicClouds found in ~1800 deg2 of imaging data collected duringthe first year of DES. These satellites span a wide range ofabsolute magnitudes (−2.2 to -7.4 mag), physical sizes(10–170 pc), and heliocentric distances -30 330 kpc). Theprojected positions of the DES candidates are in close
proximity to the Magellanic Clouds, and it is possible thatsome may be associated with the Magellanic system.The nature of these systems cannot be conclusively
determined with photometry alone. However, judging fromtheir low surface brightnesses, ellipticities, and/or largedistances, it is likely that several are new dwarf galaxies, inparticular, DES J0335.6−5403, DES J0344.3−4331, andDES J2251.2−5836. If spectroscopically confirmed, the DEScandidates may become the first ultra-faint galaxies identifiedoutside the SDSS footprint, and would significantly increasethe population of Local Group galaxies in the southernhemisphere. The proximity of DES J0335.6−5403, at~30 kpc, suggests that it may be an interesting target forindirect dark matter searches using gamma-ray telescopes (e.g.,Ackermann et al. 2014). The implications of these candidategalaxies for indirect dark matter searches are discussed in aseparate paper (Drlica-Wagner et al. 2015).The second year of the DES survey was completed on 2015
February 15. In addition to filling in regions of non-uniformcoverage in the western portion of the Y1A1 footprint, thesecond season expands the DES survey to encompass over4000 deg2. The sensitivity to ultra-faint satellite galaxiesachieved with first-year DES data already exceeds that ofSDSS (Section 5.2), and over the next five years, DES isexpected to make an important contribution to our under-standing of the Milky Way environment.
Table 3Expected Detection Efficiencies for Milky Way Companions in DES Y1A1
Name MV Distance rh Efficiency Efficiency Efficiency Efficiency(kpc) (deg) = ◦r( 0 . 029)ext = ◦r( 0 . 057)ext = ◦r( 0 . 1)ext =r r( )ext h
DES-J0335.6–5403 (Ret II) −3.6 32 0.100 1.00 1.00 1.00 1.00DES-J0344.3–4331 (Eri II) −7.4 330 0.030 1.00 1.00 1.00 1.00DES-J2251.2–5836 (Tuc II) −3.9 58 0.120 0.25 0.98 1.00 1.00DES-J0255.4–5406 (Hor I) −3.5 87 0.040 0.62 0.78 0.55 0.78DES-J2108.8–5109 (Ind I) −2.2 69 0.010 0.96 0.69 0.18 0.97DES-J0443.8–5017 (Pic I) −3.7 126 0.020 0.92 0.74 0.30 0.89DES-J2339.9–5424 (Phe II) −3.7 95 0.020 1.00 0.96 0.74 0.99DES-J0222.7–5217 (Eri III) −2.4 95 0.007 0.24 0.06 0.00 0.28Segue 1 −1.5 23 0.073 0.72 0.99 0.99 0.99Ursa Major II −4.2 32 0.267 0.06 0.97 1.00 1.00Bootes II −2.7 42 0.070 0.94 1.00 1.00 1.00Segue 2 −2.5 35 0.057 1.00 1.00 1.00 1.00Willman 1 −2.7 38 0.038 1.00 1.00 1.00 1.00Coma Berenices −4.1 44 0.100 1.00 1.00 1.00 1.00Bootes III −5.8 47 1.666 0.00 0.00 0.00 0.96Bootes I −6.3 66 0.210 1.00 1.00 1.00 1.00Sextans −9.3 86 0.463 1.00 1.00 1.00 1.00Ursa Major I −5.5 97 0.188 0.00 0.30 0.90 0.98Hercules −6.6 132 0.143 0.86 1.00 1.00 1.00Leo IV −5.8 154 0.077 1.00 1.00 1.00 1.00Canes Venatici II −4.9 160 0.027 1.00 1.00 1.00 1.00Leo V −5.2 178 0.043 1.00 1.00 1.00 1.00Pisces II −5.0 182 0.018 1.00 1.00 1.00 1.00Canes Venatici I −8.6 218 0.148 1.00 1.00 1.00 1.00
Note. Detection efficiencies are calculated from many realizations of satellites with the properties (luminosity MV, distance, Plummer profile angular half-lightradius rh) of a given ultra-faint galaxy/candidate as they would have been observed in DES Y1A1. The simulated satellites are uniformly distributed throughout theSPT region of the Y1A1 footprint, excluding regions of high stellar density near to the LMC, i.e.,~1600 deg2. The rightmost columns list the detection efficiencies forextraction regions of different radii, rext . Here, a detection constitutes s>5 stellar excess with <g 23 within the extraction region given the local density of the stellarfield, after selecting stars that are consistent with the isochrone of an old and metal-poor stellar population at the satellite distance (i.e., following the map-baseddetection algorithm described in Section 3.1). The extraction region radii are choosen to reflect size scales used in the map-based search ( = ◦ ◦r {0. 029, 0. 057}ext ),likelihood scan ( = ◦r 0. 1ext ; Section 3.2), and matched to the size of the satellite ( =r rext h). Data for previously known satellites are taken from references compiled byMcConnachie (2012b).
14
The Astrophysical Journal, 807:50 (16pp), 2015 July 1 Bechtol et al.

During the preparation of this manuscript, we were sent anindependent study by Koposov et al. using publicly releasedimages from the first year of DES. Koposov et al. (2015)identify nine candidate satellites of the Milky Way and/orMagellanic Clouds, including eight that overlap with candi-dates presented here. The candidate that Koposov et al. refer toas Grus I is located outside the Y1A1 footprint in a region thatwas observed during the first year of DES with good imagequality, but which did not have sufficient coverage in all bandsto enter the coaddition stage of the standard DESDM pipeline.Therefore, the stars that comprise Grus I are not in the coaddobject catalog that was used for this analysis.
We note that we have not used the coordinates shared byKoposov et al. as seeds in our analysis, nor have we tuned oursearch algorithms based on knowledge of the candidates reportedin their work. The search methods presented here yieldsignificance maps of the entire Y1A1 footprint, and the reporteddetections are the most significant points in the mapsunassociated with known objects. While our final choice of s5for the significance threshold for reportable galaxy candidateswas made after our knowledge of the results from Koposov et al.,the threshold was chosen to provide as much timely informationto the astronomical community as possible with minimallikelihood of false positives, rather than for agreement with theKoposov et al. detections. We conclude that the independentdiscovery of these Milky Way companions by two separate teamsusing distinct object catalogs and search algorithms strengthensthe case for follow-up by the astronomical community.
We thank Sergey Koposov and collaborators for sending acopy of their submitted paper with their nine discoveries, andHelmut Jerjen for pointing out the association between Kim 2
and DES J2108.8−5109. Marla Geha provided useful com-ments on the presentation of these results. K.B. and A.D.W.thank Beth Willman for advice regarding the search for ultra-faint galaxies. A.D.W. thanks Ellen Bechtol for her generoushospitality during the preparation of this manuscript. Weacknowledge helpful suggestions from the anonymous referee.This work made use of computational resources at the SLACNational Accelerator Laboratory and University of ChicagoResearch Computing Center. This material is based upon worksupported by the National Science Foundation under GrantNumber (1138766). A.C.R. acknowledges financial supportprovided by the PAPDRJ CAPES/FAPERJ Fellowship. A.A.P.was supported by DOE grant DE-AC02-98CH10886 and byJPL, run by Caltech under a contract for NASA. Funding forthe DES Projects has been provided by the U.S. Department ofEnergy, the U.S. National Science Foundation, the Ministry ofScience and Education of Spain, the Science and TechnologyFacilities Council of the United Kingdom, the HigherEducation Funding Council for England, the National Centerfor Supercomputing Applications at the University of Illinois atUrbana-Champaign, the Kavli Institute of CosmologicalPhysics at the University of Chicago, the Center for Cosmologyand Astro-Particle Physics at the Ohio State University, theMitchell Institute for Fundamental Physics and Astronomy atTexas A&M University, Financiadora de Estudos e Projetos,Fundação Carlos Chagas Filho de Amparo à Pesquisa doEstado do Rio de Janeiro, Conselho Nacional de Desenvolvi-mento Científico e Tecnológico and the Ministério da Ciência,Tecnologia e Inovação, the Deutsche Forschungsgemeinschaftand the Collaborating Institutions in the Dark Energy Survey.The DES data management system is supported by the NationalScience Foundation under Grant Number AST-1138766. The
Figure 12. Sensitivity of the our Y1A1 search expressed as the detection efficiency as a function of satellite luminosity, physical size, and heliocentric distance. Eachpanel corresponds to a different heliocentric distance. Contours of constant surface density are indicated with dashed black lines: μ = {25, 27.5, 30} mag arcsec−2.
15
The Astrophysical Journal, 807:50 (16pp), 2015 July 1 Bechtol et al.

DES participants from Spanish institutions are partiallysupported by MINECO under grants AYA2012-39559,ESP2013-48274, FPA2013-47986, and Centro de ExcelenciaSevero Ochoa SEV-2012-0234, some of which include ERDFfunds from the European Union. The Collaborating Institu-tions are Argonne National Laboratory, the University ofCalifornia at Santa Cruz, the University of Cambridge, Centrode Investigaciones Enérgeticas, Medioambientales y Tecno-lógicas-Madrid, the University of Chicago, University Col-lege London, the DES-Brazil Consortium, the University ofEdinburgh, the Eidgenössische Technische Hochschule(ETH) Zürich, Fermi National Accelerator Laboratory, theUniversity of Illinois at Urbana-Champaign, the Institut deCiències de l’Espai (IEEC/CSIC), the Institut de Físicad’Altes Energies, Lawrence Berkeley National Laboratory,the Ludwig-Maximilians Universität München and theassociated Excellence Cluster universe, the University ofMichigan, the National Optical Astronomy Observatory, theUniversity of Nottingham, The Ohio State University, theUniversity of Pennsylvania, the University of Portsmouth,SLAC National Accelerator Laboratory, Stanford University,the University of Sussex, and Texas A&M University.
REFERENCES
Abbott, T., Aldering, G., Annis, J., et al. 2005, arXiv:astro-ph/0510346Ackermann, M., Albert, A., Anderson, B., et al. 2014, PhRvD, 89, 042001Adén, D., Feltzing, S., Koch, A., et al. 2009, A&A, 506, 1147Ahn, C. P., Alexandroff, R., Allende Prieto, C., et al. 2014, ApJS, 211, 17Balbinot, E., Santiago, B. X., da Costa, L., et al. 2013, ApJ, 767, 101Balbinot, E., Santiago, B. X., Girardi, L., et al. 2015, MNRAS, 449, 1129Belokurov, V., Irwin, M. J., Koposov, S. E., et al. 2014, MNRAS, 441, 2124Belokurov, V., Zucker, D. B., Evans, N. W., et al. 2006, ApJL, 647, L111Belokurov, V., Zucker, D. B., Evans, N. W., et al. 2007, ApJ, 654, 897Belokurov, V., Walker, M. G., Evans, N. W., et al. 2008, ApJL, 686, L83Belokurov, V., Walker, M. G., Evans, N. W., et al. 2009, MNRAS, 397, 1748Belokurov, V., Walker, M. G., Evans, N. W., et al. 2010, ApJL, 712, L103Bertin, E. 2011, in ASP Conf. Ser. 442, Astronomical Data Analysis Software
and Systems XX, ed. I. N. Evans et al. (San Francisco, CA: ASP), 435Bertin, E., & Arnouts, S. 1996, A&AS, 117, 393Blitz, L., & Robishaw, T. 2000, ApJ, 541, 675Box, G., & Tiao, G. 1973, Bayesian Inference in Statistical Analysis (Reading,
MA: Addison-Wesley)Bressan, A., Marigo, P., Girardi, L., et al. 2012, MNRAS, 427, 127Brown, T. M., Tumlinson, J., Geha, M., et al. 2014, ApJ, 796, 91Carlin, J. L., Grillmair, C. J., Muñoz, R. R., Nidever, D. L., & Majewski, S. R.
2009, ApJL, 702, L9Carlstrom, J., Ade, P., Aird, K., et al. 2011, PASP, 123, 568Chabrier, G. 2001, ApJ, 554, 1274Chernoff, H. 1954, AnMat, 25, 573Corwin, H. G. 2004, yCat, 7239, 0de Jong, J. T. A., Harris, J., Coleman, M. G., et al. 2008, ApJ, 680, 1112Desai, S., Armstrong, R., Mohr, J. J., et al. 2012, ApJ, 757, 83Diehl, H. T., Abbott, T. M. C., Annis, J., et al. 2014, Proc. SPIE, 9149, 0Diehl, T. 2012, PhPro, 37, 1332Dolphin, A. E. 2002, MNRAS, 332, 91Drlica-Wagner, A., Albert, A., Bechtol, K., et al. 2015, ApJL, submitted
(arXiv:1503.02632)Edwards, A. 1972, Likelihood: An Account of the Statistical Concept of
Likelihood and Its Application to Scientific Inference (Cambridge:Cambridge Univ. Press)
Einasto, J., Saar, E., Kaasik, A., & Chernin, A. D. 1974, Natur, 252, 111Fadely, R., Hogg, D. W., & Willman, B. 2012, ApJ, 760, 15Fadely, R., Willman, B., Geha, M., et al. 2011, AJ, 142, 88Fisher, R. A. 1925, PCPS, 22, 700Flaugher, B., Diehl, H. T., Honscheid, K., et al. 2015, AJ, submitted
(arXiv:1504.02900)Flaugher, B. L., Abbott, T. M. C., Annis, J., et al. 2010, Proc. SPIE, 7735, 0Foreman-Mackey, D., Hogg, D. W., Lang, D., & Goodman, J. 2013, PASP,
125, 306Geha, M., Willman, B., Simon, J. D., et al. 2009, ApJ, 692, 1464
Górski, K. M., Hivon, E., Banday, A. J., et al. 2005, ApJ, 622, 759Grcevich, J., & Putman, M. E. 2009, ApJ, 696, 385Grillmair, C. J. 2006, ApJL, 645, L37Grillmair, C. J. 2009, ApJ, 693, 1118Hargis, J. R., Willman, B., & Peter, A. H. G. 2014, ApJL, 795, L13Harris, W. E. 1996, AJ, 112, 1487He, C., Bechtol, K., Hearin, A. P., & Hooper, D. 2015, PhRvD, 91, 063515Irwin, M. J., Belokurov, V., Evans, N. W., et al. 2007, ApJL, 656, L13Jester, S., Schneider, D. P., Richards, G. T., et al. 2005, AJ, 130, 873Kelly, P. L., von der Linden, A., Applegate, D. E., et al. 2014, MNRAS,
439, 28Kharchenko, N. V., Piskunov, A. E., Schilbach, E., Röser, S., & Scholz, R.-D.
2013, A&A, 558, A53Kim, D., & Jerjen, H. 2015, ApJ, 799, 73Kim, D., Jerjen, H., Milone, A. P., Mackey, D., & da Costa, G. S. 2015, ApJ,
803, 63Kirby, E. N., Boylan-Kolchin, M., Cohen, J. G., et al. 2013, ApJ, 770, 16Kleyna, J. T., Wilkinson, M. I., Evans, N. W., & Gilmore, G. 2005, ApJL,
630, L141Klypin, A., Kravtsov, A. V., Valenzuela, O., & Prada, F. 1999, ApJ, 522, 82Koch, A., Wilkinson, M. I., Kleyna, J. T., et al. 2009, ApJ, 690, 453Koposov, S., Belokurov, V., Evans, N. W., et al. 2008, ApJ, 686, 279Koposov, S., de Jong, J. T. A., Belokurov, V., et al. 2007, ApJ, 669, 337Koposov, S. E., Belokurov, V., Torrealba, G., & Evans, N. W. 2015, ApJ,
805, 130Koposov, S. E., Gilmore, G., Walker, M. G., et al. 2011, ApJ, 736, 146Laevens, B. P. M., Martin, N. F., Sesar, B., et al. 2014, ApJL, 786, L3Lynden-Bell, D. 1976, MNRAS, 174, 695Martin, N. F., de Jong, J. T. A., & Rix, H.-W. 2008a, ApJ, 684, 1075Martin, N. F., Ibata, R. A., Chapman, S. C., Irwin, M., & Lewis, G. F. 2007,
MNRAS, 380, 281Martin, N. F., Coleman, M. G., de Jong, J. T. A., et al. 2008b, ApJL, 672, L13McConnachie, A. W. 2012a, AJ, 144, 4McConnachie, A. W. 2012b, AJ, 144, 4Mohr, J. J., Armstrong, R., Bertin, E., et al. 2012, Proc. SPIE, 8451, 84510DMoore, B., Ghigna, S., Governato, F., et al. 1999, ApJL, 524, L19Muñoz, R. R., Carlin, J. L., Frinchaboy, P. M., et al. 2006, ApJL, 650, L51Muñoz, R. R., Geha, M., Côté, P., et al. 2012a, ApJL, 753, L15Muñoz, R. R., Geha, M., & Willman, B. 2010, AJ, 140, 138Muñoz, R. R., Padmanabhan, N., & Geha, M. 2012b, ApJ, 745, 127Nilson, P. 1973, Uppsala General Catalogue of GalaxiesOkamoto, S., Arimoto, N., Yamada, Y., & Onodera, M. 2012, ApJ, 744, 96Ortolani, S., Bica, E., & Barbuy, B. 2013, MNRAS, 433, 1966Paust, N., Wilson, D., & van Belle, G. 2014, AJ, 148, 19Pawlowski, M. S., Pflamm-Altenburg, J., & Kroupa, P. 2012, MNRAS,
423, 1109Plummer, H. C. 1911, MNRAS, 71, 460Rossetto, B. M., Santiago, B. X., Girardi, L., et al. 2011, AJ, 141, 185Ryan-Weber, E. V., Begum, A., Oosterloo, T., et al. 2008, MNRAS, 384, 535Rykoff, E. S., Rozo, E., Busha, M. T., et al. 2014, ApJ, 785, 104Sakamoto, T., & Hasegawa, T. 2006, ApJL, 653, L29Schlafly, E. F., Finkbeiner, D. P., Jurić, M., et al. 2012, ApJ, 756, 158Schlegel, D. J., Finkbeiner, D. P., & Davis, M. 1998, ApJ, 500, 525Sevilla, I., Armstrong, R., Bertin, E., et al. 2011, arXiv:1109.6741Simon, J. D., & Geha, M. 2007, ApJ, 670, 313Simon, J. D., Geha, M., Minor, Q. E., et al. 2011, ApJ, 733, 46Soumagnac, M. T., Abdalla, F. B., Lahav, O., et al. 2013, arXiv:1306.5236Spekkens, K., Urbancic, N., Mason, B. S., Willman, B., & Aguirre, J. E. 2014,
ApJL, 795, L5Swanson, M. E. C., Tegmark, M., Hamilton, A. J. S., & Hill, J. C. 2008,
MNRAS, 387, 1391Tollerud, E. J., Bullock, J. S., Strigari, L. E., & Willman, B. 2008, ApJ,
688, 277van den Bergh, S. 2008, AJ, 135, 1731Walker, M. G., Belokurov, V., Evans, N. W., et al. 2009, ApJL, 694, L144Walsh, S. M., Jerjen, H., & Willman, B. 2007, ApJL, 662, L83Walsh, S. M., Willman, B., & Jerjen, H. 2009, AJ, 137, 450Whiting, A. B., Hau, G. K. T., Irwin, M., & Verdugo, M. 2007, AJ, 133, 715Willman, B., Geha, M., Strader, J., et al. 2011, AJ, 142, 128Willman, B., & Strader, J. 2012, AJ, 144, 76Willman, B., Blanton, M. R., West, A. A., et al. 2005a, AJ, 129, 2692Willman, B., Dalcanton, J. J., Martinez-Delgado, D., et al. 2005b, ApJL,
626, L85Wolf, J., Martinez, G. D., Bullock, J. S., et al. 2010, MNRAS, 406, 1220Zucker, D. B., Belokurov, V., Evans, N. W., et al. 2006a, ApJL, 650, L41Zucker, D. B., Belokurov, V., Evans, N. W., et al. 2006b, ApJL, 643, L103
16
The Astrophysical Journal, 807:50 (16pp), 2015 July 1 Bechtol et al.