eiip vol iii, ch 8: industrial surface coatings
TRANSCRIPT

VOLUME III: CHAPTER 8
INDUSTRIAL SURFACE COATING
September 1997
Prepared by:TRC Environmental Corporation
Prepared for:Area Sources CommitteeEmission Inventory Improvement Program

DISCLAIMER
As the Environmental Protection Agency has indicated in Emission Inventory ImprovementProgram (EIIP) documents, the choice of methods to be used to estimate emissions depends onhow the estimates will be used and the degree of accuracy required. Methods using site-specificdata are preferred over other methods. These documents are non-binding guidance and not rules. EPA, the States, and others retain the discretion to employ or to require other approaches thatmeet the requirements of the applicable statutory or regulatory requirements in individualcircumstances.
ACKNOWLEDGEMENT
This document was prepared by TRC Environmental Corporation for the Area SourcesCommittee of the Emission Inventory Improvement Program and for Charles Mann of the AirPollution Prevention and Control Division, U.S. Environmental Protection Agency. Members ofthe Area Sources Committee contributing to the preparation of this document are:
Charles Mann, Air Pollution Prevention and Control Division, U.S. Environmental Protection AgencyCarolyn Lozo, California Air Resources BoardKwame Agyei, Puget Sound Air Pollution Control AgencyMike Fishburn, Texas Natural Resource Conservation CommissionGwen Judson, Wisconsin Department of Natural ResourceCharles Masser, Air Pollution Prevention and Control Division, U.S. Environmental Protection AgencyLinda Murchison, California Air Resources BoardSally Otterson, Washington Department of EcologyLee Tooly, Emission Factor and Inventory Group, U.S. Environmental Protection AgencyJim Wilkinson, Maryland Department of the Environment
iv EIIP Volume III
CONTENTSSection Page
1 Introduction . . . . . . . . . . . . . . . . . . . . . . . . . . . . . . . . . . . . . . . . . . . . . . . . . . . . . . . . 8.1-1
2 Source Category Description . . . . . . . . . . . . . . . . . . . . . . . . . . . . . . . . . . . . . . . . . . . 8.2-1
2.1 Category Description . . . . . . . . . . . . . . . . . . . . . . . . . . . . . . . . . . . . . . . . . . . 8.2-1
2.2 Process Description and Emission Sources . . . . . . . . . . . . . . . . . . . . . . . . . . 8.2-2
2.3 Factors Influencing Emissions . . . . . . . . . . . . . . . . . . . . . . . . . . . . . . . . . . . . 8.2-2
2.4 Control Techniques . . . . . . . . . . . . . . . . . . . . . . . . . . . . . . . . . . . . . . . . . . . . 8.2-8
3 Overview of Available Methods . . . . . . . . . . . . . . . . . . . . . . . . . . . . . . . . . . . . . . . . 8.3-1
3.1 Emission Estimation Methodologies . . . . . . . . . . . . . . . . . . . . . . . . . . . . . . . 8.3-13.1.1 Available Methodologies . . . . . . . . . . . . . . . . . . . . . . . . . . . . . . . . . . . 8.3-13.1.2 Data Needs . . . . . . . . . . . . . . . . . . . . . . . . . . . . . . . . . . . . . . . . . . . . . . 8.3-2
3.2 Projecting Emissions . . . . . . . . . . . . . . . . . . . . . . . . . . . . . . . . . . . . . . . . . . . 8.3-5
4 Preferred Method for Estimating Emissions . . . . . . . . . . . . . . . . . . . . . . . . . . . . . . . 8.4-1
5 Alternative Methods for Estimating Emissions . . . . . . . . . . . . . . . . . . . . . . . . . . . . . 8.5-1
5.1 Alternative Method 1 - Default Per Employee Factors . . . . . . . . . . . . . . . . . 8.5-1
5.2 Alternative Method 2 - Per Capita Emission Factor . . . . . . . . . . . . . . . . . . . 8.5-3
6 Quality Assurance/Quality Control (QA/QC) . . . . . . . . . . . . . . . . . . . . . . . . . . . . . . 8.6-1
6.1 Emission Estimate Quality Indicators . . . . . . . . . . . . . . . . . . . . . . . . . . . . . . 8.6-16.1.1 Data Attribute Rating System (DARS) Scores . . . . . . . . . . . . . . . . . . 8.6-16.1.2 Sources of Uncertainty . . . . . . . . . . . . . . . . . . . . . . . . . . . . . . . . . . . . . 8.6-3
7 Data Coding Procedures . . . . . . . . . . . . . . . . . . . . . . . . . . . . . . . . . . . . . . . . . . . . . . . 8.7-1
7.1 Process and Control Codes . . . . . . . . . . . . . . . . . . . . . . . . . . . . . . . . . . . . . . . . . 8.7-1
8 References . . . . . . . . . . . . . . . . . . . . . . . . . . . . . . . . . . . . . . . . . . . . . . . . . . . . . . . . . 8.8-1
vEIIP Volume III
TABLESPage
8.2-1 Principal Industrial Surface Coating SIC . . . . . . . . . . . . . . . . . . . . . . . . . . . . . . . . . . 8.2-3
8.2-2 1992 Manufacturing Industry Surface Coating Consumption . . . . . . . . . . . . . . . . . . 8.2-6
8.2-3 Other Industries That May Consume Surface Coatings . . . . . . . . . . . . . . . . . . . . . . . 8.2-7
8.3-1 Preferred and Alternative Methods for Estimating Emissions fromSmall Industrial Surface Coating Operations . . . . . . . . . . . . . . . . . . . . . . . . . . . . . . . 8.3-2
8.3-2 Data Elements Needed for Each Method . . . . . . . . . . . . . . . . . . . . . . . . . . . . . . . . . . 8.3-3
8.5-1 National Default Per Employee Emission Factors (EPA, 1991) . . . . . . . . . . . . . . . . 8.5-2
8.5-2 National Default Per Capita VOC Emission Factors . . . . . . . . . . . . . . . . . . . . . . . . . 8.5-4
8.6-1 Preferred Method DARS Scores: Area-Specific per Employee Factor . . . . . . . . . . . 8.6-4
8.6-2 Alternative Method 1 DARS Scores: National Default per Employee Factor . . . . . . 8.6-4
8.6-3 Alternative Method 2 DARS Scores: National Default per Capita Factor . . . . . . . . 8.6-5
8.7-1 AMS Codes for the Industrial Surface Coating Category . . . . . . . . . . . . . . . . . . . . . 8.7-2
8.7-2 AIRS Control Device Codes . . . . . . . . . . . . . . . . . . . . . . . . . . . . . . . . . . . . . . . . . . . 8.7-3

CHAPTER 8 - INDUSTRIAL SURFACE COATING 9/26/97
vi EIIP Volume III
This page is intentionally left blank.
8.1-1EIIP Volume III
1
INTRODUCTIONThis chapter describes the procedures and recommended approaches for estimating emissionsfrom small industrial surface coating operations. Section 2 of this chapter contains a generaldescription of the small industrial surface coating category and an overview of available controltechnologies. Section 3 provides an overview of available emission estimation methods. Section 4 presents the preferred method for estimating emission from small industrial surfacecoating, and Section 5 presents the alternative emission estimation techniques. Quality assuranceissues and emission estimate quality indicators for the methods presented in this chapter arediscussed in Section 6. Data coding procedures are discussed in Section 7. Section 8 containsreferences used for this chapter.

CHAPTER 8 - INDUSTRIAL SURFACE COATING 9/26/97
8.1-2 EIIP Volume III
This page is intentionally left blank.

8.2-1EIIP Volume III
2
SOURCE CATEGORY DESCRIPTION
2.1 CATEGORY DESCRIPTION
Surface coating operations involve applying a thin layer of coating (e.g., paint, lacquer, enamel,varnish, etc.) to an object for decorative or protective purposes. The surface coating productsinclude either a water-based or solvent-based liquid carrier that generally evaporates in the dryingor curing process. In 1989, approximately 3.8 billion pounds of organic solvents, roughly one-third of all solvents purchased that year, were used in surface coating operations. These solventswere used both as carriers for coatings and to clean up coating equipment (EPA, 1991).
The use of surface coatings by manufacturing industries and other sectors of the economy ispervasive. Applications include: (1) coatings that are applied during the manufacture of a widevariety of products by Original Equipment Manufacturers (OEMs) including furniture, cans,automobiles, other transportation equipment, machinery, appliances, metal coils, flat wood, wire,and other miscellaneous products, (2) architectural coatings, and (3) special purpose coatingsused for applications such as maintenance operations at industrial and other facilities, autorefinishing, traffic paints, marine finishes, and aerosol sprays. For area source purposes, thesmall industrial surface coating category includes OEM applications, some marine coatings, andmaintenance coatings not accounted for by point sources. This category does not includearchitectural surface coatings, traffic markings, automobile refinishing, or aerosols. Thesecategories are covered in other EIIP area source chapters. Architectural coatings are covered inChapter 3; graphic arts in Chapter 7; auto refinishing in Chapter 13; traffic markings in Chapter14; and aerosols in Chapter 5, which covers consumer and commercial solvent use.
Ideally, all industrial surface coating facilities would be inventoried as point sources. Preferredand alternative methods for estimating point source emissions from industrial surface coatingoperations are given in EIIP Volume II, Chapter 7. That chapter also includes more detaileddiscussion of surface coatings technology and controls, as well as process descriptions forindustries having significant point source emissions. As a practical matter, it is not usuallypossible to account for all industrial surface coating facilities as point sources. Although themajority of industrial surface coating emissions may be inventoried as point sources, remainingemissions of volatile organic compounds (VOCs) and hazardous air pollutants (HAPs) fromindustrial surface coating operations must be accounted for as area sources. Since the use ofsurface coatings by manufacturing industries is so widespread, it is extremely difficult to identifyall of the industries in which coating materials are consumed. This makes the job of compiling atruly complete and accurate area source inventory for this category a difficult one. The following
CHAPTER 8 - INDUSTRIAL SURFACE COATING 9/26/97
8.2-2 EIIP Volume III
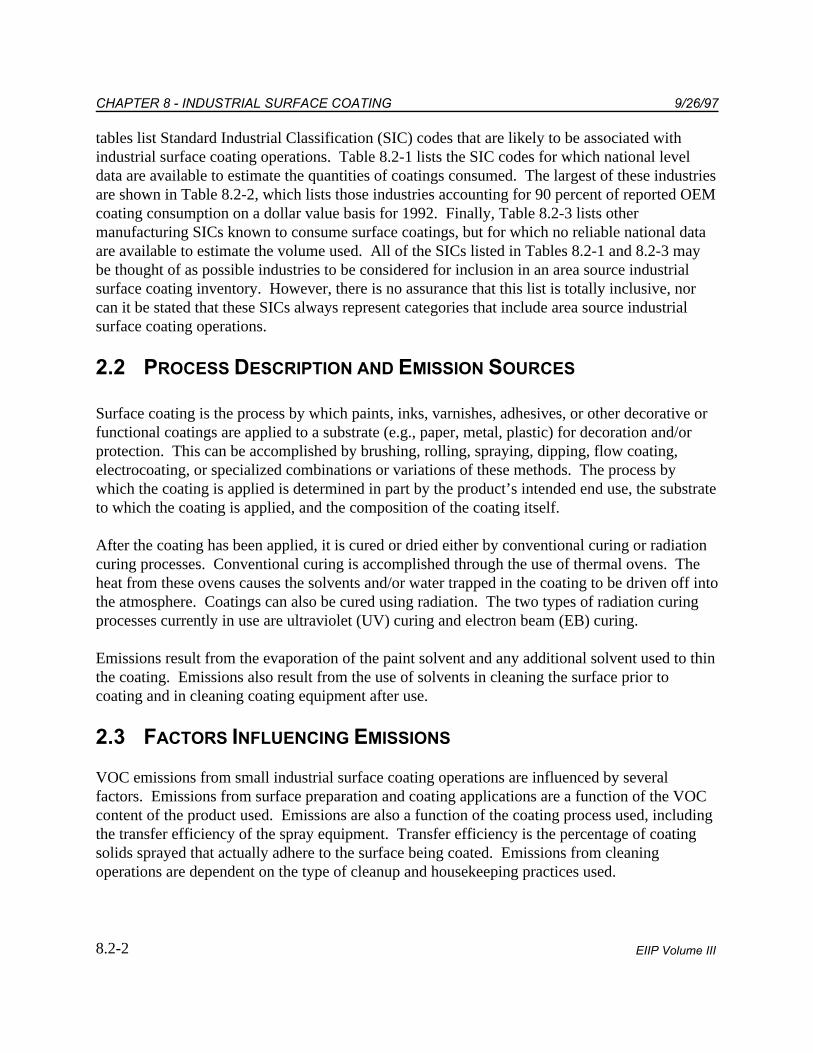
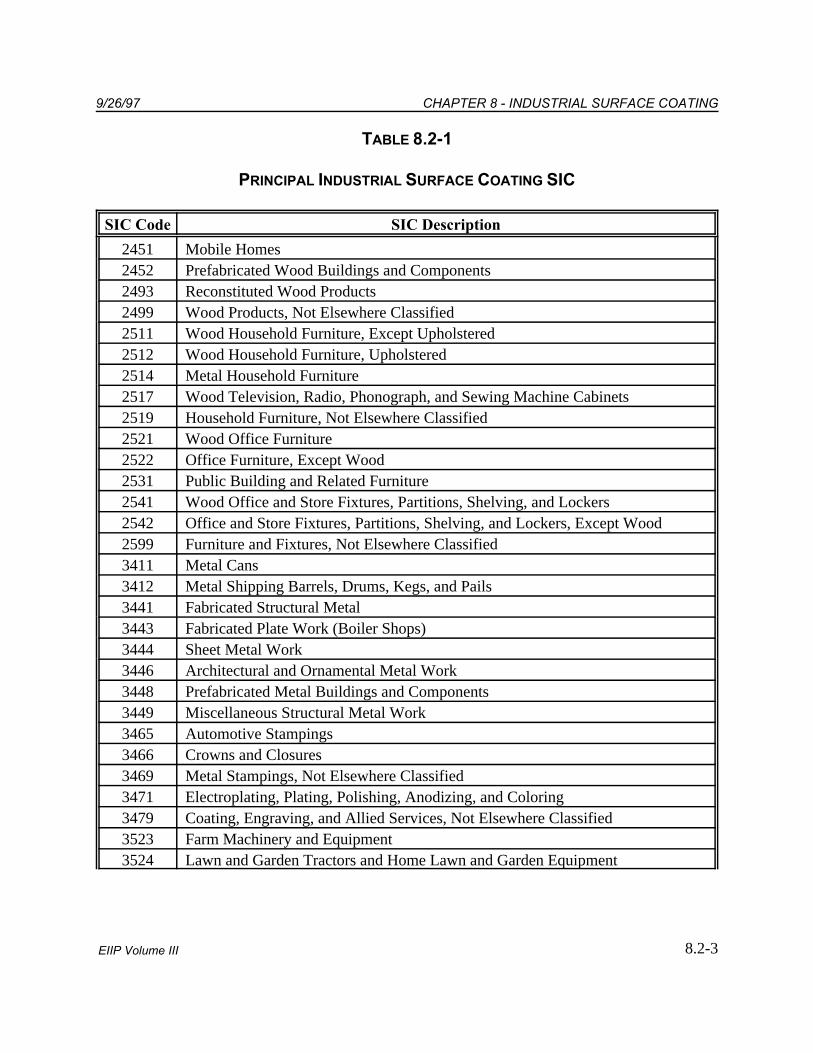
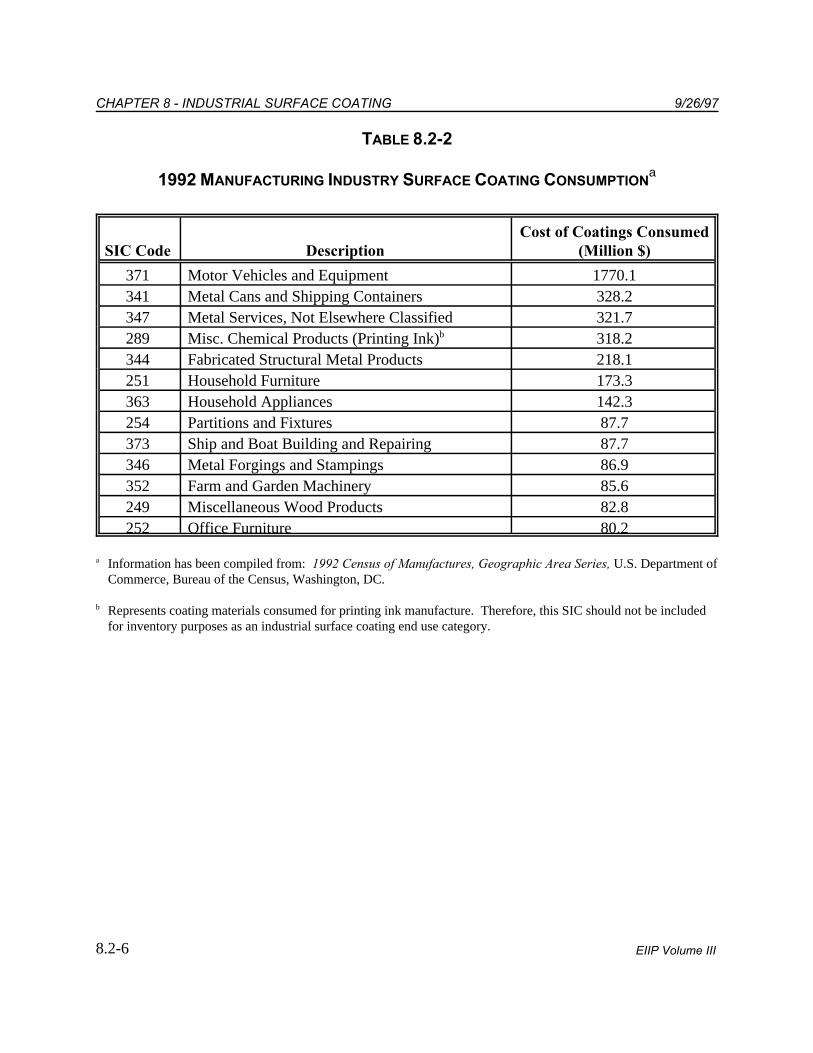
tables list Standard Industrial Classification (SIC) codes that are likely to be associated with industrial surface coating operations. Table 8.2-1 lists the SIC codes for which national leveldata are available to estimate the quantities of coatings consumed. The largest of these industriesare shown in Table 8.2-2, which lists those industries accounting for 90 percent of reported OEMcoating consumption on a dollar value basis for 1992. Finally, Table 8.2-3 lists othermanufacturing SICs known to consume surface coatings, but for which no reliable national dataare available to estimate the volume used. All of the SICs listed in Tables 8.2-1 and 8.2-3 maybe thought of as possible industries to be considered for inclusion in an area source industrialsurface coating inventory. However, there is no assurance that this list is totally inclusive, norcan it be stated that these SICs always represent categories that include area source industrialsurface coating operations.
2.2 PROCESS DESCRIPTION AND EMISSION SOURCES
Surface coating is the process by which paints, inks, varnishes, adhesives, or other decorative orfunctional coatings are applied to a substrate (e.g., paper, metal, plastic) for decoration and/orprotection. This can be accomplished by brushing, rolling, spraying, dipping, flow coating,electrocoating, or specialized combinations or variations of these methods. The process bywhich the coating is applied is determined in part by the product’s intended end use, the substrateto which the coating is applied, and the composition of the coating itself.
After the coating has been applied, it is cured or dried either by conventional curing or radiationcuring processes. Conventional curing is accomplished through the use of thermal ovens. Theheat from these ovens causes the solvents and/or water trapped in the coating to be driven off intothe atmosphere. Coatings can also be cured using radiation. The two types of radiation curingprocesses currently in use are ultraviolet (UV) curing and electron beam (EB) curing.
Emissions result from the evaporation of the paint solvent and any additional solvent used to thinthe coating. Emissions also result from the use of solvents in cleaning the surface prior tocoating and in cleaning coating equipment after use.
2.3 FACTORS INFLUENCING EMISSIONS
VOC emissions from small industrial surface coating operations are influenced by severalfactors. Emissions from surface preparation and coating applications are a function of the VOCcontent of the product used. Emissions are also a function of the coating process used, includingthe transfer efficiency of the spray equipment. Transfer efficiency is the percentage of coatingsolids sprayed that actually adhere to the surface being coated. Emissions from cleaningoperations are dependent on the type of cleanup and housekeeping practices used.
9/26/97 CHAPTER 8 - INDUSTRIAL SURFACE COATING
8.2-3EIIP Volume III
TABLE 8.2-1
PRINCIPAL INDUSTRIAL SURFACE COATING SIC
SIC Code SIC Description
2451 Mobile Homes2452 Prefabricated Wood Buildings and Components2493 Reconstituted Wood Products2499 Wood Products, Not Elsewhere Classified2511 Wood Household Furniture, Except Upholstered2512 Wood Household Furniture, Upholstered2514 Metal Household Furniture2517 Wood Television, Radio, Phonograph, and Sewing Machine Cabinets2519 Household Furniture, Not Elsewhere Classified2521 Wood Office Furniture2522 Office Furniture, Except Wood2531 Public Building and Related Furniture2541 Wood Office and Store Fixtures, Partitions, Shelving, and Lockers2542 Office and Store Fixtures, Partitions, Shelving, and Lockers, Except Wood2599 Furniture and Fixtures, Not Elsewhere Classified3411 Metal Cans3412 Metal Shipping Barrels, Drums, Kegs, and Pails3441 Fabricated Structural Metal3443 Fabricated Plate Work (Boiler Shops)3444 Sheet Metal Work3446 Architectural and Ornamental Metal Work3448 Prefabricated Metal Buildings and Components3449 Miscellaneous Structural Metal Work3465 Automotive Stampings3466 Crowns and Closures3469 Metal Stampings, Not Elsewhere Classified3471 Electroplating, Plating, Polishing, Anodizing, and Coloring3479 Coating, Engraving, and Allied Services, Not Elsewhere Classified3523 Farm Machinery and Equipment3524 Lawn and Garden Tractors and Home Lawn and Garden Equipment
CHAPTER 8 - INDUSTRIAL SURFACE COATING 9/26/97
8.2-4 EIIP Volume III
TABLE 8.2-1
(CONTINUED)
SIC Code SIC Description
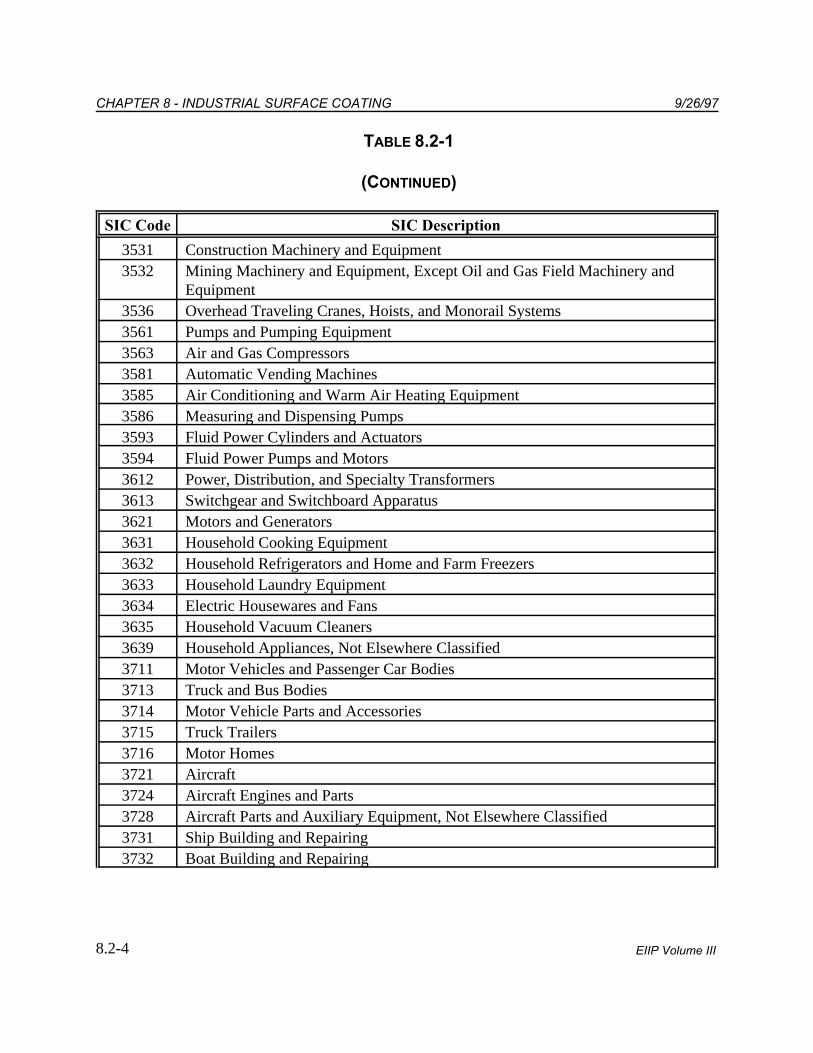
3531 Construction Machinery and Equipment3532 Mining Machinery and Equipment, Except Oil and Gas Field Machinery and
Equipment3536 Overhead Traveling Cranes, Hoists, and Monorail Systems3561 Pumps and Pumping Equipment3563 Air and Gas Compressors3581 Automatic Vending Machines3585 Air Conditioning and Warm Air Heating Equipment3586 Measuring and Dispensing Pumps3593 Fluid Power Cylinders and Actuators3594 Fluid Power Pumps and Motors3612 Power, Distribution, and Specialty Transformers3613 Switchgear and Switchboard Apparatus3621 Motors and Generators3631 Household Cooking Equipment3632 Household Refrigerators and Home and Farm Freezers3633 Household Laundry Equipment3634 Electric Housewares and Fans3635 Household Vacuum Cleaners3639 Household Appliances, Not Elsewhere Classified3711 Motor Vehicles and Passenger Car Bodies3713 Truck and Bus Bodies3714 Motor Vehicle Parts and Accessories3715 Truck Trailers3716 Motor Homes3721 Aircraft3724 Aircraft Engines and Parts3728 Aircraft Parts and Auxiliary Equipment, Not Elsewhere Classified3731 Ship Building and Repairing3732 Boat Building and Repairing
9/26/97 CHAPTER 8 - INDUSTRIAL SURFACE COATING
8.2-5EIIP Volume III
TABLE 8.2-1
(CONTINUED)
SIC Code SIC Description
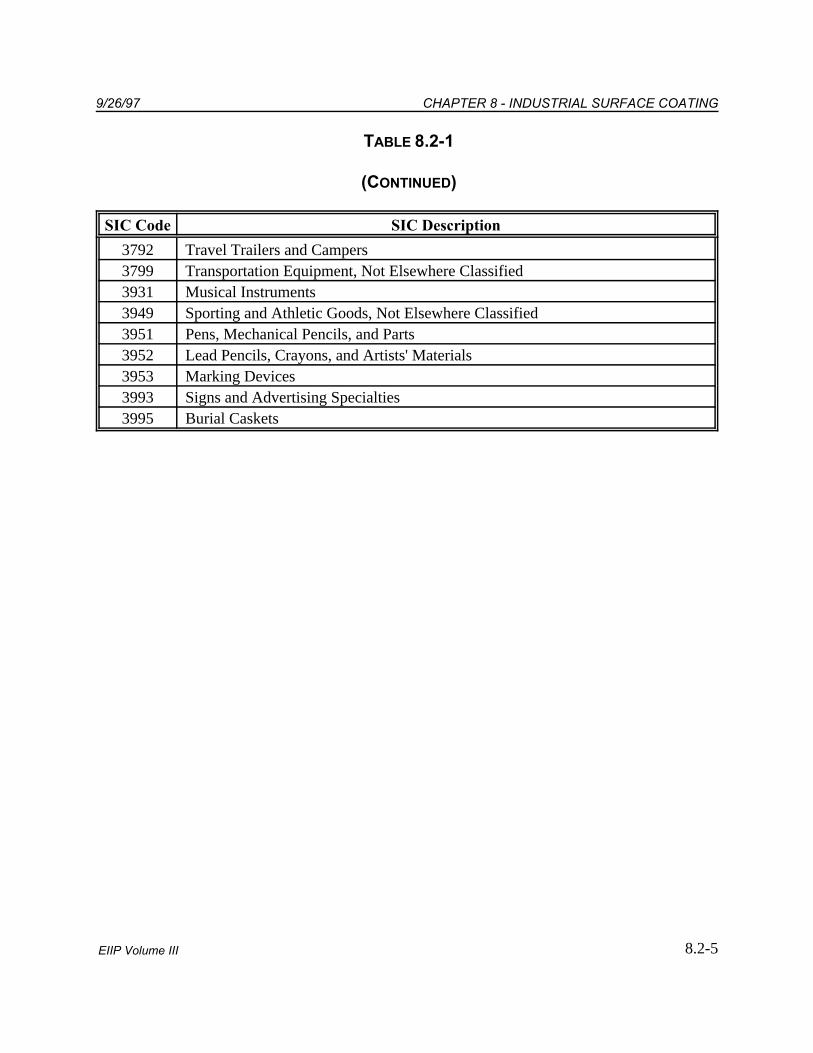
3792 Travel Trailers and Campers3799 Transportation Equipment, Not Elsewhere Classified3931 Musical Instruments3949 Sporting and Athletic Goods, Not Elsewhere Classified3951 Pens, Mechanical Pencils, and Parts3952 Lead Pencils, Crayons, and Artists' Materials3953 Marking Devices3993 Signs and Advertising Specialties3995 Burial Caskets
CHAPTER 8 - INDUSTRIAL SURFACE COATING 9/26/97
8.2-6 EIIP Volume III
TABLE 8.2-2
1992 MANUFACTURING INDUSTRY SURFACE COATING CONSUMPTIONa
SIC Code Description (Million $)Cost of Coatings Consumed
371 Motor Vehicles and Equipment 1770.1341 Metal Cans and Shipping Containers 328.2347 Metal Services, Not Elsewhere Classified 321.7289 Misc. Chemical Products (Printing Ink) 318.2b
344 Fabricated Structural Metal Products 218.1251 Household Furniture 173.3363 Household Appliances 142.3254 Partitions and Fixtures 87.7373 Ship and Boat Building and Repairing 87.7346 Metal Forgings and Stampings 86.9352 Farm and Garden Machinery 85.6249 Miscellaneous Wood Products 82.8252 Office Furniture 80.2
Information has been compiled from: 1992 Census of Manufactures, Geographic Area Series, U.S. Department ofa
Commerce, Bureau of the Census, Washington, DC.
Represents coating materials consumed for printing ink manufacture. Therefore, this SIC should not be included b
for inventory purposes as an industrial surface coating end use category.

9/26/97 CHAPTER 8 - INDUSTRIAL SURFACE COATING
8.2-7EIIP Volume III
TABLE 8.2-3
OTHER INDUSTRIES THAT MAY CONSUME SURFACE COATINGS
SIC Code SIC Description
2436 Softwood Veneer and Plywood262 Paper Mills263 Paperboard Mills265 Paperboard Containers and Boxes3069 Fabricated Rubber Products, Not Elsewhere Classified308 Miscellaneous Plastic Products, Not Elsewhere Classified331 Blast Furnace and Basic Steel Products3433 Heating Equipment, Except Electric3494 Valves and Pipe Fittings, Not Elsewhere Classified3452 Bolts, Nuts, Rivets, and Washers364 Electric Lighting and Wiring Equipment366 Communications Equipment367 Electronic Components and Accessories3812 Search and Navigation Equipment382 Measuring and Controlling Devices384 Medical Instruments and Supplies3861 Photographic Equipment and Supplies3942 Dolls and Stuffed Toys3944 Games, Toys, and Children’s Vehicles
CHAPTER 8 - INDUSTRIAL SURFACE COATING 9/26/97
8.2-8 EIIP Volume III
2.4 CONTROL TECHNIQUES
The main approaches for reducing VOC emissions from small industrial surface coatingoperations are (1) use of lower-VOC coatings, (2) use of enclosed cleaning devices, and (3)increased transfer efficiency. Other housekeeping activities can also be used to reduce emissionsfrom small industrial surface coating operations. These activities include using tight-fittingcontainers, reducing spills, mixing paint to need, providing operator training, maintaining rigidcontrol of inventory, using proper cleanup methods, etc.
Regulations designed to reduce VOC emissions have led to the development of high-solids andpowder coatings, as well as increased use of water-based coatings. Although water-basedcoatings include some organic solvents, water makes up the main carrier component (generally atleast 80 percent) in these formulations.
8.3-1EIIP Volume III
3
OVERVIEW OF AVAILABLE METHODS
3.1 EMISSION ESTIMATION METHODOLOGIES
There are several methodologies available for calculating emissions from small industrial surfacecoating operations. The selection of a method to use depends on the degree of accuracy requiredin the estimate, the available data, and the available resources. This section discusses themethods available for estimating emissions from small industrial surface coating operations andidentifies the preferred method for this category.
3.1.1 AVAILABLE METHODOLOGIES
Volatile Organic Compounds
Methods available for estimating emissions from small industrial surface coating operationsinclude the following: (1) using SIC-specific, inventory area-specific per employee emissionfactors; (2) using national default per employee emission factors; and (3) using per capitaemission factors. These methods are summarized in Table 8.3-1. Because of the potentiallylarge number of small industrial surface coating operations within an inventory area and thedifficulty in identifying candidate industries to be surveyed, conducting surveys to collectactivity, product use, and product-specific VOC content data to develop product-specific,site-specific detailed emissions estimates is generally not recommended. A survey methodologyis likely to be too resource intensive for both the facilities surveyed and the inventorying agency.
The preferred method for estimating emissions from small industrial surface coating operationsinvolves developing and applying SIC-specific, inventory area-specific per employee emissionfactors based on reported point source emissions. Other methods for estimating emissions fromthis category include using national default per employee and per capita emission factors. Procedures for the Preparation of Emission Inventories for Carbon Monoxide and Precursors ofOzone, Volume 1 (EPA, 1991) and AP-42 (EPA, 1995) contain per employee and per capitaemission factors for this category.

CHAPTER 8 - INDUSTRIAL SURFACE COATING 9/26/97
8.3-2 EIIP Volume III
TABLE 8.3-1
PREFERRED AND ALTERNATIVE METHODS FOR ESTIMATING
EMISSIONS FROM SMALL INDUSTRIAL SURFACE COATING OPERATIONS
Methods Description
Preferred Method - C Divide total reported point source emissions (by SIC) forSIC-Specific, Area-Specific Per Employee inventory area by total point source employment (by SIC)Factor for inventory area to develop SIC-specific, inventory area-
specific per employee emissions factor. C Subtract total point source employment from total
employment within the SIC to develop total area sourceSIC employment.
C Multiply area source employment by SIC-specific,inventory area-specific employee factor.
Alternative Method 1 - Use national default per employee emission factors and National Default Per Employee Factor number of employees in SIC to estimate emissions.
Alternative Method 2 - Use per capita emission factor and population in inventory Per Capita Factor area to estimate emissions.
Hazardous Air Pollutants
HAP emissions from this source are determined by the same methods discussed above for VOCemissions. Again, conducting a survey to gather specific HAP information may be too resource-intensive for the inventorying agency to undertake. Using the preferred method described above assumes that the coatings and HAP contents used in small facilities are similar to those used andreported by large facilities. The agency may want to verify this assumption with local industryexperts.
3.1.2 DATA NEEDS
Data Elements
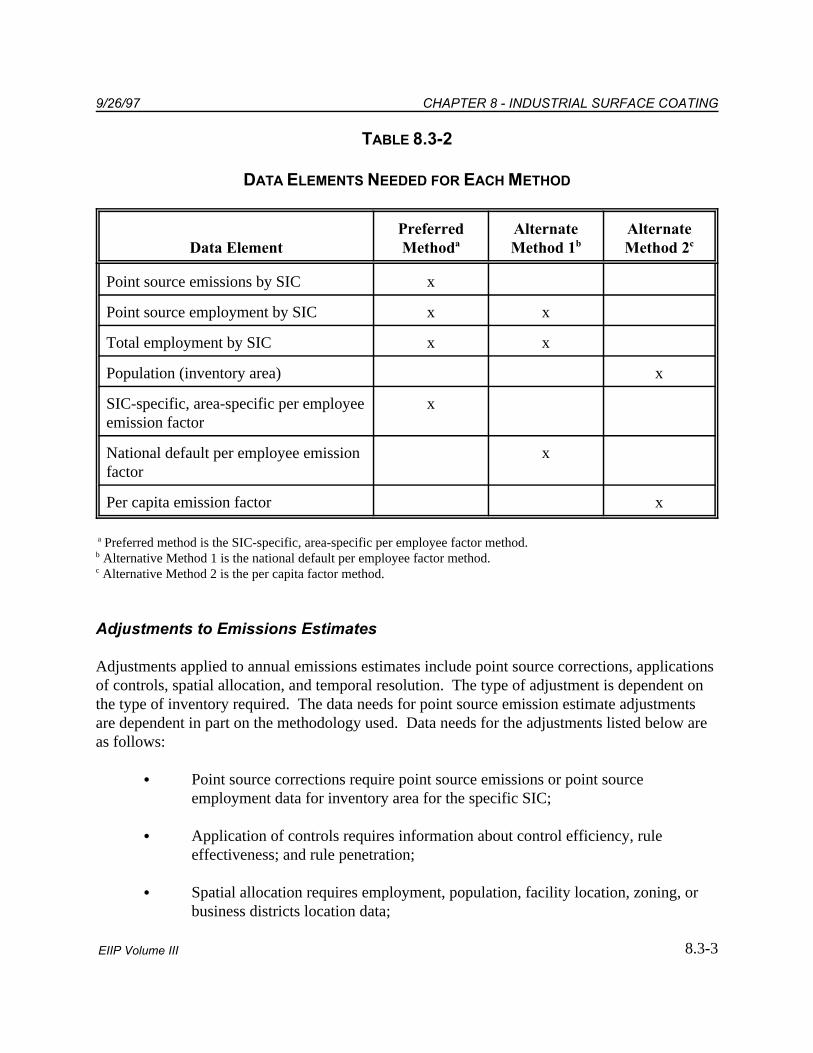
The data elements needed to calculate emission estimates for small industrial surface coatingoperations depend on the methodology used for data collection. Each methodology requiressome measure of activity (or surrogate for activity) and an emission factor. The data elementsneeded for each emission estimation technique are presented in Table 8.3-2.
9/26/97 CHAPTER 8 - INDUSTRIAL SURFACE COATING
8.3-3EIIP Volume III
TABLE 8.3-2
DATA ELEMENTS NEEDED FOR EACH METHOD
Preferred Alternate AlternateData Element Method Method 1 Method 2a b c
Point source emissions by SIC x
Point source employment by SIC x x
Total employment by SIC x x
Population (inventory area) x
SIC-specific, area-specific per employee xemission factor
National default per employee emission xfactor
Per capita emission factor x
Preferred method is the SIC-specific, area-specific per employee factor method. a
Alternative Method 1 is the national default per employee factor method.b
Alternative Method 2 is the per capita factor method.c
Adjustments to Emissions Estimates
Adjustments applied to annual emissions estimates include point source corrections, applicationsof controls, spatial allocation, and temporal resolution. The type of adjustment is dependent onthe type of inventory required. The data needs for point source emission estimate adjustmentsare dependent in part on the methodology used. Data needs for the adjustments listed below areas follows:
C Point source corrections require point source emissions or point sourceemployment data for inventory area for the specific SIC;
C Application of controls requires information about control efficiency, ruleeffectiveness; and rule penetration;
C Spatial allocation requires employment, population, facility location, zoning, orbusiness districts location data;
CAEA ' (UAEA)[1 & (CE)(RP)(RE)]
CAEA ' (EFA)(Q)[1 & (CE)(RP)(RE)]
CHAPTER 8 - INDUSTRIAL SURFACE COATING 9/26/97
8.3-4 EIIP Volume III
(8.3-1)
(8.3-2)
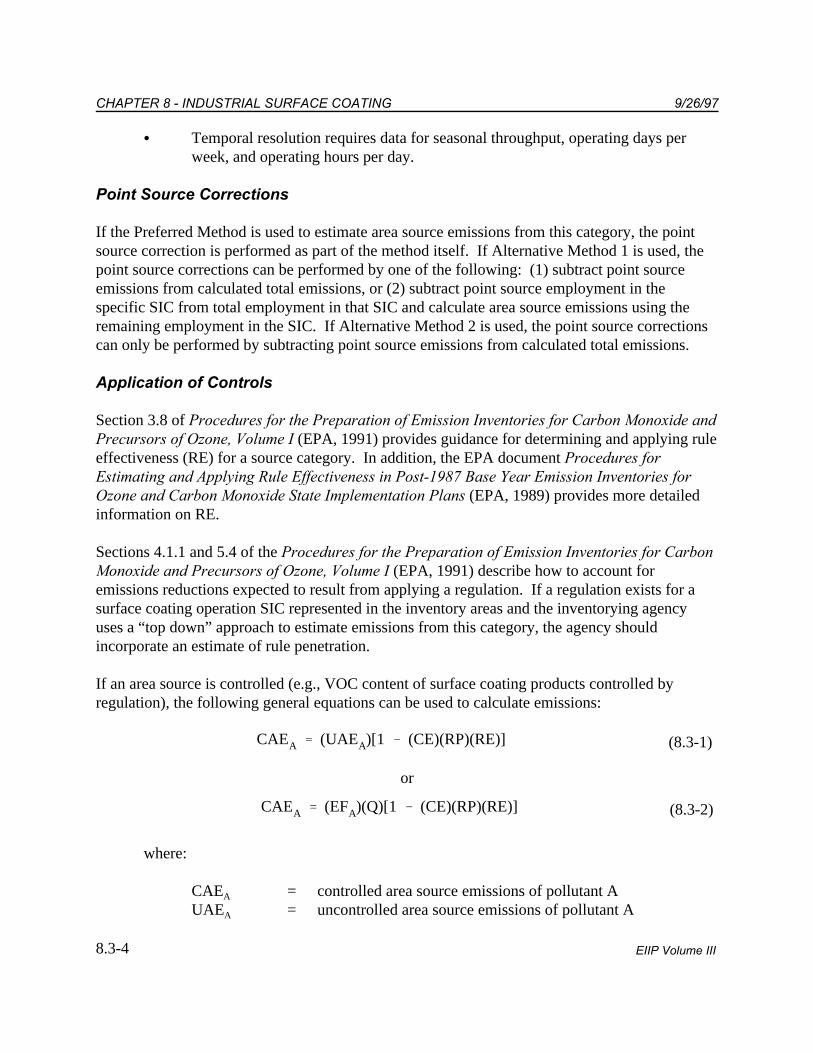
C Temporal resolution requires data for seasonal throughput, operating days perweek, and operating hours per day.
Point Source Corrections
If the Preferred Method is used to estimate area source emissions from this category, the pointsource correction is performed as part of the method itself. If Alternative Method 1 is used, thepoint source corrections can be performed by one of the following: (1) subtract point sourceemissions from calculated total emissions, or (2) subtract point source employment in thespecific SIC from total employment in that SIC and calculate area source emissions using theremaining employment in the SIC. If Alternative Method 2 is used, the point source correctionscan only be performed by subtracting point source emissions from calculated total emissions.
Application of Controls
Section 3.8 of Procedures for the Preparation of Emission Inventories for Carbon Monoxide andPrecursors of Ozone, Volume I (EPA, 1991) provides guidance for determining and applying ruleeffectiveness (RE) for a source category. In addition, the EPA document Procedures forEstimating and Applying Rule Effectiveness in Post-1987 Base Year Emission Inventories forOzone and Carbon Monoxide State Implementation Plans (EPA, 1989) provides more detailedinformation on RE.
Sections 4.1.1 and 5.4 of the Procedures for the Preparation of Emission Inventories for CarbonMonoxide and Precursors of Ozone, Volume I (EPA, 1991) describe how to account foremissions reductions expected to result from applying a regulation. If a regulation exists for asurface coating operation SIC represented in the inventory areas and the inventorying agencyuses a “top down” approach to estimate emissions from this category, the agency shouldincorporate an estimate of rule penetration.
If an area source is controlled (e.g., VOC content of surface coating products controlled byregulation), the following general equations can be used to calculate emissions:
or
where:
CAE = controlled area source emissions of pollutant AA
UAE = uncontrolled area source emissions of pollutant AA

9/26/97 CHAPTER 8 - INDUSTRIAL SURFACE COATING
8.3-5EIIP Volume III
CE = control efficiency/100RP = rule penetration/100RE = rule effectiveness/100EF = emission factor for pollutant AA
Q = activity factor for category
Spatial Allocation
If the emissions estimates are developed using a per employee factor, the spatial allocation ofemissions can be performed according to facility location (if known) as with the point sourceinventory, or with local employment data. The agency should be aware that since location ofsurface coating operations does not necessarily mirror location of population within a county,using population to spatially allocate emissions might be misleading. The inventorying agencywill need to evaluate options for allocating county emissions, such as zoning information, actuallocation data identified from surveys, industry publications, etc.
Temporal Resolution
Seasonal Apportioning. Small industrial surface coating emissions do not demonstratedifferences in activity from season to season (EPA, 1991). The agency may want to evaluatepoint source data to determine actual seasonal activity within the inventory area. Area sourceemissions can be seasonally allocated using the most frequently occurring or average seasonalthroughput values found in the point source inventory for the specific SIC.
Daily Resolution. Small industrial surface coating facilities typically operate five days per week(EPA, 1991). This value may be used if local survey data or point source records on dailyresolution are not available.
3.2 PROJECTING EMISSIONS
The type of surrogate used to project emissions is dependent on the methodology used to developthe initial emissions estimate. In “growing” the emissions estimate, the inventorying agencyshould use the same activity parameter as was used to develop the initial estimate. For example,if a per employee factor was used to develop the initial estimate, growth in employment shouldbe used to develop the projected emissions estimate. The agency should use SIC-specific growthinformation, rather than general business growth projections, if available.
EMISPY ' ORATEBY,O ( EMFPY,pc ( [1 & (CEPY
100)(
RPPY
100)(
REPY
100)] ( GF
CHAPTER 8 - INDUSTRIAL SURFACE COATING 9/26/97
8.3-6 EIIP Volume III
(8.3-3)
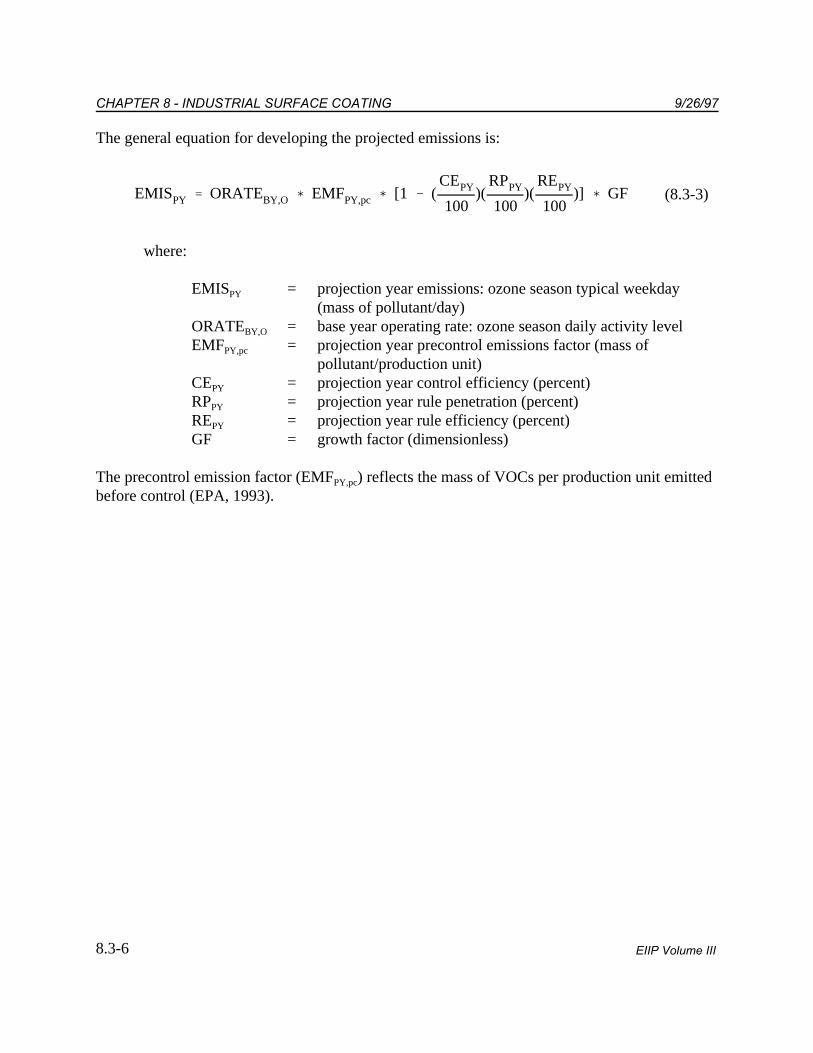
The general equation for developing the projected emissions is:
where:
EMIS = projection year emissions: ozone season typical weekdayPY
(mass of pollutant/day)ORATE = base year operating rate: ozone season daily activity levelBY,O
EMF = projection year precontrol emissions factor (mass ofPY,pc
pollutant/production unit)CE = projection year control efficiency (percent)PY
RP = projection year rule penetration (percent)PY
RE = projection year rule efficiency (percent)PY
GF = growth factor (dimensionless)
The precontrol emission factor (EMF ) reflects the mass of VOCs per production unit emittedPY,pc
before control (EPA, 1993).

8.4-1EIIP Volume III
4
PREFERRED METHOD FOR
ESTIMATING EMISSIONSThe preferred method for estimating emissions from small industrial surface coating operationsuses employment as the activity factor and an inventory area-specific, SIC-specific per employeeemission factor. This method essentially scales up point source surface coating emissions by theratio of total employment to point source employment. This method is most appropriate whenmost surface coating emissions have been accounted for as point sources. Implicit assumptionsare that emissions per employee for area sources are the same as for point sources and thatemissions from SICs for which there are no point sources are insignificant. The followingprocedures should be followed.
(1) Develop an SIC-specific, inventory area-specific per employee emission factor. The totalreported point source emissions for all of the surface coating classification codes (SCCs)reported within an SIC are divided by the point source employment for the SIC. Thismethod may not be practical if emissions, SCCs and SIC codes for each facility are not allavailable.
C Point source surface coating emissions are reported under the 402***** SCC. Table 7.2-1 of EIIP Volume II, Chapter 7 gives a full list of applicable pointsource surface coating SIC codes.
C Emissions by SCC can be obtained from state emissions databases or theAerometric Information Retrieval System (AIRS) Facility Subsystem (AFS). AIRS AFS allows reporting of SIC codes for facilities, but they are not required. State databases may be a more complete source of information for this procedure. Database queries should request a list of facilities’ emissions that are reported forSCC 402*****, and those facilities’ SIC codes. Facilities may list themselves asbeing in more than one SIC code. Inventory preparers will have to use somejudgement to decide which SIC code is the most appropriate match, both for theper employee emission factor, and the point source correction.
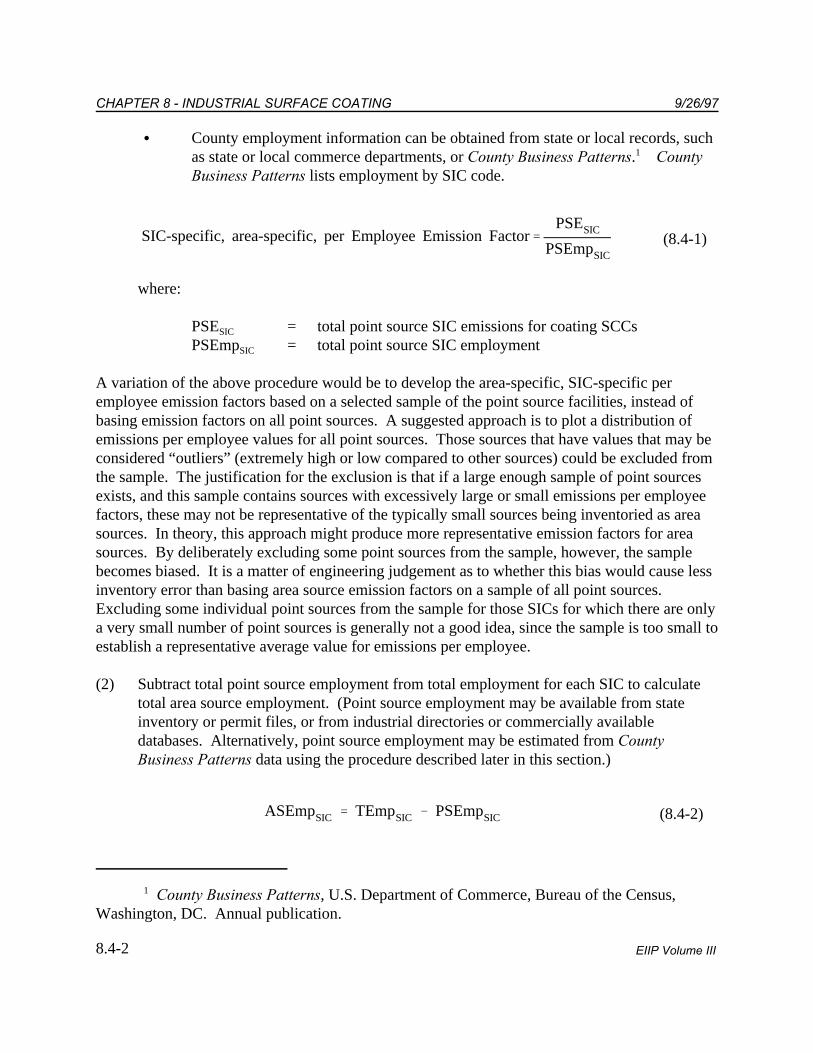
SIC-specific, area-specific, per Employee Emission Factor'PSESIC
PSEmpSIC
ASEmpSIC ' TEmpSIC & PSEmpSIC
CHAPTER 8 - INDUSTRIAL SURFACE COATING 9/26/97
County Business Patterns, U.S. Department of Commerce, Bureau of the Census,1
Washington, DC. Annual publication.
8.4-2 EIIP Volume III
(8.4-1)
(8.4-2)
C County employment information can be obtained from state or local records, suchas state or local commerce departments, or County Business Patterns. County1
Business Patterns lists employment by SIC code.
where:
PSE = total point source SIC emissions for coating SCCsSIC
PSEmp = total point source SIC employmentSIC
A variation of the above procedure would be to develop the area-specific, SIC-specific peremployee emission factors based on a selected sample of the point source facilities, instead ofbasing emission factors on all point sources. A suggested approach is to plot a distribution ofemissions per employee values for all point sources. Those sources that have values that may beconsidered “outliers” (extremely high or low compared to other sources) could be excluded fromthe sample. The justification for the exclusion is that if a large enough sample of point sourcesexists, and this sample contains sources with excessively large or small emissions per employeefactors, these may not be representative of the typically small sources being inventoried as areasources. In theory, this approach might produce more representative emission factors for areasources. By deliberately excluding some point sources from the sample, however, the samplebecomes biased. It is a matter of engineering judgement as to whether this bias would cause lessinventory error than basing area source emission factors on a sample of all point sources. Excluding some individual point sources from the sample for those SICs for which there are onlya very small number of point sources is generally not a good idea, since the sample is too small toestablish a representative average value for emissions per employee.
(2) Subtract total point source employment from total employment for each SIC to calculatetotal area source employment. (Point source employment may be available from stateinventory or permit files, or from industrial directories or commercially availabledatabases. Alternatively, point source employment may be estimated from CountyBusiness Patterns data using the procedure described later in this section.)
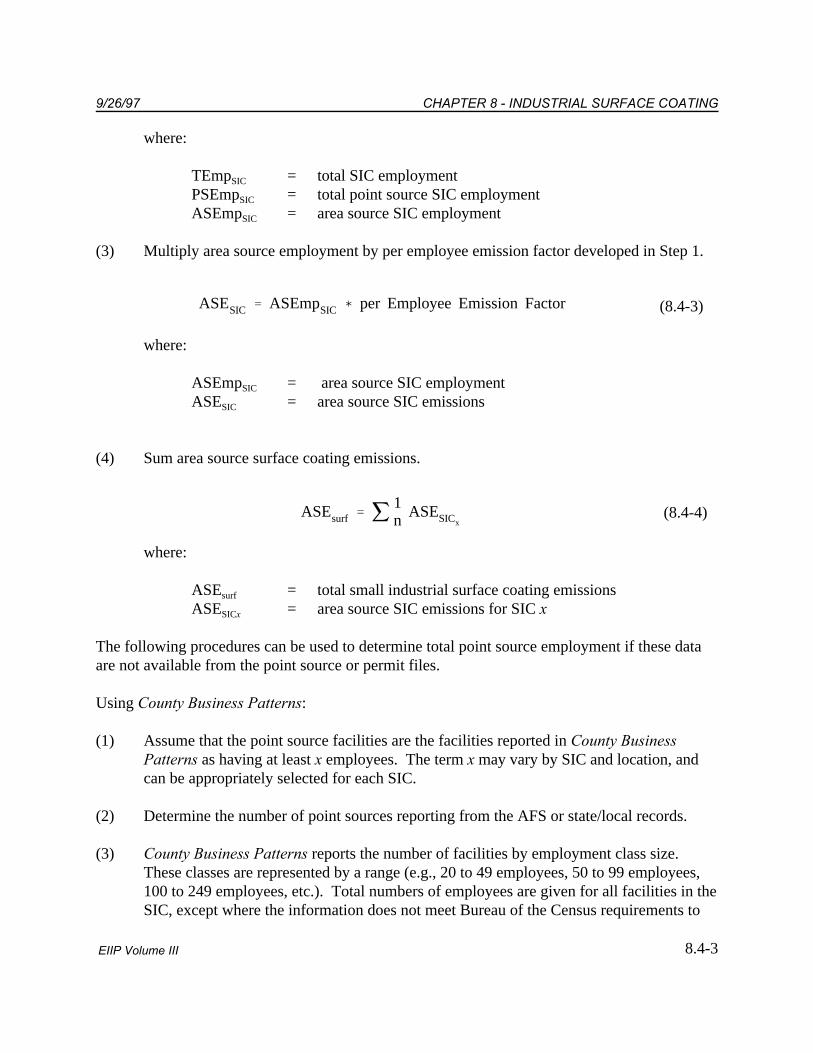
ASESIC ' ASEmpSIC ( per Employee Emission Factor
ASEsurf ' j 1n ASESICx
9/26/97 CHAPTER 8 - INDUSTRIAL SURFACE COATING
8.4-3EIIP Volume III
(8.4-3)
(8.4-4)
where:
TEmp = total SIC employmentSIC
PSEmp = total point source SIC employmentSIC
ASEmp = area source SIC employmentSIC
(3) Multiply area source employment by per employee emission factor developed in Step 1.
where:
ASEmp = area source SIC employmentSIC
ASE = area source SIC emissionsSIC
(4) Sum area source surface coating emissions.
where:
ASE = total small industrial surface coating emissionssurf
ASE = area source SIC emissions for SIC xSICx
The following procedures can be used to determine total point source employment if these dataare not available from the point source or permit files.
Using County Business Patterns:
(1) Assume that the point source facilities are the facilities reported in County BusinessPatterns as having at least x employees. The term x may vary by SIC and location, andcan be appropriately selected for each SIC.
(2) Determine the number of point sources reporting from the AFS or state/local records.
(3) County Business Patterns reports the number of facilities by employment class size. These classes are represented by a range (e.g., 20 to 49 employees, 50 to 99 employees,100 to 249 employees, etc.). Total numbers of employees are given for all facilities in theSIC, except where the information does not meet Bureau of the Census requirements to
CHAPTER 8 - INDUSTRIAL SURFACE COATING 9/26/97
8.4-4 EIIP Volume III
prevent disclosure of data for individual facilities. In these instances, assume that thefacility is at the midpoint of the range, if you cannot estimate the number of employeesfrom the available data.
(4) Using the County Business Patterns size-class distribution and number of point sourcesreporting, sum the number of employees, starting with the largest size class and workingdown until all reporting point sources have been considered.
(5) Area source SIC employment is then estimated by subtracting estimated point source SICemployment from total SIC employment as given in County Business Patterns. Example 8.4-1 presents through a typical calculation.

9/26/97 CHAPTER 8 - INDUSTRIAL SURFACE COATING
8.4-5EIIP Volume III
Example 8.4-1
County X reports 12 point source facilities in SIC yyyy. For County X, the total employmentfrom County Business Patterns for SIC yyyy is 3,281 and the distribution of facilities by sizeclass is:
No. of No. ofSize Class Facilities Employees
1,000 or more 0 --500 to 999 1 not available250 to 499 0 --100 to 249 5 96450 to 99 6 87120 to 49 2 not available10 to 19 1 not available5 to 9 0 --1 to 4 0 --Total 3,281
Point source employment = 750 (one facility in size class 500 to 999,using 750 as the midpoint) + 964 (fivefacilities in size class 100 to 249, with totalemployment of 964) + 450 (6 facilities in sizeclass 50 to 99, using midpoint of 75)
= 2,164
Area source employment is then calculated:
Area Source Employment for SICyyyy in County X = 3,281 - 2,164 = 1,117

CHAPTER 8 - INDUSTRIAL SURFACE COATING 9/26/97
8.4-6 EIIP Volume III
This page is intentionally left blank.
8.5-1EIIP Volume III
5
ALTERNATIVE METHODS FOR
ESTIMATING EMISSIONS
5.1 ALTERNATIVE METHOD 1 - DEFAULT PER EMPLOYEE FACTORS
Alternative Method 1 uses the national default per employee emission factors given in theProcedures (EPA, 1991). These emission factors are presented in Table 8.5-1. Emissions areestimated by either of the following procedures:
(1) Determine point source SIC employment as outlined in the preferred method. Subtractpoint source SIC employment from total SIC employment to determine area source SICemployment. Multiply area source SIC employment by the appropriate default emissionfactor from Table 8.5-1.
(2) Multiply total SIC employment by the appropriate default emission factor from Table 8.5-1. Subtract total point source surface coating emissions for the SIC from total emissions. The result is the area source emissions for the SIC. If the result is negative for an SIC, setthe area source emissions equal to zero. If many negative results occur, use ofprocedure 1 may be a better approach.
Note that these two methods may provide slightly different results because the default emissionfactor may not accurately represent conditions in the inventory area.
The inventorying agency will need to evaluate which procedure is more representative of activityin the inventory area. Information on temporal allocation and seasonal adjustment factors can befound in Chapter 1 of this volume, or the Procedures, (EPA, 1991).
CHAPTER 8 - INDUSTRIAL SURFACE COATING 9/26/97
8.5-2 EIIP Volume III
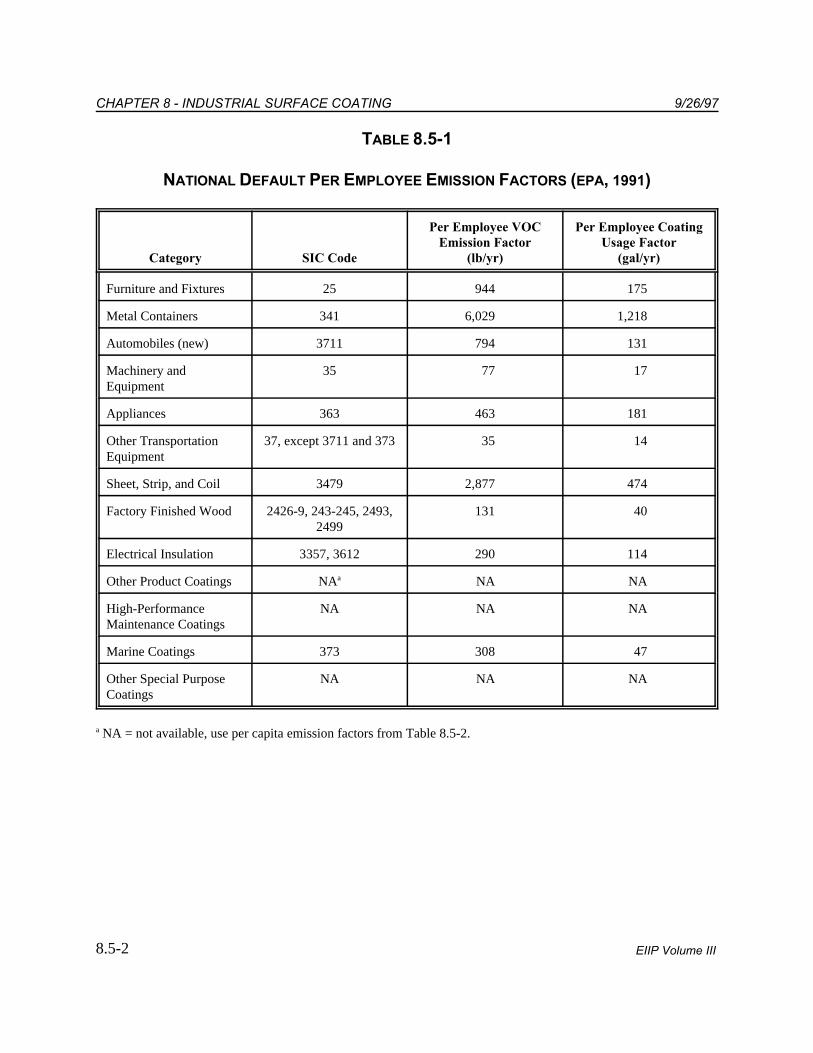
TABLE 8.5-1
NATIONAL DEFAULT PER EMPLOYEE EMISSION FACTORS (EPA, 1991)
Category SIC Code (lb/yr) (gal/yr)
Per Employee VOC Per Employee CoatingEmission Factor Usage Factor
Furniture and Fixtures 25 944 175
Metal Containers 341 6,029 1,218
Automobiles (new) 3711 794 131
Machinery and 35 77 17Equipment
Appliances 363 463 181
Other Transportation 37, except 3711 and 373 35 14Equipment
Sheet, Strip, and Coil 3479 2,877 474
Factory Finished Wood 2426-9, 243-245, 2493, 131 402499
Electrical Insulation 3357, 3612 290 114
Other Product Coatings NA NA NAa
High-Performance NA NA NAMaintenance Coatings
Marine Coatings 373 308 47
Other Special Purpose NA NA NACoatings
NA = not available, use per capita emission factors from Table 8.5-2.a
9/26/97 CHAPTER 8 - INDUSTRIAL SURFACE COATING
8.5-3EIIP Volume III
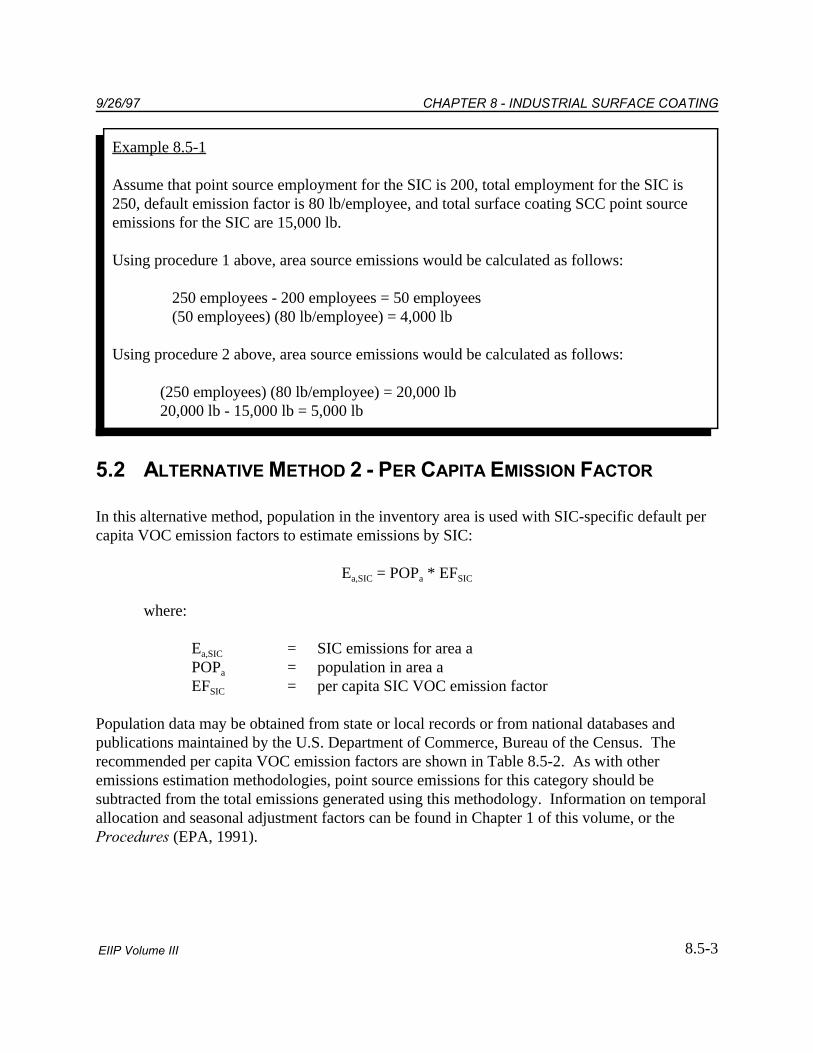
Example 8.5-1
Assume that point source employment for the SIC is 200, total employment for the SIC is250, default emission factor is 80 lb/employee, and total surface coating SCC point sourceemissions for the SIC are 15,000 lb.
Using procedure 1 above, area source emissions would be calculated as follows:
250 employees - 200 employees = 50 employees(50 employees) (80 lb/employee) = 4,000 lb
Using procedure 2 above, area source emissions would be calculated as follows:
(250 employees) (80 lb/employee) = 20,000 lb20,000 lb - 15,000 lb = 5,000 lb
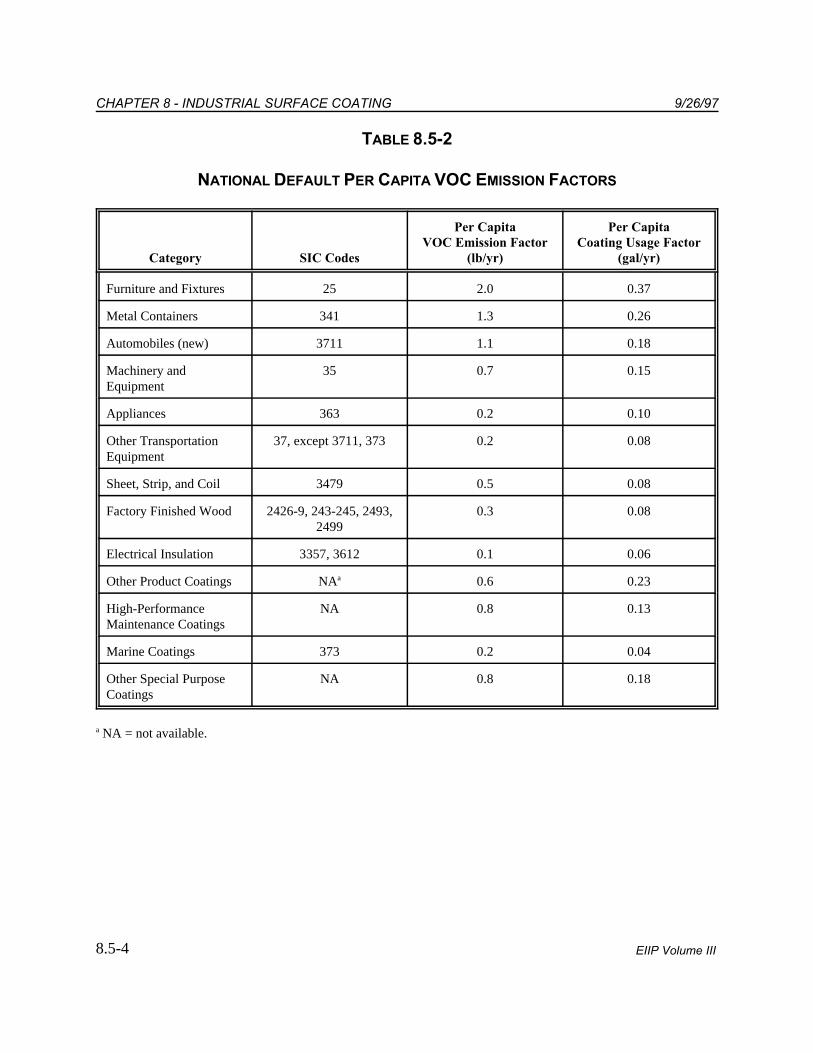
5.2 ALTERNATIVE METHOD 2 - PER CAPITA EMISSION FACTOR
In this alternative method, population in the inventory area is used with SIC-specific default percapita VOC emission factors to estimate emissions by SIC:
E = POP * EFa,SIC a SIC
where:
E = SIC emissions for area aa,SIC
POP = population in area aa
EF = per capita SIC VOC emission factorSIC
Population data may be obtained from state or local records or from national databases andpublications maintained by the U.S. Department of Commerce, Bureau of the Census. Therecommended per capita VOC emission factors are shown in Table 8.5-2. As with otheremissions estimation methodologies, point source emissions for this category should besubtracted from the total emissions generated using this methodology. Information on temporalallocation and seasonal adjustment factors can be found in Chapter 1 of this volume, or theProcedures (EPA, 1991).
CHAPTER 8 - INDUSTRIAL SURFACE COATING 9/26/97
8.5-4 EIIP Volume III
TABLE 8.5-2
NATIONAL DEFAULT PER CAPITA VOC EMISSION FACTORS
Category SIC Codes (lb/yr) (gal/yr)
Per Capita Per CapitaVOC Emission Factor Coating Usage Factor
Furniture and Fixtures 25 2.0 0.37
Metal Containers 341 1.3 0.26
Automobiles (new) 3711 1.1 0.18
Machinery and 35 0.7 0.15Equipment
Appliances 363 0.2 0.10
Other Transportation 37, except 3711, 373 0.2 0.08Equipment
Sheet, Strip, and Coil 3479 0.5 0.08
Factory Finished Wood 2426-9, 243-245, 2493, 0.3 0.082499
Electrical Insulation 3357, 3612 0.1 0.06
Other Product Coatings NA 0.6 0.23a
High-Performance NA 0.8 0.13Maintenance Coatings
Marine Coatings 373 0.2 0.04
Other Special Purpose NA 0.8 0.18Coatings
NA = not available.a
8.6-1EIIP Volume III
6
QUALITY ASSURANCE/QUALITY CONTROL (QA/QC)When using any of the methods for estimating emissions from industrial surface coating, datacompilation should be planned and documented in the inventory QA/QC plan. When using thepreferred method, all assumptions made about facilities that are excluded from the emissionfactor calculations, and the use of emission factors developed from facilities in one specific SICbeing used for a less specific SIC group must be documented and justified. If permit data forfacilities in a particular SIC are not available, employment for that SIC should be checked beforeit is assumed that emissions from the SIC do not need to be calculated. Refer to the discussion ofsurvey planning and survey QA/QC in Chapter 1 of this volume if the preferred method is used.
Data handling for data collected for all of the methods should be planned and documented in theinventory QA/QC plan and does not involve any category-specific issues. Please consult EIIPVolume VI on inventory QA/QC for more information.
6.1 EMISSION ESTIMATE QUALITY INDICATORS
The preferred method results in higher quality estimates than either of the alternative methods,but it requires significantly more effort. The level of effort required to calculate emissionestimates using either of the two national default emission factors is estimated to be between 8and 40 hours. The preferred method will require two to three times as much time. Inventorypreparers will need to decide if the use of the preferred method in their areas will result inenough of an increase in quality to justify the use of this more detailed method. Inventoryplanners may wish to review the number of employees in industrial surface coating-related SICsand the information available through point source reporting for the inventory area to determineif the preferred method can be used. Planners should also investigate potential differences incoating formulations between area source and point source operations.
6.1.1 DATA ATTRIBUTE RATING SYSTEM (DARS) SCORES
The DARS scores for each method are summarized in Tables 8.6-1, 8.6-2, and 8.6-3. A range ofscores is given for the preferred method to reflect variability in the results of the technique. Allscores assume that good QA/QC measures are performed and that no significant deviations from
CHAPTER 8 - INDUSTRIAL SURFACE COATING 9/26/97
8.6-2 EIIP Volume III
the prescribed methods have been made. If these assumptions are not correct, new DARS scoresshould be developed according to the guidance provided in Appendix F of EIIP Volume VI.
The preferred method results in higher DARS scores than either of the alternative methods. The preferred method's DARS scores are between 0.42 and 0.51 and the alternative method DARSscores range between 0.27 and 0.34. The preferred method scores higher on the emissionfactor-related attributes than the alternative methods. The preferred and first alternative methodsuse the same activity factor, and thus have the same activity attribute scores. The secondalternative method, which uses population as an activity surrogate, has a lower activity sourcespecificity score because there may be a low correlation between population and industrialsurface coating activity.
The preferred method compiles existing information from local permits to develop an area sourceemission factor. This method depends on several assumptions concerning point and areaindustrial surface coating sources being true:
C That most surface coating emissions have been accounted for as point sources;
C That emissions for area sources are the same as those for point sources (i.e.,processes and materials are similar, emissions per employee are similar, andcontrols in permitted facilities are similar to those in nonpermitted facilities); and
C That emissions are insignificant from SICs for which there are no permit data.
Ranges in the scoring for the emission factor depend on several issues. The measurement of theemission factor, based on permit data, will vary depending on the original data collection effort’sdata quality objectives and the methods used to measure emissions. Potential measurementmethods can be plant-specific material balance, continuous emission monitoring, sourcesampling, or AP-42 emission factors.
The score for the source specificity attribute addresses the application of a few point sourcefacilities’ emission rates to all of the area sources. Source specificity scores depend on whetherthe assumptions listed above are true. The source specificity score will be reduced considerablyif data collected for one SIC are used for a more general SIC grouping that includes that SIC. The greatest advantage that this method has over the alternatives is that it should address spatialand temporal variability that is problematic for the alternative methods.
Emission factors for the alternative methods are scored lower than the preferred methods becausethey use national-level emission factors based on 1989 solvent usage for all industrial surfacecoatings. Such factors do not take into account controls in place, changes in processes andmaterials since 1989, or differences in climate that may result in different formulations ofcoatings from region to region. Emissions calculated using these factors need to be corrected for
9/26/97 CHAPTER 8 - INDUSTRIAL SURFACE COATING
8.6-3EIIP Volume III
point source emissions in the inventory area. When using the population-based emission factor,spatial attributes are scored lower because the single factor does not reflect any variation indifferent types of industry in the inventory area.
6.1.2 SOURCES OF UNCERTAINTY
The statistics needed to quantify the uncertainty of the preferred and alternative methods areincomplete. Because of the number of different processes used in this source category and theuse of surface coatings in so many different industries, it is a very difficult emission source tocharacterize, and area source methods will necessarily carry a heavy load of uncertainty.
Factors that influence the uncertainty for the preferred method depend on variations betweenlarge and small operations. Processes, materials, controls, and the number of employees actuallyengaged in surface coating may be quite different depending on the size of the operation. Also,assuming that area source emissions will be unimportant if there are no permitted facilities couldresult in a major underestimation for the SIC. Checking the employment for that SIC will reducethe uncertainty of that assumption.
Factors that influence the uncertainty for the two alternative methods are:
C The proportion of coating solvent emitted, as opposed to that assumed from thetop-down national material balance estimate;
C Changes in the solvent usage since 1989, when the emission factor was prepared(see the discussion in Section 6.1.1 about changes since 1989);
C Regional variability in the types of coatings used depending on climate-baseddrying or curing times; and
C The number of employees that are actually involved in the surface coatingoperation at a facility, as opposed to other operations.
For the per capita factor method (Alternative Method Two) only, one additional factor influencesuncertainty: the regional distribution of industries that do surface coating.

CHAPTER 8 - INDUSTRIAL SURFACE COATING 9/26/97
8.6-4 EIIP Volume III
TABLE 8.6-1
PREFERRED METHOD DARS SCORES: AREA-SPECIFIC PER EMPLOYEE FACTOR
Attribute Factor Activity Composite
Scores
Measurement 0.3 - 0.5 0.9 0.27 - 0.45
Source Specificity 0.3 - 0.6 0.5 0.15 - 0.3
Spatial 0.7 - 0.7 0.9 0.63 - 0.63
Temporal 0.8 - 0.8 0.8 0.64 - 0.64
Composite Scores 0.53 - 0.65 0.78 0.42 - 0.51
TABLE 8.6-2
ALTERNATIVE METHOD 1 DARS SCORES: NATIONAL DEFAULT PER
EMPLOYEE FACTOR
Attribute Factor Activity Composite
Scores
Measurement 0.3 0.9 0.27
Source Specificity 0.5 0.5 0.25
Spatial 0.5 0.9 0.45
Temporal 0.5 0.8 0.4
Composite Scores 0.45 0.78 0.34

9/26/97 CHAPTER 8 - INDUSTRIAL SURFACE COATING
8.6-5EIIP Volume III
TABLE 8.6-3
ALTERNATIVE METHOD 2 DARS SCORES: NATIONAL DEFAULT PER CAPITA FACTOR
Attribute Factor Activity Composite
Scores
Measurement 0.3 0.9 0.27
Source Specificity 0.5 0.3 0.15
Spatial 0.3 0.9 0.27
Temporal 0.5 0.8 0.4
Composite Scores 0.40 0.73 0.27

CHAPTER 8 - INDUSTRIAL SURFACE COATING 9/26/97
8.6-6 EIIP Volume III
This page is intentionally left blank.

8.7-1EIIP Volume III
7
DATA CODING PROCEDURESThis section presents the codes available to characterize small industrial surface coating emissionestimates. Consistent categorization and coding will result in greater uniformity amonginventories.
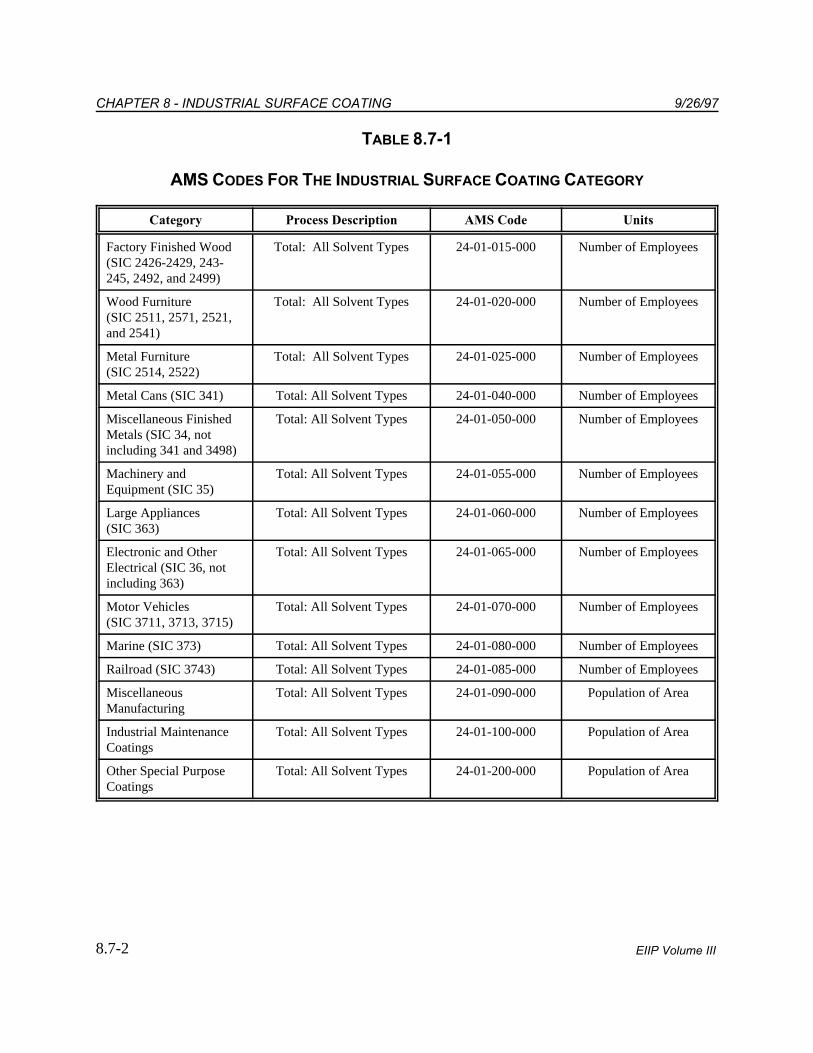
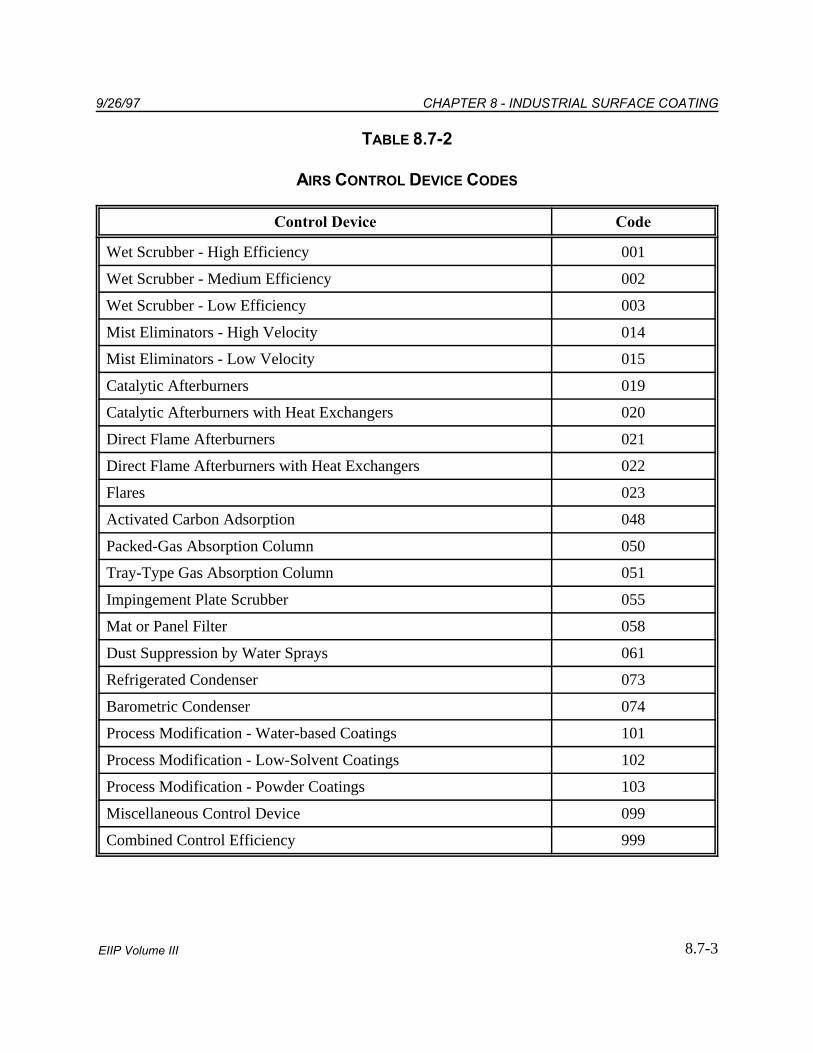
7.1 PROCESS AND CONTROL CODES
The process codes for the industrial surface coating category are shown in Table 8.7-1. Thesecodes are compatible with the AIRS Area and Mobile Source Subsystem (AMS) source categorycodes (EPA, 1994). The control codes for use with AMS are shown in Table 8.7-2. Federal,state, and local regulations can be used as guides to estimate the type of control used and thelevel of efficiency that can be achieved. Be careful to apply only the regulations that specificallyinclude area sources. If a regulation is applicable only to point sources, it should not be assumedthat similar controls exist at area sources. A survey should be conducted to determine if similarcontrols exist at area sources. The “099” control code can be used for miscellaneous controldevices that do not have a unique identification code. The “999” code can be used for acombination of control devices where only the overall control efficiency is known.
CHAPTER 8 - INDUSTRIAL SURFACE COATING 9/26/97
8.7-2 EIIP Volume III
TABLE 8.7-1
AMS CODES FOR THE INDUSTRIAL SURFACE COATING CATEGORY
Category Process Description AMS Code Units
Factory Finished Wood Total: All Solvent Types 24-01-015-000 Number of Employees(SIC 2426-2429, 243-245, 2492, and 2499)
Wood Furniture Total: All Solvent Types 24-01-020-000 Number of Employees(SIC 2511, 2571, 2521,and 2541)
Metal Furniture Total: All Solvent Types 24-01-025-000 Number of Employees(SIC 2514, 2522)
Metal Cans (SIC 341) Total: All Solvent Types 24-01-040-000 Number of Employees
Miscellaneous Finished Total: All Solvent Types 24-01-050-000 Number of EmployeesMetals (SIC 34, notincluding 341 and 3498)
Machinery and Total: All Solvent Types 24-01-055-000 Number of EmployeesEquipment (SIC 35)
Large Appliances Total: All Solvent Types 24-01-060-000 Number of Employees(SIC 363)
Electronic and Other Total: All Solvent Types 24-01-065-000 Number of EmployeesElectrical (SIC 36, notincluding 363)
Motor Vehicles Total: All Solvent Types 24-01-070-000 Number of Employees(SIC 3711, 3713, 3715)
Marine (SIC 373) Total: All Solvent Types 24-01-080-000 Number of Employees
Railroad (SIC 3743) Total: All Solvent Types 24-01-085-000 Number of Employees
Miscellaneous Total: All Solvent Types 24-01-090-000 Population of AreaManufacturing
Industrial Maintenance Total: All Solvent Types 24-01-100-000 Population of AreaCoatings
Other Special Purpose Total: All Solvent Types 24-01-200-000 Population of AreaCoatings
9/26/97 CHAPTER 8 - INDUSTRIAL SURFACE COATING
8.7-3EIIP Volume III
TABLE 8.7-2
AIRS CONTROL DEVICE CODES
Control Device Code
Wet Scrubber - High Efficiency 001
Wet Scrubber - Medium Efficiency 002
Wet Scrubber - Low Efficiency 003
Mist Eliminators - High Velocity 014
Mist Eliminators - Low Velocity 015
Catalytic Afterburners 019
Catalytic Afterburners with Heat Exchangers 020
Direct Flame Afterburners 021
Direct Flame Afterburners with Heat Exchangers 022
Flares 023
Activated Carbon Adsorption 048
Packed-Gas Absorption Column 050
Tray-Type Gas Absorption Column 051
Impingement Plate Scrubber 055
Mat or Panel Filter 058
Dust Suppression by Water Sprays 061
Refrigerated Condenser 073
Barometric Condenser 074
Process Modification - Water-based Coatings 101
Process Modification - Low-Solvent Coatings 102
Process Modification - Powder Coatings 103
Miscellaneous Control Device 099
Combined Control Efficiency 999

CHAPTER 8 - INDUSTRIAL SURFACE COATING 9/26/97
8.7-4 EIIP Volume III
This page is intentionally left blank.

8.8-1EIIP Volume III
8
REFERENCESEPA. 1995. Compilation of Air Pollutant Emission Factors, Volume I: Stationary Point andArea Sources, Fifth Edition, AP-42. U.S. Environmental Protection Agency, Office of AirQuality Planning and Standards, Research Triangle Park, NC.
EPA. 1994. AIRS Database. U.S. Environmental Protection Agency, Office of Air QualityPlanning and Standards, Research Triangle Park, NC.
EPA. 1993. Guidance for Growth Factors, Projections, and Control Strategies for the 15Percent Rate-of-Progress Plans. U.S. Environmental Protection Agency, Office of Air QualityPlanning and Standards, EPA-452/R-93-002. Research Triangle Park, NC.
EPA. 1991. Procedures for the Preparation of Emission Inventories for Carbon Monoxide andPrecursors of Ozone. Volume 1: General Guidance for Stationary Sources. U.S.Environmental Protection Agency, Office of Air Quality Planning and Standards,EPA-450/4-91-016, (NTIS PB92-112168). Research Triangle Park, North Carolina.
EPA. 1989. Procedures for Estimating and Applying Rule Effectiveness in Post-1987 Base YearEmission Inventories for Ozone and Carbon Monoxide State Implementation Plans. U.S.Environmental Protection Agency, Research Triangle Park, NC.

CHAPTER 8 - INDUSTRIAL SURFACE COATING 9/26/97
8.8-2 EIIP Volume III
This page is intentionally left blank.