elastic properties and phase stability of …436911/fulltext02.pdf · elastic properties and phase...
TRANSCRIPT
ELASTIC PROPERTIES AND PHASE STABILITY OF
SHAPE MEMORY ALLOYS FROM
FIRST-PRINCIPLES THEORY
CHUNMEI LI
Doctoral ThesisSchool of Industrial Engineering and Management, Department of
Materials Science and Engineering, KTH, Sweden, 2011
MaterialvetenskapKTH
ISRN KTH/MSE–11/22–SE+AMFY/AVH SE-100 44 StockholmISBN 978-91-7501-063-2 Sweden
Akademisk avhandling som med tillstand av Kungliga Tekniska Hogskolan framlaggestill offentlig granskning for avlaggande av licentiatexamen torsdagen den 16 Sep.2011 kl 14:00 i B2, Materialvetenskap, Kungliga Tekniska Hogskolan,Brinellvagen 23, Stockholm.
c© Chunmei Li, May 2011
Tryck: Universitetsservice US AB
Abstract
Ni-Mn-Ga and In-Tl are two examples of shape memory alloys. Their shape memoryeffect is controlled by the martensitic transformation from the high temperature cu-bic phase to the low temperature tetragonal phase. Experimentally, it was found thatthe martensitic transformation, related to the elastic properties, is highly composition-dependent. In order to better understand the phase transition and facilitate the designof new materials with improved shape memory properties, the atomic scale descriptionof the thermophysical properties of these alloys is needed. Therefore, in the presentthesis, the elastic properties and phase stability of Ni-Mn-Ga and In-Tl shape memoryalloys are investigated by the use of first-principles exact muffin-tin orbitals method incombination with the coherent-potential approximation.
We present a theoretical description of the equilibrium properties of pure In and stan-dard stoichiometric Ni2MnGa alloy with both cubic and tetragonal structures. In In-Tlalloys, all the calculated composition-dependent thermophysical properties: lattice pa-rameter c/a, tetragonal shear modulus C ′ = (C11 − C12)/2, energy difference betweenthe austenitic and martensitic phases, as well as electronic structures are shown to bein line with the experimentally observed lowering of the martensitic transition tem-perature TM with the addition of Tl. For most of the off-stoichiometric Ni2MnGa, theexcess atoms of the rich component prefer to occupy the sublattice of the deficient one,except for the Ga-rich alloys, where the excess Ga atoms have strong tendency to takethe Mn sublattice irrespective of the Mn occupation. In Ni-Mn-Ga-X (X=Fe, Co, andCu) quarternary alloys, Fe atom prefers to occupy the Mn and Ni sublattices even inGa-deficient alloys; Co has strong tendency to occupy the Ni-sublattice in all types ofalloys; Cu atoms always occupy the sublattice of the host elements in deficiency. Formost of the studied Ni-Mn-Ga and Ni-Mn-Ga-X alloys with stable site-occupations, theshear modulus C ′ can be considered as a predictor of the composition dependence ofTM of the alloys: the alloy with larger C ′ than that of the perfect Ni2MnGa generallypossesses lower TM except for Ni2Mn1+xGa1−x and Ni2Mn1−xGaFex. The failure of C ′
as a factor of TM in these two types of alloys may be ascribed that the composition-dependent magnetic interactions and the temperature-dependent C ′, which also playan important role on the martensitic transformation in these alloys. Furthermore, wedemonstrate that a proper account of the temperature and composition dependence ofC ′ gives us reasonable theoretical TM(x) values in Ni2+xMn1−xGa alloys. Also in thistype of Ni-rich and Mn-deficient alloys, by using the Heisenberg model in combinationwith the mean-field approximation, the abnormal trend of experimental magnetic tran-sition temperature TC(x) with respect to the composition x is shown to be well capturedby the theory.
Sammanfattning
Ni-Mn-Ga och In-Tl ar tva exempel pa minnesmetaller. Minneseffekten styrs av enmartensitisk fasomvandling fran den kubiska hogtemperaturfasen till den tetragonalalagtemperaturfasen. Experimentellt har det visat sig att martensitomvandlingen, relat-erat till de elastiska egenskaperna, ar starkt sammasattningsberoende. For att battreforsta fasomvandlingen och underlatta design av nya material med forbattrade min-nesegenskaper, behovs en atomar beskrivning av dessa legeringars termofysikaliskaegenskaper. I denna avhandling undersoks darfor elastiska egenskaper och fasstabilitethos minnesmetaller av Ni-Mn-Ga och In-Tl genom att utnyttja ab-initio metoder baser-ade pa exakta muffin-tin orbitaler kombinerat med coherent-potential approximatio-nen.
Vi presenterar en teoretisk beskrivning av jamviktsegenskaperna i rent In och stokiometrisk Ni2MnGa i bade kubisk och tetragonal struktur. I legeringar av In-Tl ar alla beraknadesammansattningsberoende termofysikaliska egenskaper: gitterparametern c/a, tetrago-nala skjuvmodulen C ′ = (C11−C12)/2, energiskillnaden mellan austenit- och martensit-fasen, samt elektronstrukturen i overenstammelse med den experimentellt observeradesankningen av martensitomvandlingstemperaturen TM med okning av Tl-halten. Forde flesta icke stokiometriska Ni2MnGa, substituerar extra Ni-atomer Mn och extra Mn-atomer Ni. Extra Ga-atomer har dock en tendens att besatta Mn-subgittret oavsett Mn-halten. I kvartenara Ni-Mn-Ga-X (X = Fe, Co och Cu), foredrar Fe-atomomer foredraratt besatta Mn och Ni platser aven i understrokiometriska Ga-legeringar, Co har enstark tendens att besatta Ni-platser i alla typer av legeringar, Cu-atomer alltid upptardet subgitter dar andra atomer saknas. For de flesta studerade legeringarna av Ni-Mn-Ga och Ni-Mn-Ga-X med stabil fordelning mellan gitterplatserna, kan skjuvmodulen C ′
ses som en prediktor for sammansattningsberoendet hos legeringarnas TM : en legeringmed storre C ′ an for Ni2MnGa har i allmanhet lagre TM utom for Ni2Mn1+xGa1−x ochNi2Mn1−xGaFex. Att C ′ inte kan beskriva TM i dessa tva typer av legeringar kan tillskri-vas sammansattningsberoende magnetisk vaxelverkan och temperaturberoendet hosC ′, som bada spelar en viktig roll for martensitomvandlingen i dessa legeringar. Dessu-tom visar vi att om ordentlig ansyn till temperatur- och sammansattningsberoende hosC ′ tas sa erhalles rimliga teoretiska TM(x) varden i Ni2+xMn1−xGa-legeringar. Med hjalpav Heisenbergs modell kombinerat med mean-fieldapproximationen, fangas den exper-imentellt observerade onormala trenden hos den magnetiska omvandlingstemperetau-ren TC(x) med avseende pa sammansattningen x val fangas upp av teorin aven i dennatyp av Ni-rika och Mn-fattiga legeringar.
v
Preface
List of included publications:
I First-principles study of the elastic properties of In-Tl random alloysC. M. Li, Q. M. Hu, R. Yang, B. Johansson, and L. Vitos, Phys. Rev. B 82, 094201(2010).
II Site occupancy, magnetic moments, and elastic constants of off-stoichiometricNi2MnGa from first-principles calculationsQ. M. Hu, C. M. Li, R. Yang, S. E. Kulkova, D. I. Bazhanov, B. Johansson, and L.Vitos, Phys. Rev. B 79, 144112 (2009).
III Magnetoelastic effects in Ni2Mn1+xGa1−x alloys from first-principles calcula-tionsQ. M. Hu, C. M. Li, S. E. Kulkova, R. Yang, B. Johansson, and L. Vitos, Phys. Rev.B 81, 064108 (2010).
IV First-principles investigation of the composition dependent properties of Ni2+xMn1−xGa shape-memory alloysC. M. Li, H. B. Luo, Q. M. Hu, R. Yang, B. Johansson, and L. Vitos, Phys. Rev. B 82,024201 (2010).
V Interplay between temperature and composition effects on the martensitic trans-formation in Ni2+xMn1−xGa alloysC. M. Li, Q. M. Hu, R. Yang, B. Johansson, and L. Vitos, Appl. Phys. Lett. 98, 261903(2011).
VI Temperature dependence of elastic properties of Ni2+xMn1−xGa and Ni2Mn(Ga1−x
Alx) from first-principles studyC. M. Li, H. B. Luo, Q. M. Hu, R. Yang, B. Johansson, and L. Vitos. Submitted toPhys. Rev. B (2011).
VII Site preference and elastic properties of Fe-, Co-, and Cu-doped Ni2MnGa shapememory alloys from first-principlesC. M. Li, H. B. Luo, Q. M. Hu, R. Yang, B. Johansson, and L. Vitos, Phys. Rev. B 84,024206 (2011).

vi
Comment on my own contribution
I All calculations, data analysis, literature survey; the manuscript was written jointly.
II Part of the calculations, data analysis, literature survey.
III Part of the calculations, data analysis, literature survey.
IV All calculations, data analysis, literature survey; the manuscript was written jointly.
V All calculations, data analysis, literature survey; the manuscript was written jointly.
VI All calculations, data analysis, literature survey; the manuscript was written jointly.
VII All calculations, data analysis, literature survey; the manuscript was written jointly.
Contents
Preface v
Contents vii
1 Introduction 1
1.1 Motivation . . . . . . . . . . . . . . . . . . . . . . . . . . . . . . . . . . . . . 1
1.2 Objectives . . . . . . . . . . . . . . . . . . . . . . . . . . . . . . . . . . . . . 3
1.3 Organization of the thesis . . . . . . . . . . . . . . . . . . . . . . . . . . . . 4
2 Shape memory alloys (SMAs) 5
2.1 Shape memory effect (SME) . . . . . . . . . . . . . . . . . . . . . . . . . . . 5
2.2 An overview of Ni-Mn-Ga and In-Tl alloys . . . . . . . . . . . . . . . . . . 7
3 Elastic properties of solids 9
3.1 Static elastic constants . . . . . . . . . . . . . . . . . . . . . . . . . . . . . . 10
3.1.1 Elastic stiffnesses in cubic structure . . . . . . . . . . . . . . . . . . 10
3.1.2 Elastic stiffnesses in tetragonal structure . . . . . . . . . . . . . . . . 11
3.2 Isothermal elastic stiffness constants . . . . . . . . . . . . . . . . . . . . . . 12
3.3 Polycrystalline elastic constants . . . . . . . . . . . . . . . . . . . . . . . . . 13
3.3.1 The Voigt and Reuss bounds, Hill average . . . . . . . . . . . . . . 13
3.3.2 Isotropic polycrystalline aggregates . . . . . . . . . . . . . . . . . . 14
4 Theoretical methodology 15
4.1 Density functional theory (DFT) . . . . . . . . . . . . . . . . . . . . . . . . . 15
4.1.1 The many-body problem . . . . . . . . . . . . . . . . . . . . . . . . 15
vii
viii CONTENTS
4.1.2 Exchange correlation approximation . . . . . . . . . . . . . . . . . . 17
4.2 Exact muffin-tin orbitals (EMTO) method . . . . . . . . . . . . . . . . . . . 18
4.2.1 Exact muffin-tin potential . . . . . . . . . . . . . . . . . . . . . . . . 19
4.2.2 Exact muffin-tin orbitals wave function . . . . . . . . . . . . . . . . 19
4.2.3 The full charge density (FCD) total energy . . . . . . . . . . . . . . 20
4.2.4 Coherent potential approximation (CPA) . . . . . . . . . . . . . . . 21
4.3 Heisenberg model . . . . . . . . . . . . . . . . . . . . . . . . . . . . . . . . . 21
5 In-Tl binary alloys 23
5.1 Elastic properties of pure In . . . . . . . . . . . . . . . . . . . . . . . . . . . 23
5.2 Elastic properties of In1−xTlx alloys . . . . . . . . . . . . . . . . . . . . . . . 25
5.2.1 Equilibrium lattice parameters of In1−xTlx . . . . . . . . . . . . . . . 25
5.2.2 Static elastic constants of In1−xTlx . . . . . . . . . . . . . . . . . . . 26
5.3 Electronic structure . . . . . . . . . . . . . . . . . . . . . . . . . . . . . . . . 28
6 Ni-Mn-Ga ternary alloys 30
6.1 Properties of Ni2MnGa . . . . . . . . . . . . . . . . . . . . . . . . . . . . . . 31
6.2 Site occupancy of off-stoichiometric alloys . . . . . . . . . . . . . . . . . . . 32
6.3 Composition-dependent elastic properties . . . . . . . . . . . . . . . . . . . 34
6.3.1 Composition dependence . . . . . . . . . . . . . . . . . . . . . . . . 35
6.3.2 Correlation between C ′ and TM . . . . . . . . . . . . . . . . . . . . . 37
6.4 Temperature-dependent elastic properties . . . . . . . . . . . . . . . . . . . 37
6.4.1 Temperature dependence . . . . . . . . . . . . . . . . . . . . . . . . 38
6.4.2 Prediction of TM . . . . . . . . . . . . . . . . . . . . . . . . . . . . . 39
6.5 Curie temperature . . . . . . . . . . . . . . . . . . . . . . . . . . . . . . . . . 41
7 Ni-Mn-Ga-X (X=Fe, Co, and Cu) quarternary alloys 42
7.1 Site occupancy . . . . . . . . . . . . . . . . . . . . . . . . . . . . . . . . . . . 42
7.2 Composition-dependent elastic properties . . . . . . . . . . . . . . . . . . . 45
7.2.1 Composition dependence . . . . . . . . . . . . . . . . . . . . . . . . 45
7.2.2 Correlation between C ′ and TM . . . . . . . . . . . . . . . . . . . . . 46
CONTENTS ix
7.2.3 Electronic structure . . . . . . . . . . . . . . . . . . . . . . . . . . . . 48
8 Concluding remarks 51
Acknowledgements 53
Bibliography 54
Supplements 61
Chapter 1
Introduction
The shape memory alloys (SMAs), being one type of functional materials, have beenstudied extensively both experimentally and theoretically because they show two uniquecapabilities: shape memory effect (SME) and superelasticity (SE), which are absent inthe traditional materials. Both SME and SE largely depend on the solid-solid, diffusion-less phase transformation process known as martensitic transformation (MT) from acrystallographically high symmetric parent phase (austenite) to a crystallographicallyless symmetric product phase (martensite) [1, 2, 3]. The MT therefore should be an im-portant character of the SMAs and closely related to other thermophysical properties. Inthe present thesis, we will study the martensitic phase transition and elastic propertiesof two kinds of SMAs: Ni-Mn-Ga and In-Tl.
In this chapter, I will briefly introduce our motivation and formulate the main aim ofthe thesis and describe its organization.
1.1 Motivation
The ferromagnetic Ni-Mn-Ga alloys have drawn much attention in recent years due totheir attractive properties such as magnetic field induced SME and large magnetocaloriceffect (MCE), resulting from the coupling between the magnetic and structural phasetransitions. The SME generally occurs due to the temperature and stress-dependentshift in the material’s crystalline structure between two different phases: martensite(low temperature phase) and austenite (high temperature phase). For the standard sto-ichiometric Ni2MnGa, the martensitic transformation (MT) occurs at a temperature of202K (TM ), whereas the Curie temperature (TC) is about 376K [4].
Upon alloying, both critical temperatures TM and TC can be sensitively tuned. Differ-ent combinations of TM and TC result in different properties of the alloys with varioustechnological significances. For example, in Ni1+xMn1−xGa alloys TM goes up but TC
1
2 CHAPTER 1. INTRODUCTION
goes down with the composition x increasing [5]. The alloys with x between 0.18 and0.20 have TM and TC close to each other. Consequently, the structural and the magnetictransitions may couple to each other. This coupling makes it possible to achieve shapememory effect by applying magnetic field and may induce some attractive propertiessuch as giant magnetocaloric effect, magnetostriction, and magnetoresistance which areimportant for the application of magnetic refrigeration or magnetostrictive transducers.
The alloying effect by doping a fourth element such as Fe, Co, and Cu, has also beendemonstrated to change drastically the martensitic transformation properties. For ex-ample, the substitution of Mn with Fe (Ni2Mn1−xGaFex) up to x=0.70 drops the marten-sitic transition temperature TM from 200K to about 120K [6], whereas the replacement ofGa by Fe (Ni52.7Mn22.1Ga25.2−xFex, x = 5.3) increases TM from 290K to 440K [7]. For theCo and Cu-doped Mn or Ga-deficient alloys, TM increases [8, 9, 10, 11], but it decreasesif Co or Cu replaces Ni atoms [7, 12, 13].
To build the connection between the composition and TM as well as TC and to under-stand the underlying physics are critical for designing new Ni-Mn-Ga-based alloys withdesirable properties.
There are several plausible quantities to connect the composition and TM of Ni-Mn-Gabased alloys, among which the e/a ratio (the number of valence electrons per atom) isvery well recognized. It has been shown that increasing e/a ratio enhances TM [14, 15,16]. However, such a connection is coarse-grained, and fails in some situations. Forexample, replacing Ga by Al or In and varying the long range atomic order changeTM without altering the e/a ratio [17, 18, 19, 20]. The total energy difference (∆EAM)between the parent austenite and the tetragonal martensite phases is another quantityproposed to correlate TM with the composition of the alloys. It was shown that a larger∆EAM corresponds to a higher TM [21, 22]. Interestingly, such a relationship also worksfor other shape memory alloys like TiX with X=Ni, Pd, and Pt [23]. Third, the MT of Ni-Mn-Ga alloys results from the soft-phonon modes and their accompanying soft tetrag-onal shear modulus C ′ = 1
2(C11−C12) of the high-temperature parent phase [24, 25, 26].
For alloys undergoing MT, the composition dependence of TM is generally related to thecomposition dependence of C ′: the lower the elastic constant the higher the TM will be[27, 28, 29]. This relationship has been confirmed in TiNi-based shape memory alloys.Finally, according to Lanska et al. [14] and Banik et al. [30], the composition depen-dent tetragonality of the martensite (|c/a− 1|, with a and c being the lattice constants ofthe martensite) may also serve as an index of the composition dependence of TM , i.e., alarger |c/a− 1| corresponds to a higher TM . Thus, at least four physical quantities havebeen reported to be relevant to the composition dependence of TM . It is therefore of fun-damental interests to perform a systematic investigation of these claimed correlationsfor a specified alloy and to assess their validity.
Based on the Heisenberg model in combination with the mean-field approximation[31, 32], the magnetic transition temperature TC of the standard stoichiometric Ni2MnGawas found to be rather close to the experimental value [33]. However, to our knowledge,
1.2. OBJECTIVES 3
few theoretical determination of the composition dependence of TC for off-stoichiometricalloys using the Heisenberg model has yet been performed.
In-Tl alloys are another type of binary paramagnetic SMAs. In the composition range of16-31 at.% Tl, the alloys undergo a martensitic transition from the high-temperature fccphase to the low-temperature fct phase [34, 35]. This transition is of particular interestssince it exhibits distinct first-order transition but nearly second order [34, 36].
1.2 Objectives
In the present thesis, our aim is to find the underlying physics of the compositiondependence of TM in Ni-Mn-Ga and In-Tl shape memory alloys, by means of study-ing the composition-dependent thermophysical properties. The first-principles exactmuffin-tin orbitals (EMTO) method in combination with coherent potential approxima-tion (CPA) was found to describe accurately the total energy of a system with chemicaland magnetic disorder. This method has been applied successfully in ab initio studies ofthe thermophysical properties of random Fe-based alloys [37, 38], simple and transitionmetal alloys [39, 40, 41], and oxide solid solutions [42, 43]. Therefore, here we choosethis method as the basic theoretical tool in all the studies.
In our work, we concentrate ourselves on the investigations of the composition depen-dence of elastic properties and the correlation between the tetragonal elastic constantC ′ and TM , then finally try to understand the physics of the composition-dependentTM . The elastic constants are both composition and temperature-dependent. For Ni-Mn-Ga alloy, the elastic constants behave abnormally, i.e., they harden with increasingtemperature [44]. Therefore, the physics underlying the abnormal trend of the tempera-ture dependence of C ′ is explored as well, in order to get a more reasonable correlationbetween C ′ and TM in this type of SMAs.
Both TM and TC have been demonstrated to depend on the quenching temperature andthe subsequent heat treatment which changes the degree of the long-range atomic orderof the parent alloy [20]. This indicates that the site preference can be a very importantissue affecting the MT temperature of the random alloys. Therefore, the fundamentalinvestigations of the site occupancy in Ni-Mn-Ga-based alloys are seen as an importantprecursory job in our work.
Besides, the composition dependence of other properties, such as equilibrium struc-tures, lattice parameters, and electronic structures in Ni-Mn-Ga and In-Tl alloys are alsoinvestigated, and for Ni-rich and Mn-deficient Ni2+xMn1−xGa family, we try to explorethe composition dependence of the Curie temperature using the Heisenberg model andmean-field approximation.
4 CHAPTER 1. INTRODUCTION
1.3 Organization of the thesis
The present thesis includes 8 chapters. They are arranged as follows:
1. Introduction: Introduce briefly the motivation and objective of our work, and de-scribe the arrangement of the thesis.
2. Shape memory alloys: Introduce the shape memory effect and give an overviewof Ni-Mn-Ga and In-Tl alloys.
3. Elastic properties of solids: Describe the formula of static elastic constants andisothermal elastic constants of single crystals, and polycrystalline elastic constants.
4. Theoretical methodology: Introduce the density functional theory, exact muffin-tin obitals method, and Heisenberg model used in this thesis.
5. In-Tl binary alloys: Present the results about the composition dependence of lat-tice parameters, elastic constants, and electronic structures of In-Tl binary shapememory alloys in both austenitic and martensitic phases.
6. Ni-Mn-Ga ternary alloys: Present the results about the equilibrium propertiesof standard stoichiometric Ni2MnGa and the site occupancy, composition- andtemperature-dependent elastic properties, and Curie temperature of off-stoichiometric Ni2MnGa alloys.
7. Ni-Mn-Ga-X (X=Fe, Co, and Cu) quarternary alloys: Present the results aboutthe site occupancy and composition-dependent elastic properties of Ni-Mn-Ga-X(X=Fe, Co, and Cu) quarternary alloys.
8. Concluding remarks: Summarize the main results of this thesis and suggest theemphasis of our future work.
Chapter 2
Shape memory alloys (SMAs)
In 1932, a Swedish physicist Arne Olander discovered that gold-cadmium (AuCd) alloycould be deformed when cooled down and then heated to return to original ”remem-bered” shape. The metal alloys with such SME are then called SMAs. In 1958, the SMEwas first demonstrated at the Brussels World’s Fair, where the SME was used to circu-larly lift a load mass. Researchers of U.S. Naval Ordnance Laboratory found SME innickel-titanium (NiTi) alloy in 1961 by accident, while studying the heat and corrosionresistance of NiTi. After that, SMAs have been gradually used as actuators, sensors,robotics, medical use, and so on. Today, the Ni-Mn-Ga-based alloys have become oneof the most broadly studied SMAs due to their particular ”Magnetic Shape MemoryEffect” (MSME). They possess magnetocaloric, magnetostriction effect, and magnetore-sistance effect. Compared to the ordinary SMAs, magnetism offers faster response andalso bigger deformation.
In the following of this chapter, we will briefly introduce the SME induced by themartensitic phase transition (Sec. 2.1), and then in Sec. 2.2 we give an overview ofthe SMAs in the case of Ni-Mn-Ga and In-Tl.
2.1 Shape memory effect (SME)
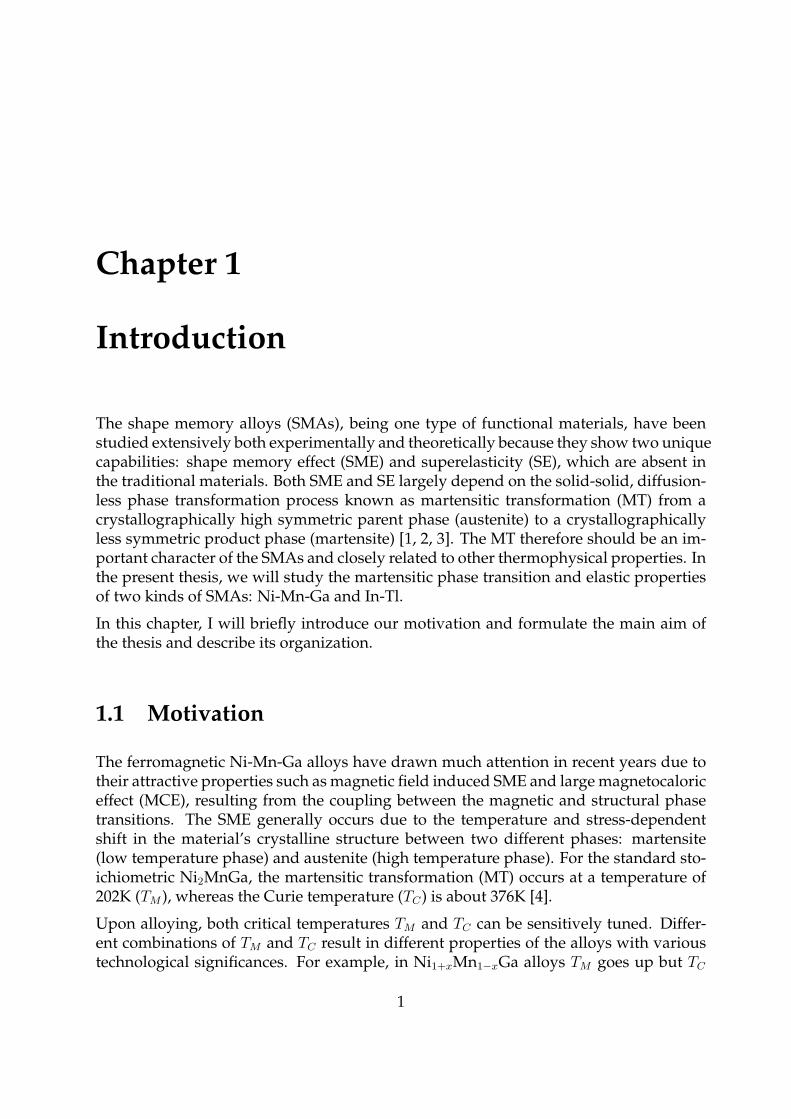
The SME means the property that the alloys can remember their original shape duringa process of deformations. This phenomena occurs due to a temperature and stress-dependent shift in the material’s crystalline structure between two different phases:martensite (low temperature phase) and austenite (high temperature phase). The tem-perature, where the phase transformation occurs, is called the transformation temper-ature. Figure 2.1 is a simplified representation of material’s crystalline arrangementduring different phases.
In austenitic phase, the structure of the material is symmetric; each ”grain” of material
5
6 CHAPTER 2. SHAPE MEMORY ALLOYS (SMAS)
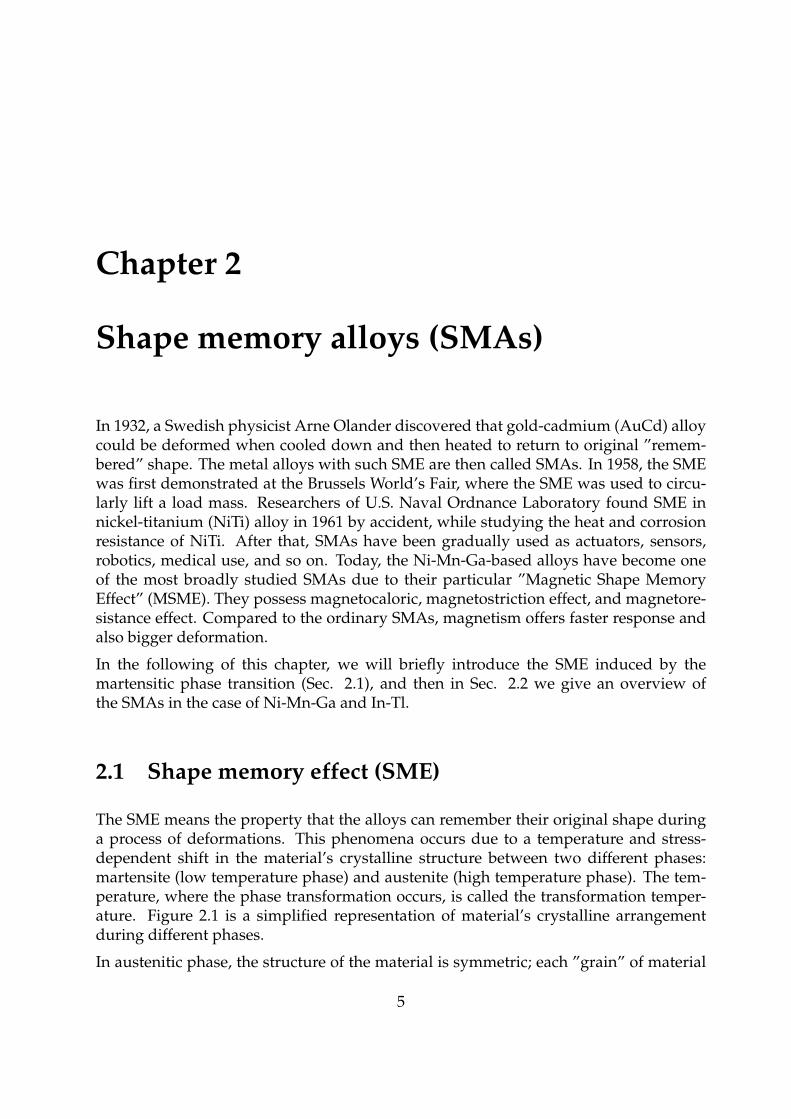
Figure 2.1. Schematic of the crystalline arrangement of shape memory alloys(SMAs) in different phases.
is a cube with right angles (a). When the alloy cools, it forms the martensitic phaseand collapses to a structure with different shape (b). If an external stress is applied,the alloy will deform to an alternate state (c). If the alloy is heated again above thetransformation temperature, the austenitic phase will be formed and the structure ofthe material returns to the original ”cubic” form (a), generating force/stress.
Some SMAs, usually used as an actuator, can only provide force/displacement in onedirection, which is called one-way SME. For example, a wire that compresses whenheated does not expand without external force, when the alloy cools down. This isone disadvantage of the SMAs actuators. A bias (return) mechanism must be used, ifactuator has to be returned to the original (cold) shape after the heating phase. On theother hand, the ability of SMAs to recover a specific shape upon heating and then returnto an alternate shape when cooled (below the transformation temperature) is known astwo-way SME. However, there are limitations that reduce the usability of the two-wayeffect, such as smaller strains (2%), extremely low cooling transformation forces andunknown long-term fatigue and stability. Even slight overheating removes the SME intwo-way devices. Setting shapes in two-way SMAs is a more complex procedure thanthe ones used with one-way SMAs.
SMAs also shows a SE behavior if deformed at a temperature which is slightly abovetheir transformation temperatures. This effect is caused by the stress-induced formationof some martensite above its normal temperature. Because it has been formed aboveits normal temperature, the martensite reverts immediately to undeformed austeniteas soon as the stress is removed. This process provides a very springy, ”rubberlike”elasticity in these alloys. The superelastic alloys are generally used as eyeglass frames.
2.2. AN OVERVIEW OF NI-MN-GA AND IN-TL ALLOYS 7
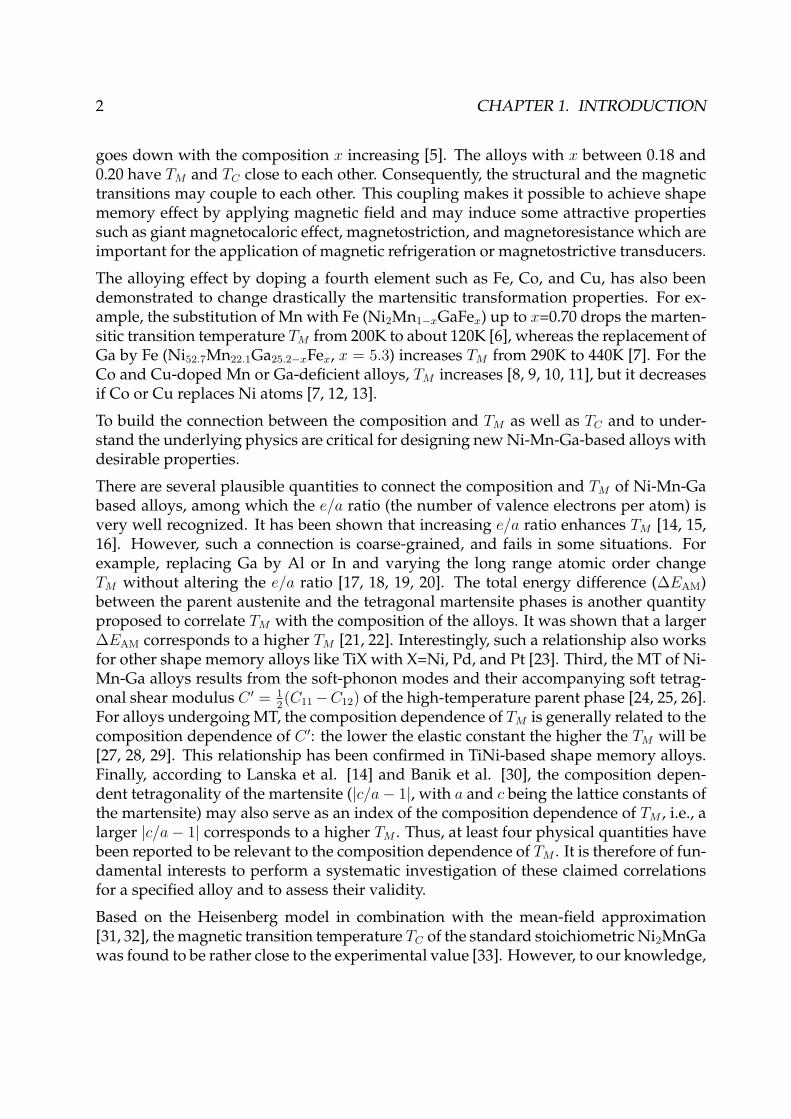
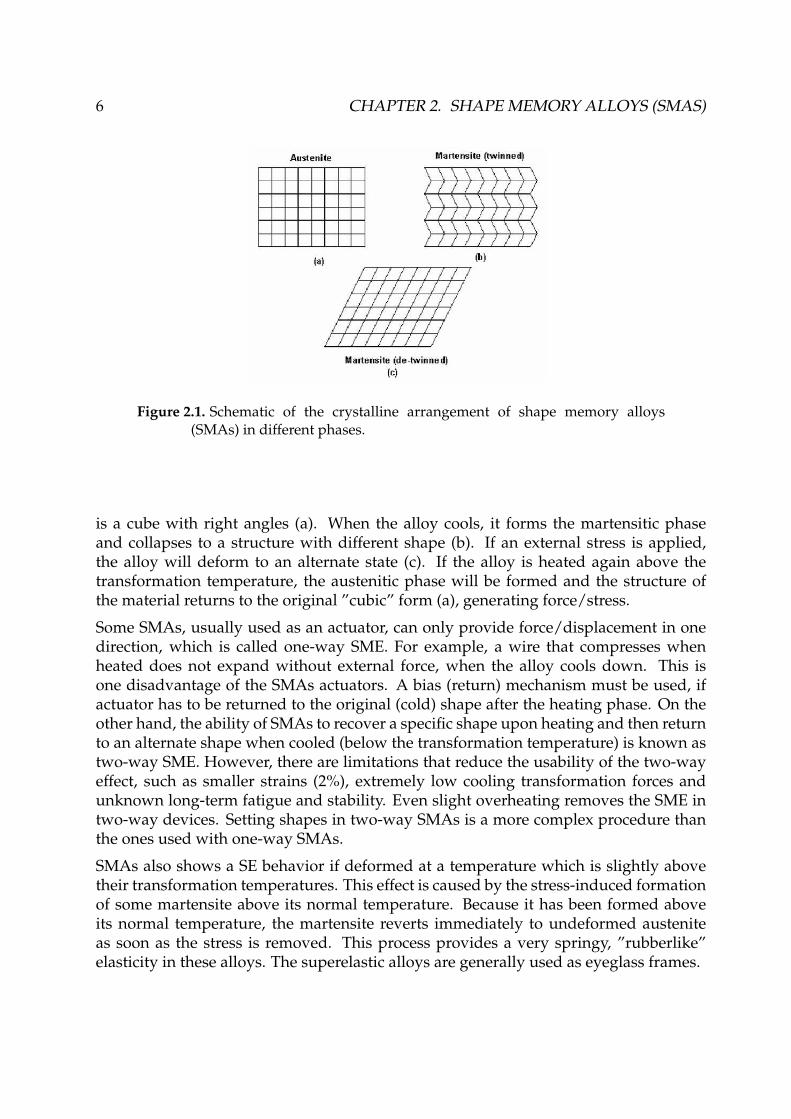
Figure 2.2. Unit cells of standard stoichiometric Ni2MnGa with simple cubic L21
structure and body-centered-tetragonal structure in the [1 1 0] direction.
2.2 An overview of Ni-Mn-Ga and In-Tl alloys
Ni-Mn-Ga alloy is one group of the most studied SMAs due to its MSME induced bythe reversible MT. For the standard stoichiometric Ni2MnGa, the MT occurs at a tem-perature 202 K (TM ), whereas the Curie temperature (TC) is about 376 K [4]. Numerousexperiments have shown that both TM and TC are very sensitive to the composition ofthe alloy. The combination of the magnetic and structural features results in its uniquethermomagnetomechanical properties. In a result, the Ni-Mn-Ga alloys can be used asactuators, sensors, robotics, magnetic refrigeration, medical use, and so on.
Close to stoichiometric Ni2MnGa, the melt solidifies to the B2’ structure. The alloy trans-forms to an ordered cubic structure L21 at a temperature depending on the composition,generally around 1073 K [45]. Annealing to obtain sharp martensitic reactions is usu-ally carried out in an inert atmosphere or in a vacuum quartz ampoule, at first in the B2’region (in the range of 1073 K-1273 K) and then close to the B2’-L21 transition [46]. Thethermoelastic martensites transformed from the L21 structure are: (i) non-modulatedtetragonal (abbreviations NM; T or 2M), (ii) orthorhombic (7M or 14M) or (iii) close totetragonal structures (5M or 10M) with different lattice modulations [47, 48, 49].
Figure 2.2 shows unit cells of standard stoichiometric Ni2MnGa with simple cubic L21
structure (left in the figure) and body-centered-tetragonal (bct) structure in the [1 1 0]direction (right in the figure). The L21 structure is comprised of four interpenetratingface-centered-cubic (fcc) sublattices, which are evenly located on the body-diagonal line.Ni atoms occupy (1
4, 1
4, 1
4) and (3
4, 3
4, 3
4) sites, Mn atoms (1
2, 1
2, 1
2) site, and Ga (0, 0, 0) site. In
the present thesis, we mainly investigate the Ni-Mn-Ga alloy with these two structuresand do not consider the modulated structures.
A shape memory effect of 2.6% in stoichiometric Ni2MnGa alloy was reported [50]. Inthe different off-stoichiometric compounds both in single crystalline and polycrystallinesamples, the NM structures turn out to be more beneficial for the SME, for example, aSME of 6.1% has been observed in Ni54Mn25Ga21 single crystal and 4.2% in the poly-crystalline sample of the same alloy [51]. Thus, NM structured Ni-Mn-Ga alloys are
8 CHAPTER 2. SHAPE MEMORY ALLOYS (SMAS)
very promising materials for high temperature applications of the SME. In Ni-Mn-Gathin-film actuators, both the shape recovery and the magnetic forces have been used tocontrol the behavior [52].
In the early studies, the traditional SE in the austenitic phase was observed already inNi-Mn-Ga shape memory alloys [18, 53]. This behavior is very beneficial in spring anddamping applications. Recently, there are several new studies of this subject too. Typicalclassic SE strain in the austenitic phase can reach 6% at stress levels of 50-300MPa, butboth the stress level and the maximum obtainable strain depend on the temperatureand the composition of the alloy [54]. Ni-Mn-Ga alloys also show SE in the martensiticphase when the alloy is in a constant magnetic field [55, 56]. This magnetic-field-assistedsuperelasticity (MFAS) is based on the change of the martensitic twin variant structure.
Ni-Mn-Ga alloys belong to the class of ferromagnetic materials called magnetic shapememory alloys, which under certain conditions exhibit giant magnetic-field-inducedstrain [57]. The giant strain-induced MSME is due to lattice reorientation in the mag-netic field. The driving force for the reoriention is the difference of the magnetic energyof martensitic variants differently oriented in the magnetic field. Ferromagnetic Ni-Mn-Ga alloys are particularly of significant interest also due to the existence of substantialmagnetic field-induced deformation of martensitic phase [58] and enlarged MCE [59].Thus, they have been considered as promising materials for solid state refrigerators.
In-Tl is another type of binary SMAs, which has paramagnetic state. The alloys with thecomposition range of 16 to 31 atomic percent (at.%) Tl undergo a martensitic transitionfrom the high temperature fcc phase to the low temperature face-centered-tetragonal(fct) phase [34, 35]. This transition is of particular interests since it exhibits distinct firstorder transition but nearly second order [34, 36]. The MT in In-Tl is also accompaniedby a pronounced softening of the shear modulus C ′ = 1
2(C11−C12). This unusual soften-
ing behavior was proposed resulting from the combination of reversible twinning andchanges of the unit cell on a very fine scale in the alloy [60]. In this thesis, in orderto test the accuracy and reliability of our theoretical method, we first study the elasticproperties and phase stability of In-Tl binary SMAs.
Chapter 3
Elastic properties of solids
The elastic property is amongst the most important physical properties of materials.Generally, in ab initio calculations the elasticity of a solid can be described within acontinuous displacement field. The continuum theory of elasticity is derived from thetheory of lattice vibrations [61]. By this way there is a possibility to obtain informationabout the phonon normal modes and the Debye temperature. The mechanical (dynam-ical) stability of a lattice implies that the total energy of the system increases after appli-cation of a small distortion. Therefore, the structural stability and phase transition maybe expressed in terms of the elastic properties.
For a single-crystal, the bulk modulus (B) can be determined by fitting the equation ofstates to the total energies for a set of atomic volumes. The most commonly used equa-tion of states are the Murnaghan [62], Birch-Murnaghan [63] and the Morse [64] typeones. In our work, the last one is adopted in the calculations. The other single-crystalelastic constants are evaluated by straining the lattice and calculating the variation ofthe total energy induced by the strain at a fixed volume (V ). Since the elastic constantsdepend strongly on the composition of the alloy and the ambient temperature, the al-loying and temperature effects on the total energy of the system should be taken intoaccount in the calculations.
A polycrystalline material, on a large scale, can be considered to be isotropic, whichmay be completely described by the bulk modulus (B) and the shear modulus (G). De-pending on the symmetry of the structure, both B and G are expressed in terms of thesingle-crystal elastic constants. Then, based on the B and G of the system, the Young’smodulus (E), Poisson ratio (ν), and Debye temperature (Θ) can be derived directly orindirectly.
In this chapter, we will give a description about the formula for both static (Sec. 3.1) andisothermal (Sec. 3.2) single-crystal elastic constants and polycrystalline elastic properties(Sec. 3.3).
9
10 CHAPTER 3. ELASTIC PROPERTIES OF SOLIDS
3.1 Static elastic constants
The adiabatic elastic stiffness constants (Cijkl) are defined as the second order derivativeof the internal energy with respect to the strain tensor (ekl, k, l = 1, 2, 3), viz.
Cijkl =1
V
∂E
∂eij∂ekl
, (3.1)
where E stands for the internal energy and the derivatives are calculated at constant en-tropy other than eij and ekl. The Cijkl form a fourth-rank tensor, which can be arrangedin a 6 matrix with maximum 21 different elements. In the Voigt notation the pair ofindices ij are replaced by index α according to: α=1, 2, 3 for ij= 11, 22, 33, α= 4 for ij= 23or 32, α= 5 for ij= 13 or 31, and α= 6 for ij= 12 or 21. Employing the Voigt notation, theelastic compliances (Sαβ) are related to the elastic stiffness constants (Cαβ) by
∑γ
CαγSγβ = δαβ, (3.2)
where δαβ is the Kronecker delta. In this section, we will concentrate on describing thecalculations of elastic stiffness constants.
3.1.1 Elastic stiffnesses in cubic structure
In a cubic lattice symmetry, there are three independent elastic stiffness constants: C11 =C22 = C33, C12 = C13 = C23, and C44 = C55 = C66. C11 and C12 are derived from the bulkmodulus (B)
B =C11 + 2C12
3, (3.3)
which is generally obtained from the equation of state. Besides, the tetragonal shearmodulus (C ′) is defined by
C ′ =C11 − C12
2. (3.4)
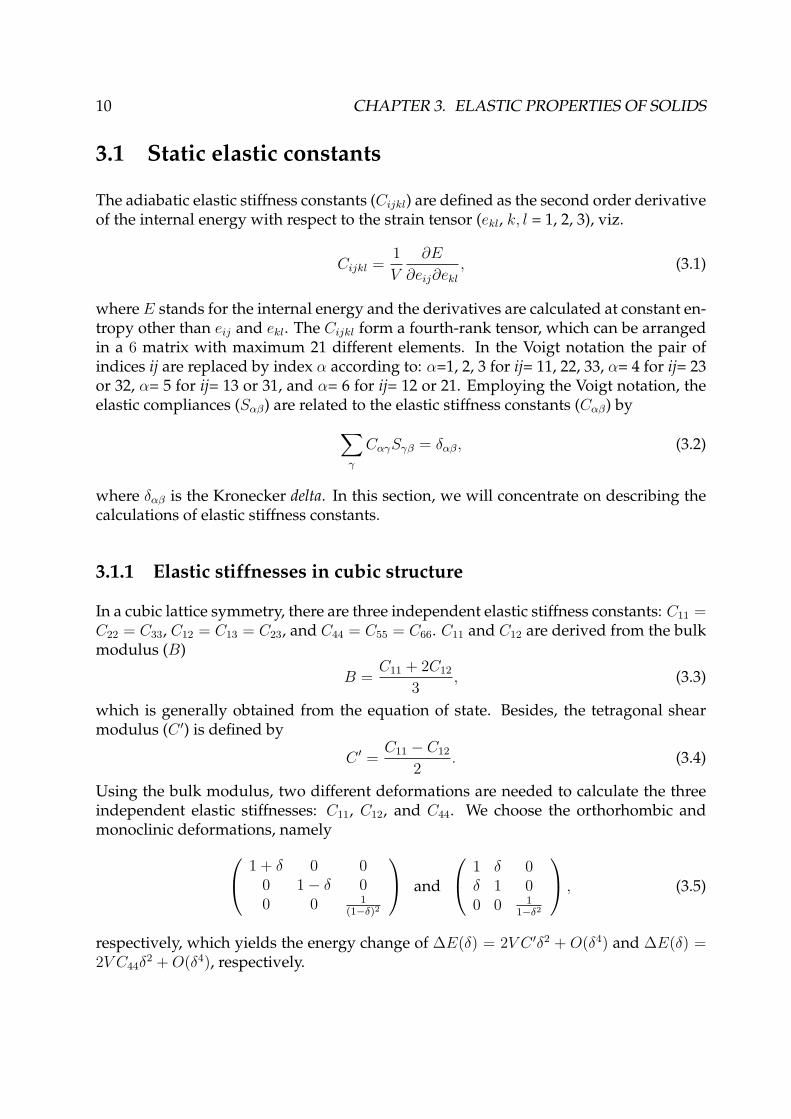
Using the bulk modulus, two different deformations are needed to calculate the threeindependent elastic stiffnesses: C11, C12, and C44. We choose the orthorhombic andmonoclinic deformations, namely
1 + δ 0 00 1− δ 00 0 1
(1−δ)2
and
1 δ 0δ 1 00 0 1
1−δ2
, (3.5)
respectively, which yields the energy change of ∆E(δ) = 2V C ′δ2 + O(δ4) and ∆E(δ) =2V C44δ
2 + O(δ4), respectively.
3.1. STATIC ELASTIC CONSTANTS 11
The total energy generally changes much more strongly with volume than with a gen-eral (volume-preserving) strain, in order to eliminate the strong volume-dependent en-ergy change which could overcome the strain effect to the total energy, for all the re-ferred lattice deformations volume-conserving are used in our work.
3.1.2 Elastic stiffnesses in tetragonal structure
In a tetragonal lattice symmetry, there are six independent elastic stiffness constants:C11 = C22, C12, C13 = C23, C33, C44 = C55, and C66. For such systems, the elastic stiff-nesses can be determined as follows. First, since the tetragonal axial ratio c/a generallychanges with the volume, the volume dependence of its optimized value (c/a)0(V ) canbe related to the difference in the linear compressibilities along the a and c axes. Simi-larly to the hexagonal case [65], we introduce a dimensionless quantity R as
R = −d ln(c/a)0(V )
d ln V, (3.6)
which in terms of tetragonal elastic stiffness constants becomes
R =C33 − C11 − C12 + C13
C11 + C12 + 2C33 − 4C13
. (3.7)
Second, at the optimized c/a ratio, the bulk modulus B for a tetragonal crystal can beexpressed as
B =C33(C11 + C12)− 2C2
13
C11 + C12 + 2C33 − 4C13
, (3.8)
which, when R is close to zero (the volume dependence of (c/a)0 is very small), reducesto B = 2
9(C11 + C12 + 2C13 + C33/2).
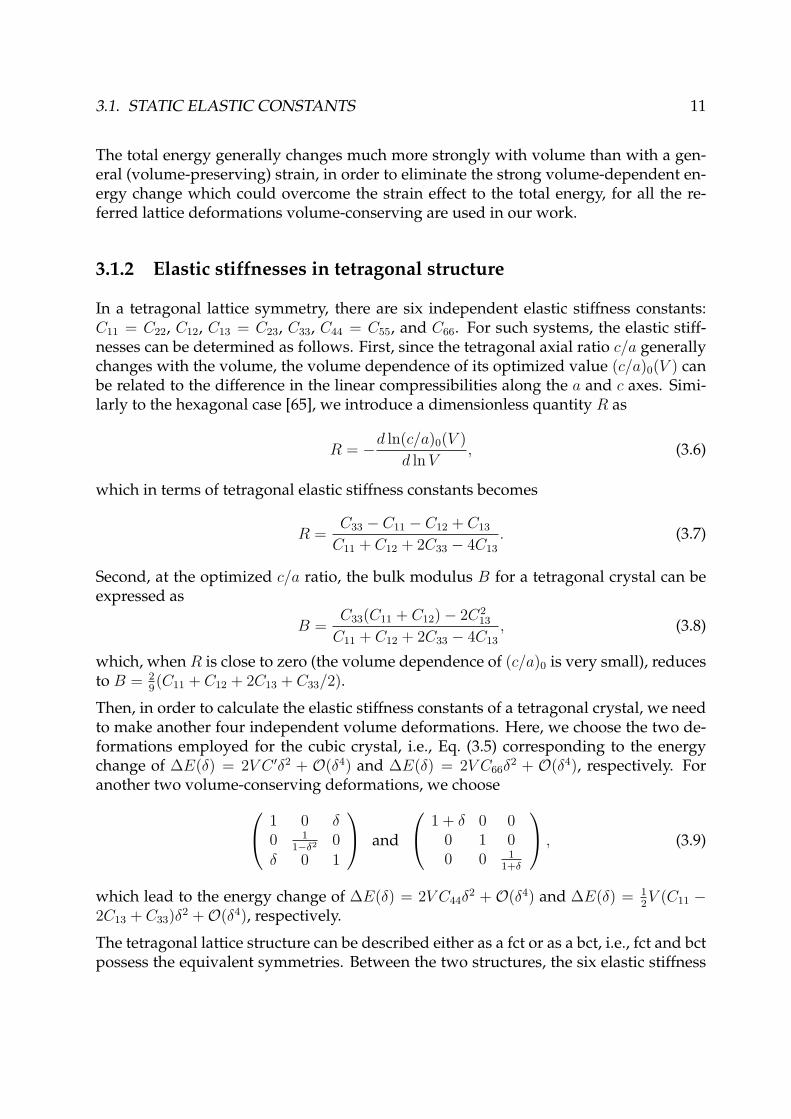
Then, in order to calculate the elastic stiffness constants of a tetragonal crystal, we needto make another four independent volume deformations. Here, we choose the two de-formations employed for the cubic crystal, i.e., Eq. (3.5) corresponding to the energychange of ∆E(δ) = 2V C ′δ2 + O(δ4) and ∆E(δ) = 2V C66δ
2 + O(δ4), respectively. Foranother two volume-conserving deformations, we choose
1 0 δ0 1
1−δ2 0
δ 0 1
and
1 + δ 0 00 1 00 0 1
1+δ
, (3.9)
which lead to the energy change of ∆E(δ) = 2V C44δ2 + O(δ4) and ∆E(δ) = 1
2V (C11 −
2C13 + C33)δ2 +O(δ4), respectively.
The tetragonal lattice structure can be described either as a fct or as a bct, i.e., fct and bctpossess the equivalent symmetries. Between the two structures, the six elastic stiffness
12 CHAPTER 3. ELASTIC PROPERTIES OF SOLIDS
constants transform according to the following relationships [66]
C11|fct = 12(C11 + C12 + 2C66)|bct,
C12|fct = 12(C11 + C12 − 2C66)|bct,
C13|fct = C13|bct,C33|fct = C33|bct,C44|fct = C44|bct,C66|fct = 1
2(C11 − C12)|bct.
(3.10)
3.2 Isothermal elastic stiffness constants
The isothermal elastic stiffness constants are derived from the second-order strain deriva-tive of Helmholtz free energy F . For practical reasons, F is decomposed as
F = Eel − T (See + Sps) + Fvib + Fmag, (3.11)
where Eel is the electronic total energy, See the electronic entropy of a rigid lattice, Sps theelectronic entropy due to the phonon smearing effect, Fvib the vibrational free energy,and Fmag the magnetic free energy. According to Eq. (3.11), the temperature-dependentpart of elastic stiffness constants C(T ) may be separated into four contributions, viz.
C(T ) = Cee + Cps + Cvib + Cmag, (3.12)
where the individual terms from the r.h.s. are due to electronic entropy, phonon-smearing,thermal expansion, and magnetism, respectively.
The total electronic entropy S∗el(= See +Sps) may be calculated from the smeared densityof states N∗(E) according to
S∗el = −kB
∫ ∞
∞{f(E)[ln f(E)] + [1− f(E)] ln[1− f(E)]}N∗(E)dE. (3.13)
For phonon limited lifetime, N∗(E) is formulated as a Lorentz type smearing [67]
N∗(E) =
∫ ∞
∞N(ε)
(Γ/π)
(E − ε)2 + Γ2dε, (3.14)
where Γ = πλel−phkBT , is inverse proportional with the electron lifetime. λel−ph is theelectron-phonon parameter (here we assume a constant λel−ph = 0.6) and kB the Boltz-mann constant. Obviously, for Γ → 0, S∗el reduces to the electronic entropy See of staticlattice.
The expression for the electronic entropy picks states around the Fermi level (EF ) withinan energy window EF ± kBT . When there are degenerated states at EF (e.g. d states incubic environment), a lattice distortion involved in elastic stiffness constant calculation
3.3. POLYCRYSTALLINE ELASTIC CONSTANTS 13
can split these state. In such situation, the −TSee term in the electronic free energywill strongly depend on the degree of distortion and thus give a large temperature-dependent contribution to the elastic stiffness constant. Moreover, the electron-phononmany-body term −TSps becomes important only when there is a strongly nonlineardensity of states around the Fermi level.
The magnetic excitations gradually transform the ferromagnetic (FM) elastic stiffnessconstants into the paramagnetic (PM, modeled by the so-called disordered local mag-netic moment [68], DLM) elastic stiffness constants over a temperature interval propor-tional to the magnetic transition temperature TC . For sake of simplicity, we assume thatthis transformation is linear, viz. C ′
mag(T ) ≈ C′DLM−C′FM
TCT , where C ′DLM and C ′FM stand
for C ′ calculated for the DLM and FM states, respectively, at their equilibrium volumes.
3.3 Polycrystalline elastic constants
In a polycrystalline material, the monocrystalline grains are randomly oriented. On alarge scale, such materials can be considered to be quasi-isotropic or isotropic in a sta-tistical sense. An isotropic system is completely described by the bulk modulus B andthe shear modulus G, which may be obtained by averaging the single-crystal elasticconstants. The most widely used averaging methods are the Voigt and Reuss bounds,the Hashin-Shtrikman bounds, Hershey average and Hill average. In the following ofthis section, a short overview of the Voigt and Reuss bounds, Hill average, and poly-crystalline Debye temperature is given.
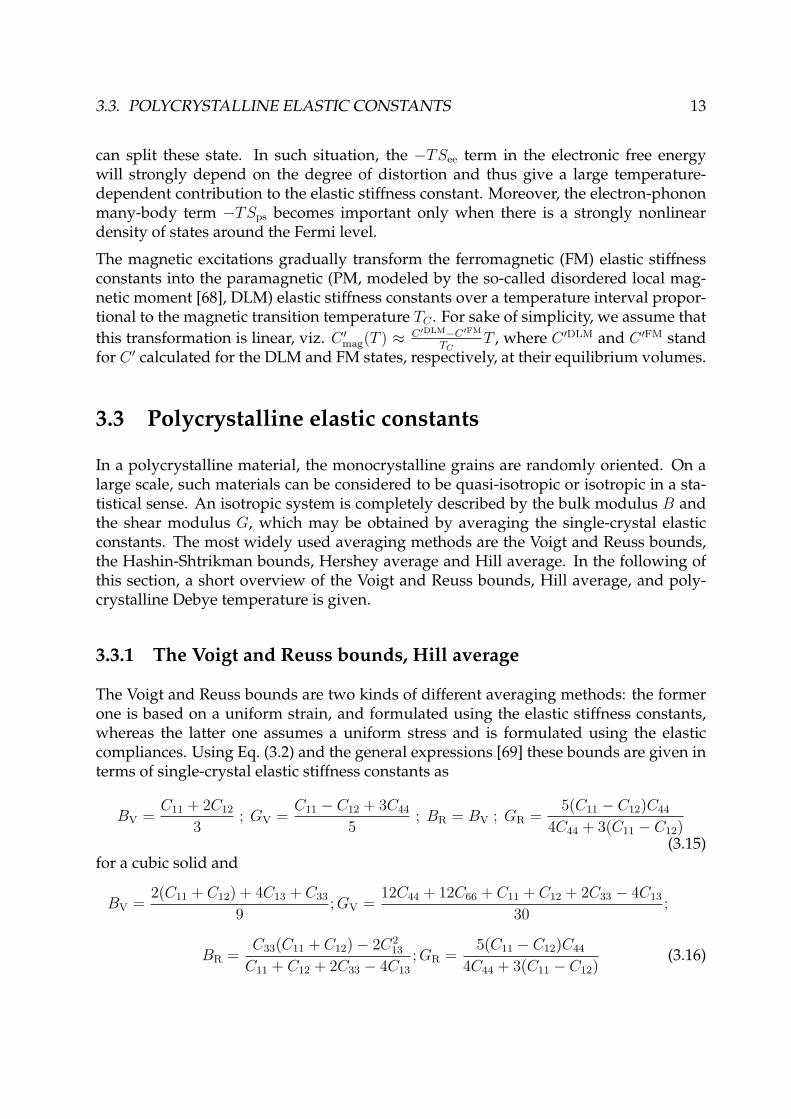
3.3.1 The Voigt and Reuss bounds, Hill average
The Voigt and Reuss bounds are two kinds of different averaging methods: the formerone is based on a uniform strain, and formulated using the elastic stiffness constants,whereas the latter one assumes a uniform stress and is formulated using the elasticcompliances. Using Eq. (3.2) and the general expressions [69] these bounds are given interms of single-crystal elastic stiffness constants as
BV =C11 + 2C12
3; GV =
C11 − C12 + 3C44
5; BR = BV ; GR =
5(C11 − C12)C44
4C44 + 3(C11 − C12)(3.15)
for a cubic solid and
BV =2(C11 + C12) + 4C13 + C33
9; GV =
12C44 + 12C66 + C11 + C12 + 2C33 − 4C13
30;
BR =C33(C11 + C12)− 2C2
13
C11 + C12 + 2C33 − 4C13
; GR =5(C11 − C12)C44
4C44 + 3(C11 − C12)(3.16)
14 CHAPTER 3. ELASTIC PROPERTIES OF SOLIDS
for a tetragonal solid.
Hill [70] has shown that the Voigt and Reuss bounds are rigorous upper and lowerbounds. The average bulk and shear moduli can be estimated from these bounds, e.g.,as BH = 1/2(BV + BR) and GH = 1/2(GV + GR), respectively. Alternatively, insteadof the arithmetic average one might prefer to use the geometric or harmonic means. Inweakly anisotropic materials, of course, all these averages lead to similar mean B andG.
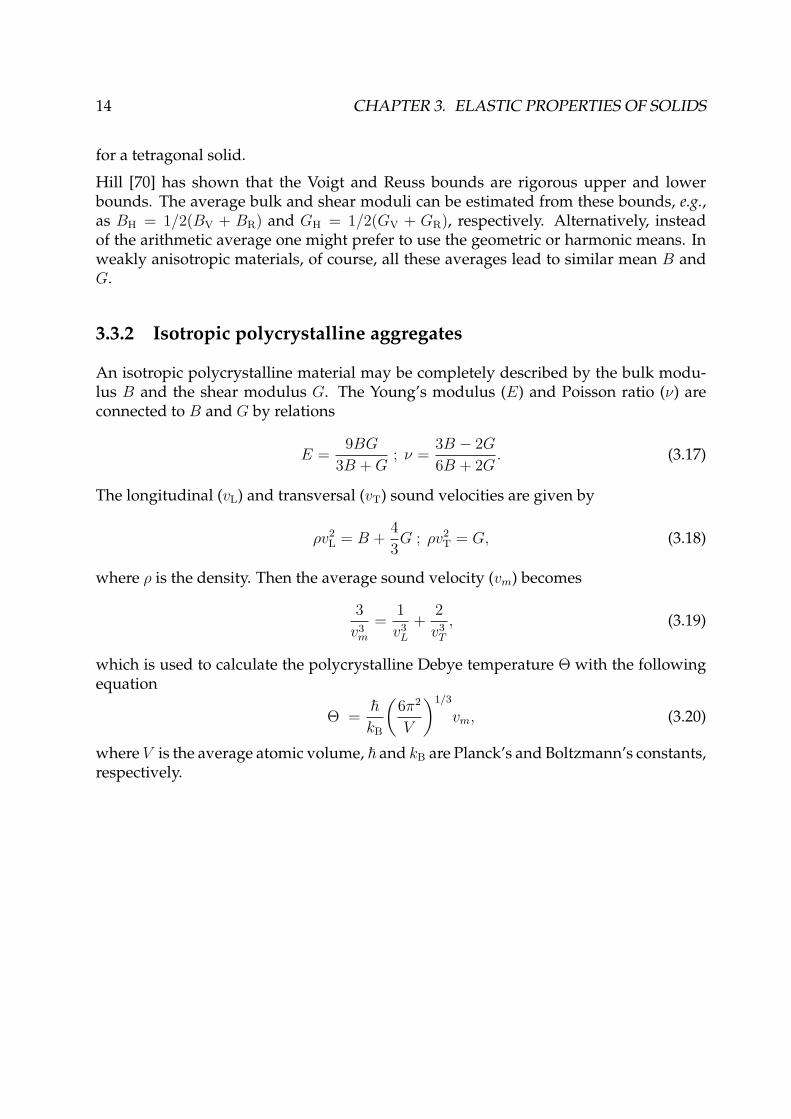
3.3.2 Isotropic polycrystalline aggregates
An isotropic polycrystalline material may be completely described by the bulk modu-lus B and the shear modulus G. The Young’s modulus (E) and Poisson ratio (ν) areconnected to B and G by relations
E =9BG
3B + G; ν =
3B − 2G
6B + 2G. (3.17)
The longitudinal (vL) and transversal (vT) sound velocities are given by
ρv2L = B +
4
3G ; ρv2
T = G, (3.18)
where ρ is the density. Then the average sound velocity (vm) becomes
3
v3m
=1
v3L
+2
v3T
, (3.19)
which is used to calculate the polycrystalline Debye temperature Θ with the followingequation
Θ =~kB
(6π2
V
)1/3
vm, (3.20)
where V is the average atomic volume, ~ and kB are Planck’s and Boltzmann’s constants,respectively.
Chapter 4
Theoretical methodology
There are many theoretical ways to investigate the properties of solid materials. Some ofthem are based on empirical parameters, whereas there are also some ones need inputparameter only the nuclear charges. The latter one is the so-called first-principles or abinitio calculation, which is often based on density functional theory.
In this thesis, we choose ab initio method as the theoretical tool in our studies and allthe calculations are carried out with the exact muffin-tin orbitals (EMTO) method. TheEMTO theory, developed in the 1990s by Andersen and co-workers [71], is an accurateand at the same time efficient tool for solving the Kohn-Sham equations. Recently, ithas been implemented by many researchers, especially by Vitos’s group [69]. In thefollowing sections, we will mainly introduce the density functional and EMTO theoremin detail.
4.1 Density functional theory (DFT)
Density functional theory (DFT) is one of the most popular and successful quantum me-chanical approaches to study the properties of materials. The main idea behind DFT isto accomplish the electronic structure calculations by using the electronic density as thebasic quantity instead of the complex many-body electronic wavefunctions. By reduc-ing the many-body equations into Hartree-type single-particle equations, DFT offersa powerful and elegant way for calculating the ground state properties of interactingelectrons.
4.1.1 The many-body problem
According to quantum mechanics, all information of a system of interacting electronsand nuclei is contained in the many-body wavefunction Ψ, which can be obtained by
15
16 CHAPTER 4. THEORETICAL METHODOLOGY
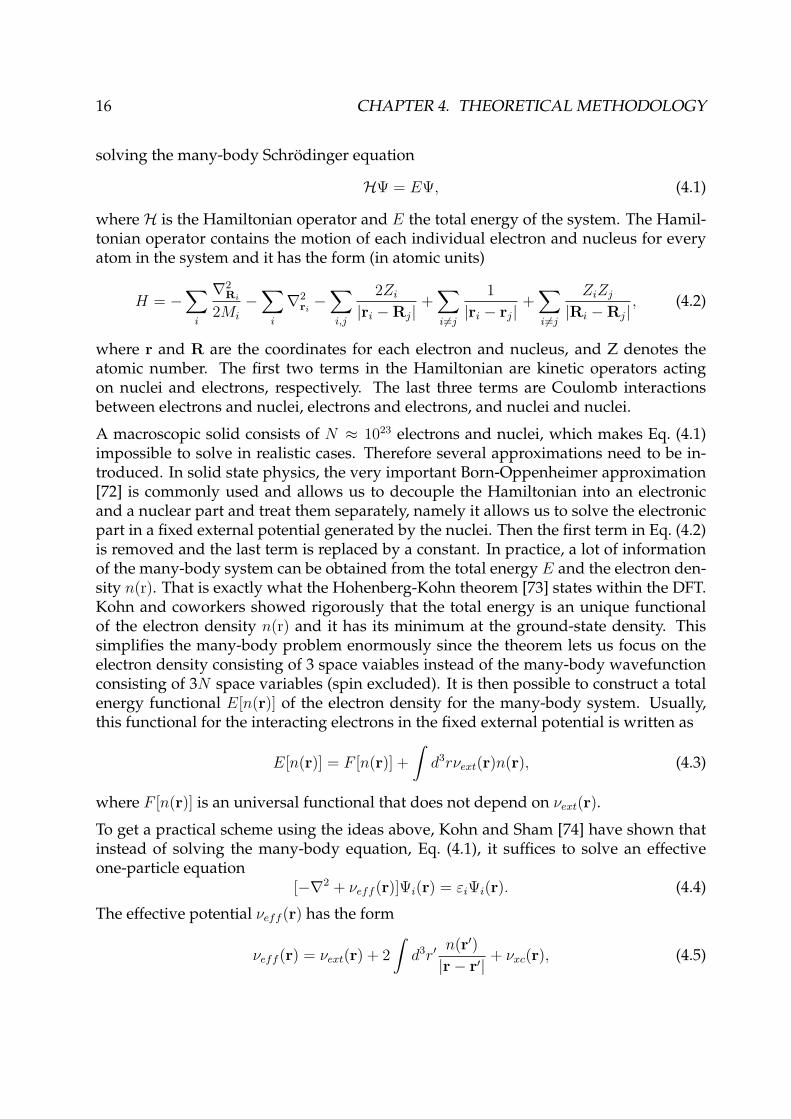
solving the many-body Schrodinger equation
HΨ = EΨ, (4.1)
where H is the Hamiltonian operator and E the total energy of the system. The Hamil-tonian operator contains the motion of each individual electron and nucleus for everyatom in the system and it has the form (in atomic units)
H = −∑
i
∇2Ri
2Mi
−∑
i
∇2ri−
∑i,j
2Zi
|ri −Rj| +∑
i6=j
1
|ri − rj| +∑
i6=j
ZiZj
|Ri −Rj| , (4.2)
where r and R are the coordinates for each electron and nucleus, and Z denotes theatomic number. The first two terms in the Hamiltonian are kinetic operators actingon nuclei and electrons, respectively. The last three terms are Coulomb interactionsbetween electrons and nuclei, electrons and electrons, and nuclei and nuclei.
A macroscopic solid consists of N ≈ 1023 electrons and nuclei, which makes Eq. (4.1)impossible to solve in realistic cases. Therefore several approximations need to be in-troduced. In solid state physics, the very important Born-Oppenheimer approximation[72] is commonly used and allows us to decouple the Hamiltonian into an electronicand a nuclear part and treat them separately, namely it allows us to solve the electronicpart in a fixed external potential generated by the nuclei. Then the first term in Eq. (4.2)is removed and the last term is replaced by a constant. In practice, a lot of informationof the many-body system can be obtained from the total energy E and the electron den-sity n(r). That is exactly what the Hohenberg-Kohn theorem [73] states within the DFT.Kohn and coworkers showed rigorously that the total energy is an unique functionalof the electron density n(r) and it has its minimum at the ground-state density. Thissimplifies the many-body problem enormously since the theorem lets us focus on theelectron density consisting of 3 space vaiables instead of the many-body wavefunctionconsisting of 3N space variables (spin excluded). It is then possible to construct a totalenergy functional E[n(r)] of the electron density for the many-body system. Usually,this functional for the interacting electrons in the fixed external potential is written as
E[n(r)] = F [n(r)] +
∫d3rνext(r)n(r), (4.3)
where F [n(r)] is an universal functional that does not depend on νext(r).
To get a practical scheme using the ideas above, Kohn and Sham [74] have shown thatinstead of solving the many-body equation, Eq. (4.1), it suffices to solve an effectiveone-particle equation
[−∇2 + νeff (r)]Ψi(r) = εiΨi(r). (4.4)
The effective potential νeff (r) has the form
νeff (r) = νext(r) + 2
∫d3r′
n(r′)|r− r′| + νxc(r), (4.5)
4.1. DENSITY FUNCTIONAL THEORY (DFT) 17
where the first part is the external potential generated by the nuclei, the second partis the Hartree term originating from electron-electron interactions and the last part isthe exchange-correlation potential containing all many-body effects. The density is con-structed using
n(r) =N∑
i=1
|Ψi(r)|2. (4.6)
The set of Equations ((4.4)-(4.6)) represents the Kohn-Sham equations. The Kohn-Shamequation, Eq. (4.4), can be viewed as a Schodinger equation in which the external po-tential is replaced by the effective potential, Eq. (4.5), which depends on the electrondensity. The density itself depends on the one-particle states Ψi. The Kohn-Sham equa-tion therefore needs to be solved in a self-consistent manner. The functional F [n] inEq. (4.3) has the form
F [n] = Ts[n] +
∫ ∫d3rd3r′
n(r)n(r)
|r− r′| + Exc[n], (4.7)
where the kinetic energy functional Ts[n] has the form
Ts[n] =∑
i
εi −∫
d3rνeff (r)n(r). (4.8)
The whole total energy functional is then obtained by combining Eqs. (4.3), (4.5), (4.7)and (4.8) and has the form
E[n] =∑
i
εi −∫ ∫
d3rd3r′n(r)n(r′)|r− r′| −
∫d3rνxc(r)n(r) + Exc[n]. (4.9)
The exact exchange-correlation potential νxc and functional Exc[n] are however not knownand further approximations are needed. If they were, all many-body effects are includedin the total energy functional and the whole treatise is exact.
4.1.2 Exchange correlation approximation
In order to make any real calculations based on the Kohn-Sham equations, an approx-imation of the exchange-correlation functional has to be made. The most common andwidely used approximation is the local density approximation (LDA) [75, 76], where theexchange-correlation energy density is assumed to be the same as in a homogeneouselectron gas with that density,
ELDAxc [n] =
∫d3rn(r)εhom
xc (n(r)), (4.10)
18 CHAPTER 4. THEORETICAL METHODOLOGY
where εhomxc (n(r)) is the sum of the exchange and the correlation energy of the homo-
geneous electron gas of density n(r). The exchange correlation potential νLDAxc (r) is the
functional derivative of ELDAxc , which can be written as
νLDAxc (r) = εhom
xc (n(r)) + n(r)δεhom
xc ([n], r)
δn(r). (4.11)
LDA is rather simple and it usually works remarkably well even for inhomogeneouscases. However, for solids LDA very often gives too small equilibrium volumes ( 3%)due to overbinding. An improvement to LDA is in many cases the generalized gradientapproximation (GGA) [77], where not only the density itself enters in the exchange-correlation energy but also its local gradient
EGGAxc [n] =
∫d3rn(r)εhom
xc (n(r), |∇n|). (4.12)
However, there does not exist a unique GGA functional and many different forms havebeen suggested. Perhaps the most successful ones are those suggested by Perdew andWang (PW91) [78] and its simpler form by Perdew, Burke and Ernzerhof (PBE) [77].Recently, Perdew and co-workers [79] introduced a revised PBE functional, referred toas PBEsol, which is expected to perform well for densely-packed solids and surfaces. Inaddition to GGA, some other different concepts for improving the exchange-correlationfunctional approximations were also put forward in the past decade, such as the LocalAiry Gas approximation (LAG) by Vitos and co-workers [80] and AM05 by Armientoand Mattsson [81]. In the present thesis, the exchange-correlation functional of PBE isadopted for Ni-Mn-Ga and that of AM05 for In-Tl alloys.
4.2 Exact muffin-tin orbitals (EMTO) method
The Exact Muffin-Tin Orbitals (EMTO) is a cellular method, where the single-electronKohn-Sham equations are solved separately within the Wigner-Seitz cells or Voronoypolyhedra defined around the lattice sites. The Kohn-Sham potential is approximatedby the optimized overlapping muffin-tin wells and the total energy is calculated via theso-called Full Charge Density (FCD) technique [69]. In the case of alloys, the problemof chemical and magnetic disorder is easily treated by combining the EMTO methodwith the Coherent Potential Approximation (CPA) [82, 83, 84]. In such situation, theEMTO-CPA method is expected to be more convenient than the most commonly usedfirst-principles full potential (FP) and pseudopotential (PP) methods. In the presentEMTO implementation, the total energy is computed by LDA plus four gradient-levelfunctionals: PBE, PBEsol, AM05, and LAG.
In the following subsections, the EMTO formalism will be introduced in detail.
4.2. EXACT MUFFIN-TIN ORBITALS (EMTO) METHOD 19
4.2.1 Exact muffin-tin potential
Within the overlapping muffin-tin approximation, the effective single-electron potentialis approximated by spherical potential wells υR(rR)− υ0 centered on lattice sites R plusa constant potential υ0, i.e.,
υ(r) ≈ υmt(r) ≡ υ0 +∑
R
[υR(rR)− υ0]. (4.13)
The spherical and the constant potentials (υR(rR) and υ0, respectively) from the r.h.s aredetermined by optimizing the mean of the squared deviation between the muffin-tinpotential (υmt(r)) and υ(r), which leads to the so-called optimized overlapping muffin-tin (OOMT) potential.
Described in the case of the so-called spherical cell approximation (SCA) [69], the spher-ical part of the single-electron potential can be expressed in ordered system by four parts
υR(rR) = υIR(rR) + υM
R + ∆υSCAR + µxcR(rR), (4.14)
where υIR(rR) is the intra-cell electrostatic potential, υM
R the so-called Madelung poten-tial, contributed by the charges from the outside of the potential sphere, ∆υSCA
R a con-stant potential, produced by the missing charge inside the spherical cell compared withthe Wigner-Seitz cell, µxcR(rR) the exchange-correlation potential.
4.2.2 Exact muffin-tin orbitals wave function
The single-electron Kohn-Sham Eq. (4.4), with the effective potential νeff (r) approxi-mated by the muffin-tin potential (Eq. (4.13)), is solved by expanding the Kohn-Shamorbital in terms of the exact muffin-tin orbitals (ψ
a
RL), viz.
Ψj(r) =∑RL
ψa
RL(εj, rR)υaRL,j. (4.15)
The expansion coefficients, υaRL,j , are determined in a way that Ψj(r) is a solution for
Eq. (4.4) in the entire space.
The exact muffin-tin orbitals, ψa
RL(εj, rR), are constructed using different basis functionsinside the potential sphere (rR < sR) and in the interstitial region (rR > sR). The sR isthe radius of the potential sphere centered at site R.
Inside the potential sphere (rR < sR) the basis functions, so-called partial waves (φaRL),
are constructed from solutions of the scalar-relativistic, radial Dirac equation for thespherical potential (φRl) and the real harmonics (YL(rR))
φaRL(ε, rR) = Na
Rl(ε)φRl(ε, rR)YL(rR). (4.16)
20 CHAPTER 4. THEORETICAL METHODOLOGY
The normalization factor NaRl(ε) assures a proper matching at the potential sphere bound-
ary to the basis function outside of the potential sphere.
In the interstitial region the basis functions are solutions of the free electron Schrodingerequation, called screened spherical waves (ψa
RL(ε − υ0, rR)). The boundary conditions forthe free electron Schrodinger equation are given in conjunction with non-overlappingspheres, called hard spheres, centered at lattice site R with radius aR. The screened spher-ical waves are just defined as being free electron solutions which behave as real harmon-ics on their own a-spheres centered at site R and vanish on all the other sites.
The partial waves and the screened spherical waves must join continuously and be dif-ferentiable at aR. This is implemented using additional free electron wave functions(ϕa
Rl(ε, rR)), by which the connection between the screened spherical waves and the par-tial waves is obtained. It joins continuously and differentiable to the partial wave atsR and continuously to the screened spherical wave at aR. Since aR < sR the additionalfree-electron wave functions should be removed, which is realized by the so-called kink-cancelation equation.
4.2.3 The full charge density (FCD) total energy
Within the present EMTO method, to obtain the total charge density, the total numberof states and the total energy, the Green’s function formalism is employed, instead ofcalculating all possible wave functions and single electron energies. This is becauseboth self-consistent single electron energies and the electron density can be expressedwithin Green’s function formalism [69].
The total charge density is obtained by summations of one-center densities, which maybe expanded in terms of real harmonics around each lattice site
n(r) =∑
R
nR(rR) =∑RL
nRL(rR)YL(rR). (4.17)
The total energy of the system is obtained using the total charge density via full chargedensity (FCD) technique, where the space integrals over the Wigner-Seitz cells in Eq. (4.9)are solved via the shape function technique, the interaction energy between remoteWigner-Seitz cells is taken into account through the Madelung term, a particularly deli-cate contribution arising from Wigner-Seitz cells with overlapping bounding spheres iscalculated by the so-called displaced cell technique [69].
The FCD total energy is decomposed in following terms
Etot = Ts[n] +∑R
(FintraR[nR] + ExcR[nR]) + Finter[n] (4.18)
where Ts[n] is the kinetic energy, FintraR the electrostatic energy due to the charges insidethe Wigner-Seitz cell, Finter the electrostatic interaction between the cells (Madelungenergy), and ExcR the exchange-correlation energy.
4.3. HEISENBERG MODEL 21
4.2.4 Coherent potential approximation (CPA)
The coherent potential approximation (CPA) is implemented using two main approxi-mations. First, it is assumed that the local potentials (Pi) around a certain type of atomfrom the alloy are the same, i.e., the effect of local environments is neglected. Second, thesystem is replaced by a monoatomic set-up described by the site-independent coherentpotential (P ). In terms of the Green function, the real Green function is approximated bya coherent Green function (g = [S − P ]−1, S denotes the structure constant matrix.). Foreach alloy component, a single-site Green function (gi) is introduced, which is expressedmathematically via the real-space Dyson equation
gi = g + g(Pi − P )gi, i = A,B, C · · · . (4.19)
The average of the individual Green functions should reproduce the single-site part ofthe coherent Green function, viz.
g = agA + bgB + cgc + · · · . (4.20)
After iterative solution, the output of g and gi’s equations are used to determine theelectronic structure, charge density and total energy of the random alloy.
Within the EMTO-CPA method, the total charge density for the alloy component i stillcan be obtained by summations of one-center densities and described using Eq. (4.17).Since the impurity problem is treated within the single-site approximation, the Coulombsystem of a particular alloy component may contain a non-zero net charge. Treating thecharge misfit with the screened impurity model (SIM) [85, 86], an additional shift ofspherical potential (∆υSIM,i
R ) and total energy (∆ESIM,i) are thus added to Eq. (4.14) and(4.18), respectively, for the alloy component i.
4.3 Heisenberg model
In Heusler alloys with localized magnetic moments, the Curie temperature (TC) may beestimated using the well-established Heisenberg model in combination with the mean-field approximation. Within the Heisenberg model, the interatomic exchange interac-tions are described in terms of the classical Heisenberg Hamiltonian
Heff = −∑µ,ν
∑R,R′
JµνRR′s
µRsν
R′ , µR 6= νR′, (4.21)
where JµνRR′ are the intrasite exchange integrals, the indices µ and ν represent different
sublattices, R and R′ are the lattice vectors specifying the atoms within sublattices, andsµR and sν
R′ are the unit vector pointing in the direction of the magnetic moment at site (µ,
22 CHAPTER 4. THEORETICAL METHODOLOGY
R) and (ν, R′), respectively. In Eq. (4.21) the size of the magnetic moments is includedin the exchange interaction parameters.
Within the mean-field solution of the Heisenberg model, TC is obtained by solving thesystem of coupled equations [33, 87]
〈sµ〉 =2
3kBT
∑ν
Jµν0 〈sν〉, (4.22)
where Jµν0 ≡ ΣRJµν
0R is the effective exchange parameter, and 〈sµ〉 and 〈sν〉 are the av-erage z component of sµ
R and sνR, respectively. Eq. (4.22) has non-trivial solutions if the
corresponding determinant is zero, viz.
Det{J−TI} = 0, (4.23)
where the matrix elements are Jµν = (2/3kB)Jµν0 and Iµν = δµν (Kronecker delta). The
largest eigenvalue of Eq. (4.23) gives the magnetic transition temperature [33, 87]. In thepresent application, the exchange interactions were calculated using the magnetic forcetheorem [88] implemented in the EMTO method [69].
Chapter 5
In-Tl binary alloys
Indium-Thallium alloys are one type of binary paramagnetic shape memory alloys. Inthe composition range of 16-31 at.% Tl, the alloys undergo a martensitic transition fromthe high-temperature fcc phase to the low-temperature fct phase [34, 35]. This transitionis of particular interests since it exhibits distinct first-order transition but nearly secondorder [34, 36].
The knowledge of the elastic constants in general is crucial for understanding the struc-tural transition. The MT in In-Tl is accompanied by a pronounced softening of the shearmodulus C ′ = 1
2(C11 − C12). In order to establish the accuracy and reliability of our cal-
culational method for the elastic constants both in cubic and tetragonal structures, thestatic elastic properties of In1−xTlx (0 ≤ x ≤ 0.4) random shape memory alloys are firstinvestigated in this chapter. Furthermore, using both the calculated elastic constantsand the electronic density of states (DOS), the alloying effect on the relative stability ofthe fcc and fct phases is discussed.
The rest of the chapter is arranged as follows: in Sec. 5.1, the elastic properties of pureIn are presented; in Sec. 5.2, the composition-dependent lattice parameters and elasticconstants are shown and their correlation with the martensitic transformation temper-ature TM are discussed; in Sec. 5.3, the calculated composition dependence of DOS isanalyzed with respect to the phase stability.
This chapter is contributed by supplement I.
5.1 Elastic properties of pure In
Table 5.1 presents the calculated static elastic constants and Debye temperature (Θ) ofthe fct and fcc In in comparison with those from other theoretical calculations and exper-imental measurements [89, 90, 91, 92]. For both fct and fcc phases, the elastic constantsfrom exchange correlation functional AM05 are in between those from LDA and PBE.
23

24 CHAPTER 5. IN-TL BINARY ALLOYS
Table 5.1. Theoretical elastic constants (in GPa) and Debye temperature Θ (in K) forpure fct and fcc In, respectively, in comparison with the available theoreticalresults and experimental data.
Phase Method C11 C12 C13 C33 C44 C66 C ′ Θfct LDA 57.8 44.2 42.9 53.6 11.2 25.1 6.8 136.5
PBE 38.1 28.3 30.7 39.6 7.2 14.9 4.9 111.1AM05 49.1 37.3 38.8 46.6 6.6 15.7 5.9 113.1Exp.(298 K) [91] 44.4 39.4 40.4 44.3 6.5 12.2 2.5Exp.(300 K) [92] 45.4 40.1 41.5 45.2 6.5 12.1 2.7Exp.(77 K) [92] 52.6 40.6 44.6 50.8 7.6 16.0 6.0Exp.(4.2 K) [92] 53.9 38.7 45.1 51.6 8.0 16.8 7.6Exp.(0 K) [92] - - - - - - - 111.3PAW-LDA [89] 69.6 36.2 46.2 57.5 13.7 17.6 16.7PAW-PW91 [89] 44.6 25.8 33.9 41.4 5.6 13.3 9.4TB [90] - - - - 13.4 22.6 4.2
fcc LDA 40.9 49.1 - - 14.9 - -4.1PBE 30.6 33.4 - - 11.7 - -1.4AM05 35.9 43.1 - - 13.0 - -3.6PAW-LDA [89] 42.4 52.5 - - 10.2 - -5.1PAW-PW91 [89] 35.1 36.0 - - 5.5 - -0.5
PBE underestimates most of the elastic constants except C44 and C66 whereas LDA over-estimates seriously C66. In general, AM05 elastic constants are in better agreement withthose from experimental measurements at low temperature (77 K) [92] than those cor-responding to the LDA and PBE approximations. The largest error is only about 14%for C13. Besides, the AM05 Debye temperature Θ for a polycrystalline In is about 113.1K, which is very close to the experimental value of 111.3 K [92]. Thus, for the alloys wewill present results obtained using AM05 only.
For fcc In, we get negative C ′ from the three approximations since C11 is smaller thanC12, which is in line with the first-principles projector augmented wave (PAW) calculations [89].
The dynamical or mechanical stability condition of a lattice implies that the energychange ∆E ∼ V Cijeiej upon any small deformation is positive. This condition can beformulated in terms of elastic constants. The stability criteria for cubic crystals requiresthat C11 > |C12|, C11 + 2C12 > 0, C44 > 0, and for tetragonal crystals is that C11 > |C12|,C33 > 0, C44 > 0, C66 > 0, (C11 + C33 − 2C13) > 0, (2C11 + C33 + 2C12 + 4C13) > 0. Fromour calculations, the theoretical elastic constants of fct In satisfy all of the conditions,whereas those of fcc In do not meet the condition C11 > |C12| since C ′ is minus. There-fore, at 0 K, fcc In is not thermodynamically stable and the pure In is stabilized by fctstructure.
5.2. ELASTIC PROPERTIES OF IN1−XTLX ALLOYS 25
0.0 0.1 0.2 0.3 0.4
0.8
1.0
1.2
1.4c/
a
x
This work L. Guttman R.W. Meyerhoff
4.4
4.6
4.8
5.0
a
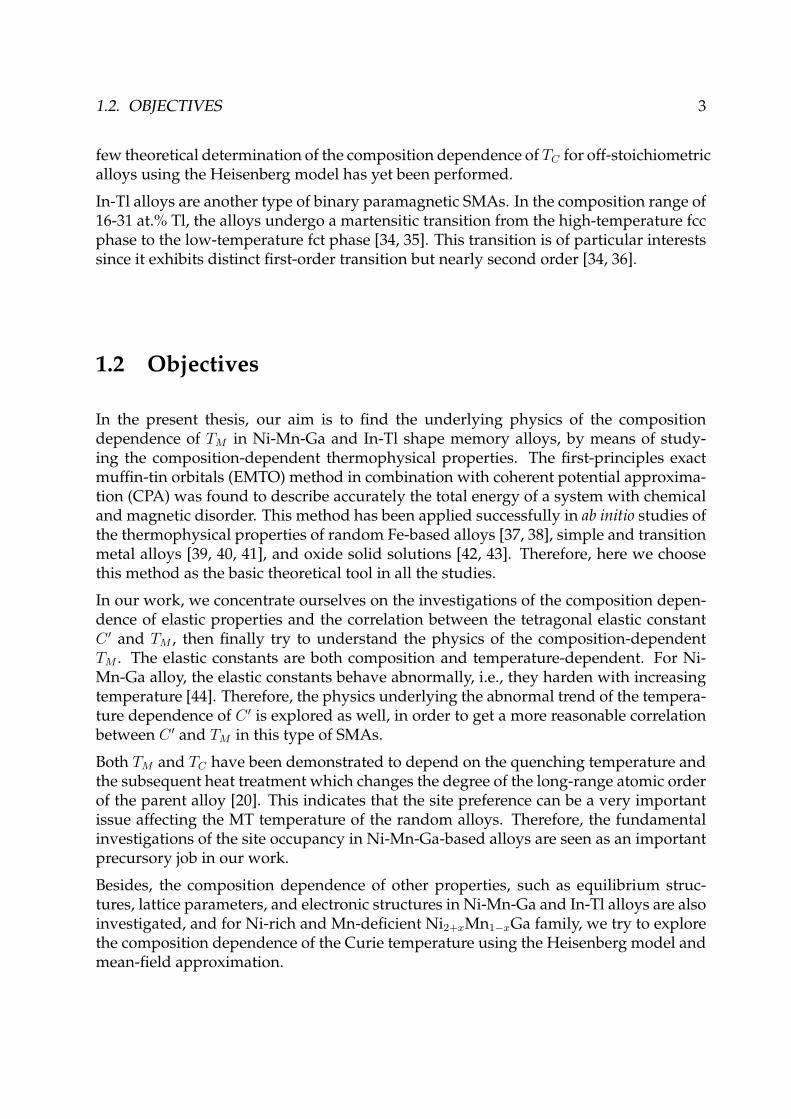
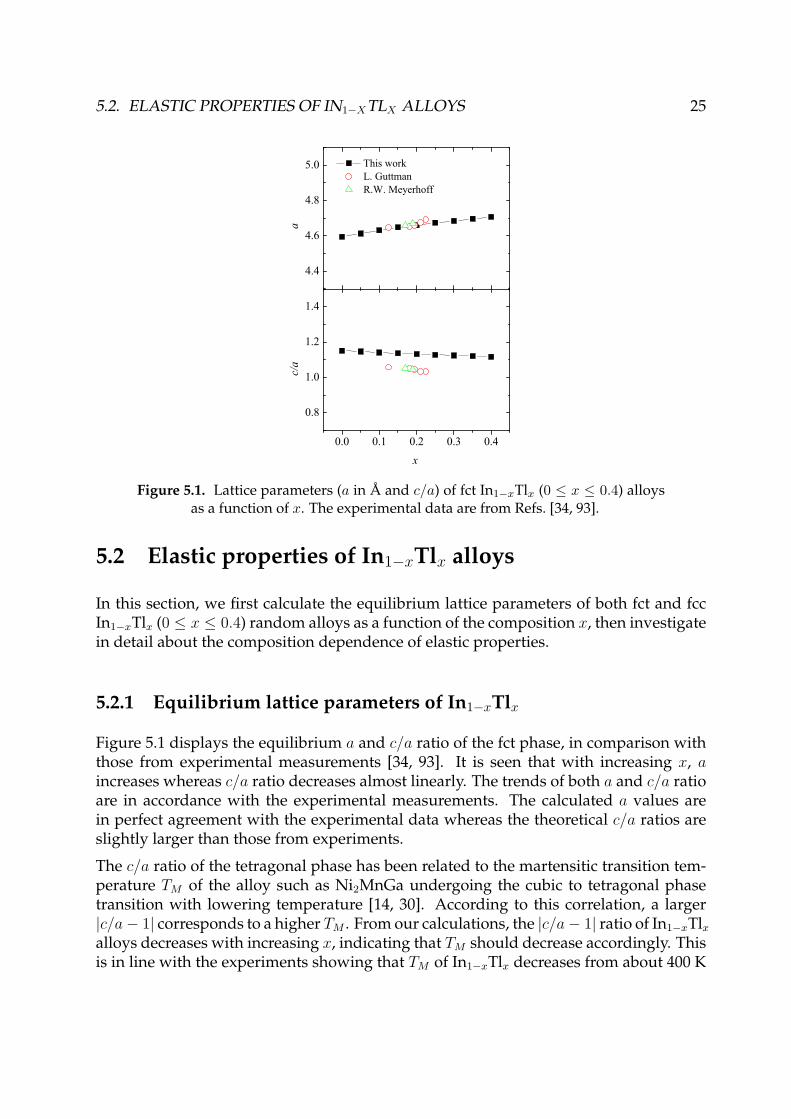
Figure 5.1. Lattice parameters (a in A and c/a) of fct In1−xTlx (0 ≤ x ≤ 0.4) alloysas a function of x. The experimental data are from Refs. [34, 93].
5.2 Elastic properties of In1−xTlx alloys
In this section, we first calculate the equilibrium lattice parameters of both fct and fccIn1−xTlx (0 ≤ x ≤ 0.4) random alloys as a function of the composition x, then investigatein detail about the composition dependence of elastic properties.
5.2.1 Equilibrium lattice parameters of In1−xTlx
Figure 5.1 displays the equilibrium a and c/a ratio of the fct phase, in comparison withthose from experimental measurements [34, 93]. It is seen that with increasing x, aincreases whereas c/a ratio decreases almost linearly. The trends of both a and c/a ratioare in accordance with the experimental measurements. The calculated a values arein perfect agreement with the experimental data whereas the theoretical c/a ratios areslightly larger than those from experiments.
The c/a ratio of the tetragonal phase has been related to the martensitic transition tem-perature TM of the alloy such as Ni2MnGa undergoing the cubic to tetragonal phasetransition with lowering temperature [14, 30]. According to this correlation, a larger|c/a− 1| corresponds to a higher TM . From our calculations, the |c/a− 1| ratio of In1−xTlxalloys decreases with increasing x, indicating that TM should decrease accordingly. Thisis in line with the experiments showing that TM of In1−xTlx decreases from about 400 K

26 CHAPTER 5. IN-TL BINARY ALLOYS
0.0 0.1 0.2 0.3 0.4
4.4
4.6
4.8
5.0
This work L. Guttman R.W. Meyerhoff
a
x
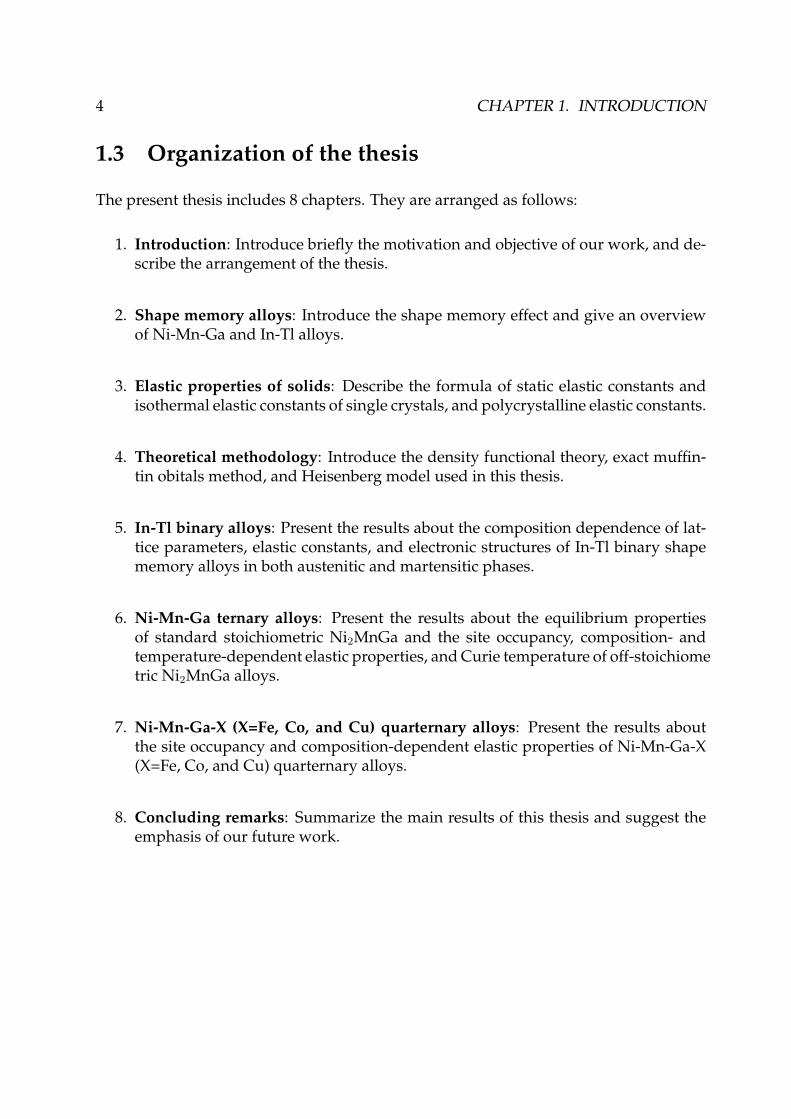
Figure 5.2. Lattice parameter (a in A) of fcc In1−xTlx (0 ≤ x ≤ 0.4) alloys as afunction of x. The experimental data are from Refs. [34, 93].
to 0 K with x increasing from about 0.2 to 0.3 [94, 95, 96].
Figure 5.2 shows the composition-dependent lattice parameter a of the fcc In1−xTlx. Asseen from the figure, a increases almost linearly with increasing x. For x > 0.2, thecalculated a values are in perfect agreement with those from experiments [34, 93]. Theexperimental a of fcc In1−xTlx with x <∼ 0.2 is not available since in this compositionrange the fcc phase is not stable.
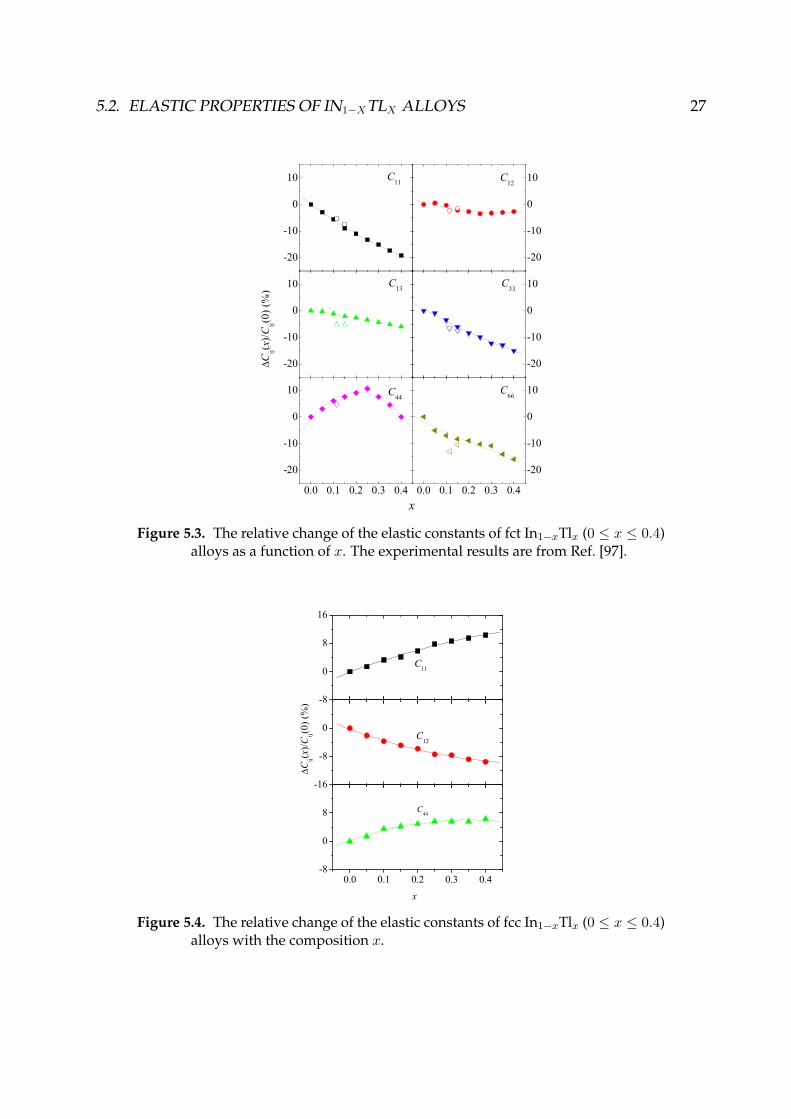
5.2.2 Static elastic constants of In1−xTlx
Figures 5.3 and 5.4 show the elastic constants relative to those of the pure In for bothfct and fcc phases of In1−xTlx (0 ≤ x ≤ 0.4) random alloys, as function of x. As shownin Figure 5.3, for the tetragonal phase, C11, C33, and C66 decrease significantly withincreasing x: for x = 0.4, C11 is 20% smaller than that of pure In whereas C33 and C66
reduce about 15%. C13 also decreases linearly with increasing x but the decreasing ismoderate compared to C11, C33, and C66: with x up to 0.4, C13 decreases about 5%. Thevariation of C12 and C44 with x is quite small and non-linear. C12 decreases slightly withincreasing x and remains almost constant with x >∼ 0.25. C44 increases slightly with xup to x = 0.25 and then decreases with increasing x for x >∼ 0.25.
Figure 5.4 shows the variation of the elastic constants of fcc In1−xTlx against x. It is seenthat C11 increases whereas C12 decreases with increasing x. C44 first increases with xand then remains almost unchanged for x >∼ 0.25.
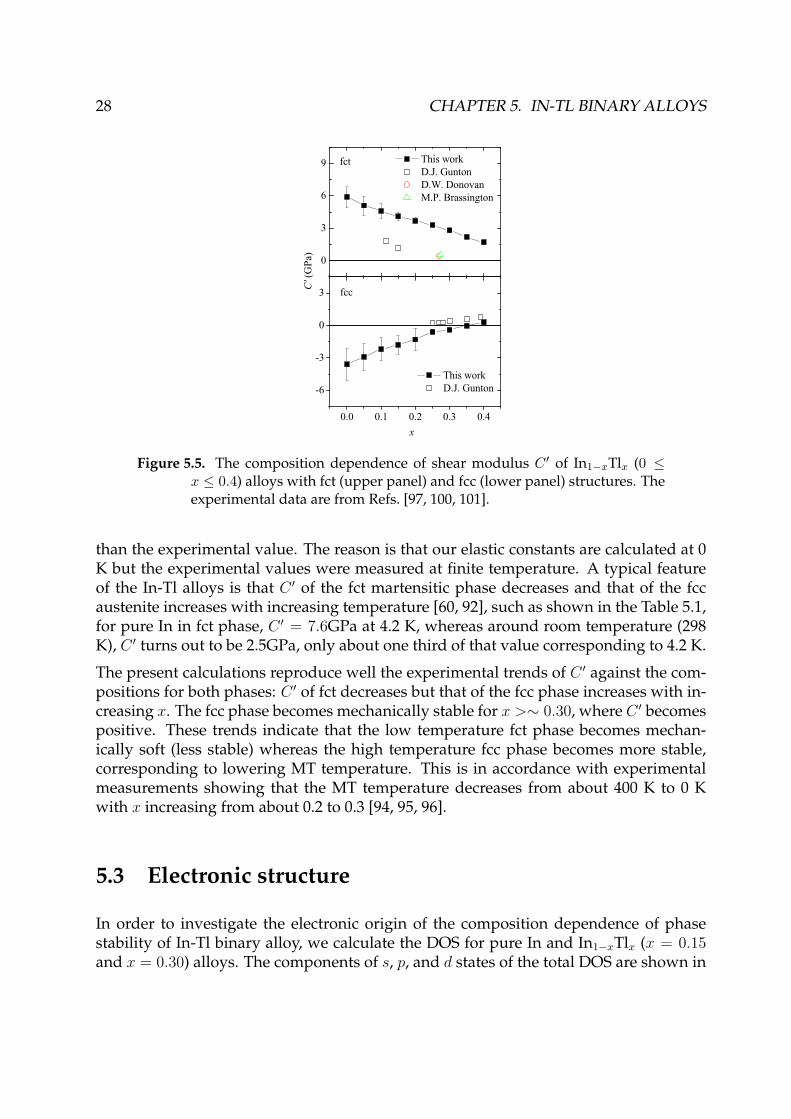
The MT of In-Tl alloys results from the soft-phonon modes and their accompanyingtetragonal shear modulus C ′ = 1
2(C11 − C12) tends to zero either from the cubic or the
tetragonal side [98, 99]. In order to correlate the elastic stability with the MT, we cal-culated the tetragonal shear moduli C ′ of both fct and fcc In1−xTlx alloys as shown inFigure 5.5. C ′ of the fct phase is larger whereas C ′ of the fcc phase is slightly smaller
5.2. ELASTIC PROPERTIES OF IN1−XTLX ALLOYS 27
-20
-10
0
10
C11
-20
-10
0
10
C12
-20
-10
0
10
C
ij(x)/C
ij(0) (
%)
C13
-20
-10
0
10
C33
0.0 0.1 0.2 0.3 0.4
-20
-10
0
10
C44
x0.0 0.1 0.2 0.3 0.4
-20
-10
0
10
C66
Figure 5.3. The relative change of the elastic constants of fct In1−xTlx (0 ≤ x ≤ 0.4)alloys as a function of x. The experimental results are from Ref. [97].
0.0 0.1 0.2 0.3 0.4-8
0
8
C44
x
-16
-8
0
Cij(x
)/Cij(0
) (%
)
C12
-8
0
8
16
C11
Figure 5.4. The relative change of the elastic constants of fcc In1−xTlx (0 ≤ x ≤ 0.4)alloys with the composition x.
28 CHAPTER 5. IN-TL BINARY ALLOYS
0.0 0.1 0.2 0.3 0.4
-6
-3
0
3
This work D.J. Gunton
fcc
C' (
GPa
)
x
0
3
6
9 This work D.J. Gunton D.W. Donovan M.P. Brassington
fct
Figure 5.5. The composition dependence of shear modulus C ′ of In1−xTlx (0 ≤x ≤ 0.4) alloys with fct (upper panel) and fcc (lower panel) structures. Theexperimental data are from Refs. [97, 100, 101].
than the experimental value. The reason is that our elastic constants are calculated at 0K but the experimental values were measured at finite temperature. A typical featureof the In-Tl alloys is that C ′ of the fct martensitic phase decreases and that of the fccaustenite increases with increasing temperature [60, 92], such as shown in the Table 5.1,for pure In in fct phase, C ′ = 7.6GPa at 4.2 K, whereas around room temperature (298K), C ′ turns out to be 2.5GPa, only about one third of that value corresponding to 4.2 K.
The present calculations reproduce well the experimental trends of C ′ against the com-positions for both phases: C ′ of fct decreases but that of the fcc phase increases with in-creasing x. The fcc phase becomes mechanically stable for x >∼ 0.30, where C ′ becomespositive. These trends indicate that the low temperature fct phase becomes mechan-ically soft (less stable) whereas the high temperature fcc phase becomes more stable,corresponding to lowering MT temperature. This is in accordance with experimentalmeasurements showing that the MT temperature decreases from about 400 K to 0 Kwith x increasing from about 0.2 to 0.3 [94, 95, 96].
5.3 Electronic structure
In order to investigate the electronic origin of the composition dependence of phasestability of In-Tl binary alloy, we calculate the DOS for pure In and In1−xTlx (x = 0.15and x = 0.30) alloys. The components of s, p, and d states of the total DOS are shown in
5.3. ELECTRONIC STRUCTURE 29
-0.4 -0.2 0.00
2
4
6(b)
Energy relative to Fermi level (Ry)
s
p
d
0
2
4
6 x=0.00 x=0.15 x=0.30
DO
S (s
tate
s/R
y)
(a)
s
p
d
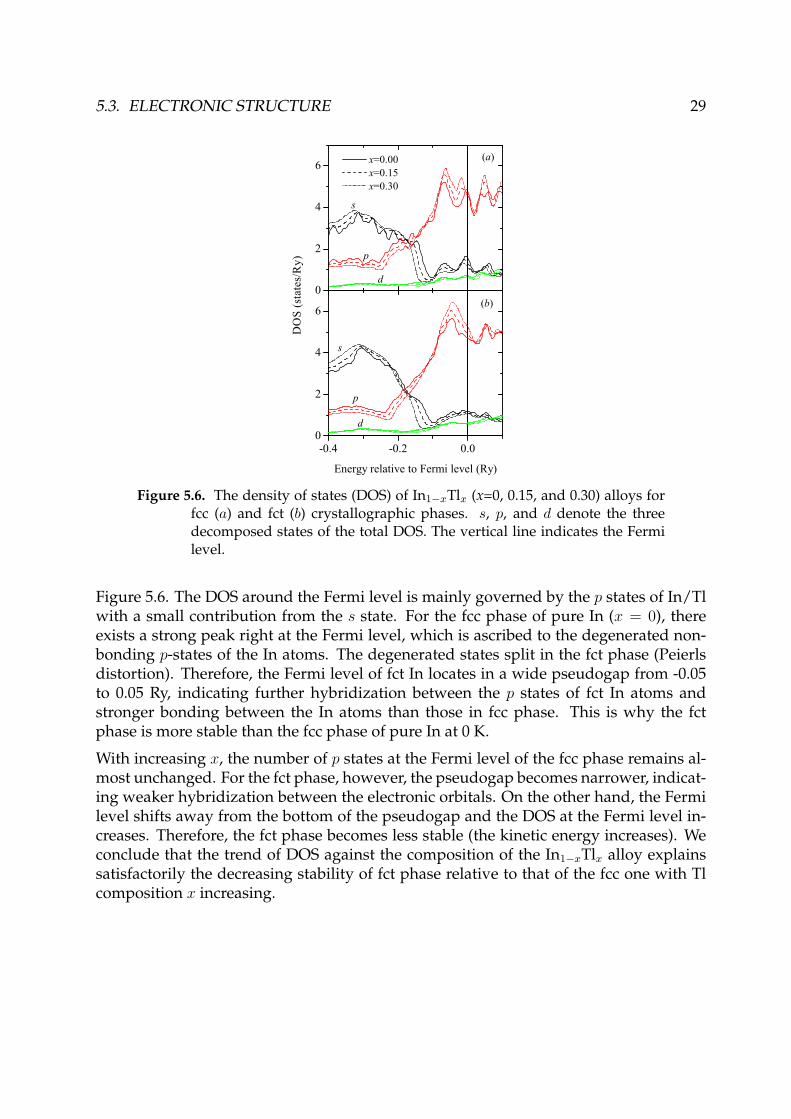
Figure 5.6. The density of states (DOS) of In1−xTlx (x=0, 0.15, and 0.30) alloys forfcc (a) and fct (b) crystallographic phases. s, p, and d denote the threedecomposed states of the total DOS. The vertical line indicates the Fermilevel.
Figure 5.6. The DOS around the Fermi level is mainly governed by the p states of In/Tlwith a small contribution from the s state. For the fcc phase of pure In (x = 0), thereexists a strong peak right at the Fermi level, which is ascribed to the degenerated non-bonding p-states of the In atoms. The degenerated states split in the fct phase (Peierlsdistortion). Therefore, the Fermi level of fct In locates in a wide pseudogap from -0.05to 0.05 Ry, indicating further hybridization between the p states of fct In atoms andstronger bonding between the In atoms than those in fcc phase. This is why the fctphase is more stable than the fcc phase of pure In at 0 K.
With increasing x, the number of p states at the Fermi level of the fcc phase remains al-most unchanged. For the fct phase, however, the pseudogap becomes narrower, indicat-ing weaker hybridization between the electronic orbitals. On the other hand, the Fermilevel shifts away from the bottom of the pseudogap and the DOS at the Fermi level in-creases. Therefore, the fct phase becomes less stable (the kinetic energy increases). Weconclude that the trend of DOS against the composition of the In1−xTlx alloy explainssatisfactorily the decreasing stability of fct phase relative to that of the fcc one with Tlcomposition x increasing.
Chapter 6
Ni-Mn-Ga ternary alloys
The ternary intermetallic compound Ni-Mn-Ga has attracted a lot of attention amongresearchers due to its ferromagnetism and SME controlled by the reversible MT. Uponalloying, both the structural transition temperature TM and magnetic transition temper-ature TC can be sensitively tuned. The TM and TC have been found dependent on thequenching temperature and the subsequent heat treatment which changes the degree ofthe L21 long-range atomic order (site occupancy) of the alloy. This result demonstratedthat the site occupancy can be a very important issue affecting the structural and mag-netic transitions. Besides, for the structural stability, it has been recognized closely re-lated to the single-crystal elastic modulus: the softer is the shear modulus (mainly C ′),the higher the TM . However, this established correlation between C ′ and TM is basedon the lack of the temperature effect on C ′ and the critical C ′(x, TM(x)) at which the MToccurs is assumed keeping almost constant at the different compositions. On the otherhand, within the mean-field approximation, the magnetic transition temperature TC ofNi2MnGa from the Heisenberg model was found to be rather close to the experimentalvalue [33].
In this chapter, we will investigate in detail the site occupancy (Sec. 6.2), both thecomposition (Sec. 6.3) and temperature-dependent elastic properties (Sec. 6.4), andthe Curie temperature (Sec. 6.5) of Ni-Mn-Ga-based alloys. The site occupancy andthe composition-dependent elastic properties are studied by using nine types of off-stoichiometric Ni2MnGa alloys with 12 different compositions, whereas for the inves-tigations of the temperature-dependent elastic properties and the Curie temperature,the Ni-rich and Mn-deficient Ni2+xMn1−xGa family is chosen because generally thistype of alloys is ferromagnetic SMAs with attractive properties such as giant magne-tocaloric effect, magnetostriction, and magnetoresistance due to the coupling betweenthe structural and magnetic transitions, and the MT temperature is highly sensitive tothe composition of the alloy.
The investigations of site occupancy and composition-dependent elastic properties comefrom the supplements II and III; the study of the Curie temperature from supplement
30
6.1. PROPERTIES OF NI2MNGA 31
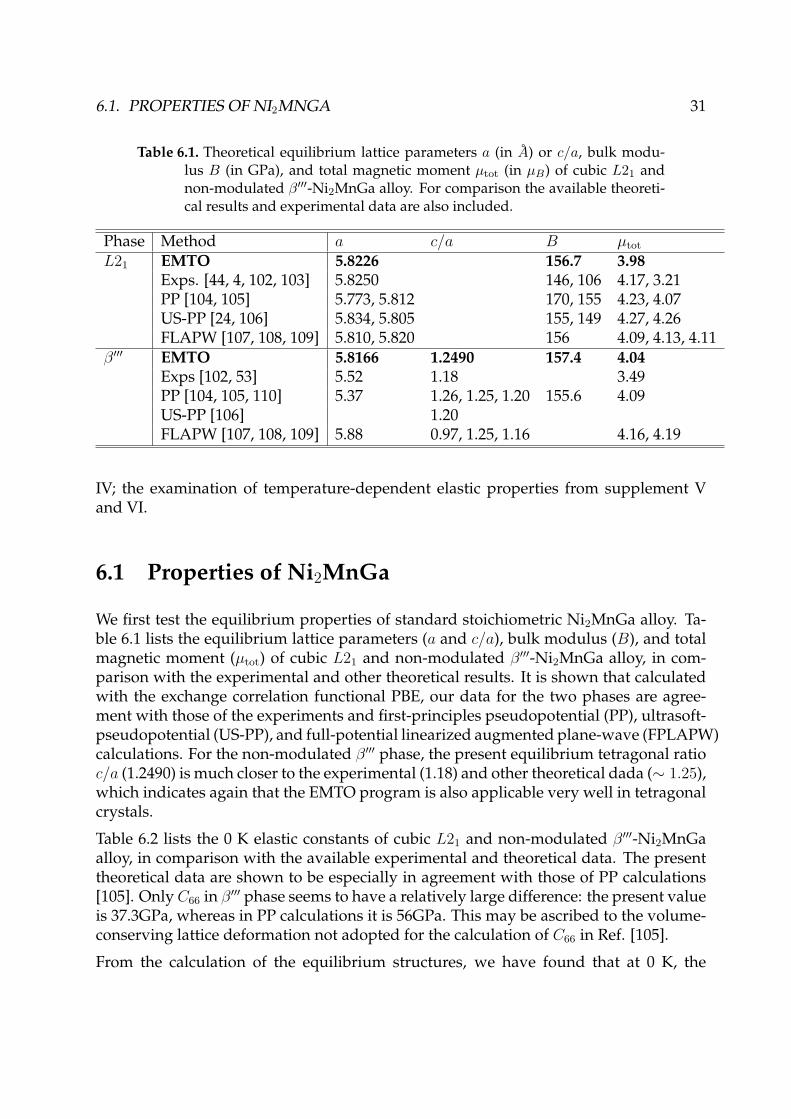
Table 6.1. Theoretical equilibrium lattice parameters a (in A) or c/a, bulk modu-lus B (in GPa), and total magnetic moment µtot (in µB) of cubic L21 andnon-modulated β′′′-Ni2MnGa alloy. For comparison the available theoreti-cal results and experimental data are also included.
Phase Method a c/a B µtot
L21 EMTO 5.8226 156.7 3.98Exps. [44, 4, 102, 103] 5.8250 146, 106 4.17, 3.21PP [104, 105] 5.773, 5.812 170, 155 4.23, 4.07US-PP [24, 106] 5.834, 5.805 155, 149 4.27, 4.26FLAPW [107, 108, 109] 5.810, 5.820 156 4.09, 4.13, 4.11
β′′′ EMTO 5.8166 1.2490 157.4 4.04Exps [102, 53] 5.52 1.18 3.49PP [104, 105, 110] 5.37 1.26, 1.25, 1.20 155.6 4.09US-PP [106] 1.20FLAPW [107, 108, 109] 5.88 0.97, 1.25, 1.16 4.16, 4.19
IV; the examination of temperature-dependent elastic properties from supplement Vand VI.
6.1 Properties of Ni2MnGa
We first test the equilibrium properties of standard stoichiometric Ni2MnGa alloy. Ta-ble 6.1 lists the equilibrium lattice parameters (a and c/a), bulk modulus (B), and totalmagnetic moment (µtot) of cubic L21 and non-modulated β′′′-Ni2MnGa alloy, in com-parison with the experimental and other theoretical results. It is shown that calculatedwith the exchange correlation functional PBE, our data for the two phases are agree-ment with those of the experiments and first-principles pseudopotential (PP), ultrasoft-pseudopotential (US-PP), and full-potential linearized augmented plane-wave (FPLAPW)calculations. For the non-modulated β′′′ phase, the present equilibrium tetragonal ratioc/a (1.2490) is much closer to the experimental (1.18) and other theoretical dada (∼ 1.25),which indicates again that the EMTO program is also applicable very well in tetragonalcrystals.
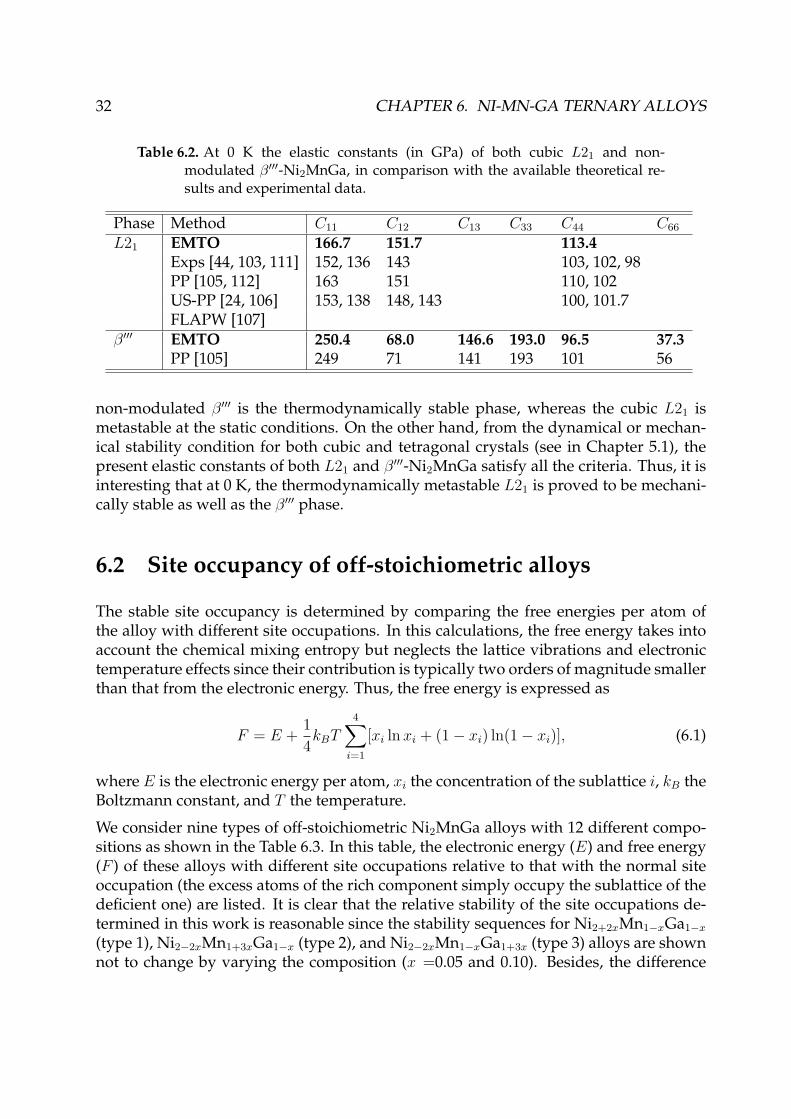
Table 6.2 lists the 0 K elastic constants of cubic L21 and non-modulated β′′′-Ni2MnGaalloy, in comparison with the available experimental and theoretical data. The presenttheoretical data are shown to be especially in agreement with those of PP calculations[105]. Only C66 in β′′′ phase seems to have a relatively large difference: the present valueis 37.3GPa, whereas in PP calculations it is 56GPa. This may be ascribed to the volume-conserving lattice deformation not adopted for the calculation of C66 in Ref. [105].
From the calculation of the equilibrium structures, we have found that at 0 K, the
32 CHAPTER 6. NI-MN-GA TERNARY ALLOYS
Table 6.2. At 0 K the elastic constants (in GPa) of both cubic L21 and non-modulated β′′′-Ni2MnGa, in comparison with the available theoretical re-sults and experimental data.
Phase Method C11 C12 C13 C33 C44 C66
L21 EMTO 166.7 151.7 113.4Exps [44, 103, 111] 152, 136 143 103, 102, 98PP [105, 112] 163 151 110, 102US-PP [24, 106] 153, 138 148, 143 100, 101.7FLAPW [107]
β′′′ EMTO 250.4 68.0 146.6 193.0 96.5 37.3PP [105] 249 71 141 193 101 56
non-modulated β′′′ is the thermodynamically stable phase, whereas the cubic L21 ismetastable at the static conditions. On the other hand, from the dynamical or mechan-ical stability condition for both cubic and tetragonal crystals (see in Chapter 5.1), thepresent elastic constants of both L21 and β′′′-Ni2MnGa satisfy all the criteria. Thus, it isinteresting that at 0 K, the thermodynamically metastable L21 is proved to be mechani-cally stable as well as the β′′′ phase.
6.2 Site occupancy of off-stoichiometric alloys
The stable site occupancy is determined by comparing the free energies per atom ofthe alloy with different site occupations. In this calculations, the free energy takes intoaccount the chemical mixing entropy but neglects the lattice vibrations and electronictemperature effects since their contribution is typically two orders of magnitude smallerthan that from the electronic energy. Thus, the free energy is expressed as
F = E +1
4kBT
4∑i=1
[xi ln xi + (1− xi) ln(1− xi)], (6.1)
where E is the electronic energy per atom, xi the concentration of the sublattice i, kB theBoltzmann constant, and T the temperature.
We consider nine types of off-stoichiometric Ni2MnGa alloys with 12 different compo-sitions as shown in the Table 6.3. In this table, the electronic energy (E) and free energy(F ) of these alloys with different site occupations relative to that with the normal siteoccupation (the excess atoms of the rich component simply occupy the sublattice of thedeficient one) are listed. It is clear that the relative stability of the site occupations de-termined in this work is reasonable since the stability sequences for Ni2+2xMn1−xGa1−x
(type 1), Ni2−2xMn1+3xGa1−x (type 2), and Ni2−2xMn1−xGa1+3x (type 3) alloys are shownnot to change by varying the composition (x =0.05 and 0.10). Besides, the difference
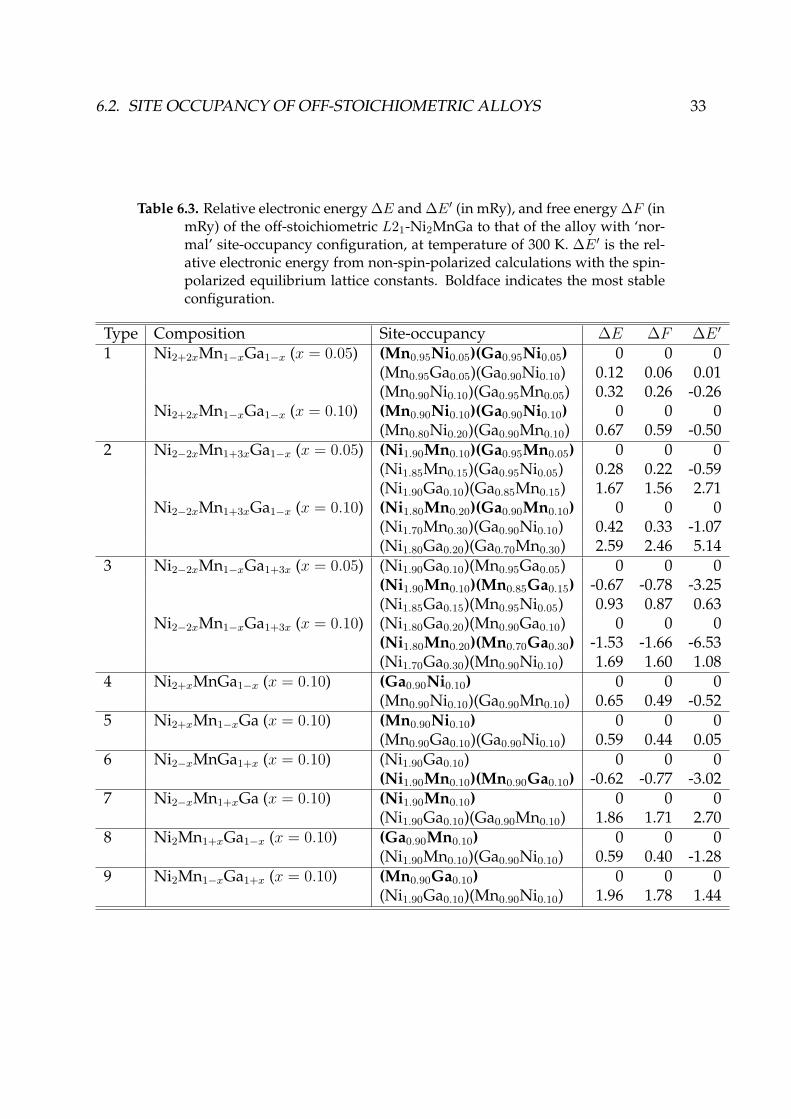
6.2. SITE OCCUPANCY OF OFF-STOICHIOMETRIC ALLOYS 33
Table 6.3. Relative electronic energy ∆E and ∆E′ (in mRy), and free energy ∆F (inmRy) of the off-stoichiometric L21-Ni2MnGa to that of the alloy with ‘nor-mal’ site-occupancy configuration, at temperature of 300 K. ∆E′ is the rel-ative electronic energy from non-spin-polarized calculations with the spin-polarized equilibrium lattice constants. Boldface indicates the most stableconfiguration.
Type Composition Site-occupancy ∆E ∆F ∆E ′
1 Ni2+2xMn1−xGa1−x (x = 0.05) (Mn0.95Ni0.05)(Ga0.95Ni0.05) 0 0 0(Mn0.95Ga0.05)(Ga0.90Ni0.10) 0.12 0.06 0.01(Mn0.90Ni0.10)(Ga0.95Mn0.05) 0.32 0.26 -0.26
Ni2+2xMn1−xGa1−x (x = 0.10) (Mn0.90Ni0.10)(Ga0.90Ni0.10) 0 0 0(Mn0.80Ni0.20)(Ga0.90Mn0.10) 0.67 0.59 -0.50
2 Ni2−2xMn1+3xGa1−x (x = 0.05) (Ni1.90Mn0.10)(Ga0.95Mn0.05) 0 0 0(Ni1.85Mn0.15)(Ga0.95Ni0.05) 0.28 0.22 -0.59(Ni1.90Ga0.10)(Ga0.85Mn0.15) 1.67 1.56 2.71
Ni2−2xMn1+3xGa1−x (x = 0.10) (Ni1.80Mn0.20)(Ga0.90Mn0.10) 0 0 0(Ni1.70Mn0.30)(Ga0.90Ni0.10) 0.42 0.33 -1.07(Ni1.80Ga0.20)(Ga0.70Mn0.30) 2.59 2.46 5.14
3 Ni2−2xMn1−xGa1+3x (x = 0.05) (Ni1.90Ga0.10)(Mn0.95Ga0.05) 0 0 0(Ni1.90Mn0.10)(Mn0.85Ga0.15) -0.67 -0.78 -3.25(Ni1.85Ga0.15)(Mn0.95Ni0.05) 0.93 0.87 0.63
Ni2−2xMn1−xGa1+3x (x = 0.10) (Ni1.80Ga0.20)(Mn0.90Ga0.10) 0 0 0(Ni1.80Mn0.20)(Mn0.70Ga0.30) -1.53 -1.66 -6.53(Ni1.70Ga0.30)(Mn0.90Ni0.10) 1.69 1.60 1.08
4 Ni2+xMnGa1−x (x = 0.10) (Ga0.90Ni0.10) 0 0 0(Mn0.90Ni0.10)(Ga0.90Mn0.10) 0.65 0.49 -0.52
5 Ni2+xMn1−xGa (x = 0.10) (Mn0.90Ni0.10) 0 0 0(Mn0.90Ga0.10)(Ga0.90Ni0.10) 0.59 0.44 0.05
6 Ni2−xMnGa1+x (x = 0.10) (Ni1.90Ga0.10) 0 0 0(Ni1.90Mn0.10)(Mn0.90Ga0.10) -0.62 -0.77 -3.02
7 Ni2−xMn1+xGa (x = 0.10) (Ni1.90Mn0.10) 0 0 0(Ni1.90Ga0.10)(Ga0.90Mn0.10) 1.86 1.71 2.70
8 Ni2Mn1+xGa1−x (x = 0.10) (Ga0.90Mn0.10) 0 0 0(Ni1.90Mn0.10)(Ga0.90Ni0.10) 0.59 0.40 -1.28
9 Ni2Mn1−xGa1+x (x = 0.10) (Mn0.90Ga0.10) 0 0 0(Ni1.90Ga0.10)(Mn0.90Ni0.10) 1.96 1.78 1.44

34 CHAPTER 6. NI-MN-GA TERNARY ALLOYS
between relative electronic energy (∆E) and free energy (∆F ) for an alloy with thesame site-occupation configuration is very small at 300 K. Therefore, in the temperaturerange of interest, the mixing entropy cannot change the relative stability of the site oc-cupations, which means that the electronic energy comparison is actually sufficient todetermine the stable site occupancy.
As shown in Table 6.3, the normal site occupation for most of the off-stoichiometricalloys is more stable than the abnormal one (the excess atoms of the rich componentoccupy the sublattice of the component at standard composition instead of the sublatticeof the component in deficiency) except for the case of Ni2−2xMn1−xGa1+3x (type 3) andNi2−xMnGa1+x (x =0.10, type 6). In the Ni2−2xMn1−xGa1+3x alloy, the excess Ga atomsdo not occupy evenly the two Ni sublattices and the Mn sublattice but occupy solely theMn sublattice whereas some of the Mn atoms move to the Ni sublattices. Similarly, inthe Ni2−xMnGa1+x (x =0.10) alloy, the excess Ga atoms again prefer the Mn sublatticealthough it is Ni instead of Mn that is in deficiency, which is line with the most recentlydetermined site occupancy of Ni2−xMnGa1+x by Sanchez-Alarcos et al. [20].
In this work, it is confirmed that the site occupancy of the off-stoichiometric Ni2MnGais strongly controlled by the complex interaction between the chemical and magneticeffects. Comparing the relative electronic energies ∆E and ∆E ′ calculated, respec-tively, with and without spin polarization, it is seen that, for the same alloy, if thereexist Mn atoms occupying different sublattices in different site-occupation configura-tions, ∆E differs dramatically from ∆E ′, indicating that the magnetic effect on the siteoccupancy is very strong. For some of the alloys, the magnetic effect even alters thestability sequence of the site occupations. For example, the abnormal site occupationof the Ni2+xMnGa1−x (x =0.10, type 4) and Ni2Mn1+xGa1−x (x =0.10, type 8) is morestable than the normal one from non-spin-polarized calculations but the latter becomesmore stable from spin-polarized calculations. However, for the alloy in which thereis no Mn atom changing its sublattice in different site-occupation configurations (e.g.,Ni2Mn1−xGa1+x, x =0.10, and Ni2+xMn1−xGa, x =0.10), the difference between ∆E and∆E ′ is much smaller than that in the case discussed above. The magnetic effect is com-plicated and composition-dependent. For most of these alloys involved in this study,∆E is larger than ∆E ′, which means that the magnetic effect tends to stabilize the nor-mal site-occupation configuration.
6.3 Composition-dependent elastic properties
Based on the determined site occupancy in the above section, the elastic moduli of thenine types of off-stoichiometric Ni2MnGa alloys with 12 different compositions are in-vestigated in this section. Here, the composition dependence of elastic constants aredescribed with the curve of elastic constants versus the electron to atom ratio (e/a).Furthermore, by means of the obtained theoretical results, we collect the experimental
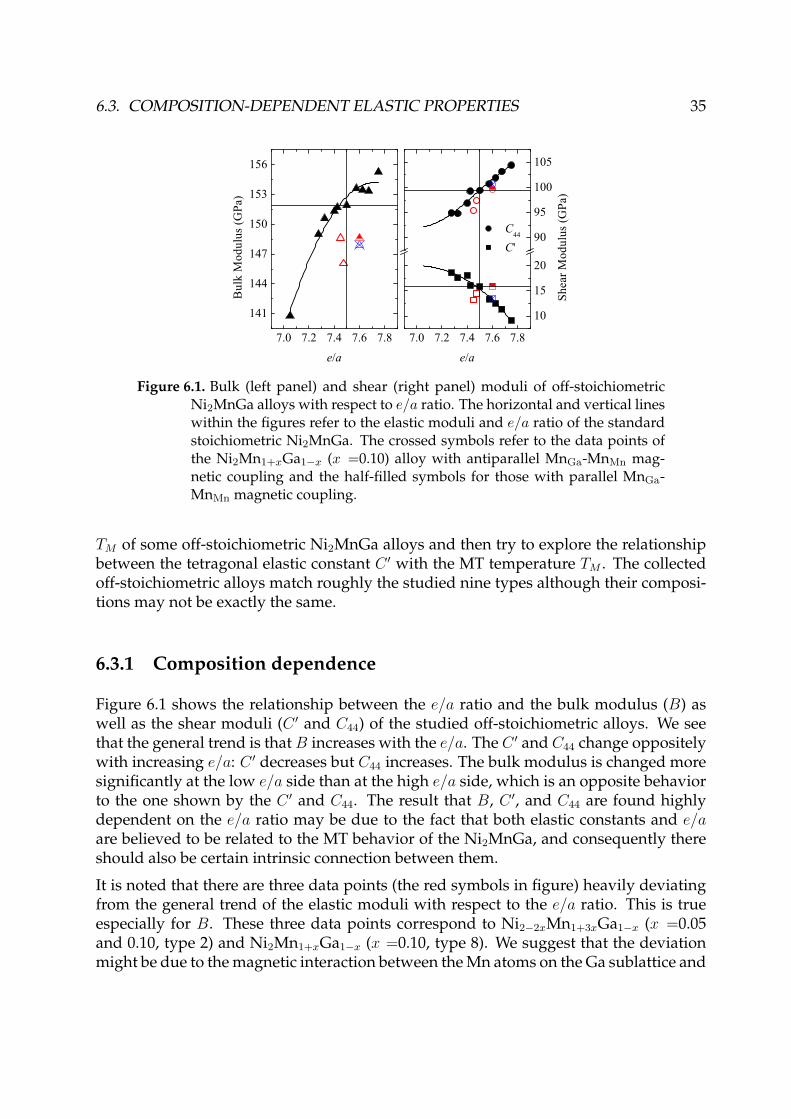
6.3. COMPOSITION-DEPENDENT ELASTIC PROPERTIES 35
7.0 7.2 7.4 7.6 7.8
141
144
147
150
153
156
7.0 7.2 7.4 7.6 7.8
10
15
20
90
95
100
105
Bul
k M
odul
us (G
Pa)
e/a
Shea
r Mod
ulus
(GPa
)
C44
C'
e/a
Figure 6.1. Bulk (left panel) and shear (right panel) moduli of off-stoichiometricNi2MnGa alloys with respect to e/a ratio. The horizontal and vertical lineswithin the figures refer to the elastic moduli and e/a ratio of the standardstoichiometric Ni2MnGa. The crossed symbols refer to the data points ofthe Ni2Mn1+xGa1−x (x =0.10) alloy with antiparallel MnGa-MnMn mag-netic coupling and the half-filled symbols for those with parallel MnGa-MnMn magnetic coupling.
TM of some off-stoichiometric Ni2MnGa alloys and then try to explore the relationshipbetween the tetragonal elastic constant C ′ with the MT temperature TM . The collectedoff-stoichiometric alloys match roughly the studied nine types although their composi-tions may not be exactly the same.
6.3.1 Composition dependence
Figure 6.1 shows the relationship between the e/a ratio and the bulk modulus (B) aswell as the shear moduli (C ′ and C44) of the studied off-stoichiometric alloys. We seethat the general trend is that B increases with the e/a. The C ′ and C44 change oppositelywith increasing e/a: C ′ decreases but C44 increases. The bulk modulus is changed moresignificantly at the low e/a side than at the high e/a side, which is an opposite behaviorto the one shown by the C ′ and C44. The result that B, C ′, and C44 are found highlydependent on the e/a ratio may be due to the fact that both elastic constants and e/aare believed to be related to the MT behavior of the Ni2MnGa, and consequently thereshould also be certain intrinsic connection between them.
It is noted that there are three data points (the red symbols in figure) heavily deviatingfrom the general trend of the elastic moduli with respect to the e/a ratio. This is trueespecially for B. These three data points correspond to Ni2−2xMn1+3xGa1−x (x =0.05and 0.10, type 2) and Ni2Mn1+xGa1−x (x =0.10, type 8). We suggest that the deviationmight be due to the magnetic interaction between the Mn atoms on the Ga sublattice and
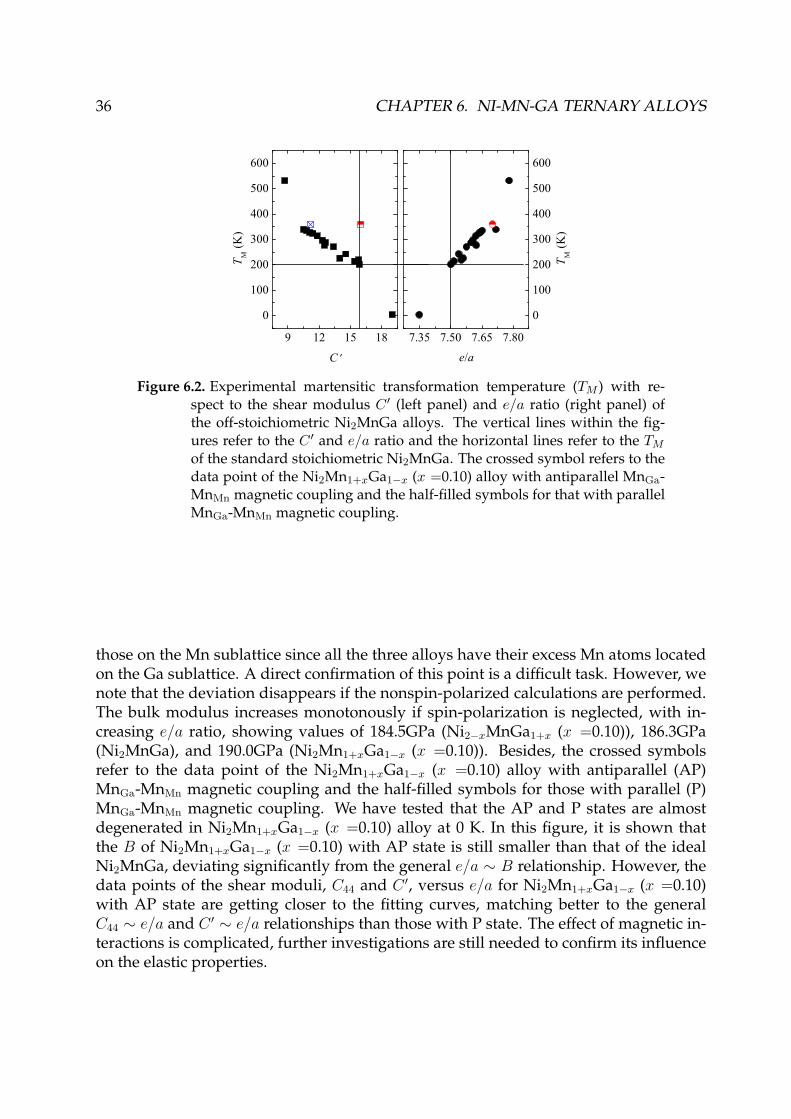
36 CHAPTER 6. NI-MN-GA TERNARY ALLOYS
9 12 15 18
0
100
200
300
400
500
600
T M (K
)
C
7.35 7.50 7.65 7.80
0
100
200
300
400
500
600
T M (K
)
e/a
Figure 6.2. Experimental martensitic transformation temperature (TM ) with re-spect to the shear modulus C ′ (left panel) and e/a ratio (right panel) ofthe off-stoichiometric Ni2MnGa alloys. The vertical lines within the fig-ures refer to the C ′ and e/a ratio and the horizontal lines refer to the TM
of the standard stoichiometric Ni2MnGa. The crossed symbol refers to thedata point of the Ni2Mn1+xGa1−x (x =0.10) alloy with antiparallel MnGa-MnMn magnetic coupling and the half-filled symbols for that with parallelMnGa-MnMn magnetic coupling.
those on the Mn sublattice since all the three alloys have their excess Mn atoms locatedon the Ga sublattice. A direct confirmation of this point is a difficult task. However, wenote that the deviation disappears if the nonspin-polarized calculations are performed.The bulk modulus increases monotonously if spin-polarization is neglected, with in-creasing e/a ratio, showing values of 184.5GPa (Ni2−xMnGa1+x (x =0.10)), 186.3GPa(Ni2MnGa), and 190.0GPa (Ni2Mn1+xGa1−x (x =0.10)). Besides, the crossed symbolsrefer to the data point of the Ni2Mn1+xGa1−x (x =0.10) alloy with antiparallel (AP)MnGa-MnMn magnetic coupling and the half-filled symbols for those with parallel (P)MnGa-MnMn magnetic coupling. We have tested that the AP and P states are almostdegenerated in Ni2Mn1+xGa1−x (x =0.10) alloy at 0 K. In this figure, it is shown thatthe B of Ni2Mn1+xGa1−x (x =0.10) with AP state is still smaller than that of the idealNi2MnGa, deviating significantly from the general e/a ∼ B relationship. However, thedata points of the shear moduli, C44 and C ′, versus e/a for Ni2Mn1+xGa1−x (x =0.10)with AP state are getting closer to the fitting curves, matching better to the generalC44 ∼ e/a and C ′ ∼ e/a relationships than those with P state. The effect of magnetic in-teractions is complicated, further investigations are still needed to confirm its influenceon the elastic properties.
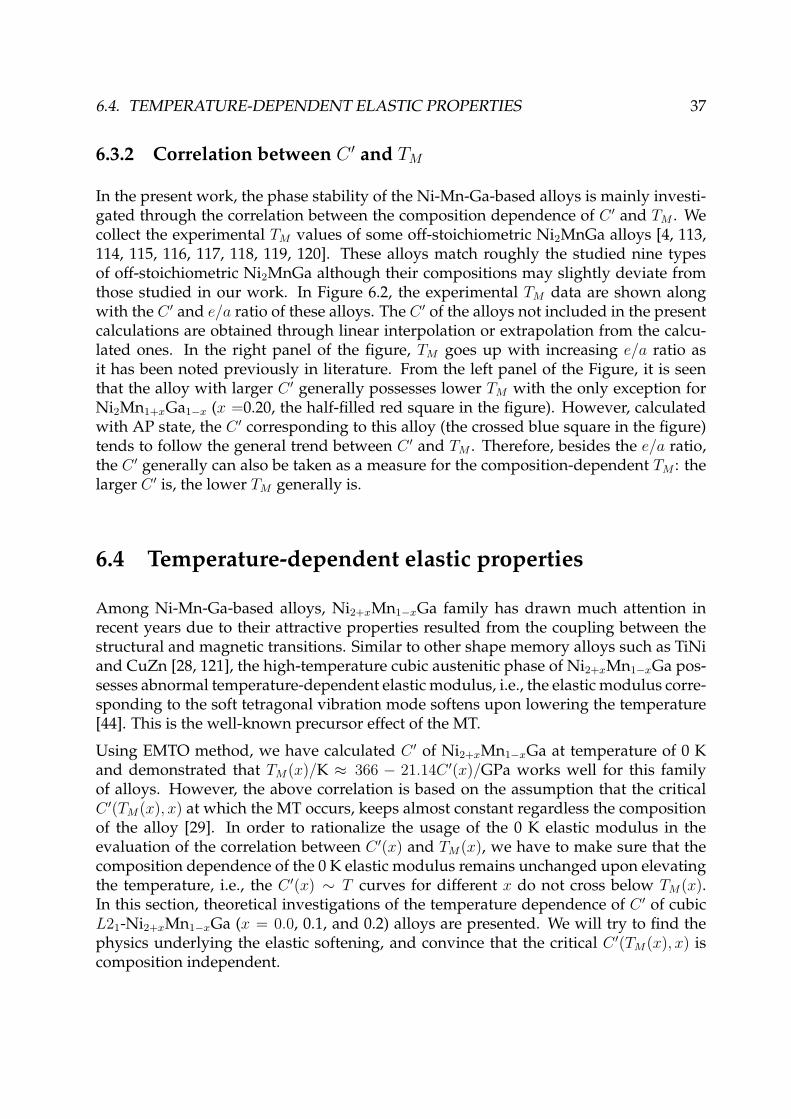
6.4. TEMPERATURE-DEPENDENT ELASTIC PROPERTIES 37
6.3.2 Correlation between C ′ and TM
In the present work, the phase stability of the Ni-Mn-Ga-based alloys is mainly investi-gated through the correlation between the composition dependence of C ′ and TM . Wecollect the experimental TM values of some off-stoichiometric Ni2MnGa alloys [4, 113,114, 115, 116, 117, 118, 119, 120]. These alloys match roughly the studied nine typesof off-stoichiometric Ni2MnGa although their compositions may slightly deviate fromthose studied in our work. In Figure 6.2, the experimental TM data are shown alongwith the C ′ and e/a ratio of these alloys. The C ′ of the alloys not included in the presentcalculations are obtained through linear interpolation or extrapolation from the calcu-lated ones. In the right panel of the figure, TM goes up with increasing e/a ratio asit has been noted previously in literature. From the left panel of the Figure, it is seenthat the alloy with larger C ′ generally possesses lower TM with the only exception forNi2Mn1+xGa1−x (x =0.20, the half-filled red square in the figure). However, calculatedwith AP state, the C ′ corresponding to this alloy (the crossed blue square in the figure)tends to follow the general trend between C ′ and TM . Therefore, besides the e/a ratio,the C ′ generally can also be taken as a measure for the composition-dependent TM : thelarger C ′ is, the lower TM generally is.
6.4 Temperature-dependent elastic properties
Among Ni-Mn-Ga-based alloys, Ni2+xMn1−xGa family has drawn much attention inrecent years due to their attractive properties resulted from the coupling between thestructural and magnetic transitions. Similar to other shape memory alloys such as TiNiand CuZn [28, 121], the high-temperature cubic austenitic phase of Ni2+xMn1−xGa pos-sesses abnormal temperature-dependent elastic modulus, i.e., the elastic modulus corre-sponding to the soft tetragonal vibration mode softens upon lowering the temperature[44]. This is the well-known precursor effect of the MT.
Using EMTO method, we have calculated C ′ of Ni2+xMn1−xGa at temperature of 0 Kand demonstrated that TM(x)/K ≈ 366 − 21.14C ′(x)/GPa works well for this familyof alloys. However, the above correlation is based on the assumption that the criticalC ′(TM(x), x) at which the MT occurs, keeps almost constant regardless the compositionof the alloy [29]. In order to rationalize the usage of the 0 K elastic modulus in theevaluation of the correlation between C ′(x) and TM(x), we have to make sure that thecomposition dependence of the 0 K elastic modulus remains unchanged upon elevatingthe temperature, i.e., the C ′(x) ∼ T curves for different x do not cross below TM(x).In this section, theoretical investigations of the temperature dependence of C ′ of cubicL21-Ni2+xMn1−xGa (x = 0.0, 0.1, and 0.2) alloys are presented. We will try to find thephysics underlying the elastic softening, and convince that the critical C ′(TM(x), x) iscomposition independent.
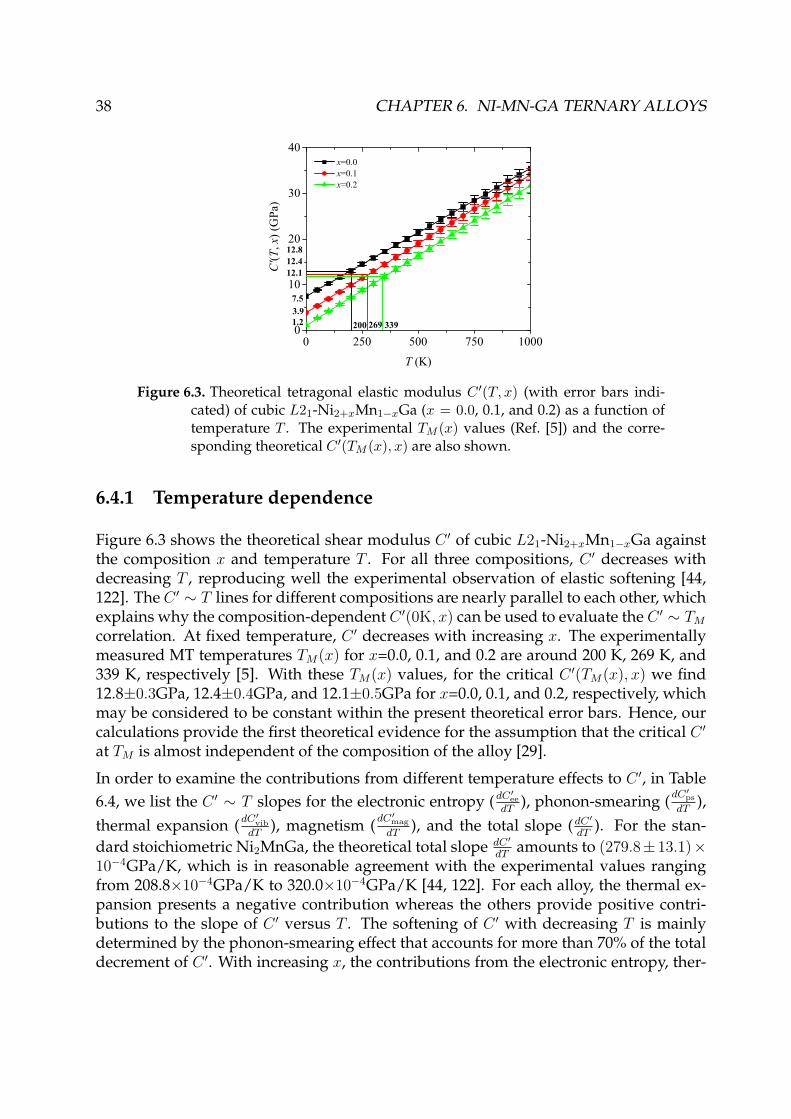
38 CHAPTER 6. NI-MN-GA TERNARY ALLOYS
0 250 500 750 10000
10
20
30
40
1.2 339
C'(T
, x) (
GPa
)
T (K)
x=0.0 x=0.1 x=0.2
3.97.5
200 269
12.812.4 12.1
Figure 6.3. Theoretical tetragonal elastic modulus C ′(T, x) (with error bars indi-cated) of cubic L21-Ni2+xMn1−xGa (x = 0.0, 0.1, and 0.2) as a function oftemperature T . The experimental TM (x) values (Ref. [5]) and the corre-sponding theoretical C ′(TM (x), x) are also shown.
6.4.1 Temperature dependence
Figure 6.3 shows the theoretical shear modulus C ′ of cubic L21-Ni2+xMn1−xGa againstthe composition x and temperature T . For all three compositions, C ′ decreases withdecreasing T , reproducing well the experimental observation of elastic softening [44,122]. The C ′ ∼ T lines for different compositions are nearly parallel to each other, whichexplains why the composition-dependent C ′(0K, x) can be used to evaluate the C ′ ∼ TM
correlation. At fixed temperature, C ′ decreases with increasing x. The experimentallymeasured MT temperatures TM(x) for x=0.0, 0.1, and 0.2 are around 200 K, 269 K, and339 K, respectively [5]. With these TM(x) values, for the critical C ′(TM(x), x) we find12.8±0.3GPa, 12.4±0.4GPa, and 12.1±0.5GPa for x=0.0, 0.1, and 0.2, respectively, whichmay be considered to be constant within the present theoretical error bars. Hence, ourcalculations provide the first theoretical evidence for the assumption that the critical C ′
at TM is almost independent of the composition of the alloy [29].
In order to examine the contributions from different temperature effects to C ′, in Table6.4, we list the C ′ ∼ T slopes for the electronic entropy (dC′ee
dT), phonon-smearing (dC′ps
dT),
thermal expansion (dC′vib
dT), magnetism (dC′mag
dT), and the total slope (dC′
dT). For the stan-
dard stoichiometric Ni2MnGa, the theoretical total slope dC′dT
amounts to (279.8± 13.1)×10−4GPa/K, which is in reasonable agreement with the experimental values rangingfrom 208.8×10⁻⁴GPa/K to 320.0×10⁻⁴GPa/K [44, 122]. For each alloy, the thermal ex-pansion presents a negative contribution whereas the others provide positive contri-butions to the slope of C ′ versus T . The softening of C ′ with decreasing T is mainlydetermined by the phonon-smearing effect that accounts for more than 70% of the totaldecrement of C ′. With increasing x, the contributions from the electronic entropy, ther-
6.5. CURIE TEMPERATURE 39
Table 6.4. Resolved C ′ ∼ T slopes: electronic entropy (dC′eedT ), phonon-smearing
(dC′ps
dT ), thermal expansion (dC′vibdT ), and magnetism (dC′mag
dT ) together with thetotal one (dC′
dT ) of cubic L21-Ni2+xMn1−xGa (x = 0.0, 0.1, and 0.2) alloys. Allin unit of 10−4GPa/K.
x Method dC′eedT
dC′ps
dT
dC′vib
dT
dC′mag
dTdC′dT
0.0 EMTO 4.7±1.5 284.0±9.8 -24.2±1.8 15.3 279.8±13.1Exps [44, 122] ∼208.8, ∼320.0
0.1 EMTO 14.3±2.5 240.4±8.7 -8.3±2.1 56.7 303.1±13.30.2 EMTO 25.0±3.7 215.2±8.8 -5.7±1.0 70.2 304.7±13.5
mal expansion, and magnetism increase, whereas that of the phonon-smearing effectdecreases. The total slope increases slightly.
6.4.2 Prediction of TM
With the calculated elastic constants, we can evaluate the Debye temperature Θ ofthe austenite and martensite, which gives us the opportunity to estimate directly theMT temperature by comparing the free energies of the two phases. The temperaturecorresponding to vanishing free energy difference (∆F ≈ ∆Eel + ∆(TS∗el) + ∆Fvib +∆Fmag) between the austenite and martensite determines the MT temperature TM . SinceNi2+xMn1−xGa with x ≤ 0.2 for both crystallographic phases is ferromagnetic and themagnetic moments do not change very much with lattice distortion, the magnetic freeenergy difference may be neglected. Furthermore, the difference between the electronicentropy contributions to ∆F is also negligible. The vibrational free energy difference,on the other hand, can be estimated from the high temperature expansion of the phononfree energy [67], ∆Fvib ≈ 3kBT ΘA−ΘM
ΘA , with ΘA and ΘM being the Debye temperaturesof the austenite and martensite, respectively, derived from our theoretical elastic con-stants. We find that, if we derive ΘA using C ′(0K, x) the critical temperatures are about97 K, 90 K, and 71 K for x=0.0, 0.1, and 0.2, respectively, as shown in Figure 6.4 (a).These figures deviate significantly from the experimental values. However, if we calcu-late ΘA using the critical C ′(TM(x), x) values (shown in Figure 6.4 (b)), the theoreticalTM(x) become 219 K, 285 K, and 342 K for x=0.0, 0.1, and 0.2, respectively, in good agree-ment with the experimental data [5]. This finding may confirm the dominant role of thetemperature dependence of C ′ around the MT.

40 CHAPTER 6. NI-MN-GA TERNARY ALLOYS
0 200 400 600-1.0
-0.5
0.0
0.5
1.0
F(T)
(mR
y)
219 285 342(b)
T (K)
x=0.0 x=0.1 x=0.2
F(T)
(mR
y)
0 50 100 150-1.0
-0.5
0.0
0.5
1.0
x=0.0 x=0.1 x=0.2
71 90 97 (a)
Figure 6.4. Free energy difference ∆F between cubic L21 and non-modulated β′′′-Ni2+xMn1−xGa (x = 0.0, 0.1, and 0.2) as a function of temperature T . Infigure (a), ΘA is calculated with C ′(0K, x), whereas in figure (b) ΘA is cal-culated with C ′(TM (x), x).
0.00 0.05 0.10 0.15 0.20 0.25 0.30 0.35
200
400
600
800
TCL2
1
TC
'''
TC
EXP.
T C(K
)
x
Figure 6.5. Theoretical TC values as a function of the Ni concentration inNi2+xMn1−xGa (0 ≤ x ≤ 0.36) alloys. Results are shown for both L21
(squares) and β′′′ (spheres) structures. The experimental TC values arefrom Ref. [5].

6.5. CURIE TEMPERATURE 41
6.5 Curie temperature
In this section, we investigate in detail the effect of Ni excess on the magnetic transitiontemperature TC of L21 and non-modulated β′′′-Ni2+xMn1−xGa (0 ≤ x ≤ 0.36) using theHeisenberg model in combination with the mean-field approximation. We first calcu-late the effective exchange parameters between Mn-Mn (JMn−Mn
0 ) and between Mn-Ni(JMn−Ni
0 ) as a function of the excess Ni concentration in the two phases. The interactionparameters with Ni atoms on Mn site (NiMn) are small and thus they are not consideredhere. After that, we get the composition dependence of the theoretical TC .
Figure 6.5 shows our theoretical TC of L21 and β′′′-Ni2+xMn1−xGa (0 ≤ x ≤ 0.36) asa function of the composition x, in comparison with the experimental results [5]. Itis shown that for both phases, TC decreases with increasing x. TC of the β′′′ phase ishigher than that of the L21 phase. For the experimental data shown in the figure, whenx < 0.18, the experimental transition temperature decreases almost linearly with in-creasing x. However, for x > 0.18, the experimental TC value increases suddenly withincreasing x. After reaching a maximum at about x = 0.25, it decreases again withx. This interesting experimental trend of TC can be understood qualitatively from thepresent results. For x < 0.18, the TM is well below the TC so that the magnetic tran-sition occurs in the L21 phase. Therefore, the TC of the system corresponds to that ofthe L21 phase and decreases with increasing x, in line with the present finding. SinceTM increases whereas TC decreases with increasing x, they become close to each otherfor x ≈ 0.18. Around this composition, the austenitic and martensitic phases may co-exist and thus the measured TC corresponds to a mixed rather than to a single phase.Since according to the present study the TC of the martensite is higher than that of theaustenitic L21 phase, it is understandable that the measured TC goes up with increasingx, i.e., with increasing content of the β′′′ phase in the system. When x exceeds 0.25, TM
becomes higher than the TC and the magnetic transition occurs within the β′′′ phase.Therefore, the measured TC corresponds solely to that of the martensite and decreasesagain with increasing x, in line with the present theory. In our work, we would like topoint out the excellent agreement between the theoretical and experimental ”jump” inthe TC around x ≈0.18 [5].
Chapter 7
Ni-Mn-Ga-X (X=Fe, Co, and Cu)quarternary alloys
The martensitic transformation behavior of Ni-Mn-Ga alloy may change drastically bydoping of a fourth element such as Fe, Co, and Cu. For example, the substitutionof Mn with Fe (Ni2Mn1−xGaFex) up to x=0.70 drops the martensitic transition tem-perature TM from 200 K to about 120 K [6], whereas the replacement of Ga by Fe(Ni52.7Mn22.1Ga25.2−xFex, x = 5.3) increases TM from 290 K to 440 K [7]. For the Coand Cu-doped Mn or Ga-deficient alloys, TM increases [8, 9, 10, 11], but it decreases ifCo or Cu replaces Ni atoms [7, 12, 13].
According to the report in the above chapter, the site occupancy of the alloying ele-ments should be an important factor affecting the composition dependence of TM inthe quarternary shape memory alloys. Besides, it deserves to examine if the correla-tion C ′ ∼ TM found in most of the off-stoichiometric Ni2MnGa alloys is also satisfiedin Fe, Co, and Cu-doped alloys. In this chapter we will first investigate the site oc-cupancy of the three alloying elements in Sec. 7.1, and then with the stable site oc-cupancy, we study in detail about the composition dependence of elastic constants,electronic structures, and the correlation between C ′ and TM in Sec. 7.2. In our work,for each alloying element X (X=Fe, Co, and Cu), we consider 3 types of compositions:Ni-deficient (Ni2−xMnGaXx) (type 1), Mn-deficient (Ni2Mn1−xGaXx) (type 2), and Ga-deficient (Ni2MnGa1−xXx) (type 3).
This chapter is based on supplement VII.
7.1 Site occupancy
We consider 5 different site-occupation configurations for each type of Fe/Co/Cu-dopedalloys with the composition x = 0.05. Taking the Ni-deficient alloy as example, the 5
42
7.1. SITE OCCUPANCY 43
site-occupation configurations are: (A) the “normal” site-occupation with x X atoms oc-cupying Ni-sublattice (denoted as XNi); (B) x X atoms occupying Mn-sublattice (XMn)and x Mn atoms moving to Ni-sublattice (MnNi); (C) x X occupying Ga-sublattice (XGa)and x Ga atoms moving to Ni-sublattice (GaNi); (D) x X occupying Mn-sublattice (XMn),and x Mn atoms moving to Ga-sublattice (MnGa) and x Ga atoms moving to Ni-sublattice;(E) x X occupying Ga-sublattice, and x Ga atoms moving to Mn-sublattice (GaMn) and xMn atoms moving to Ni-sublattice. The stable site-occupation is determined by compar-ing the 5 different site-occupation configurations’ free energies F , which is calculatedwith Eq. (6.1). To observe the effects of temperature and magnetism, we also presentthe electronic energies E and E ′, calculated with and without spin-polarization, respec-tively. The relative energies are presented as ∆F , ∆E, and ∆E ′, where the energy of the“normal” site-occupation configuration is taken as reference. ∆F measures the relativestability of various site-occupations at temperature T = 300 K, which is around the crit-ical temperature of the martensitic transition, whereas ∆E and ∆E ′ correspond to therelative stability at 0 K in magnetic and non-magnetic states, respectively.
Listed in Table 7.1 are the relative electronic energy (∆E and ∆E ′) and relative freeenergy (∆F ) of the three types of Fe/Co/Cu-doped Ni2MnGa alloys. Note that ∆E and∆F have similar trends against the site-occupation configurations at the temperature of300 K. Therefore, in the temperature range of interest, the mixing entropy cannot changethe relative stability of the site occupations such that comparing the relative electronicenergy is actually sufficient to determine the stable site occupancy.
For the Fe-doped Ni and Mn-deficient alloys, the “normal” site-occupation configura-tion A with Fe occupying Ni or Mn sublattice is lower in energy than the “abnormal”site-occupation configurations. However, for the Ga-deficient alloy, the energy differ-ence between the site-occupation configurations A (“normal”), B (with Fe atoms occu-pying the Ni-sublattice while some of Ni atoms moving to the Ga-sublattice), and C(with Fe atoms occupying the Mn-sublattice in meantime some of Mn atoms moving tothe Ga-sublattice) are close to the numerical accuracy of our first-principles calculation.Furthermore, for these systems due to the neglected temperature effects our approachis not sufficient to resolve the site preference. At the same time, the small energy dif-ferences suggest that these configurations are almost degenerated in energy and mayoccur simultaneously in the alloys.
For the Co-doped alloys, regardless of the composition of the alloys, the configurationof Co occupying Ni-sublattice has the lowest energy among all configurations investi-gated, indicating Co atoms prefer strongly the Ni-sublattice. That is, the “normal” site-occupation configuration A is the most stable for Ni-deficient alloy whereas for bothMn- and Ga-deficient alloys, the “abnormal” site-occupation configurations (B) with Niantisites on Mn or Ga sublattice is more stable.
In the Cu-doped alloy, Cu atoms always take the sublattice of the deficient component,i.e., the “normal” site-occupation configuration is the most stable one for all 3 types ofCu-doped alloys.
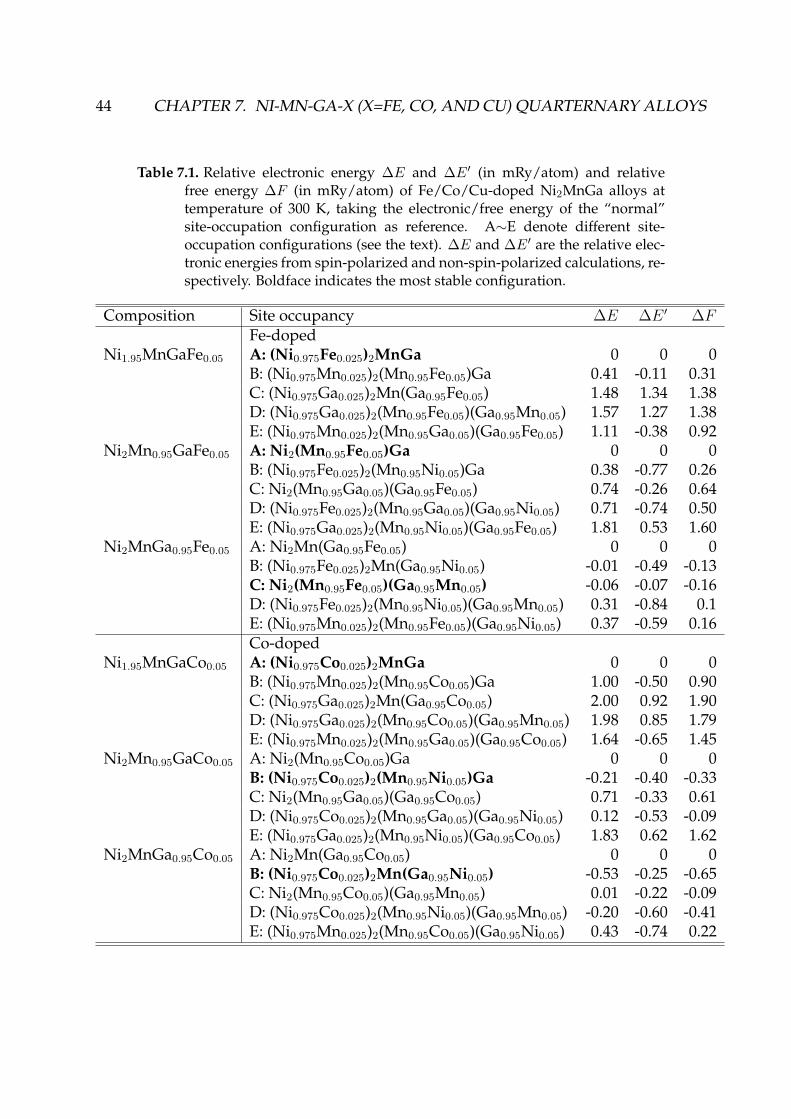
44 CHAPTER 7. NI-MN-GA-X (X=FE, CO, AND CU) QUARTERNARY ALLOYS
Table 7.1. Relative electronic energy ∆E and ∆E′ (in mRy/atom) and relativefree energy ∆F (in mRy/atom) of Fe/Co/Cu-doped Ni2MnGa alloys attemperature of 300 K, taking the electronic/free energy of the “normal”site-occupation configuration as reference. A∼E denote different site-occupation configurations (see the text). ∆E and ∆E′ are the relative elec-tronic energies from spin-polarized and non-spin-polarized calculations, re-spectively. Boldface indicates the most stable configuration.
Composition Site occupancy ∆E ∆E ′ ∆FFe-doped
Ni1.95MnGaFe0.05 A: (Ni0.975Fe0.025)2MnGa 0 0 0B: (Ni0.975Mn0.025)2(Mn0.95Fe0.05)Ga 0.41 -0.11 0.31C: (Ni0.975Ga0.025)2Mn(Ga0.95Fe0.05) 1.48 1.34 1.38D: (Ni0.975Ga0.025)2(Mn0.95Fe0.05)(Ga0.95Mn0.05) 1.57 1.27 1.38E: (Ni0.975Mn0.025)2(Mn0.95Ga0.05)(Ga0.95Fe0.05) 1.11 -0.38 0.92
Ni2Mn0.95GaFe0.05 A: Ni2(Mn0.95Fe0.05)Ga 0 0 0B: (Ni0.975Fe0.025)2(Mn0.95Ni0.05)Ga 0.38 -0.77 0.26C: Ni2(Mn0.95Ga0.05)(Ga0.95Fe0.05) 0.74 -0.26 0.64D: (Ni0.975Fe0.025)2(Mn0.95Ga0.05)(Ga0.95Ni0.05) 0.71 -0.74 0.50E: (Ni0.975Ga0.025)2(Mn0.95Ni0.05)(Ga0.95Fe0.05) 1.81 0.53 1.60
Ni2MnGa0.95Fe0.05 A: Ni2Mn(Ga0.95Fe0.05) 0 0 0B: (Ni0.975Fe0.025)2Mn(Ga0.95Ni0.05) -0.01 -0.49 -0.13C: Ni2(Mn0.95Fe0.05)(Ga0.95Mn0.05) -0.06 -0.07 -0.16D: (Ni0.975Fe0.025)2(Mn0.95Ni0.05)(Ga0.95Mn0.05) 0.31 -0.84 0.1E: (Ni0.975Mn0.025)2(Mn0.95Fe0.05)(Ga0.95Ni0.05) 0.37 -0.59 0.16Co-doped
Ni1.95MnGaCo0.05 A: (Ni0.975Co0.025)2MnGa 0 0 0B: (Ni0.975Mn0.025)2(Mn0.95Co0.05)Ga 1.00 -0.50 0.90C: (Ni0.975Ga0.025)2Mn(Ga0.95Co0.05) 2.00 0.92 1.90D: (Ni0.975Ga0.025)2(Mn0.95Co0.05)(Ga0.95Mn0.05) 1.98 0.85 1.79E: (Ni0.975Mn0.025)2(Mn0.95Ga0.05)(Ga0.95Co0.05) 1.64 -0.65 1.45
Ni2Mn0.95GaCo0.05 A: Ni2(Mn0.95Co0.05)Ga 0 0 0B: (Ni0.975Co0.025)2(Mn0.95Ni0.05)Ga -0.21 -0.40 -0.33C: Ni2(Mn0.95Ga0.05)(Ga0.95Co0.05) 0.71 -0.33 0.61D: (Ni0.975Co0.025)2(Mn0.95Ga0.05)(Ga0.95Ni0.05) 0.12 -0.53 -0.09E: (Ni0.975Ga0.025)2(Mn0.95Ni0.05)(Ga0.95Co0.05) 1.83 0.62 1.62
Ni2MnGa0.95Co0.05 A: Ni2Mn(Ga0.95Co0.05) 0 0 0B: (Ni0.975Co0.025)2Mn(Ga0.95Ni0.05) -0.53 -0.25 -0.65C: Ni2(Mn0.95Co0.05)(Ga0.95Mn0.05) 0.01 -0.22 -0.09D: (Ni0.975Co0.025)2(Mn0.95Ni0.05)(Ga0.95Mn0.05) -0.20 -0.60 -0.41E: (Ni0.975Mn0.025)2(Mn0.95Co0.05)(Ga0.95Ni0.05) 0.43 -0.74 0.22
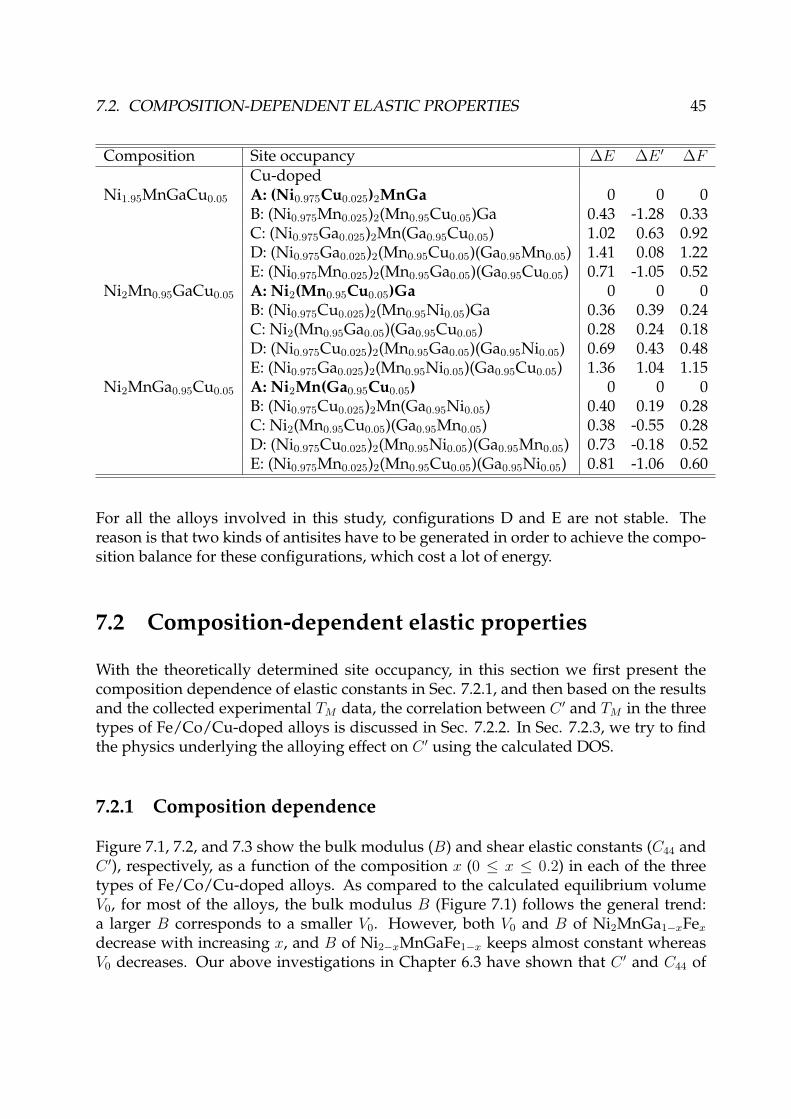
7.2. COMPOSITION-DEPENDENT ELASTIC PROPERTIES 45
Composition Site occupancy ∆E ∆E ′ ∆FCu-doped
Ni1.95MnGaCu0.05 A: (Ni0.975Cu0.025)2MnGa 0 0 0B: (Ni0.975Mn0.025)2(Mn0.95Cu0.05)Ga 0.43 -1.28 0.33C: (Ni0.975Ga0.025)2Mn(Ga0.95Cu0.05) 1.02 0.63 0.92D: (Ni0.975Ga0.025)2(Mn0.95Cu0.05)(Ga0.95Mn0.05) 1.41 0.08 1.22E: (Ni0.975Mn0.025)2(Mn0.95Ga0.05)(Ga0.95Cu0.05) 0.71 -1.05 0.52
Ni2Mn0.95GaCu0.05 A: Ni2(Mn0.95Cu0.05)Ga 0 0 0B: (Ni0.975Cu0.025)2(Mn0.95Ni0.05)Ga 0.36 0.39 0.24C: Ni2(Mn0.95Ga0.05)(Ga0.95Cu0.05) 0.28 0.24 0.18D: (Ni0.975Cu0.025)2(Mn0.95Ga0.05)(Ga0.95Ni0.05) 0.69 0.43 0.48E: (Ni0.975Ga0.025)2(Mn0.95Ni0.05)(Ga0.95Cu0.05) 1.36 1.04 1.15
Ni2MnGa0.95Cu0.05 A: Ni2Mn(Ga0.95Cu0.05) 0 0 0B: (Ni0.975Cu0.025)2Mn(Ga0.95Ni0.05) 0.40 0.19 0.28C: Ni2(Mn0.95Cu0.05)(Ga0.95Mn0.05) 0.38 -0.55 0.28D: (Ni0.975Cu0.025)2(Mn0.95Ni0.05)(Ga0.95Mn0.05) 0.73 -0.18 0.52E: (Ni0.975Mn0.025)2(Mn0.95Cu0.05)(Ga0.95Ni0.05) 0.81 -1.06 0.60
For all the alloys involved in this study, configurations D and E are not stable. Thereason is that two kinds of antisites have to be generated in order to achieve the compo-sition balance for these configurations, which cost a lot of energy.
7.2 Composition-dependent elastic properties
With the theoretically determined site occupancy, in this section we first present thecomposition dependence of elastic constants in Sec. 7.2.1, and then based on the resultsand the collected experimental TM data, the correlation between C ′ and TM in the threetypes of Fe/Co/Cu-doped alloys is discussed in Sec. 7.2.2. In Sec. 7.2.3, we try to findthe physics underlying the alloying effect on C ′ using the calculated DOS.
7.2.1 Composition dependence
Figure 7.1, 7.2, and 7.3 show the bulk modulus (B) and shear elastic constants (C44 andC ′), respectively, as a function of the composition x (0 ≤ x ≤ 0.2) in each of the threetypes of Fe/Co/Cu-doped alloys. As compared to the calculated equilibrium volumeV0, for most of the alloys, the bulk modulus B (Figure 7.1) follows the general trend:a larger B corresponds to a smaller V0. However, both V0 and B of Ni2MnGa1−xFex
decrease with increasing x, and B of Ni2−xMnGaFe1−x keeps almost constant whereasV0 decreases. Our above investigations in Chapter 6.3 have shown that C ′ and C44 of

46 CHAPTER 7. NI-MN-GA-X (X=FE, CO, AND CU) QUARTERNARY ALLOYS
154
156
158
160
Ni2-xMnGaFex
Ni2Mn
1-xGaFex Ni
2MnGa
1-xFex
(a)
158
160
162
164
Ni2-xMnGaCox
Ni2Mn
1-xGaCox
Ni2MnGa
1-xCox
B (G
Pa)
(b)
0.00 0.05 0.10 0.15 0.20
152
154
156
158
x
Ni2-xMnGaCux
Ni2Mn
1-xGaCux
Ni2MnGa
1-xCux
(c)
Figure 7.1. The bulk modulus B (in GPa) of Fe (a), Co (b), and Cu (c)-dopedNi2MnGa alloys.
the off-stoichiometric Ni2MnGa alloys change oppositely with the composition. Never-theless, for the Fe/Co/Cu-doped alloys, this is not always true. The trend of C ′ (Fig-ure 7.3) is the same as that of C44 (Figure 7.2) for Ni2−xMnGaXx (X=Fe and Co) andNi2Mn1−xGaXx (X=Fe and Cu) alloys.
7.2.2 Correlation between C ′ and TM
As demonstrated by our above investigations, for the off-stoichiometric Ni2MnGa al-loys, besides of e/a, C ′ could also be considered as an index of the composition depen-dence of TM : a smaller C ′ indicates a higher TM . Moreover, for Ni2Mn(GaAl) where theTM ∼ e/a relationship fails, TM ∼ C ′ relationship still works [123]. In order to examinethe TM ∼ C ′ of the Fe/Co/Cu-doped alloys, in Figure 7.4, we present the experimentalTM as functions of the theoretical C ′ for some alloys which match roughly the stud-ied three types of alloys. The C ′ of these alloys are obtained through interpolation ofthe C ′ ∼ x relationship as shown in Figure 7.3. For most of the alloys, TM decreaseswith increasing C ′, following the general trend as for the off-stoichiometric Ni2MnGaalloys. However, for Ni2Mn1−xGaFex, TM increases with increasing C ′, against the gen-eral trend of C ′ versus TM , and a sharp change of TM with respect to the composition xis found in Ni2−xMnGaCox.
As shown in Figure 7.4 (a), for Ni2Mn1−xGaFex there is an inverse behavior of the
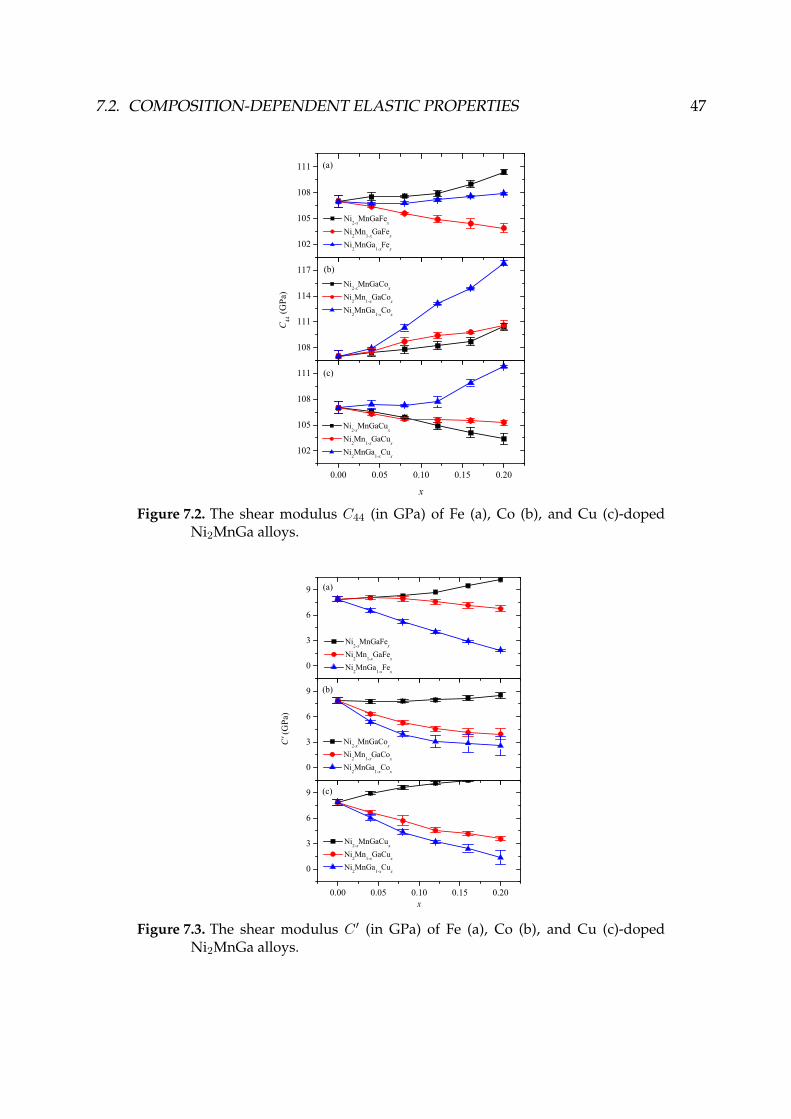
7.2. COMPOSITION-DEPENDENT ELASTIC PROPERTIES 47
102
105
108
111
Ni2-xMnGaFex
Ni2Mn
1-xGaFex Ni
2MnGa
1-xFex
(a)
108
111
114
117
Ni2-xMnGaCox
Ni2Mn
1-xGaCox
Ni2MnGa
1-xCox
C44
(GPa
)(b)
0.00 0.05 0.10 0.15 0.20
102
105
108
111
x
Ni2-xMnGaCux
Ni2Mn
1-xGaCux
Ni2MnGa
1-xCux
(c)
Figure 7.2. The shear modulus C44 (in GPa) of Fe (a), Co (b), and Cu (c)-dopedNi2MnGa alloys.
0
3
6
9
Ni2-xMnGaFex
Ni2Mn
1-xGaFex
Ni2MnGa
1-xFex
(a)
0
3
6
9
Ni2-xMnGaCox
Ni2Mn
1-xGaCox
Ni2MnGa
1-xCox
C' (
GPa
)
(b)
0.00 0.05 0.10 0.15 0.20
0
3
6
9
x
Ni2-xMnGaCux
Ni2Mn
1-xGaCux
Ni2MnGa
1-xCux
(c)
Figure 7.3. The shear modulus C ′ (in GPa) of Fe (a), Co (b), and Cu (c)-dopedNi2MnGa alloys.
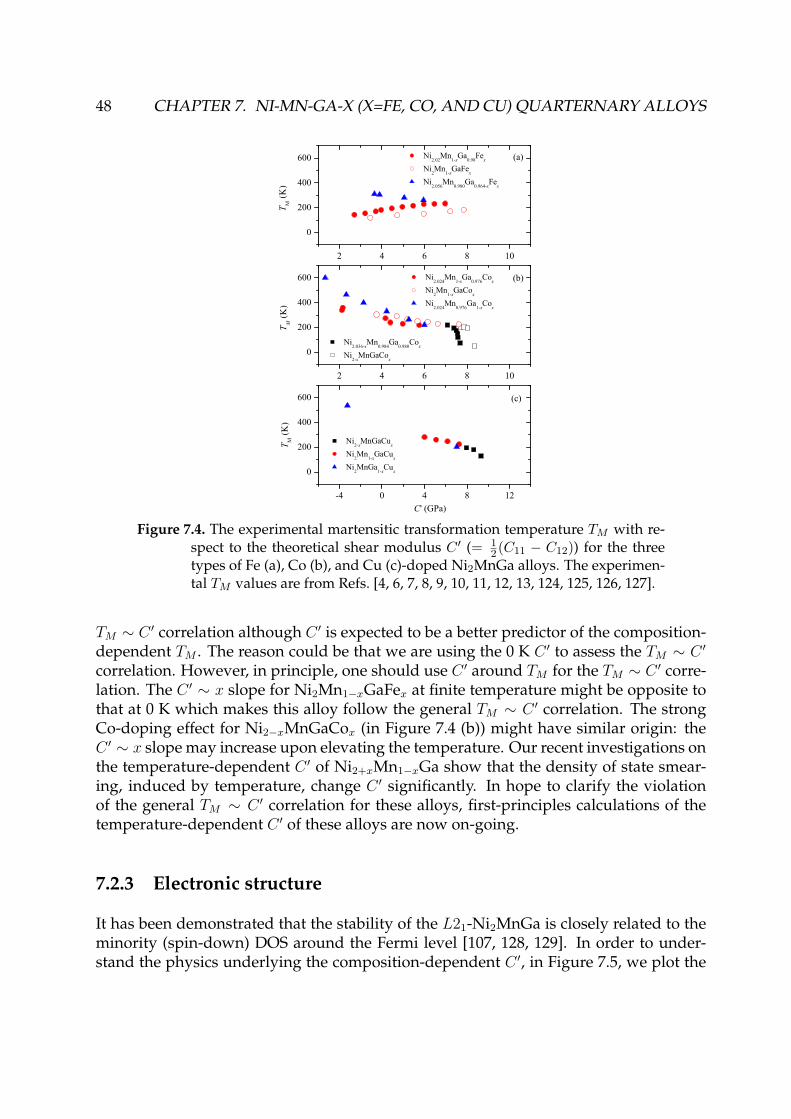
48 CHAPTER 7. NI-MN-GA-X (X=FE, CO, AND CU) QUARTERNARY ALLOYS
2 4 6 8 10
0
200
400
600
2 4 6 8 10
0
200
400
600
-4 0 4 8 12
0
200
400
600
Ni2.02
Mn1-xGa
0.98Fex
Ni2Mn
1-xGaFex Ni
2.056Mn
0.980Ga
0.964-xFex
T M (K
)
(a)
Ni2.024
Mn1-xGa
0.976Cox
Ni2Mn
1-xGaCox Ni
2.024Mn
0.976Ga
1-xCox
Ni2.036-xMn
0.984Ga
0.980Cox
Ni2-xMnGaCox
T M (K
)(b)
Ni2-xMnGaCux
Ni2Mn
1-xGaCux Ni
2MnGa
1-xCux
T M (K
)
C' (GPa)
(c)
Figure 7.4. The experimental martensitic transformation temperature TM with re-spect to the theoretical shear modulus C ′ (= 1
2(C11 − C12)) for the threetypes of Fe (a), Co (b), and Cu (c)-doped Ni2MnGa alloys. The experimen-tal TM values are from Refs. [4, 6, 7, 8, 9, 10, 11, 12, 13, 124, 125, 126, 127].
TM ∼ C ′ correlation although C ′ is expected to be a better predictor of the composition-dependent TM . The reason could be that we are using the 0 K C ′ to assess the TM ∼ C ′
correlation. However, in principle, one should use C ′ around TM for the TM ∼ C ′ corre-lation. The C ′ ∼ x slope for Ni2Mn1−xGaFex at finite temperature might be opposite tothat at 0 K which makes this alloy follow the general TM ∼ C ′ correlation. The strongCo-doping effect for Ni2−xMnGaCox (in Figure 7.4 (b)) might have similar origin: theC ′ ∼ x slope may increase upon elevating the temperature. Our recent investigations onthe temperature-dependent C ′ of Ni2+xMn1−xGa show that the density of state smear-ing, induced by temperature, change C ′ significantly. In hope to clarify the violationof the general TM ∼ C ′ correlation for these alloys, first-principles calculations of thetemperature-dependent C ′ of these alloys are now on-going.
7.2.3 Electronic structure
It has been demonstrated that the stability of the L21-Ni2MnGa is closely related to theminority (spin-down) DOS around the Fermi level [107, 128, 129]. In order to under-stand the physics underlying the composition-dependent C ′, in Figure 7.5, we plot the
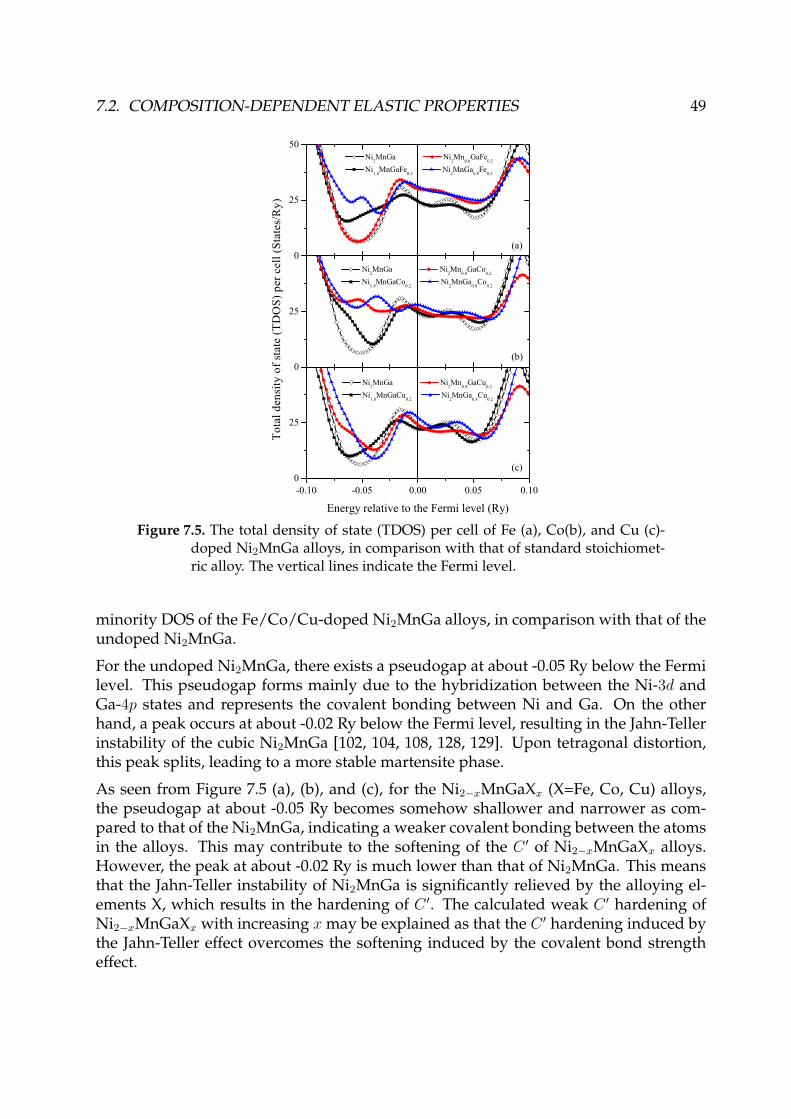
7.2. COMPOSITION-DEPENDENT ELASTIC PROPERTIES 49
0
25
50
Ni2MnGa Ni
2Mn
0.8GaFe
0.2
Ni1.8
MnGaFe0.2
Ni2MnGa
0.8Fe
0.2
(a)
0
25
Ni2MnGa Ni
2Mn
0.8GaCo
0.2
Ni1.8
MnGaCo0.2
Ni2MnGa
0.8Co
0.2
Tota
l den
sity
of s
tate
(TD
OS)
per
cel
l (St
ates
/Ry)
(b)
-0.10 -0.05 0.00 0.05 0.100
25
Energy relative to the Fermi level (Ry)
Ni2MnGa Ni
2Mn
0.8GaCu
0.2
Ni1.8
MnGaCu0.2
Ni2MnGa
0.8Cu
0.2
(c)
Figure 7.5. The total density of state (TDOS) per cell of Fe (a), Co(b), and Cu (c)-doped Ni2MnGa alloys, in comparison with that of standard stoichiomet-ric alloy. The vertical lines indicate the Fermi level.
minority DOS of the Fe/Co/Cu-doped Ni2MnGa alloys, in comparison with that of theundoped Ni2MnGa.
For the undoped Ni2MnGa, there exists a pseudogap at about -0.05 Ry below the Fermilevel. This pseudogap forms mainly due to the hybridization between the Ni-3d andGa-4p states and represents the covalent bonding between Ni and Ga. On the otherhand, a peak occurs at about -0.02 Ry below the Fermi level, resulting in the Jahn-Tellerinstability of the cubic Ni2MnGa [102, 104, 108, 128, 129]. Upon tetragonal distortion,this peak splits, leading to a more stable martensite phase.
As seen from Figure 7.5 (a), (b), and (c), for the Ni2−xMnGaXx (X=Fe, Co, Cu) alloys,the pseudogap at about -0.05 Ry becomes somehow shallower and narrower as com-pared to that of the Ni2MnGa, indicating a weaker covalent bonding between the atomsin the alloys. This may contribute to the softening of the C ′ of Ni2−xMnGaXx alloys.However, the peak at about -0.02 Ry is much lower than that of Ni2MnGa. This meansthat the Jahn-Teller instability of Ni2MnGa is significantly relieved by the alloying el-ements X, which results in the hardening of C ′. The calculated weak C ′ hardening ofNi2−xMnGaXx with increasing x may be explained as that the C ′ hardening induced bythe Jahn-Teller effect overcomes the softening induced by the covalent bond strengtheffect.
50 CHAPTER 7. NI-MN-GA-X (X=FE, CO, AND CU) QUARTERNARY ALLOYS
For the Ni2Mn1−xGaFex alloy, the depth and width of the pseudogap around -0.05 Ryremains almost unchanged whereas the height of the peak at -0.02 Ry increases as com-pared to that of Ni2MnGa (see Figure 7.5 (a)). Therefore, the contribution of the covalentbond strength effect to the variation of C ′ is negligible, and the increasing Jahn-Tellerinstability may account for the softening of C ′ with increasing x as seen in Figure 7.3(a). For the Ni2MnGa1−xFex alloy, the pseudogap at about -0.05 Ry becomes much shal-lower and the height of the peak at -0.02 Ry increases, indicating that the covalent bond-ing becomes weaker and the Jahn-Teller instability increases. Therefore, both the bondstrength and Jahn-Teller effects contribute to the softening of C ′. This is why the al-loying induced C ′ softening of Ni2MnGa1−xFex is much more significant than that ofNi2Mn1−xGaFex (Figure 7.5 (a)).
For the Ni2Mn1−xGaCox and Ni2MnGa1−xCox alloys, the pseudogap around -0.05 Ryalmost disappears (Figure 7.5 (b)), indicating much weaker covalent bonding in thesealloys than that in Ni2MnGa. The strong weakening of the covalent bonding inducedby Co in these alloys results in softening of C ′ (Figure 7.3 (b)), although the decreasein the height of the peak at -0.02 Ry (weaker Jahn-Teller effect) may have a positivecontribution to the C ′. Similar discussion applies to the cases of Ni2Mn1−xGaCux andNi2MnGa1−xCux alloys where the covalent bonding becomes weaker and the Jahn-Teller instability is slightly relieved upon Cu-doping.
Chapter 8
Concluding remarks
The martensitic transformation of Ni-Mn-Ga and In-Tl shape memory alloys is affectedsignificantly by alloying elements, which has been recognized to be related to the elasticproperties. Using the first-principles EMTO-CPA method, we investigated in detail theelastic properties of these two kinds of shape memory alloys, and try to understand thephysics underlying the composition dependence of TM .
In In-Tl alloys, we found that all the composition-dependent thermophysical proper-ties: lattice parameter c/a, shear elastic constant C ′ = 1/2(C11 − C12), energy differencebetween the austenitic and martensitic phases, as well as electronic structures are in linewith the experimentally observed lowering of TM with the addition of Tl.
For Ni-Mn-Ga-based alloys, we first investigated the site occupancy of the doping ele-ments. In most of the off-stoichiometric Ni2MnGa, the excess atoms of the rich compo-nent prefer to occupy the sublattice of the deficient one, except for the Ga-rich alloys,where the excess Ga atoms have strong tendency to take the Mn sublattice irrespec-tive of the Mn occupation. In Ni-Mn-Ga-X (X=Fe, Co, and Cu) quarternary alloys, Featom prefers to occupy the Mn and Ni-sublattice even in Ga-deficient alloys; Co hasstrong tendency to occupy the Ni-sublattice in all types of alloys; Cu atoms always oc-cupy the sublattice of the host elements in deficiency. For most of the studied alloyswith the stable site-occupations, the shear modulus C ′ can be considered as a predictorof the composition dependence of TM of the alloys: the alloy with larger C ′ than thatof the perfect Ni2MnGa generally possesses lower TM except for Ni2Mn1+xGa1−x andNi2Mn1−xGaFex.
The failure of C ′ as a factor of TM in Ni2Mn1+xGa1−x and Ni2Mn1−xGaFex may beascribed that the composition-dependent magnetic interactions and the temperature-dependent C ′ also play an important role on the MT in these alloys. We have demon-strated that a proper account of the temperature and composition dependence of C ′ giveus a reasonable theoretical TM(x) values in Ni2+xMn1−xGa alloys (x = 0.0, 0.1, and 0.2).Detailed investigations of the phonon effect (including the temperature effect) on the
51
52 CHAPTER 8. CONCLUDING REMARKS
thermophysical properties of other Ni-Mn-Ga alloys are part of my ongoing projects.Parallel to this subject, I will try to explore the composition dependence of magneticproperties (magnetic exchange energy, Curie temperature, and so on) and their effectson the MT of Ni-Mn-Ga-based alloys.
Acknowledgements
First and foremost, I would like to express my sincere gratitude and appreciation to mysupervisors, Prof. Levente Vitos and Prof. Qing-Miao Hu, for giving me the opportu-nity to join the AMP group at KTH, for leading me into the scientific research of calcula-tional materials science, for their great patience, professional guidance and continuoussupport during my studies, and for giving me strong confidence to do everything best.
I am also deeply indebted to Prof. Rui Yang, my co-supervisor, in the Institute of MetalResearch, Chinese Academy of Sciences, and Prof. Borje Johasson, the leader of theAMP group. Thank you for helping me go into an interesting and promising researchworld.
The Swedish Research Council, the Swedish Steel Producers’ Association, the Carl Tryg-gers Foundation, the Goran Gustafsson Foundation and the Hungarian Scientific Re-search Fund, the MoST of China and the NSFC are acknowledged for financial support.
Thanks to Dr. Marko P. J. Punkkinen, Dr. Krisztina Kadas, and Dr. Stephan Schoeneckerfor giving me a lot of good suggestions in my work.
I would like to thank all the members of the AMP group for creating an inspiring en-vironment for our studies. Many thanks to Erna, Noura, Hualei, Lorand, Andreas, andSong for your helpful discussions and the countless friendship.
Many truthful thanks to my Chinese friends for giving me great happiness and count-less help during my studies in Sweden.
Last but not least, I would like to express my deepest thanks to my dear parents and mysisters for their endless support, encouragement and love. To my husband, he supportsand encourages me forever.
53
Bibliography
[1] K. Otsuka and C. M. Wayman, Shape Memory Materials, Cambridge UniversityPress. (1998).
[2] Y. Furuya, Design and material evaluation of shape memory composites, JIMSS 7, 321-331(1996).
[3] L. C. Brinson, One-dimensional constitutive behavior of shape memory alloys: Thermome-chanical derivation with non-constant material functions and redefined martensite internalvariable, JIMSS 4, 229-242 (1993).
[4] P. J. Webster, K. R. A. Ziebeck, S. L. Town, and M. S. Peak: Philos. Mag. B 49, 295(1984).
[5] V. V. Khovaylo, V. D. Buchelnikov, R. Kainuma, V. V. Koledov, M. Ohtsuka, V. G.Shavrov, T. Takagi, S. V. Taskaev, and A. N. Vasiliev: Phys. Rev. B 72, 224408 (2005).
[6] D. Kikuchi, T. Kanomata, Y. Yamaguchi, H. Nishihara, K. Koyama, and K. Watan-abe: J. Alloys Compd. 383, 184-188 (2004).
[7] D. E. Soto-Parra, X. Moya, L. Manosa, A. Planes, H. Flores-Zuniga, F. Alvarado-Hernandez, R. A. Ochoa-Gamboa, J. A. Matutes-Aquino, and D. Rıos-Jara: Philos.Mag. 90, 2771 (2010).
[8] M. Khan, I. Dubenko, S. Stadler, and N. Ali: J. Appl. Phys. 97,10M304 (2005).
[9] X. Q. Chen, X. Lu, D. Y. Wang, and Z. X. Qin: Smart Mater. Struct. 17, 065030 (2008).
[10] J. Wang, H. Bai, C. Jiang, Y. Li, and H. Xu: Mater. Sci. Eng. A 527, 1975 (2010).
[11] J. Wang and C. Jiang: Scripta Mater. 62, 298 (2010).
[12] T. Kanomata, Y. Kitsunai, K. Sano, Y. Furutani, H. Nishihara, R. Y. Umetsu, R.Kainuma, Y. Miura, and M. Shirai: Phys. Rev. B 80, 214402 (2009).
[13] T. Kanomata, T. Nozawa, D. Kikuchi, H. Nishihara, K. Koyama, and K. Watanabe:Int. J. Appl. Electrom. 21, 151 (2005).
54
BIBLIOGRAPHY 55
[14] N. Lanska, O. Soderberg, A. Sozinov, Y. Ge, K. Ullakko, and V. K. Lindroos: J. Appl.Phys. 95, 8074 (2004).
[15] A. T. Zayak, W. A. Adeagbo, P. Entel and K. M. Rabe: Appl. Phys. Lett. 88, 111903(2006).
[16] T. Mehaddene, J. Neuhaus, and W. Petry: Phys. Rev. B 78, 104110 (2008).
[17] Y. Xin, Y. Li, C. B. Jiang, and H. B. Xu: Mater. Sci. Forum 475-479, 1991 (2005).
[18] V. V. Kokorin, I. A. Osipenko, and T. V. Shirina: Phys. Met. Metallogr. 67, 173 (1989).
[19] C. Seguı, J. Pons, and E. Cesari: Acta Mater. 55, 1649 (2007).
[20] V. Sanchez-Alarcos, V. Recarte, J. I. Perez-Landazabal, and G. J. Cuello: Acta Mater.55, 3883 (2007).
[21] A. Chakrabarti, C. Biswas, S. Banik, R. S. Dhaka, A. K. Shukla, and S. R. Barman:Phys. Rev. B 72, 073103 (2005).
[22] J. Chen, Y. Li, J. X. Shang, and H. B. Xu: Appl. Phys. Lett. 89, 231921 (2006).
[23] S. R. Barman, A. Chakrabarti, S. Singh, S. Banik, S. Bhardwaj, P. L. Paulose, B. A.Chalke, A. K. Panda, A. Mitra, and A. M. Awasthi: Phys. Rev. B 78, 134406 (2008).
[24] C. Bungaro, K. M. Rabe, and A. Dal Corso: Phys. Rev. B 68, 134104 (2003).
[25] M. Stipcich, L. Manosa, Antoni Planes, M. Morin, J. Zarestky, T. Lograsso, and C.Stassis: Phys. Rev. B 70, 054115 (2004).
[26] M. Wuttig, L. H. Liu, K. Tsuchiya, and R. D. James: J. Appl. Phys. 87, 4707 (2000).
[27] X. Ren, K. Otsuka, and T. Suzuki: J. Alloys Compounds 355, 196 (2003).
[28] K. Otsuka and X. Ren: Prog. Mater. Sci. 50, 511 (2005).
[29] X. Ren and K. Otsuka: Mater. Sci. Forum 327-328, 429 (2000).
[30] S. Banik, R. Ranjan, A. Chakrabarti, S. Bhardwaj, N. P. Lalla, A. M. Awasthi, V.Sathe, D. M. Phase, P. K. Mukhopadhyay, D. Pandey, and S. R. Barman: Phys. Rev.B 75, 104107 (2007).
[31] M. Pajda, J. Kudrnovsky, I. Turek, V. Drchal, and P. Bruno: Phys. Rev. B 64, 174402(2001).
[32] I. Turek, J. Kudrnovsky, V. Drchal, and P. Bruno: Philos. Mag. 86, 1713 (2006).
[33] E. Sasıoglu, L. M. Sandratskii, and P. Bruno: Phys. Rev. B 70, 024427 (2004).
56 BIBLIOGRAPHY
[34] L. Guttman: Trans. Metall. Soc. AIME 188, 1472 (1950).
[35] J. S. Bowles, C. S. Barrett, and L. Guttman: Trans. Metall. Soc. AIME 188, 1478(1950).
[36] M. W. Burkart and T. A. Read: Trans. Metall. Soc. AIME 191, 1516 (1953).
[37] L. Vitos, P. A. Korzhavyi, and B. Johansson: Phys. Rev. Lett. 88, 155501 (2002);Nature Mater. 2, 25 (2003).
[38] L. Vitos, P. A. Korzhavyi, and B. Johansson: Phys. Rev. Lett. 96, 117210 (2006).
[39] A. Taga, L. Vitos, B. Johansson, and G. Grimvall: Phys. Rev. B 71, 014201 (2005).
[40] B. Magyari-Kope, G. Grimvall, and L. Vitos: Phys. Rev. B 66, 064210 (2002).
[41] B. Magyari-Kope, L. Vitos, and G. Grimvall: Phys. Rev. B 70, 052102 (2004).
[42] B. Magyari-Kope, L. Vitos, B. Johansson, and J. Kollar: J. Geophys. Res. 107, 2136(2002).
[43] B. Magyari-Kope, L. Vitos, G. Grimvall, B. Johansson, and J. Kollar: Phys. Rev. B65, 193107 (2002).
[44] J. Worgull, E. Petti, and J. Trivisonno: Phys. Rev. B 54, 15695 (1996).
[45] R. W. Overholser, M. Wutting: Scripta Mater. 40, 1095-1102 (1999).
[46] O. Soderberg, Y. Ge, A. Sozinov, S. -P. Hannula, V. K. Lindroos: Smart Mater. Struct.14, S223-S235 (2005).
[47] E. Cesari, J. Pons, R. Santamarta, C. Segui, V. A. Chernenko: Arch. Metall. Mater.49, 779-789 (2004).
[48] O. Soderberg, A. Sozinov, Y. Ge, S. -P. Hannula, V. K. Lindroos, in: J. Buschow(Ed.), Handbook of Magnetic Materials, Vol. 16, Elsevier Science, Amsterdam, 2006,pp. 1-39.
[49] V. A. Chernenko, V. A. L’ Vov, V. V. Khovailo, T. Takagi, T. Kanomata, T. Suzuki, R.Kainuma: J. Phys. Condens. Matter 16, 8345-8352 (2004).
[50] V. V. Kokorin, V. A. Chernenko: Phys. Met. Metall. 68, 111-115 (1989).
[51] Y. Liu, F. Ai, B. H. Jiang, Y. Liu, X. Qi: Mater. Sci. Eng. A 438-440, 999-1002 (2006).
[52] M. Kohl, D. Brugger, M. Ohtsuka, T. Takagi: Sens. Actuator A: Phys. 114, 445-450(2004).
[53] V. V. Martynov, V. V. Kokorin: J. Phys. III 2, 739-749 (1992).
BIBLIOGRAPHY 57
[54] V. A. Chernenko, V. L’ Vov: J. Pons, E. Cesari: J. Appl. Phys. 93, 2394-2399 (2003).
[55] L. Straka, O. Heczko: IEEE Trans. Magn. 39, 3402-3404 (2003).
[56] V. A. Chernenko, V. A. L’ Vov, P. Mullner, G. Kostorz, T. Takagi: Phys. Rev. B 69,(1-C8) 134410 (2004).
[57] O. Heczko, A. Sozinov, K. Ullakko: IEEE Trans. Magn. 36, 3266 (2000).
[58] K. Ullakko, J. K. Huang, V. V. Kokorin, R. C. O’Handley: Appl. Phys. Lett. 69, 1996(1966).
[59] A. Aliev, A. Batalov, S. Bosko: J. Magn. Magn. Mater. 272-276, 2040 (2004).
[60] Xue-Wei Zhou, Junhui Li, and Manfred Wuttig: Phys. Rev. B 44, 10367 (1991).
[61] N. W. Ashcroft and N. D. Mermin: Solid state physics, Saunders College (1976).
[62] F. D. Murnaghan: Proc. Nat. Acad. Sci. 30, 244 (1944).
[63] F. Birch: Phys. Rev. 71, 809 (1947).
[64] V. L. Moruzzi, J. F. Janak and K. Schwarz: Phys. Rev. B 37, 790 (1988).
[65] G. S. Neumann, L. Stixrude, and R. E. Cohen: Phys. Rev. B 60, 791 (1999).
[66] F. Jona and P. M. Marcus: Phys. Rev. B 63, 094113 (2001).
[67] G. Grimvall, Thermophysical properties of materials, Enlarged and revised edition,North-Holland, Amsterdam, (1999).
[68] J. Staunton, B. L. Gyoffy, A. J. Pindor, G. M. Stocks, and H. Winter: J. Magn. Magn.Mater. 45, 15 (1984).
[69] L. Vitos, The EMTO Method and Applications, in Computational Quantum Mechanicsfor Materials Engineers, Springer-Verlag, London (2007).
[70] R. Hill: Proc. Phys. Soc. A 65, 349 (1952); R. Hill: J. Mech. Phys. Solids 11, 357(1963).
[71] O. K. Andersen, O. Jepsen, and G. Krier, Lectures on Methods of Electronic StructureCalculations, edited by V. Kumar, O. K. Andersen, and A. Mookerjee (World Scien-tific, Singapore 1994), p. 63.
[72] M. Born, K. Huang: Dynamical theory of crystal lattices, Oxford University press,Oxford, (1954).
[73] H. Hohenberg and W. Kohn: Phys. Rev. 136, B864 (1964).
58 BIBLIOGRAPHY
[74] W. Kohn and L. J. Sham: Phys. Rev. 140, A1133 (1965).
[75] L. Hedin, B. I. Lundqvist: J. Phys. Chem. 4, p. 2064 (1971).
[76] J. C. Slater: Phys. Rev. 81, p. 385 (1951).
[77] J. P. Perdew, K. Burke and M. Enzerhof: Phys. Rev. Lett. 77, 3865 (1996).
[78] Y. Wang and J. P. Perdew: Phys. Rev. B 44, 13298 (1991).
[79] J. P. Perdew, A. Ruzsinszky, G. I. Csonka, O. A. Vydrov, G. E. Scuseria, L. A. Con-stantin, X. Zhou, and K. Burke: Phys. Rev. Lett. 100, 136406 (2008).
[80] L. Vitos, B. Johansson, J. Kollar, H. L. Skriver: Phys. Rev. B 62, 10046 (2000).
[81] R. Armiento and A. E. Mattsson: Phys. Rev. B 72, 085108 (2005).
[82] P. Soven: Phys. Rev. 156, 809 (1967).
[83] B. L. Gyorffy: Phys. Rev. B 5, 2382 (1972).
[84] L. Vitos, I. A. Abrikosov, and B. Johansson: Phys. Rev. Lett. 87, 156401 (2001).
[85] P. A. Korzhavyi, A. V. Ruban, I. A. Abrikosov, H. L. Skriver: Phys. Rev. B 51, 5773(1995).
[86] A. V. Ruban and H. L. Skriver: Phys. Rev. B 66, 024201 (2002).
[87] P. W. Anderson, in Solid State Physics, edited by F. Seitz and D. Turnbull (AcademicPress, New York, 1963), Vol. 14, pp. 99-214.
[88] A. Liechtenstein, M. I. Katsnelson, and V. A. Gubanov: J. Phys. F: Met. Phys. 14,L125 (1984); A. Liechtenstein, M. I. Katsnelson, V. P. Antropov, and V. A. Gubanov:J. Magn. Magn. Mater. 67, 65 (1987).
[89] E. C. Do, Y. H. Shin, and B. J. Lee: CALPHAD 32, 82 (2008).
[90] S. H. Yang, M. J. Mehl, and D. A. Papaconstantopoulos: Phys. Rev. B 57, R2013(1998).
[91] D. R. Winder and C. S. Smith: J. Phys. Chem. Solids 4, 128 (1958).
[92] B. S. Chandrasekhar and J. A. Rayne: Phys. Rev. 124, 1011 (1961).
[93] R. W. Meyerhoff and J. F. Smith: Acta Metall. 11, 529 (1963).
[94] C. H. Sonu and T. J. O’Keefe: Materials Characterization 33, 311-319 (1994).
[95] J. T. A. Pollock and H. W. King: J. Mater Sci. 3, 372-379 (1968).
BIBLIOGRAPHY 59
[96] T. F. Smith and T. R. Finlayson: Phys. Rev. B 49, 12559 (1994).
[97] D. J. Gunton and G. A. Saunders: Solid State Communications 14, 865 (1974).
[98] D. B. Novotny and J. F. Smith: Acta Met. 13, 1881 (1965).
[99] N. G. Pace and G. A. Saunders: Proc. Roy. Soc. A 326, 521 (1972).
[100] D. W. Donovan, G. R. Barsch, R. N. Pangborn, and T. R. Finlayson: Acta metall.mater. 42, 1985-1996 (1994).
[101] M. P. Brassington and G. A. Saunders: Proc. R. Soc. A 387, 289 (1983).
[102] P. J. Brown, A. Y. Bengali, J. Crangle, K. U. Neuman, and K. R. A. Ziebeck: J. Phys.:Condens. Matter 11, 4715 (1999).
[103] L. Manosa, A. Gonzalez-Comas, E. Obarado, A. Planes, V. A. Chernenko, V. V.Kokorin, and E. Cesari: Phys. Rev. B 55, 11068 (1997).
[104] V. V. Godlevsky and K. M. Rabe: Phys. Rev. B 63, 134407 (2001).
[105] S. O. Kart, M. Uludogan, I. Karaman, and T. Cagın: Phys. Stat. Sol. (a) 205, 1026-1035 (2008).
[106] A. T. Zayak, P. Entel, and J. Hafner: J. Phys. IV (France) 112, 985 (2003).
[107] A. Ayuela, J. Enkovaara, and R. M. Nieminen: J. Phys.: Condens. Matter 14, 5325(2002).
[108] A. Ayuela, J. Enkovaara, K. Ulakko, and R. M. Nieminen: J. Phys.: Condens. Mat-ter 11, 2017 (1999).
[109] S. R. Barman, S. Banik, and A. Chakrabarti: Phys. Rev. B 72, 184410 (2005).
[110] A. T. Zayak, P. Entel, J. Enkovaara, R. M. Nieminen, J. Phys.: Condens. Matter 15,159 (2003). A. T. Zayak and P. Entel: Mater. Sci. Eng. A 348, 419 (2004).
[111] T. E. Stenger, and J. Trivisonno: Phys. Rev. B 57, 2735 (1998).
[112] D. Chen, Q. M. Xiao, Y. L. Zhao, B. H. Y, C. L. Wang, and D. H. Shi: Chin. Phys.Lett. 26, 016201 (2009).
[113] V. A. Chernenko, J. Pons, C. Segui, and E. Cesari: Acta Mater. 50, 53 (2002).
[114] M. Ohtsuka, M. Matsumoto, and K. Itagaki: Mater. Sci. Eng. A 438-440, 935 (2006).
[115] Y. Li, Y. Xin, C. Jiang, and H. Xu: Mater. Sci. Eng. A 438-440, 978 (2006).
[116] K. Inoue, Y. Yamaguichi, K. Ohsumi, Y. Noda, H. Kimura, K. Kusaka, and T. Nak-agawa: Mater. Sci. Eng. A 438-440, 131 (2006).
60 BIBLIOGRAPHY
[117] A. N. Vasil’ev, A. D. Bozhiko, V. V. Khovailo, I. E. Dikshtein, V. G. Shavrov, V. D.Buchelnikov, M. Matsumoto, S. Suzuki, T. Takagi, and J. Tani: Phys. Rev. B 59, 1113(1999).
[118] V. V. Khovailo, T. Takagi, A. D. Bozhko, M. Matsumoto, J. Tani, and V. G. Shavrov:J. Phys. Condens. Matter 13, 9655 (2001).
[119] F. Albertini, A. Paoluzi, L. Pareti, M. Solzi, L. Righi, E. Villa, S. Besseghini, and F.Passaretti: J. Appl. Phys. 100, 023908 (2006).
[120] R. Ranjan, S. Banik, S. R. Barman, U. Kumar, P. K. Mukhopadhyay, and D. Pandey:Phys. Rev. B 74, 224443 (2006).
[121] X. Ren and K. Otsuka: Scripta Mater 38, 1669 (1998).
[122] H. Seiner, L. Bicanova, P. Sedlak, M. Landa, L. Heller, and I. Aaltio: Mater. Sci.Eng. A 521-522, 205-208 (2009).
[123] Hu-Bin Luo, Chun-Mei Li, Qing-Miao Hu, Rui Yang, Borje Johansson, and Lev-ente Vitos: Acta Mater. 59, 971 (2011).
[124] D. Soto, F. A. Hernandez, H. Flores-Zuniga, X. Moya, L. Manosa, A. Planes, S.Aksoy, M. Acet, T. Krenke: Phys. Rev. B 77, 184103 (2008).
[125] Z. H. Liu, M. Zhang, W. Q. Wang, W. H. Wang, J. L. Chen, and G. H. Wu: J. Appl.Phys. 92, 5006 (2002).
[126] Y. Q. Ma, S. Y. Yang, Y. Liu, and X. J. Liu: Acta Mater. 57, 3232 (2009).
[127] Y. Q. Ma, S. Y. Yang, W. J. Jin, and X. J. Liu: J. Alloys Compd. 471, 570 (2009).
[128] C. P. Opeil, B. Mihaila, R. K. Schulze, L. Manosa, A. Planes, W. L. Hults, R. A.Fisher, P. S. Riseborough: Phys. Rev. Lett. 100, 165703 (2008).
[129] P. Entel, V. D. Buchel’nikov, V. V. Khovailo, A. T. Zayak, W. A. Adeagbo, M. E.Gruner, H. C. Herper, and E. Wassermann: J. Phys. D 39, 865 (2006).