election by community consensus: effects on political
TRANSCRIPT

CDEP‐CGEGWPNo.55
Election by Community Consensus: Effects on Political Selection and Governance AshnaAroraApril2018
CDEP‐CGEGWORKINGPAPERSERIES

Election by Community Consensus:Effects on Political Selection and Governance∗
Ashna Arora†Columbia University
April 8, 2018
Abstract
This paper evaluates the effects of encouraging the selection of local politicians in India viacommunity-based consensus, as opposed to a secret ballot election. While secret ballot elec-tions prevent vote capture by guaranteeing voter anonymity, consensus-based elections mayimprove welfare by promoting the exchange of information. I find that politicians elected viacommunity consensus are younger and more educated, but lead to worse governance as mea-sured by a fall in local expenditure and regressive targeting of workfare employment. Theseresults are consistent with qualitative evidence that finds that community-based processes areprone to capture by the local elite, and need not improve the quality of elected politicians orgovernance.
Keywords Political Economy, Decentralization, Electoral Competition, Secret Ballot, PublicEmployment Programs, Welfare Programs
∗I am deeply grateful to Francois Gerard, Suresh Naidu and Bernard Salanié for guidance and support. For helpfuldiscussions, I would like to thank Siddharth Hari, Nandita Krishnaswamy, Daniel Rappoport, Christoph Rothe andnumerous participants at the Applied Microeconomics and Development Colloquia at Columbia University as well asthe Conference on Economic Growth and Development at the Indian Statistical Institute. I also thank Kunjal Desai forhelp with data access. This research was supported by the Wueller Pre-Dissertation Award at Columbia University. Allerrors are my own.†Department of Economics, Columbia University. Email: [email protected]
1
1 Introduction
Since the 1990s, developing countries have undertaken a broad range of decentralization reforms,aimed at enhancing the role of local stakeholders in policy making and program implementation(Bardhan 2002). These reforms have led to the creation of democratic governments at the locallevel, as well as the devolution of authority to existing local governments. In the last decade, re-search and policy attention has shifted to deepening democratic processes within these institutionsby limiting the influence of elites and enhancing community participation in local decision mak-ing. These policies include the use of community monitoring (Olken 2007), community meetings(Besley et al. 2005, Rao & Ibáñez 2005, Alatas et al. 2013) and direct democracy (Olken 2008, Beathet al. 2013, Hinnerich & Pettersson-Lidbom 2014) to implement programs based on the consensusof local stakeholders.
This paper examines the effects of using community consensus to select political representa-tives themselves, rather than as a tool to monitor or alter policy decisions after politicians haveassumed office. I first test for changes in observable politician characteristics, such as age andeducation, to understand whether the policy hurts incumbents and to quantify its impact on po-litical selection. I also examine changes in measurable aspects of governance at the village level,such as the amount of local expenditure and targeting of workfare employment. These outcomesare directly affected by local politicians and can, therefore, be used to estimate the impact of thepolicy on governance.
I find that consensus-based elections significantly influence who communities elect, and theirperformance once in office. Consensus-based elections crowd younger, more educated represen-tatives into political office. However, these elections also lead to a reduction in government size,reflected in a reduction in total expenditure, and more regressive targeting of workfare employ-ment by the local council.1 These findings are indicative of worse governance, since developmentexpenditure and workfare employment disproportionately benefit the poorest households in In-dian villages (Imbert & Papp 2015). Overall, the results are consistent with qualitative evidencethat finds that community-based processes in general, and consensus-based elections in specific,are prone to elite capture and can lead to worse governance.
To estimate the impact of consensus-based elections, I compile a new dataset containing de-tailed information on candidates, politicians and governance indicators at the village level inGujarat, a state in Western India, for the years 2011-15. While many states in India incentivizeconsensus-based elections at the village level, Gujarat offers untied financial grants that increasediscontinuously with village population. In the 2011 elections in Gujarat, villages with popula-tions greater than 5000 faced substantially larger incentives for elections via community consensus- the financial grant increased by fifty percent at the threshold, from 13 to 20 per cent of the median
1Regressivity is measured by the proportion of workfare employment allocated to historically marginalized sectionsof the population.
2
village budget. This increase in financial incentives is used to set up a regression discontinuitydesign, which tests for the causal impact of consensus elections on political selection and gover-nance. The identifying assumption is that unobservables vary smoothly around this populationthreshold.
This setting also allows me to circumvent the contamination of estimates by multiple treat-ments, a common drawback of regression discontinuity designs. Two features of the local politicalsystem increase at the population threshold of 5000 - the consensus election grant and the numberof political representatives. However, the number of political representatives also increases dis-continuously at population thresholds other than 5000. Estimates at these alternative thresholdsare used to show that this contaminating treatment (increase in the number of council members)does not drive the findings on electoral competition, politician identity and governance.
Why would crowding in younger, more educated politicians worsen governance? The stategovernment does not place any restrictions on how village communities reach a consensus abouttheir political representatives. Survey evidence indicates that local elites usually nominate candi-dates and mobilize support for their election by consensus, i.e., without formal opposition (Bre-man 2011). If these candidates are inexperienced and merely serve as political placeholders, theymay lack both the ability and motivation to undertake administrative and development expendi-tures within the village, and negotiate with bureaucrats outside the village to influence fundingtowards workfare employment.2 Financial incentives for consensus-based elections could, there-fore, worsen governance by crowding in politicians that rely on the support of a handful of localelites instead of all village residents.
This paper contributes to the growing literature on the impact of electoral institutions on polit-ical selection and governance outcomes (Diermeier et al. 2005, Keane & Merlo 2010, Banerjee et al.2011, Banerjee et al. 2017). The results are also consistent with theoretical work that shows that
political competition and community participation may have negative or positive effects (Khwaja2004, Caselli & Morelli 2004, Lizzeri & Persico 2005, Mattozzi & Merlo 2008). Empirical workshows that reducing political competition can worsen legislator quality and performance (Brazil,Ferraz & Finan 2009) and is associated with anti-growth policies (United States, Besley et al. 2010).This paper finds broadly similar results in the Indian village setting - incentives for consensus-based elections lower competition and crowd in younger (albeit more educated) politicians, andreduce expenditure and worsen employment targeting by the local government.
Additionally, I find support for the citizen-candidate models of Osborne & Slivinski (1996)and Besley & Coate (1997), which highlight the influence of politician identity on governance out-comes. My results add to the extensive literature documenting the influence of visible politiciancharacteristics on governance outcomes in India (Pande 2003, Chattopadhyay & Duflo 2004, Ra-jaraman & Gupta 2012, Afridi et al. 2013) and other countries (Powley 2007, Washington 2008).
2Political and administrative inexperience has been shown to be an important determinant of implementation inef-ficiencies and leakages in the Indian village setting (Afridi et al. 2013)
3
This paper also contributes to the debate on the effects of elite influence on governance andsocial welfare. Studies show that elite capture can have sizable negative consequences in somecontexts (Besley et al. 2004, Acemoglu & Robinson 2008, Caeyers & Dercon 2012, Acemogluet al. 2014), but that these effects may be small or completely absent in other settings (Bardhan& Mookherjee 2006, Alatas et al. 2013, Beath et al. 2013).3 This paper concurs with the findings ofthe former set of papers by showing that at least in the short term, elite influence in elections caninfluence politician identity and substantially worsen governance.
Finally, these results add to the burgeoning literature on regression-discontinuity designs inpolitical economics (Lee 2008, Ferraz & Finan 2009, Pettersson-Lidbom 2012, Hinnerich & Pettersson-Lidbom 2014).
The remainder of this paper is organized into four sections. Section 2 describes the institutionalsetting and the data sources. Section 3 details the empirical strategy and Section 4 presents theresults. Section 5 concludes.
2 Setting and Data
This section provides detailed information about the functioning of village governments in Gu-jarat, the implementation of the Samras (consensus) Panchayat scheme, as well as the datasetsused in the empirical analysis.
Institutional Background
The Seventy Third Amendment to the Indian Constitution in 1992 mandated the creation of athree tiered local government system, at the district, block and village level (in descending orderof size of jurisdiction) across states in India. This study focuses on elected councils at the villagelevel, also called Gram Panchayats (henceforth, GPs) in Gujarat. GP members are directly electedfor five-year terms by village residents and elections are not fought on party lines, i.e. candidatesare not affiliated with political parties at the state or national level. The jurisdiction of each GPis divided into a number of mutually exclusive wards, and efforts are undertaken to ensure thateach ward contains the same number of residents. The population of each ward then elects asingle representative to occupy a GP seat. In Gujarat, the number of ward members is fixed at7 for GPs with populations up to 3000, and increases by 2 for every multiple of 1000 thereafter.Figure 1 uses electoral data to plot the actual number of GP members elected in the 2011 electionsagainst GP population in Gujarat, and shows that this rule was closely followed in practice. Thevillage community as a whole also directly elects the president of the GP.
The Seventy Third Constitutional Amendment also mandated reservations for women, and
3Baland & Robinson (2012) show that the introduction of the secret ballot reduced elite influence over voting deci-sions, but do not measure its impact on government performance.
4
three disadvantaged classes - Scheduled Castes, Scheduled Tribes and Other Backward Classesat the district, block and village level.4 At least 33 per cent of president and council memberseats are reserved for women. Panel B of Figure 1 plots the number of seats reserved for womenagainst GP population. The number of seats reserved for women increases discontinuously ateach population threshold except the thresholds 5000 and 8000. For Schedules Castes, ScheduledTribes and Other Backward Classes (henceforth, SC, ST and OBC respectively) the proportion ofreserved seats is mandated to be as close as possible to their respective population shares in thestate. Figure A.1 plots seats reserved for each of these three categories against GP population.While there is a distinct jump in the number of OBC seats at the population threshold 6000, noother visible discontinuities are seen at the other population thresholds.
GP functions include income generation via tax collection, the upkeep of local public goods,and the implementation of various development programs. A sizable proportion of GP revenuecomes in the form of grants from central and state governments, but GPs collect a variety of taxesand fees within their jurisdictions. These include water, property and trade taxes, and to a lesserextent revenue from fees, cesses and rental income. The GP allocates its budget to administrativeexpenses like salaries, the provision and maintenance of various local public goods such as roadsand irrigation canals, as well as the upkeep of services like sanitation at the village level. GPsare also required to organize and preside over two town-hall style meetings called Gram Sabhasevery year. While all village residents are invited to attend these meetings, in practice attendancevaries considerably across GPs.
GPs are also responsible for implementing social welfare programs like the National RuralEmployment Guarantee Act (henceforth, NREGA). NREGA is funded by the central government,and guarantees one hundred days of employment a year to each rural household. Whether thisguarantee is met in practice depends to a large extent on the elected council, since they are respon-sible for aggregating local preferences and filing requests for NREGA funds at the block level.5
Once the project has been sanctioned, GPs exert considerable influence in the targeting of pro-gram funds, since they are responsible for enlisting program beneficiaries. Therefore, the Resultssection examines the impact of consensus-based elections on both the overall level of employmentgeneration, as well as who this employment is targeted towards.
Consensus-Based Elections
Financial incentives that encourage elections via community consensus have been offered bymany state governments in India, for differing periods of time. For instance, Andhra Pradeshhas offered financial incentives since 1964, while more recent implementers include Punjab and
4The system of rotating, randomized reservations creates exogenous variation in politician identity, and has lead toa large literature linking politician identity to policy outcomes such as public good provision (Chattopadhyay & Duflo(2004), Rajaraman & Gupta (2012), Dunning & Nilekani (2013)).
5For instance, many GPs have zero person-days of employment generated under NREGA.
5

FIGURE 1: NUMBER OF SEATS INCREASE WITH GP POPULATION
Notes: GP Seats reserved for women do not increase at the population thresholds 5000 and 8000.
Haryana, who first offered incentives in 2008 and 2010 respectively.This study focuses on Gujarat, a state in Western India, for three reasons. One, the incentive
amount increases sharply at a fixed population threshold. This is not the case in states like Hi-machal Pradesh and Punjab. Two, the distribution of villages around the population threshold5000 is dense enough to be able to conduct the empirical analysis.6 This is not the case in AndhraPradesh, for instance, where the incentive amount increases discontinuously if population ex-ceeds 15,000; the population distribution around the cutoff point 15,000 is extremely sparse - only64 GPs lie within the population range 14,000 to 16,000.7 Third, the scheme has been implemented
6Figure A.2 plots the distribution of GP population based on the 2001 Census.7This estimate is based on village level population and GP Names provided in the 2011 Census.
6
in Gujarat since 2001, so it is fair to assume that village residents understand its functioning, andbelieve that the government will pay out the promised grant amounts. Credibility has been aproblem with recent implementers such as Punjab and Haryana, who failed to pay out the grantsafter the 2010 elections.8
The Gujarat Panchayat, Rural Housing and Rural Development Department is the agency thatprovides financial incentives for elections based on community consensus. The scheme’s statedobjectives are to promote social cohesion by minimizing electoral conflicts, and to reduce electoralexpenses for candidates as well as the Gujarat State Election Commission (henceforth, SEC). TheGujarat SEC benefits financially if villages are able to agree upon a single candidate for each GPseat. This is because an unopposed candidate for a political post eliminates the need to set uppolling booths and hire the associated electoral personnel. These expenses are described in detailbelow.
The Gujarat Panchayati Raj Act (1994) provides extensive details on how GP elections are to beconducted. First, the Gujarat SEC notifies the GP about which seats are reserved for women, SCsand STs. An individual can contest the election if he or she belongs to the reserved category, orif the seat is unreserved. Interested candidates are invited to file nomination papers within a fewdays of the initial announcement. All nominations are scrutinized to ensure that they satisfy theeligibility criteria, which vary by state. In Gujarat, candidates below the age of 21, or those who arenot registered as voters, cannot stand for election in GPs. Candidates have a few days to appealagainst the rejection of their nomination papers, as well as run election campaigns. At the end ofthis period, polling booths are set up within the GP. The day of polling is usually declared as alocal holiday. Every individual above the age of 18 who is registered as a voter is eligible to votein GP elections. Efforts are made to count votes on the same day as polling. Electoral personnelmust be hired to ensure free and fair polls, which can include the scrutiny of nomination papersand election expenditure, detection and prevention of voter impersonation, maintenance of votingsecrecy, scrutiny of doubtful/invalid votes, supervision of counting and recounting, as well as thedeclaration of final vote shares.
Samras (Consensus) Panchayat in Gujarat
Since 2001, Gujarat has incentivized the election of GP members via public consensus under itsSamras (consensus) Panchayat scheme. Village residents are encouraged to deliberate amongstthemselves, and reach a consensus on who their political representatives should be. This schemeis aimed at preventing multiple candidates from standing for election, so that the sole candidate tofile nomination papers can be declared as the unopposed winner. This prevents the need to orga-
8The state government is legally obligated to pay these amounts. See http://indianexpress.com/article/india/india-others/hc-rap-for-govt-for-failure-to-pay-panchayat-incentive for an instance where a legal case was filed againstthe Punjab government. As this case demonstrates, it may take many years for a legal case to be processed in court,and even more time before the state government complies with the court’s orders.
7
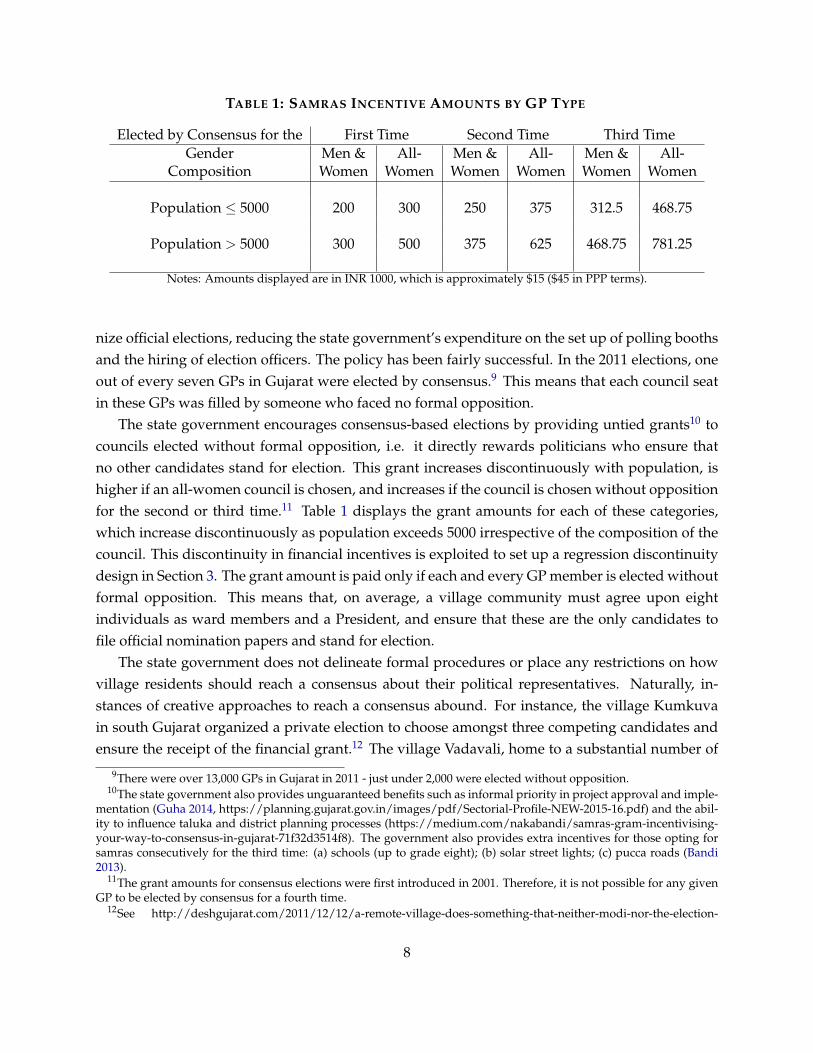
TABLE 1: SAMRAS INCENTIVE AMOUNTS BY GP TYPE
Elected by Consensus for the First Time Second Time Third TimeGender Men & All- Men & All- Men & All-
Composition Women Women Women Women Women Women
Population ≤ 5000 200 300 250 375 312.5 468.75
Population > 5000 300 500 375 625 468.75 781.25
Notes: Amounts displayed are in INR 1000, which is approximately $15 ($45 in PPP terms).
nize official elections, reducing the state government’s expenditure on the set up of polling boothsand the hiring of election officers. The policy has been fairly successful. In the 2011 elections, oneout of every seven GPs in Gujarat were elected by consensus.9 This means that each council seatin these GPs was filled by someone who faced no formal opposition.
The state government encourages consensus-based elections by providing untied grants10 tocouncils elected without formal opposition, i.e. it directly rewards politicians who ensure thatno other candidates stand for election. This grant increases discontinuously with population, ishigher if an all-women council is chosen, and increases if the council is chosen without oppositionfor the second or third time.11 Table 1 displays the grant amounts for each of these categories,which increase discontinuously as population exceeds 5000 irrespective of the composition of thecouncil. This discontinuity in financial incentives is exploited to set up a regression discontinuitydesign in Section 3. The grant amount is paid only if each and every GP member is elected withoutformal opposition. This means that, on average, a village community must agree upon eightindividuals as ward members and a President, and ensure that these are the only candidates tofile official nomination papers and stand for election.
The state government does not delineate formal procedures or place any restrictions on howvillage residents should reach a consensus about their political representatives. Naturally, in-stances of creative approaches to reach a consensus abound. For instance, the village Kumkuvain south Gujarat organized a private election to choose amongst three competing candidates andensure the receipt of the financial grant.12 The village Vadavali, home to a substantial number of
9There were over 13,000 GPs in Gujarat in 2011 - just under 2,000 were elected without opposition.10The state government also provides unguaranteed benefits such as informal priority in project approval and imple-
mentation (Guha 2014, https://planning.gujarat.gov.in/images/pdf/Sectorial-Profile-NEW-2015-16.pdf) and the abil-ity to influence taluka and district planning processes (https://medium.com/nakabandi/samras-gram-incentivising-your-way-to-consensus-in-gujarat-71f32d3514f8). The government also provides extra incentives for those opting forsamras consecutively for the third time: (a) schools (up to grade eight); (b) solar street lights; (c) pucca roads (Bandi2013).
11The grant amounts for consensus elections were first introduced in 2001. Therefore, it is not possible for any givenGP to be elected by consensus for a fourth time.
12See http://deshgujarat.com/2011/12/12/a-remote-village-does-something-that-neither-modi-nor-the-election-
8
Hindu and Muslim families, has decided to divide the President’s five year term equally betweena Hindu and Muslim President (two and a half years each).13 However, survey evidence suggeststhat it is usually local elites who nominate candidates and mobilize consensus-based support toensure receipt of the monetary benefits (Breman 2011, Bandi 2013, Ganguly 2013, Guha 2014).
The political economy literature has consistently documented the substantial authority thatlocal elites exert over decision making at the community level (Olken 2007, Alatas et al. 2013,Acemoglu et al. 2014). It is, therefore, unsurprising that village elders and landowning castemembers are reported to be heavily involved in nominating political candidates and mobilizingconsensus-based support for them. For instance, the dominant14 Rajput residents of GopalpuraGP nominated women belonging to SC and ST groups for election by consensus in 2011.15 Thisanecdote is consistent with Breman (2011), who describes the process of nominating candidatesfor consensus based elections in four Gujarati villages Gandevigam, Chikhligam, Bardoligam andAtulgam:
" The dominant caste-class of landowners state in the village assembly (held twice a year) who are go-ing to be the next sirpanch (President) and members of the village council. It is possible to turn down theinvitation to be nominated ... but alternative names cannot come up in the hearing."
Breman (2011) further describes an underwhelming approach to governance by councils so-elected:
"In our observation none of the councils in Gandevigam, Chikhligam, Bardoligam or Atulgam has arecord of activity to show that village democracy is indeed practiced. The members are not involved in thehandling of local governance, there is no schedule for meetings and business is attended to by the talati, incharge of administration, and the sirpanch. The latter may be a figurehead only ... where the exercise ofpower is firmly in the hands of members (sic) who belong to the dominant caste-class of landowners ... "
These anecdotes do not imply that the rural poor have no space left for assertion, or that po-litical representatives elected by community consensus cannot increase access to developmentprograms and improve public good availability. However, political figureheads may lack the will-
commission-might-have-thought-of/13This decision was made at a town-hall style meeting (gram sabha) in which leaders of all communities par-
ticipated. See http://www.ndtv.com/india-news/day-before-riot-gujarat-village-split-sarpanchs-term-for-muslim-hindu-1674486 for more details.
14Dominant in terms of population share and socioeconomic status.15The village has had official elections only thrice after Independence. There are about 290 Rajput families, 125 ST
families and 65 SC families in the village. "During a village meeting, village elders and women suggested that a chanceshould be given to the women of SC and ST families as it would bring a lot of harmony among the villagers. Thesuggestion was readily accepted." For further details, see http://archive.indianexpress.com/news/narmada-s-rajput-village-appoints-tribal-woman-its-sarpanch/889943/
9
ingness to overcome the drawbacks of political and administrative inexperience, a significant de-terminant of implementation inefficiencies in the Indian village setting (Afridi et al. 2013). Breman(2011) also describes lack of experience and socioeconomic standing as hindrances in the effectivefunctioning of political leaders:
"Their problems are manifold: to start with a total ignorance of government programmes and schemesin stock, when and where to circumvent or manipulate rules and regulations, lack of familiarity how towheel and deal with officials, inability to back up action taken with speed money, i.e. a cash flow ’to get theirwork done’ and last but not least, missing the poise to walk around with confidence in the corridors of thebureaucracy."
In sum, the policy of incentivizing consensus-based elections is controversial, because of itspotential to increase the influence of an elite caucus over their community’s choice of politicalrepresentation. As discussed above, it can lead to the appointment of political leaders that merelyserve as figureheads. It has also faced criticism from local politicians, who find themselves de-prived of financial grants simply because the village chose to have an official election. It is exactlythis deprivation that allows the local elite to quash any opposition in the name of obstructingvillage development, inhibiting the development of leadership in backward areas (Institute of So-cial Sciences 2012). However, the impact of these financial incentives on electoral competition,politician identity and governance is an open empirical question. To date, there do not exist anystudies that quantify the causal impact of these financial grants, a gap that this paper seeks to fill.
Data
Multiple datasets were combined before conducting the empirical analysis. The 2001 and 2011Population Censuses provides village-level characteristics, including demographic informationand public good availability. GP jurisdictions may contain more than one village, and are mappedto villages using the Local Body Mapping data obtained from the Area Profiler website managedby the Ministry of Panchayati Raj.
Information on the 2011 GP elections was obtained from the Gujarat State Election Commis-sion. This includes detailed information on each political candidate for over 75% of GPs, includingreservation category, gender, education and occupation. Since these datasets are available only inGujarati, they were manually merged with the Local Body Mapping dataset described above.
Village level income and expenditure receipts were obtained from the office of the Panchayat,Rural Housing and Rural Development Department. This department manages the Rural Ac-counts Management System, which keeps track of various categories of expenditure (education,nutrition, villlage development, etc) and income (grants, taxes, fees, etc) at the village budget onan annual basis. This study utilizes village level data for the three fiscal years 2013-16.
10

Information on the generation of workfare employment under NREGA for 2011-16 was ob-tained from the NREGA Public Data Portal. Gupta & Mukhopadhyay (2014) show that NREGA’sprimary implementation constraint is the supply of work generated by GPs, not demand. There-fore, I use information on the amount of employment actually generated as the outcome of inter-est. This includes measures of the number of households who were provided work, as well as thenumber of person-days of employment generated each month. To understand whether NREGAtargeting changed as a result of the consensus-based elections, I use information on the amount ofemployment provided to women, Scheduled Castes, Scheduled Tribes and Indira Awaas Yojana(IAY) households.16
3 Empirical Strategy
This section sets up a regression discontinuity design based on the discontinuous increase in fi-nancial incentives for consensus-based elections at the population threshold 5000. The RD designquantifies the causal impact of the financial incentives on political competition, political selectionand government performance.
3.1 Central Specification
I follow the suggestions of Hahn, Todd, and Van der Klaauw (2001) and Imbens and Lemieux(2008), and use local linear regressions after restricting attention to a close bandwidth around thethreshold. Optimal bandwidth choice is based on the procedure outlined in Calonico et al. (2014).The identifying assumption is that unobservables vary smoothly at the cutoff.
Let popGP denote the population under the GP’s jurisdiction. For ease of notation, I define arescaled version of the GP population as pg =
popGP
1000 . Restricting attention to observations withinthe optimal bandwidth, the empirical specification takes the following form:
Eig = γ + α0pg1[pg ≤ 5] + α1(pg − 5)1[pg > 5] + β1[pg > 5] +Xg + εig
Eig denotes an electoral outcome, such as the number of candidates standing for election, forseat i in GP g. This specification includes a constant γ, and fits separate linear regressions beforeand after the population threshold - the slope coefficient is α0 before the threshold, and α1 afterthe threshold. Xg represents GP-level controls such as the number of villages under the council’sjurisdiction as well as demographic controls like the proportion of SC and ST residents. Of primaryinterest is the β coefficient, which measures discontinuities in Eig as GP population exceeds thepolicy threshold 5000 (i.e. as gp exceeds 5). The β estimates are interpreted as the causal effectsof financial incentives on electoral competition and political selection. Optimal bandwidths are
16Indira Awaas Yojana (IAY) is a program targeted at reducing homelessness. IAY households are socioeconomicallydisadvantaged groups (SCs, STs, free bonded laborers, and other rural households below the poverty line) that receivefunding to construct housing units.
11
chosen separately for each outcome, following the procedure prescribed by Calonico et al. (2014).17
Standard errors are clustered at the level of the discrete running variable, GP population.Some electoral outcomes are measured at the GP level, like the total number of council seats
won without formal opposition. For these outcomes, the central specification uses data at the GPlevel instead of the seat level:
Eg = γ + α0pg1[pg ≤ 5] + α1(pg − 5)1[pg > 5] + β1[pg > 5] +Xg + εg
The β coefficient measures the causal effect of the grant increase on electoral outcomes, and stan-dard errors are clustered at the GP population level.
Governance
Four outcomes at the GP level are used to study governance - council expenditure, council incomewith a focus on revenue raised by the local council, and NREGA employment generation andtargeting. Annual data on GP income and expenditure is available for the years 2013-16 and dataon NREGA implementation is available for the years 2011-16. As there are significant outliersin both sets of data, I trim the top 1% of observations from each of the variables. The empiricalspecification takes the following form:
Sgy = γ + α0pg1[pg ≤ 5] + α1(pg − 5)1[pg > 5] + β1[pg > 5] +Xg + γy + εgy
Sgy denotes a governance outcome in GP g in year y, such as income, expenditure or employmentcreation. This specification includes a constant γ, separate linear regressions before and after thepopulation threshold (α0 and α1 denote the slope coefficients before and after respectively), GPlevel controls Xg and year fixed effects γy. The β coefficient measures discontinuities in Sgy as GPpopulation exceeds the policy threshold 5000 (i.e. as gp exceeds 5), and is interpreted as the causaleffect of the financial incentives on government functioning. Optimal bandwidths are chosenseparately for each outcome, and standard errors are clustered at the level of the discrete runningvariable, GP population.
Alternative Explanations
As noted previously, two features of the elected council increase discontinuously as GP popula-tion exceeds 5000 - the financial incentive for consensus elections increases by 50 per cent, and thenumber of council members increases by 2. This means that the results on electoral and gover-nance outcomes may be driven by the addition of two council members, not the increase in thefinancial grant. I leverage the existence of alternative population thresholds (i.e. those other than
17Optimal bandwidths are estimated using data on GPs with population within a bandwidth of 1000 around thethreshold 5000. This avoids the inclusion of other population thresholds at which council composition changes.
12
5000) at which the number of GP members increases by 2. Discontinuity estimates at these al-ternate thresholds isolate the impact of additional council members on electoral and governanceoutcomes. These estimates are used to show that it is unlikely that additional council membersare driving the effects documented at the threshold 5000.
Panel A of Figure 1 plots the relationship between the number of GP members and population.We can see that the number of council members is fixed at 7 for GPs with population up to 3000,and increases by 2 for every thousand people thereafter. Panel B of Figure 1 plots the relationshipbetween the number of GP seats reserved for women and population. Since the law mandates thereservation of at least 33 per cent of seats for women, the number of seats reserved for womenincreases by one at every population threshold except 5000 and 8000. Figure A.1 shows that thenumber of seats reserved for SCs, STs and OBCs does not increase discontinuously at the thresh-olds 5000 or 8000. Therefore, I estimate the causal impact of two additional council seats (neitherreserved for women) by testing for discontinuities in electoral and governance outcomes at thethreshold 8000.18
The empirical specifications for electoral and governance outcomes (Eig and Sgy respectively)are analogous to those described above:
Eig = γ8 + β81[pg > 8] + α08pg1[pg ≤ 8] + α1
8(pg − 8)1[pg > 8] +Xg + εig
Sgy = γ8 + β81[pg > 8] + α08pg1[pg ≤ 8] + α1
8(pg − 8)1[pg > 8] +Xg + γy + εgy
where γ8 is a constant, α08 and α1
8 are distinct population slopes before and after the threshold8000, and Xg represents GP-level demographic controls. The β8 coefficient measures the impactof two additional unreserved seats. Optimal bandwidths are chosen separately for each outcome,following the procedure prescribed by Calonico et al. (2014).19 Standard errors are clustered at thelevel of the running variable, GP population.
4 Results
This section presents estimates of the effect of increased financial incentives for consensus-basedelections. The financial incentive reduces political competition by reducing the number of candi-dates standing for election for each seat, and increasing the number of seats won without formalopposition at the GP level. The incentive also crowds in a younger, more educated candidate pool;politicians who are ultimately elected from this pool are, on average, 4 years younger and have 2more years of education. Finally, the impact on multiple measures of governance, including localgovernment expenditure and the targeting of workfare employment, is negative and substantive.
18This implicitly assumes that the interaction effects of the higher incentive and additional members are negligible.19Optimal bandwidths are estimated using data on GPs with population within a bandwidth of 1000 around the
threshold 8000. This avoids the inclusion of other population thresholds at which council composition changes.
13
4.1 Baseline Continuity Tests
I first test for evidence of sorting around the population cutoff. This is because GPs may wantto be listed as having more than 5000 residents to receive larger samras grant amounts. Thisis unlikely to be the case, however, because the running variable is taken from the PopulationCensus that was conducted 10 years prior to the introduction of the discontinuous incentives.Figure A.2 presents the density of population surrounding the two cutoffs used in the analysis.Population is collapsed into bins of width 20, and no discontinuity in the vicinity of either of thethresholds is evident. Since the running variable is discrete, I follow Frandsen (2016) to test for themanipulation of reported population close to the cutoffs.20 The hypothesis of no discontinuity atthe threshold 5000 is not rejected at standard significance levels.21
Next, I show that village demographics and public good availability are balanced at baseline(in 2011) by testing for discontinuities at the thresholds 5000 and 8000. These balance tests useinformation from the 2011 Population Census and are presented in Table A.1. Among the fiftyfour tests, six yield statistically significant estimates, which is unsurprising and to be expectedmechanically at the 10% level of significance.
Next, I verify that council seats increase at the thresholds 5000 and 8000, while those reservedfor women do not. Table A.2 displays discontinuity estimates at each threshold using the centralspecification. The number of seats increases significantly at both thresholds. Notice that eventhough there are fewer observations around the threshold 8000, we are still able to reject the hy-pothesis of no discontinuity. When we repeat the same exercise for the number of seats reservedfor women, we do not find evidence of a significant increase at either of the thresholds.
4.2 Electoral Competition
This section presents evidence that the samras grant reduced political competition by disincen-tivizing multiple candidates from running for each electoral seat. The primary outcome of interestis the number of candidates that stood for election to each council post. I also examine whetherthe grant increased the number of seats that were won without opposition, i.e. how frequently thegrant reduced the number of candidates all the way to one.
First, I examine the impact of the financial grant on political competition by testing for a dis-continuous decrease in the number of candidates for each council seat as GP population exceeds5000. The left panel of Figure 2 shows that the number of candidates for each seat falls by around0.7 as we cross the threshold, consistent with the hike in incentives for consensus-based elections.The left panel of Table 2 displays discontinuity estimates consistent with this graph. The numberof candidates per seat falls by 0.7 in response to the samras grant; the decrease in candidates is
20The McCrary (2008) test, which is commonly used to test for sorting around thresholds, assumes a continuousrunning variable. In the case of a discrete running variable, it may falsely reject the null of no manipulation at too higha rate.
21Figure A.2 displays p-values from the Frandsen (2016) test for discontinuities at the thresholds 5000 and 8000.
14
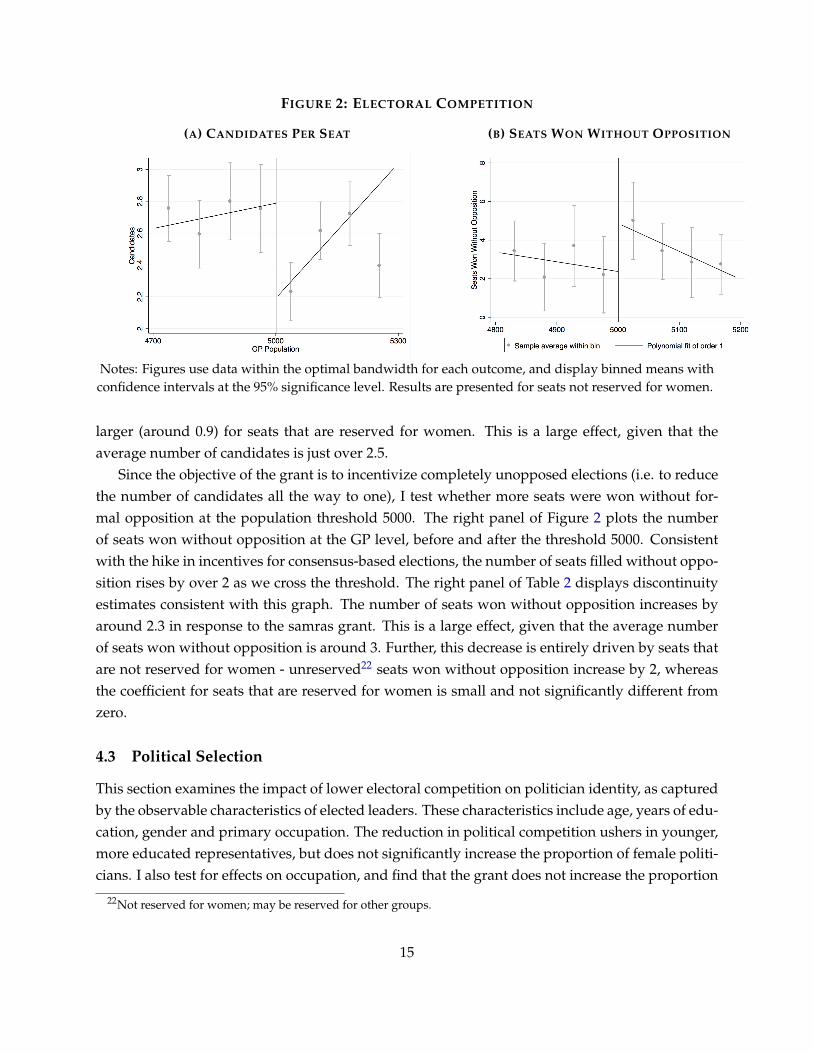
FIGURE 2: ELECTORAL COMPETITION
(A) CANDIDATES PER SEAT (B) SEATS WON WITHOUT OPPOSITION
Notes: Figures use data within the optimal bandwidth for each outcome, and display binned means withconfidence intervals at the 95% significance level. Results are presented for seats not reserved for women.
larger (around 0.9) for seats that are reserved for women. This is a large effect, given that theaverage number of candidates is just over 2.5.
Since the objective of the grant is to incentivize completely unopposed elections (i.e. to reducethe number of candidates all the way to one), I test whether more seats were won without for-mal opposition at the population threshold 5000. The right panel of Figure 2 plots the numberof seats won without opposition at the GP level, before and after the threshold 5000. Consistentwith the hike in incentives for consensus-based elections, the number of seats filled without oppo-sition rises by over 2 as we cross the threshold. The right panel of Table 2 displays discontinuityestimates consistent with this graph. The number of seats won without opposition increases byaround 2.3 in response to the samras grant. This is a large effect, given that the average numberof seats won without opposition is around 3. Further, this decrease is entirely driven by seats thatare not reserved for women - unreserved22 seats won without opposition increase by 2, whereasthe coefficient for seats that are reserved for women is small and not significantly different fromzero.
4.3 Political Selection
This section examines the impact of lower electoral competition on politician identity, as capturedby the observable characteristics of elected leaders. These characteristics include age, years of edu-cation, gender and primary occupation. The reduction in political competition ushers in younger,more educated representatives, but does not significantly increase the proportion of female politi-cians. I also test for effects on occupation, and find that the grant does not increase the proportion
22Not reserved for women; may be reserved for other groups.
15
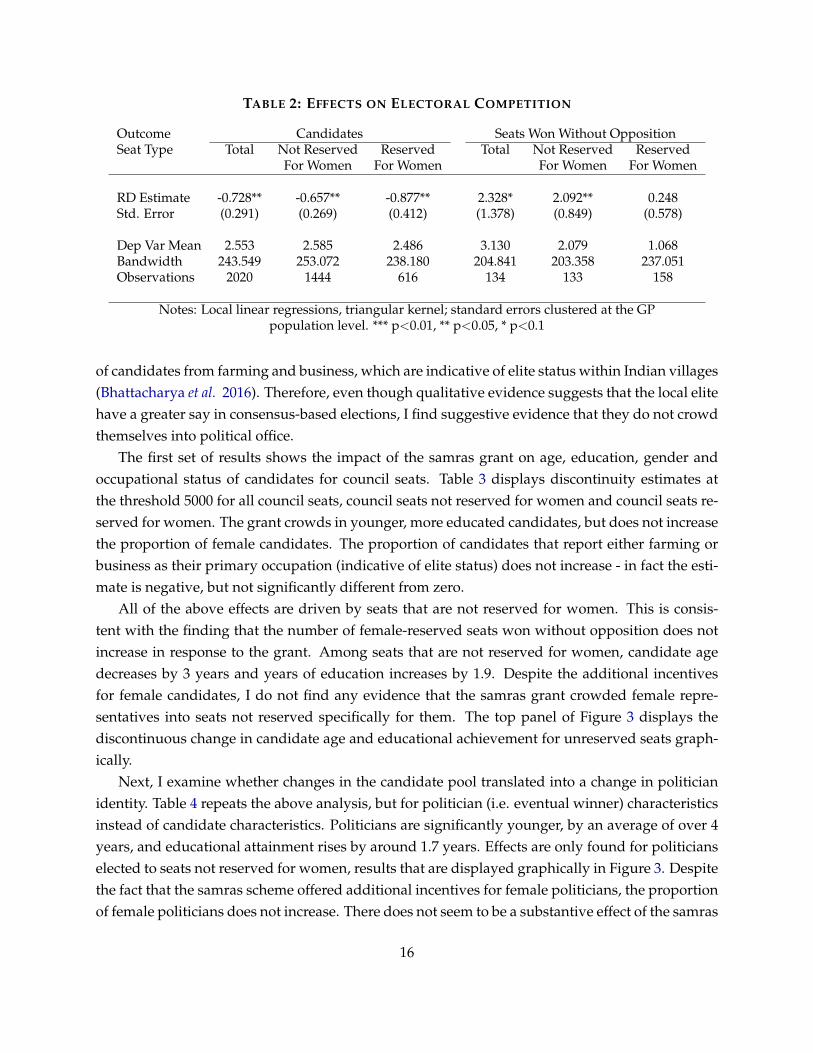
TABLE 2: EFFECTS ON ELECTORAL COMPETITION
Outcome Candidates Seats Won Without OppositionSeat Type Total Not Reserved Reserved Total Not Reserved Reserved
For Women For Women For Women For Women
RD Estimate -0.728** -0.657** -0.877** 2.328* 2.092** 0.248Std. Error (0.291) (0.269) (0.412) (1.378) (0.849) (0.578)
Dep Var Mean 2.553 2.585 2.486 3.130 2.079 1.068Bandwidth 243.549 253.072 238.180 204.841 203.358 237.051Observations 2020 1444 616 134 133 158
Notes: Local linear regressions, triangular kernel; standard errors clustered at the GPpopulation level. *** p<0.01, ** p<0.05, * p<0.1
of candidates from farming and business, which are indicative of elite status within Indian villages(Bhattacharya et al. 2016). Therefore, even though qualitative evidence suggests that the local elitehave a greater say in consensus-based elections, I find suggestive evidence that they do not crowdthemselves into political office.
The first set of results shows the impact of the samras grant on age, education, gender andoccupational status of candidates for council seats. Table 3 displays discontinuity estimates atthe threshold 5000 for all council seats, council seats not reserved for women and council seats re-served for women. The grant crowds in younger, more educated candidates, but does not increasethe proportion of female candidates. The proportion of candidates that report either farming orbusiness as their primary occupation (indicative of elite status) does not increase - in fact the esti-mate is negative, but not significantly different from zero.
All of the above effects are driven by seats that are not reserved for women. This is consis-tent with the finding that the number of female-reserved seats won without opposition does notincrease in response to the grant. Among seats that are not reserved for women, candidate agedecreases by 3 years and years of education increases by 1.9. Despite the additional incentivesfor female candidates, I do not find any evidence that the samras grant crowded female repre-sentatives into seats not reserved specifically for them. The top panel of Figure 3 displays thediscontinuous change in candidate age and educational achievement for unreserved seats graph-ically.
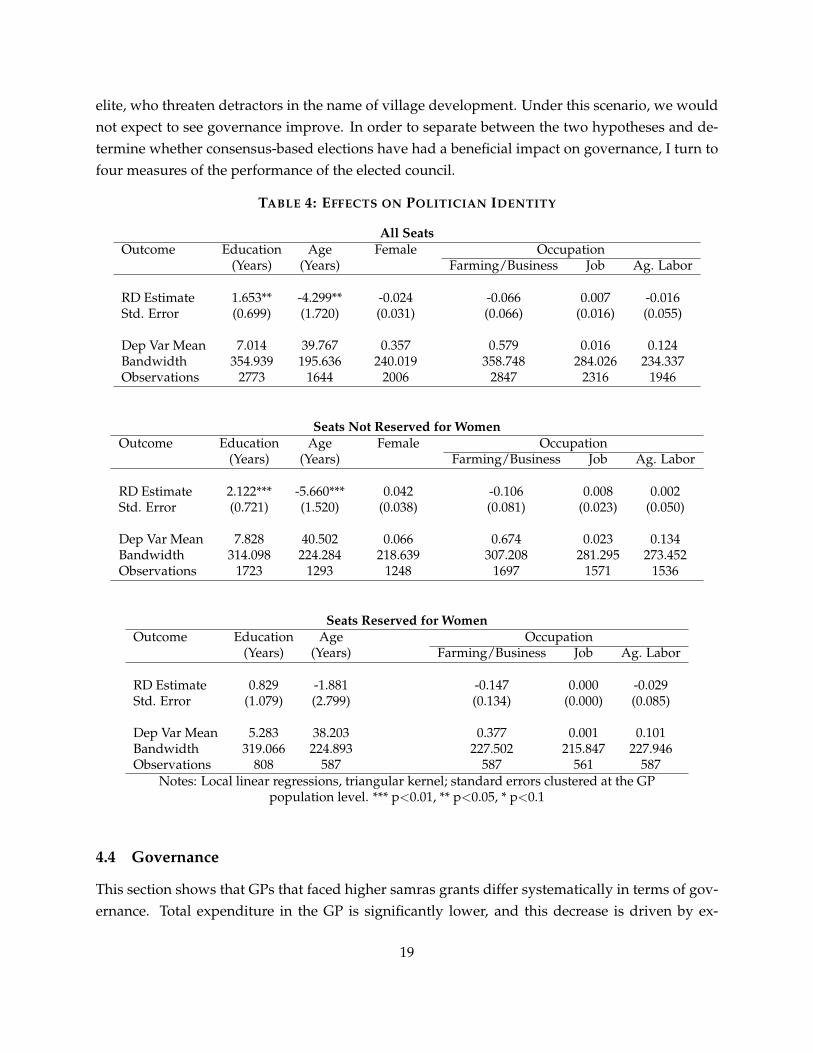
Next, I examine whether changes in the candidate pool translated into a change in politicianidentity. Table 4 repeats the above analysis, but for politician (i.e. eventual winner) characteristicsinstead of candidate characteristics. Politicians are significantly younger, by an average of over 4years, and educational attainment rises by around 1.7 years. Effects are only found for politicianselected to seats not reserved for women, results that are displayed graphically in Figure 3. Despitethe fact that the samras scheme offered additional incentives for female politicians, the proportionof female politicians does not increase. There does not seem to be a substantive effect of the samras
16
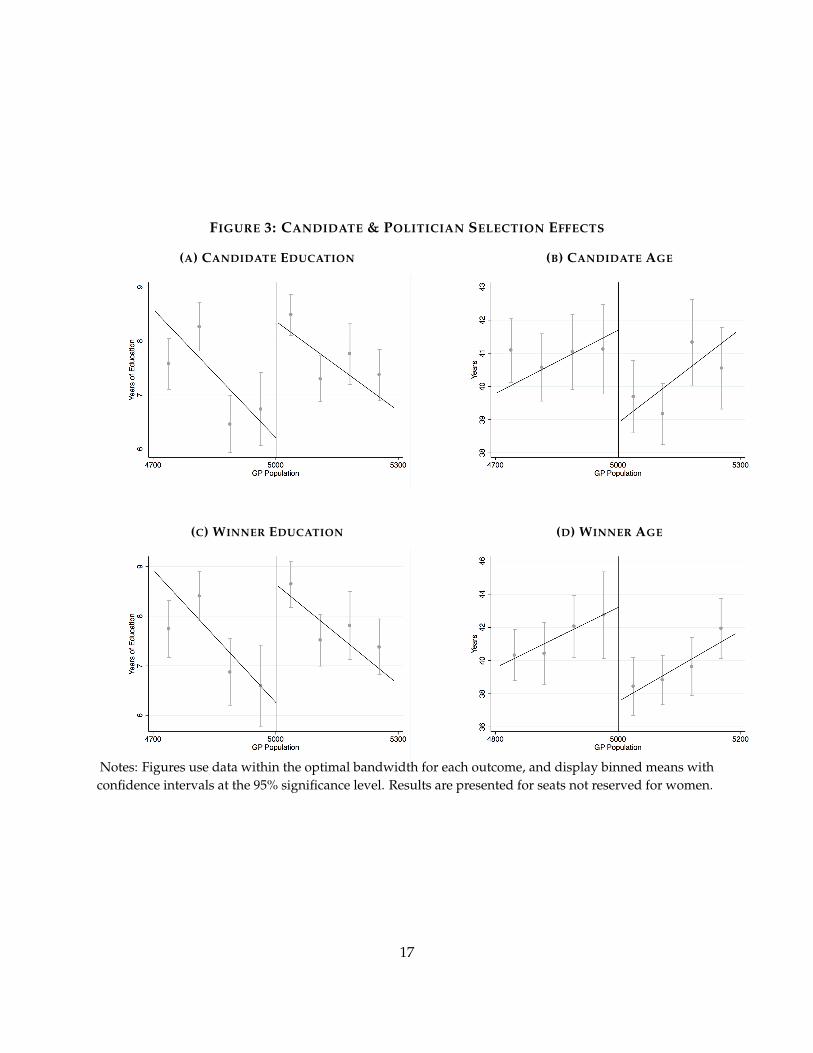
FIGURE 3: CANDIDATE & POLITICIAN SELECTION EFFECTS
(A) CANDIDATE EDUCATION (B) CANDIDATE AGE
(C) WINNER EDUCATION (D) WINNER AGE
Notes: Figures use data within the optimal bandwidth for each outcome, and display binned means withconfidence intervals at the 95% significance level. Results are presented for seats not reserved for women.
17
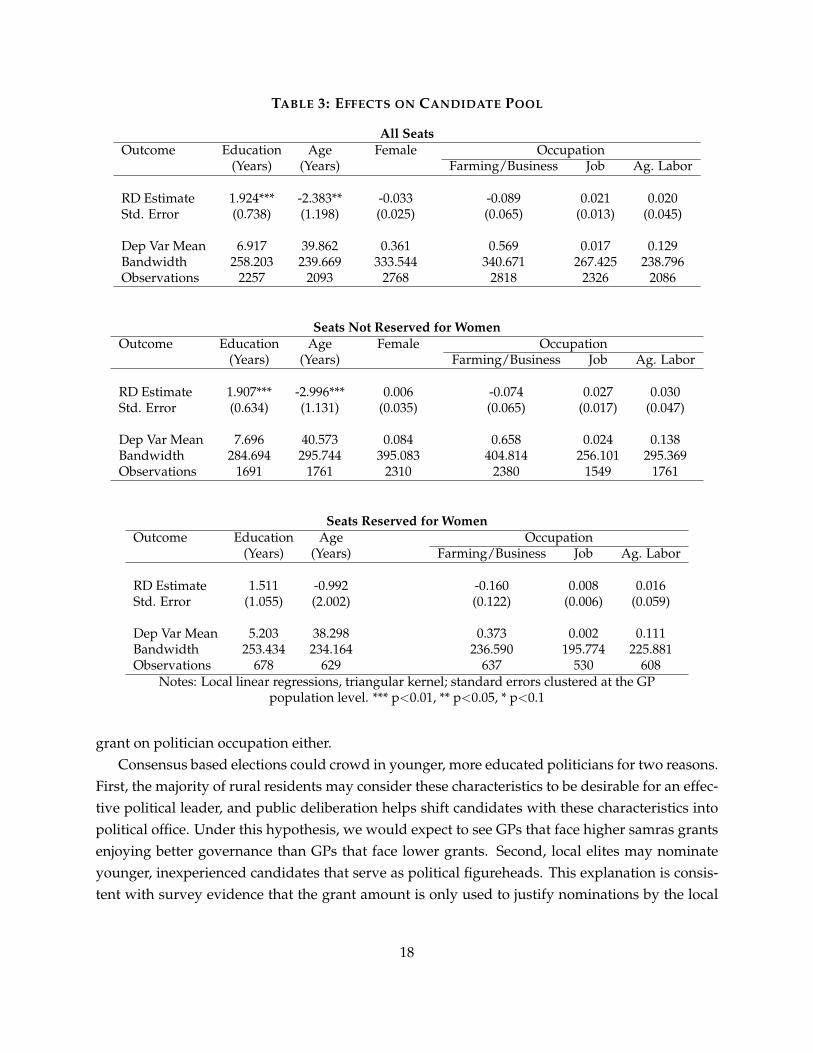
TABLE 3: EFFECTS ON CANDIDATE POOL
All SeatsOutcome Education Age Female Occupation
(Years) (Years) Farming/Business Job Ag. Labor
RD Estimate 1.924*** -2.383** -0.033 -0.089 0.021 0.020Std. Error (0.738) (1.198) (0.025) (0.065) (0.013) (0.045)
Dep Var Mean 6.917 39.862 0.361 0.569 0.017 0.129Bandwidth 258.203 239.669 333.544 340.671 267.425 238.796Observations 2257 2093 2768 2818 2326 2086
Seats Not Reserved for WomenOutcome Education Age Female Occupation
(Years) (Years) Farming/Business Job Ag. Labor
RD Estimate 1.907*** -2.996*** 0.006 -0.074 0.027 0.030Std. Error (0.634) (1.131) (0.035) (0.065) (0.017) (0.047)
Dep Var Mean 7.696 40.573 0.084 0.658 0.024 0.138Bandwidth 284.694 295.744 395.083 404.814 256.101 295.369Observations 1691 1761 2310 2380 1549 1761
Seats Reserved for WomenOutcome Education Age Occupation
(Years) (Years) Farming/Business Job Ag. Labor
RD Estimate 1.511 -0.992 -0.160 0.008 0.016Std. Error (1.055) (2.002) (0.122) (0.006) (0.059)
Dep Var Mean 5.203 38.298 0.373 0.002 0.111Bandwidth 253.434 234.164 236.590 195.774 225.881Observations 678 629 637 530 608
Notes: Local linear regressions, triangular kernel; standard errors clustered at the GPpopulation level. *** p<0.01, ** p<0.05, * p<0.1
grant on politician occupation either.Consensus based elections could crowd in younger, more educated politicians for two reasons.
First, the majority of rural residents may consider these characteristics to be desirable for an effec-tive political leader, and public deliberation helps shift candidates with these characteristics intopolitical office. Under this hypothesis, we would expect to see GPs that face higher samras grantsenjoying better governance than GPs that face lower grants. Second, local elites may nominateyounger, inexperienced candidates that serve as political figureheads. This explanation is consis-tent with survey evidence that the grant amount is only used to justify nominations by the local
18
elite, who threaten detractors in the name of village development. Under this scenario, we wouldnot expect to see governance improve. In order to separate between the two hypotheses and de-termine whether consensus-based elections have had a beneficial impact on governance, I turn tofour measures of the performance of the elected council.
TABLE 4: EFFECTS ON POLITICIAN IDENTITY
All SeatsOutcome Education Age Female Occupation
(Years) (Years) Farming/Business Job Ag. Labor
RD Estimate 1.653** -4.299** -0.024 -0.066 0.007 -0.016Std. Error (0.699) (1.720) (0.031) (0.066) (0.016) (0.055)
Dep Var Mean 7.014 39.767 0.357 0.579 0.016 0.124Bandwidth 354.939 195.636 240.019 358.748 284.026 234.337Observations 2773 1644 2006 2847 2316 1946
Seats Not Reserved for WomenOutcome Education Age Female Occupation
(Years) (Years) Farming/Business Job Ag. Labor
RD Estimate 2.122*** -5.660*** 0.042 -0.106 0.008 0.002Std. Error (0.721) (1.520) (0.038) (0.081) (0.023) (0.050)
Dep Var Mean 7.828 40.502 0.066 0.674 0.023 0.134Bandwidth 314.098 224.284 218.639 307.208 281.295 273.452Observations 1723 1293 1248 1697 1571 1536
Seats Reserved for WomenOutcome Education Age Occupation
(Years) (Years) Farming/Business Job Ag. Labor
RD Estimate 0.829 -1.881 -0.147 0.000 -0.029Std. Error (1.079) (2.799) (0.134) (0.000) (0.085)
Dep Var Mean 5.283 38.203 0.377 0.001 0.101Bandwidth 319.066 224.893 227.502 215.847 227.946Observations 808 587 587 561 587
Notes: Local linear regressions, triangular kernel; standard errors clustered at the GPpopulation level. *** p<0.01, ** p<0.05, * p<0.1
4.4 Governance
This section shows that GPs that faced higher samras grants differ systematically in terms of gov-ernance. Total expenditure in the GP is significantly lower, and this decrease is driven by ex-
19
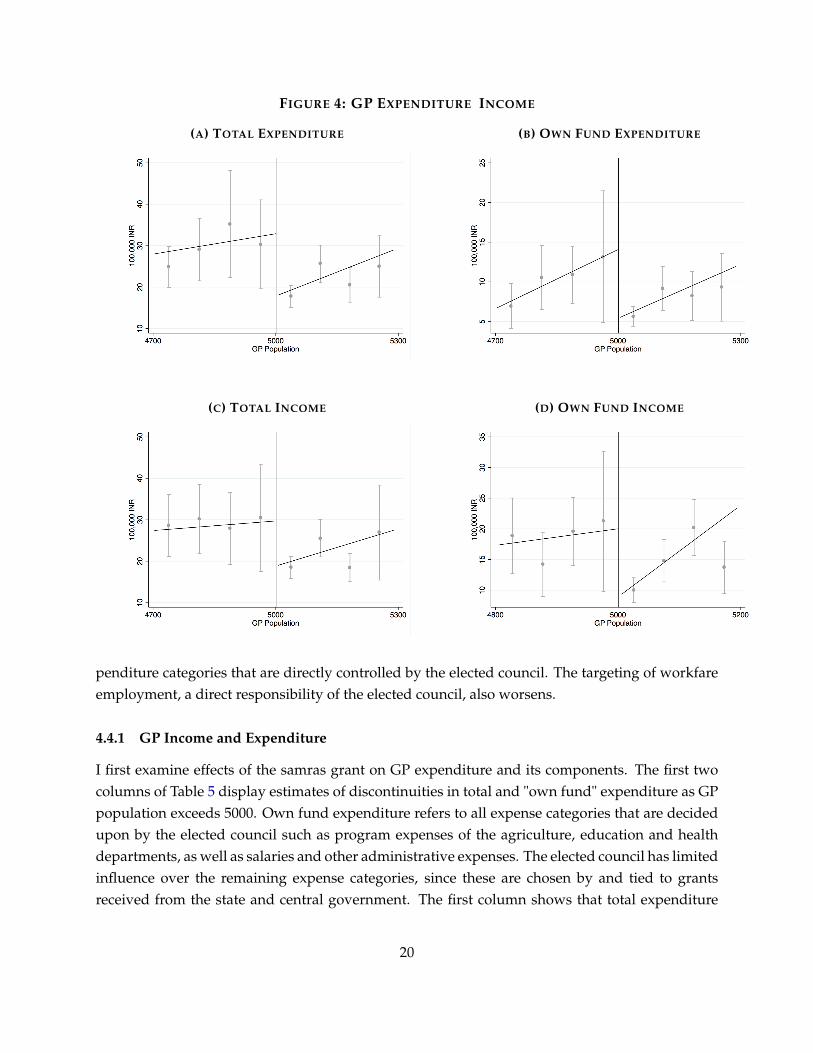
FIGURE 4: GP EXPENDITURE INCOME
(A) TOTAL EXPENDITURE (B) OWN FUND EXPENDITURE
(C) TOTAL INCOME (D) OWN FUND INCOME
penditure categories that are directly controlled by the elected council. The targeting of workfareemployment, a direct responsibility of the elected council, also worsens.
4.4.1 GP Income and Expenditure
I first examine effects of the samras grant on GP expenditure and its components. The first twocolumns of Table 5 display estimates of discontinuities in total and "own fund" expenditure as GPpopulation exceeds 5000. Own fund expenditure refers to all expense categories that are decidedupon by the elected council such as program expenses of the agriculture, education and healthdepartments, as well as salaries and other administrative expenses. The elected council has limitedinfluence over the remaining expense categories, since these are chosen by and tied to grantsreceived from the state and central government. The first column shows that total expenditure
20
decreases significantly and substantively - by over half of the mean. The second column showsthat this decrease is driven by a significant drop in own fund expenses. That is, spending on localadministration and development of the village falls as well. The upper panel of Figure 4 displaysthese discontinuity estimates graphically.
Is a decrease in council income driving the negative coefficients on expenditure? The thirdcolumn of Table 5 shows that total income does not decrease significantly as population exceedsthe threshold 5000. This estimate is negative, but not significantly different from zero and muchsmaller in magnitude than the fall in expenditure. As discussed previously, councils receive grantsfrom state and national governments, but also collect taxes within their jurisdiction. Since politicalexperience and socioeconomic standing may aid in the generation of government revenue, I exam-ine whether "own fund" revenue changes discontinuously as population exceeds 5000. Own fundrevenue includes revenue generated through the collection of taxes, fees and other charges. Thelast column of Table 5 shows that the effect on own fund revenue is negative and sizable (around45 per cent of the mean), but not statistically significant. The lower panel of Figure 4 displaysthese discontinuity estimates graphically.
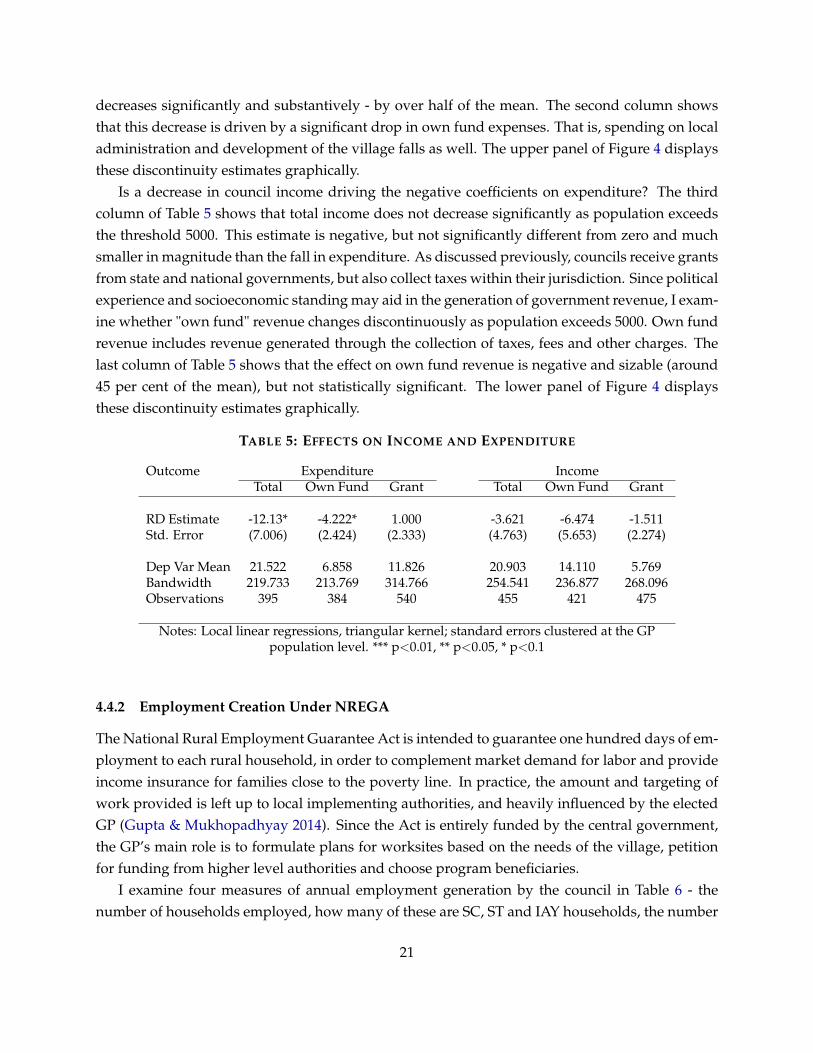
TABLE 5: EFFECTS ON INCOME AND EXPENDITURE
Outcome Expenditure IncomeTotal Own Fund Grant Total Own Fund Grant
RD Estimate -12.13* -4.222* 1.000 -3.621 -6.474 -1.511Std. Error (7.006) (2.424) (2.333) (4.763) (5.653) (2.274)
Dep Var Mean 21.522 6.858 11.826 20.903 14.110 5.769Bandwidth 219.733 213.769 314.766 254.541 236.877 268.096Observations 395 384 540 455 421 475
Notes: Local linear regressions, triangular kernel; standard errors clustered at the GPpopulation level. *** p<0.01, ** p<0.05, * p<0.1
4.4.2 Employment Creation Under NREGA
The National Rural Employment Guarantee Act is intended to guarantee one hundred days of em-ployment to each rural household, in order to complement market demand for labor and provideincome insurance for families close to the poverty line. In practice, the amount and targeting ofwork provided is left up to local implementing authorities, and heavily influenced by the electedGP (Gupta & Mukhopadhyay 2014). Since the Act is entirely funded by the central government,the GP’s main role is to formulate plans for worksites based on the needs of the village, petitionfor funding from higher level authorities and choose program beneficiaries.
I examine four measures of annual employment generation by the council in Table 6 - thenumber of households employed, how many of these are SC, ST and IAY households, the number
21
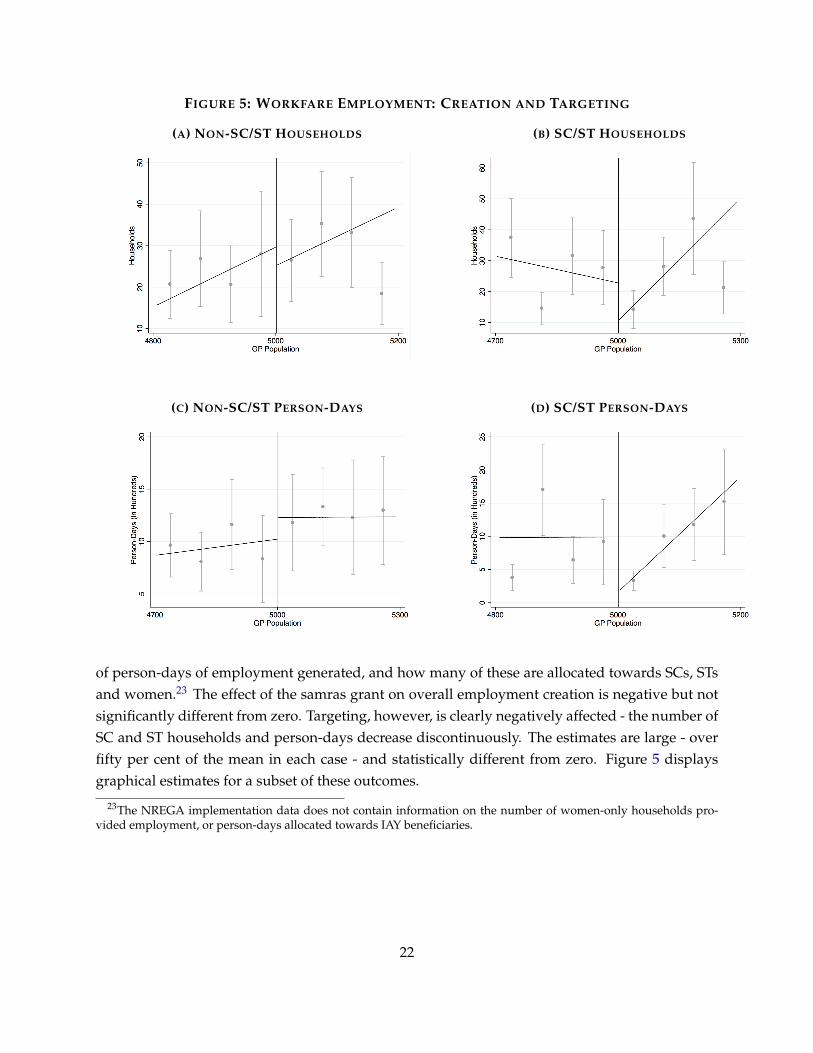
FIGURE 5: WORKFARE EMPLOYMENT: CREATION AND TARGETING
(A) NON-SC/ST HOUSEHOLDS (B) SC/ST HOUSEHOLDS
(C) NON-SC/ST PERSON-DAYS (D) SC/ST PERSON-DAYS
of person-days of employment generated, and how many of these are allocated towards SCs, STsand women.23 The effect of the samras grant on overall employment creation is negative but notsignificantly different from zero. Targeting, however, is clearly negatively affected - the number ofSC and ST households and person-days decrease discontinuously. The estimates are large - overfifty per cent of the mean in each case - and statistically different from zero. Figure 5 displaysgraphical estimates for a subset of these outcomes.
23The NREGA implementation data does not contain information on the number of women-only households pro-vided employment, or person-days allocated towards IAY beneficiaries.
22
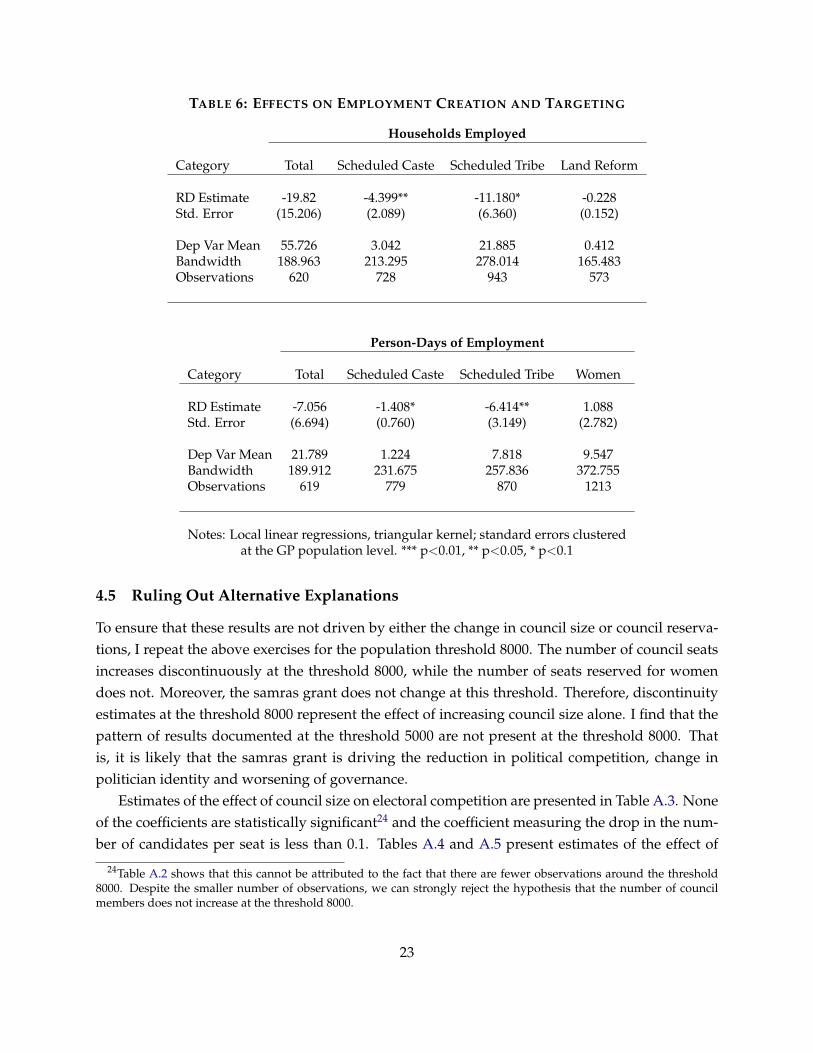
TABLE 6: EFFECTS ON EMPLOYMENT CREATION AND TARGETING
Households Employed
Category Total Scheduled Caste Scheduled Tribe Land Reform
RD Estimate -19.82 -4.399** -11.180* -0.228Std. Error (15.206) (2.089) (6.360) (0.152)
Dep Var Mean 55.726 3.042 21.885 0.412Bandwidth 188.963 213.295 278.014 165.483Observations 620 728 943 573
Person-Days of Employment
Category Total Scheduled Caste Scheduled Tribe Women
RD Estimate -7.056 -1.408* -6.414** 1.088Std. Error (6.694) (0.760) (3.149) (2.782)
Dep Var Mean 21.789 1.224 7.818 9.547Bandwidth 189.912 231.675 257.836 372.755Observations 619 779 870 1213
Notes: Local linear regressions, triangular kernel; standard errors clusteredat the GP population level. *** p<0.01, ** p<0.05, * p<0.1
4.5 Ruling Out Alternative Explanations
To ensure that these results are not driven by either the change in council size or council reserva-tions, I repeat the above exercises for the population threshold 8000. The number of council seatsincreases discontinuously at the threshold 8000, while the number of seats reserved for womendoes not. Moreover, the samras grant does not change at this threshold. Therefore, discontinuityestimates at the threshold 8000 represent the effect of increasing council size alone. I find that thepattern of results documented at the threshold 5000 are not present at the threshold 8000. Thatis, it is likely that the samras grant is driving the reduction in political competition, change inpolitician identity and worsening of governance.
Estimates of the effect of council size on electoral competition are presented in Table A.3. Noneof the coefficients are statistically significant24 and the coefficient measuring the drop in the num-ber of candidates per seat is less than 0.1. Tables A.4 and A.5 present estimates of the effect of
24Table A.2 shows that this cannot be attributed to the fact that there are fewer observations around the threshold8000. Despite the smaller number of observations, we can strongly reject the hypothesis that the number of councilmembers does not increase at the threshold 8000.
23
council size on candidate and politician characteristics. None of the coefficients are statisticallysignificant, and the coefficient on age in particular is much smaller in magnitude than those foundat the threshold 5000.
Turning to measures of government performance, Table A.6 shows that the pattern of resultsfound at the threshold 5000 is not replicated. The impact of council size on overall and own fundexpenditure is negative but not significantly different from zero. Instead, the coefficient on totalincome is negative and statistically significant. The decrease in own fund income remains statis-tically indistinguishable from zero. Finally, Table A.7 presents estimates of the impact of councilsize on employment creation and targeting under NREGA. I find that an increase in council sizealone cannot explain the effects found at the threshold 5000, since none of the coefficients arestatistically significant and many are positive, which is the opposite of the effect documented atthe threshold 5000. Altogether, these results indicate that the reduction in political competition,crowding in of younger, more educated politicians and worsening of governance is due to theincrease in the consensus election grant.
5 Conclusion
This paper quantifies the impact of encouraging the selection of political representatives basedon community consensus, as opposed to a secret ballot election, on both the pool of candidatesand politicians that are eventually elected. It also examines the effects of politicians elected viacommunity consensus on multiple measures of governance. The analysis makes use of a noveldataset containing detailed information on candidates, politicians and government functioning atthe village level in the state of Gujarat in India for the period 2011-15.
To retrieve causal estimates, I exploit the existence of a population threshold at which financialincentives for consensus-based elections sharply increase. The results indicate that financial in-centives can induce village electorates to choose their political leaders without formal opposition.I also find that the reduction in competition crowds in younger, more educated candidates andpoliticians. Finally, I study four measures of governance over which the elected council exercisessubstantial influence, and find a significant reduction in total expenditure as well as an increasein how regressively workfare employment is targeted. These findings are consistent with the factthat politicians that rely on the support of local elites, who have a greater say in elections basedon community consensus, are not incentivized to appease the majority of village residents.
References
ACEMOGLU, DARON, & ROBINSON, JAMES A. 2008. Persistence of Power, Elites, and Institutions. American EconomicReview, 98(1), 267–93.
24
ACEMOGLU, DARON, REED, TRISTAN, & ROBINSON, JAMES A. 2014. Chiefs: Economic Development and Elite Controlof Civil Society in Sierra Leone. Journal of Political Economy, 122(2), 319–368.
AFRIDI, FARZANA, IVERSEN, VEGARD, & SHARAN, M.R. 2013. Women Political Leaders, Corruption and Learning: Evi-dence from a Large Public Program in India. IZA Discussion Papers 7212. Institute for the Study of Labor (IZA).
ALATAS, VIVI, BANERJEE, ABHIJIT, HANNA, REMA, OLKEN, BENJAMIN A., PURNAMASARI, RIRIN, & WAI-POI,MATTHEW. 2013 (February). Does Elite Capture Matter? Local Elites and Targeted Welfare Programs in Indonesia. WorkingPaper 18798. National Bureau of Economic Research.
BALAND, JEAN-MARIE, & ROBINSON, JAMES A. 2012. The Political Value of Land: Political Reform and Land Pricesin Chile. American Journal of Political Science, 56(3), 601–619.
BANDI, MADHUSUDAN. 2013. Samras in Gujarat Gram Panchayats: Threat to the Idea of Democracy?
BANERJEE, A., KUMAR, V. S., PANDE, R., & SU, F. 2011. Do Informed Voters Make Better Choices? ExperimentalEvidence from Urban India.
BANERJEE, ABHIJIT V, DUFLO, ESTHER, IMBERT, CLEMENT, & PANDE, ROHINI. 2017. Entry, Exit and Candidate Selec-tion: Evidence from India.
BARDHAN, PRANAB. 2002. Decentralization of Governance and Development. Journal of Economic Perspectives, 16(4),185–205.
BARDHAN, PRANAB, & MOOKHERJEE, DILIP. 2006. Decentralisation and Accountability in Infrastructure Delivery inDeveloping Countries*. The Economic Journal, 116(508), 101–127.
BEATH, ANDREW, CHRISTIA, FOTINI, & ENIKOLOPOV, RUBEN. 2013 (Jan.). Direct Democracy and Resource Allocation:Experimental Evidence from Afghanistan. Working Papers w0192. Center for Economic and Financial Research (CEFIR).
BESLEY, TIMOTHY, & COATE, STEPHEN. 1997. An Economic Model of Representative Democracy. The Quarterly Journalof Economics, 112(1), 85–114.
BESLEY, TIMOTHY, PANDE, ROHINI, RAHMAN, LUPIN, & RAO, VIJAYENDRA. 2004. The Politics of Public Good Provi-sion: Evidence from Indian Local Governments. Journal of the European Economic Association, 2(2-3), 416–426.
BESLEY, TIMOTHY, PANDE, ROHINI, & RAO, VIJAYENDRA. 2005. PARTICIPATORY DEMOCRACY IN ACTION: SUR-VEY EVIDENCE FROM SOUTH INDIA. Journal of the European Economic Association, 3(2-3), 648–657.
BESLEY, TIMOTHY, PERSSON, TORSTEN, & STURM, DANIEL M. 2010. Political Competition, Policy and Growth: Theoryand Evidence from the US. The Review of Economic Studies, 77(4), 1329.
BHATTACHARYA, ANINDYA, KAR, ANIRBAN, & NANDI, ALITA. 2016. Local Institutional Structure and ClientelistAccess to Employment: The Case of MGNREGS in Three States of India. Working Paper No. 269, Centre for DevelopmentEconomics, Delhi School of Economics.
BREMAN, JAN. 2011. From Exploitation to Protection? The Impact of the Social Security Bill (2008) for Informal SectorWorkers Report of a Field Study. Amsterdam Institute for Social Science Research (AISSR) Paper.
CAEYERS, BET, & DERCON, STEFAN. 2012. Political Connections and Social Networks in Targeted Transfer Programs:Evidence from Rural Ethiopia. Economic Development and Cultural Change, 60(4), 639–675.
25
CALONICO, SEBASTIAN, CATTANEO, MATIAS, & TITIUNIK, ROCIO. 2014. Robust Nonparametric Confidence Intervalsfor RegressionâDiscontinuity Designs. Econometrica, 82, 2295–2326.
CASELLI, FRANCESCO, & MORELLI, MASSIMO. 2004. Bad politicians. Journal of Public Economics, 88(3-4), 759–782.
CHATTOPADHYAY, RAGHABENDRA, & DUFLO, ESTHER. 2004. Women as Policy Makers: Evidence from a RandomizedPolicy Experiment in India. Econometrica, 72(5), 1409–1443.
DIERMEIER, DANIEL, KEANE, MICHAEL, & MERLO, ANTONIO. 2005. A Political Economy Model of CongressionalCareers. American Economic Review, 95(1), 347–373.
DUNNING, THAD, & NILEKANI, JANHAVI. 2013. Ethnic Quotas and Political Mobilization: Caste, Parties, and Distri-bution in Indian Village Councils. American Political Science Review, 107(2), 35–56.
FERRAZ, CLAUDIO, & FINAN, FREDERICO. 2009 (April). Motivating Politicians: The Impacts of Monetary Incentives onQuality and Performance. Working Paper 14906. National Bureau of Economic Research.
FRANDSEN, B. R. 2016. Party Bias in Union Representation Elections: Testing for Ma- nipulation in the RegressionDiscontinuity Design When the Running Variable is Discrete. Working Paper.
GANGULY, VARSHA. 2013. State’s Initiatives for Strengthening Local Governance and Impact on Women’s Developmentand Empowerment. mimeo, Institute of Rural Research and Development (IRRAD).
GUHA, ATULAN. 2014. Undermining Panchayati Raj Institutions in Gujarat. Economic Political Weekly, 49(May).
GUPTA, BHANU, & MUKHOPADHYAY, ABHIROOP. 2014. Local funds and political competition: Evidence from theNational Rural Employment Guarantee Scheme in India. ESID Working Paper 42.
HINNERICH, BJÖRN TYREFORS, & PETTERSSON-LIDBOM, PER. 2014. Democracy, Redistribution, and Political Partici-pation: Evidence From Sweden 1919–1938. Econometrica, 82(3), 961–993.
IMBERT, CLÉMENT, & PAPP, JOHN. 2015. Labor Market Effects of Social Programs: Evidence from India’s EmploymentGuarantee. American Economic Journal: Applied Economics, 7(2), 233–63.
INSTITUTE OF SOCIAL SCIENCES, . 2012. Panchayati Raj Update. XIX(January).
KEANE, MICHAEL P., & MERLO, ANTONIO. 2010. Money, Political Ambition, and the Career Decisions of Politicians.American Economic Journal: Microeconomics, 2(3), 186–215.
KHWAJA, ASIM IJAZ. 2004. Is Increasing Community Participation Always a Good Thing? Journal of the EuropeanEconomic Association, 2(2-3), 427–436.
LEE, DAVID S. 2008. Randomized Experiments from Non-random Selection in U.S. House Elections. Journal of Econo-metrics, 142(2), 675–697.
LIZZERI, ALESSANDRO, & PERSICO, NICOLA. 2005. A Drawback of Electoral Competition. Journal of the EuropeanEconomic Association, 3(6), 1318–1348.
MATTOZZI, ANDREA, & MERLO, ANTONIO. 2008. Political careers or career politicians? Journal of Public Economics,92(3-4), 597–608.
MCCRARY, JUSTIN. 2008. Manipulation of the running variable in the regression discontinuity design: A density test.Journal of Econometrics, 142(2), 698 – 714. The regression discontinuity design: Theory and applications.
26
OLKEN, BENJAMIN A. 2007. Monitoring Corruption: Evidence from a Field Experiment in Indonesia. Journal of PoliticalEconomy, 115(2), 200–249.
OLKEN, BENJAMIN A. 2008 (June). Direct Democracy and Local Public Goods: Evidence from a Field Experiment in Indonesia.Working Paper 14123. National Bureau of Economic Research.
OSBORNE, MARTIN, & SLIVINSKI, AL. 1996. A Model of Political Competition with Citizen-Candidates. The QuarterlyJournal of Economics, 111(1), 65–96.
PANDE, ROHINI. 2003. Can Mandated Political Representation Increase Policy Influence for Disadvantaged Minorities?Theory and Evidence from India. The American Economic Review, 93(4), 1132–1151.
PETTERSSON-LIDBOM, PER. 2012. Does the size of the legislature affect the size of government? Evidence from twonatural experiments. Journal of Public Economics, 96(3), 269–278.
POWLEY, E. 2007. Rwanda: The Impact of Women Legislators on Policy Outcomes Affecting Children and Families. In:Background Paper. State of the World’s Children.
RAJARAMAN, I., & GUPTA, M. 2012. Public expenditure choices and gender quotas. Indian Growth and DevelopmentReview, 5(2): 108-130.
RAO, VIJAYENDRA, & IBÁÑEZ, ANA MARÍA. 2005. The Social Impact of Social Funds in Jamaica: A ‘ParticipatoryEconometric’ Analysis of Targeting, Collective Action, and Participation in Community-Driven Development. TheJournal of Development Studies, 41(5), 788–838.
WASHINGTON, EBONYA L. 2008. Female Socialization: How Daughters Affect Their Legislator Fathers’ Voting onWomen’s Issues. The American Economic Review, 98(1), 311–332.
27

Appendix
28
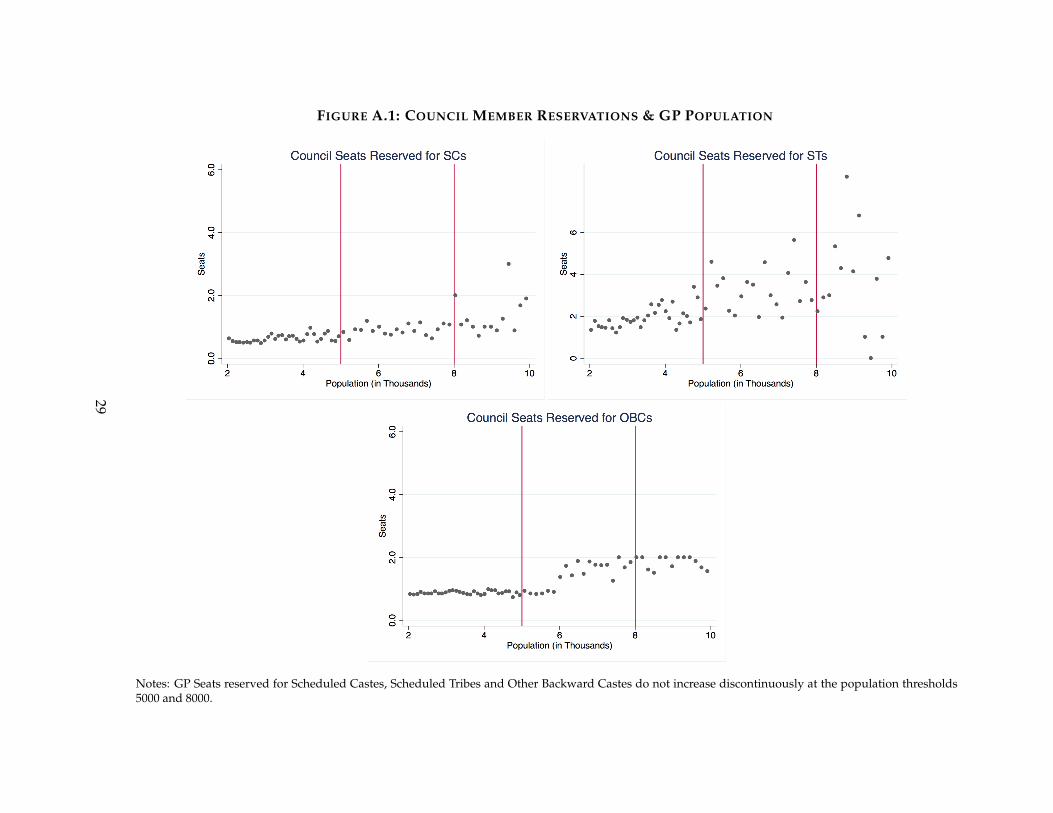
FIGURE A.1: COUNCIL MEMBER RESERVATIONS & GP POPULATION
Notes: GP Seats reserved for Scheduled Castes, Scheduled Tribes and Other Backward Castes do not increase discontinuously at the population thresholds5000 and 8000.
29
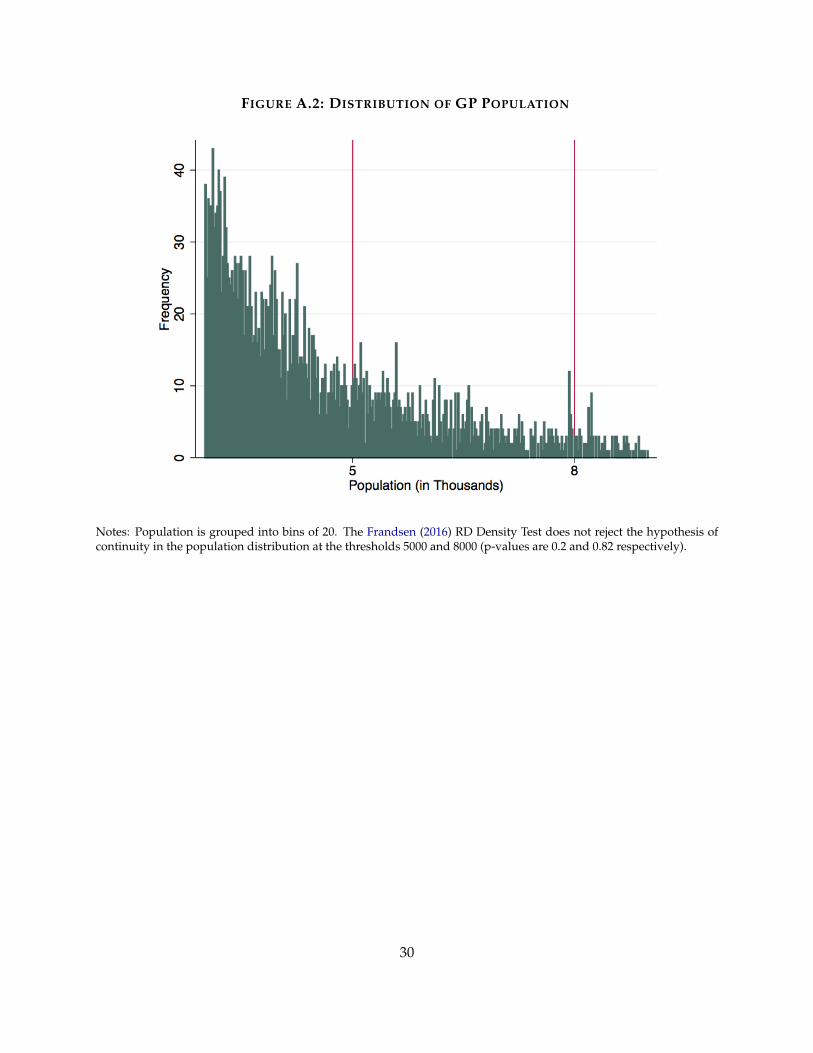
FIGURE A.2: DISTRIBUTION OF GP POPULATION
Notes: Population is grouped into bins of 20. The Frandsen (2016) RD Density Test does not reject the hypothesis ofcontinuity in the population distribution at the thresholds 5000 and 8000 (p-values are 0.2 and 0.82 respectively).
30
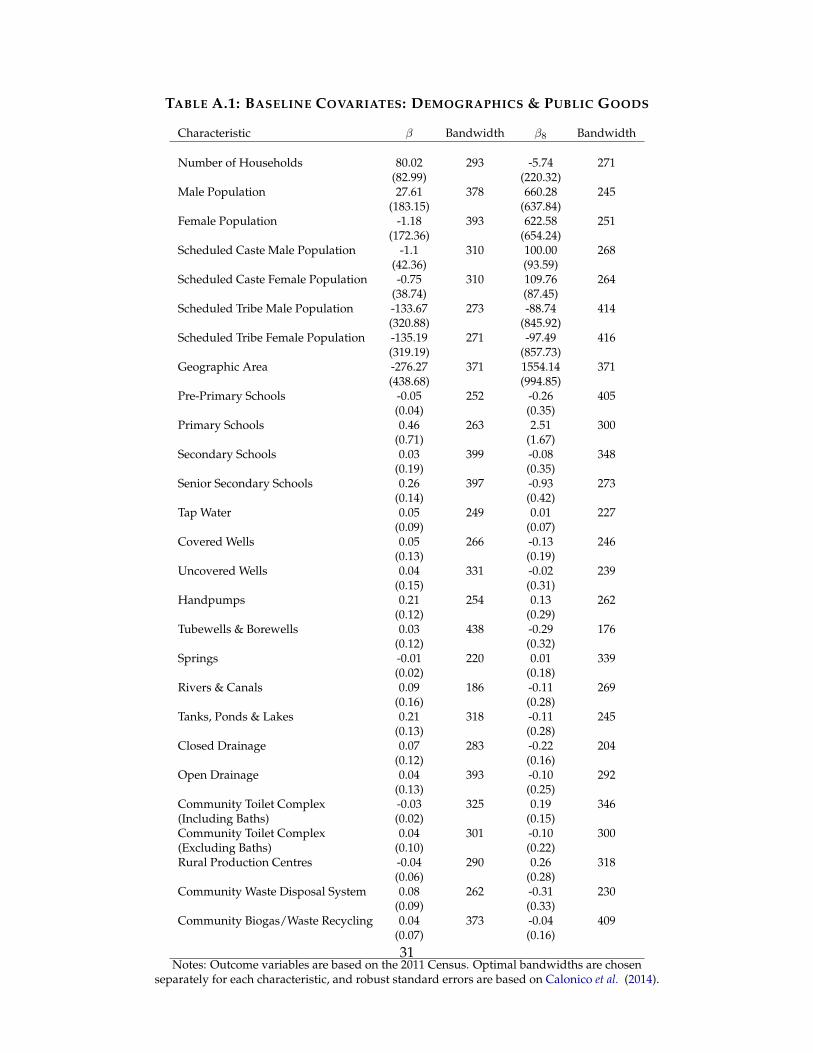
TABLE A.1: BASELINE COVARIATES: DEMOGRAPHICS & PUBLIC GOODS
Characteristic β Bandwidth β8 Bandwidth
Number of Households 80.02 293 -5.74 271(82.99) (220.32)
Male Population 27.61 378 660.28 245(183.15) (637.84)
Female Population -1.18 393 622.58 251(172.36) (654.24)
Scheduled Caste Male Population -1.1 310 100.00 268(42.36) (93.59)
Scheduled Caste Female Population -0.75 310 109.76 264(38.74) (87.45)
Scheduled Tribe Male Population -133.67 273 -88.74 414(320.88) (845.92)
Scheduled Tribe Female Population -135.19 271 -97.49 416(319.19) (857.73)
Geographic Area -276.27 371 1554.14 371(438.68) (994.85)
Pre-Primary Schools -0.05 252 -0.26 405(0.04) (0.35)
Primary Schools 0.46 263 2.51 300(0.71) (1.67)
Secondary Schools 0.03 399 -0.08 348(0.19) (0.35)
Senior Secondary Schools 0.26 397 -0.93 273(0.14) (0.42)
Tap Water 0.05 249 0.01 227(0.09) (0.07)
Covered Wells 0.05 266 -0.13 246(0.13) (0.19)
Uncovered Wells 0.04 331 -0.02 239(0.15) (0.31)
Handpumps 0.21 254 0.13 262(0.12) (0.29)
Tubewells & Borewells 0.03 438 -0.29 176(0.12) (0.32)
Springs -0.01 220 0.01 339(0.02) (0.18)
Rivers & Canals 0.09 186 -0.11 269(0.16) (0.28)
Tanks, Ponds & Lakes 0.21 318 -0.11 245(0.13) (0.28)
Closed Drainage 0.07 283 -0.22 204(0.12) (0.16)
Open Drainage 0.04 393 -0.10 292(0.13) (0.25)
Community Toilet Complex -0.03 325 0.19 346(Including Baths) (0.02) (0.15)Community Toilet Complex 0.04 301 -0.10 300(Excluding Baths) (0.10) (0.22)Rural Production Centres -0.04 290 0.26 318
(0.06) (0.28)Community Waste Disposal System 0.08 262 -0.31 230
(0.09) (0.33)Community Biogas/Waste Recycling 0.04 373 -0.04 409
(0.07) (0.16)
Notes: Outcome variables are based on the 2011 Census. Optimal bandwidths are chosenseparately for each characteristic, and robust standard errors are based on Calonico et al. (2014).
31
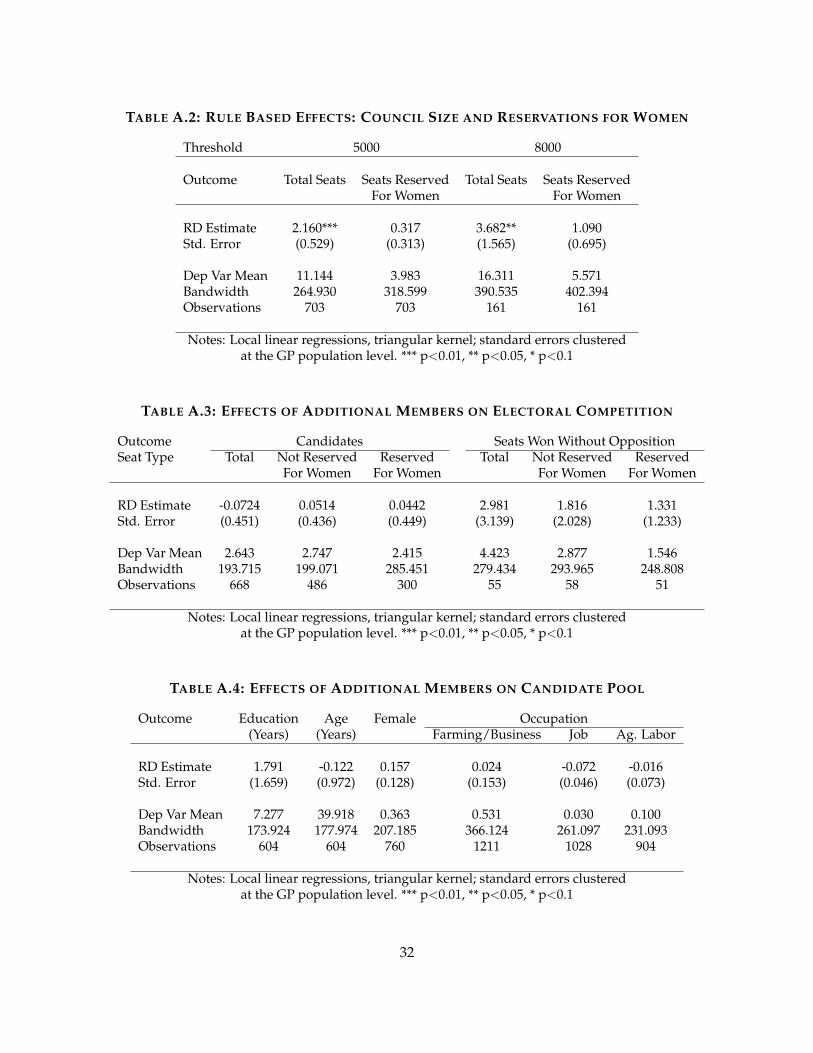
TABLE A.2: RULE BASED EFFECTS: COUNCIL SIZE AND RESERVATIONS FOR WOMEN
Threshold 5000 8000
Outcome Total Seats Seats Reserved Total Seats Seats ReservedFor Women For Women
RD Estimate 2.160*** 0.317 3.682** 1.090Std. Error (0.529) (0.313) (1.565) (0.695)
Dep Var Mean 11.144 3.983 16.311 5.571Bandwidth 264.930 318.599 390.535 402.394Observations 703 703 161 161
Notes: Local linear regressions, triangular kernel; standard errors clusteredat the GP population level. *** p<0.01, ** p<0.05, * p<0.1
TABLE A.3: EFFECTS OF ADDITIONAL MEMBERS ON ELECTORAL COMPETITION
Outcome Candidates Seats Won Without OppositionSeat Type Total Not Reserved Reserved Total Not Reserved Reserved
For Women For Women For Women For Women
RD Estimate -0.0724 0.0514 0.0442 2.981 1.816 1.331Std. Error (0.451) (0.436) (0.449) (3.139) (2.028) (1.233)
Dep Var Mean 2.643 2.747 2.415 4.423 2.877 1.546Bandwidth 193.715 199.071 285.451 279.434 293.965 248.808Observations 668 486 300 55 58 51
Notes: Local linear regressions, triangular kernel; standard errors clusteredat the GP population level. *** p<0.01, ** p<0.05, * p<0.1
TABLE A.4: EFFECTS OF ADDITIONAL MEMBERS ON CANDIDATE POOL
Outcome Education Age Female Occupation(Years) (Years) Farming/Business Job Ag. Labor
RD Estimate 1.791 -0.122 0.157 0.024 -0.072 -0.016Std. Error (1.659) (0.972) (0.128) (0.153) (0.046) (0.073)
Dep Var Mean 7.277 39.918 0.363 0.531 0.030 0.100Bandwidth 173.924 177.974 207.185 366.124 261.097 231.093Observations 604 604 760 1211 1028 904
Notes: Local linear regressions, triangular kernel; standard errors clusteredat the GP population level. *** p<0.01, ** p<0.05, * p<0.1
32
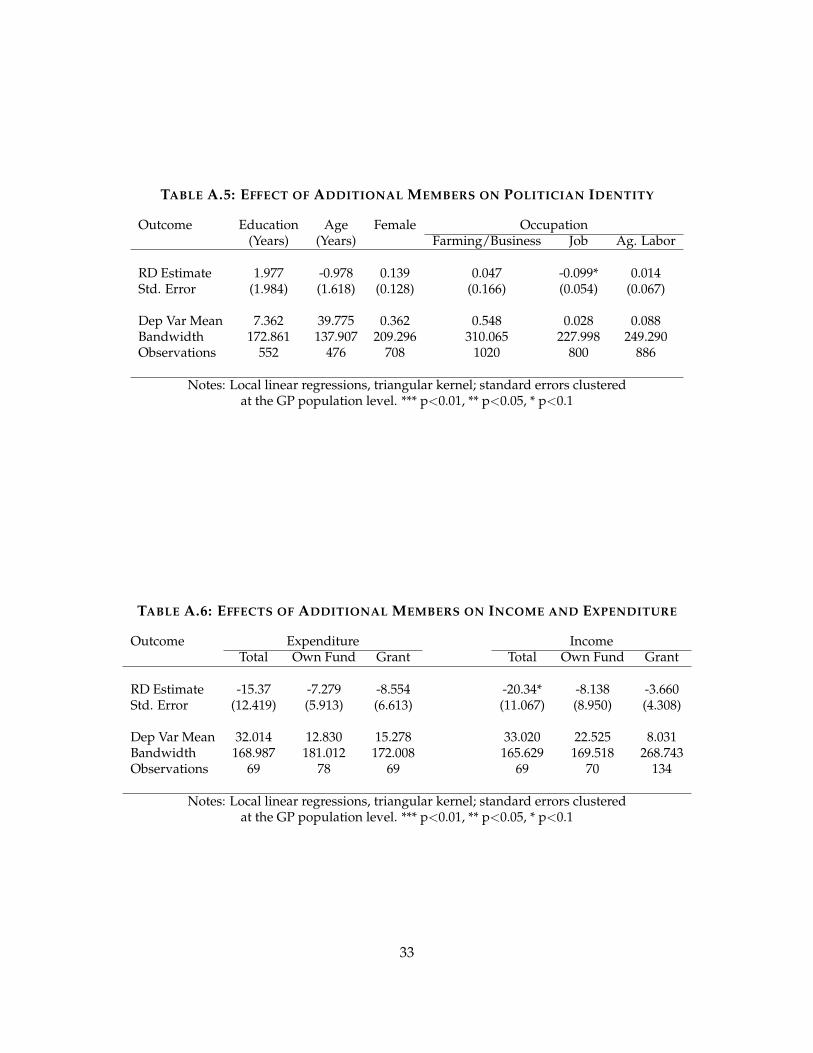
TABLE A.5: EFFECT OF ADDITIONAL MEMBERS ON POLITICIAN IDENTITY
Outcome Education Age Female Occupation(Years) (Years) Farming/Business Job Ag. Labor
RD Estimate 1.977 -0.978 0.139 0.047 -0.099* 0.014Std. Error (1.984) (1.618) (0.128) (0.166) (0.054) (0.067)
Dep Var Mean 7.362 39.775 0.362 0.548 0.028 0.088Bandwidth 172.861 137.907 209.296 310.065 227.998 249.290Observations 552 476 708 1020 800 886
Notes: Local linear regressions, triangular kernel; standard errors clusteredat the GP population level. *** p<0.01, ** p<0.05, * p<0.1
TABLE A.6: EFFECTS OF ADDITIONAL MEMBERS ON INCOME AND EXPENDITURE
Outcome Expenditure IncomeTotal Own Fund Grant Total Own Fund Grant
RD Estimate -15.37 -7.279 -8.554 -20.34* -8.138 -3.660Std. Error (12.419) (5.913) (6.613) (11.067) (8.950) (4.308)
Dep Var Mean 32.014 12.830 15.278 33.020 22.525 8.031Bandwidth 168.987 181.012 172.008 165.629 169.518 268.743Observations 69 78 69 69 70 134
Notes: Local linear regressions, triangular kernel; standard errors clusteredat the GP population level. *** p<0.01, ** p<0.05, * p<0.1
33
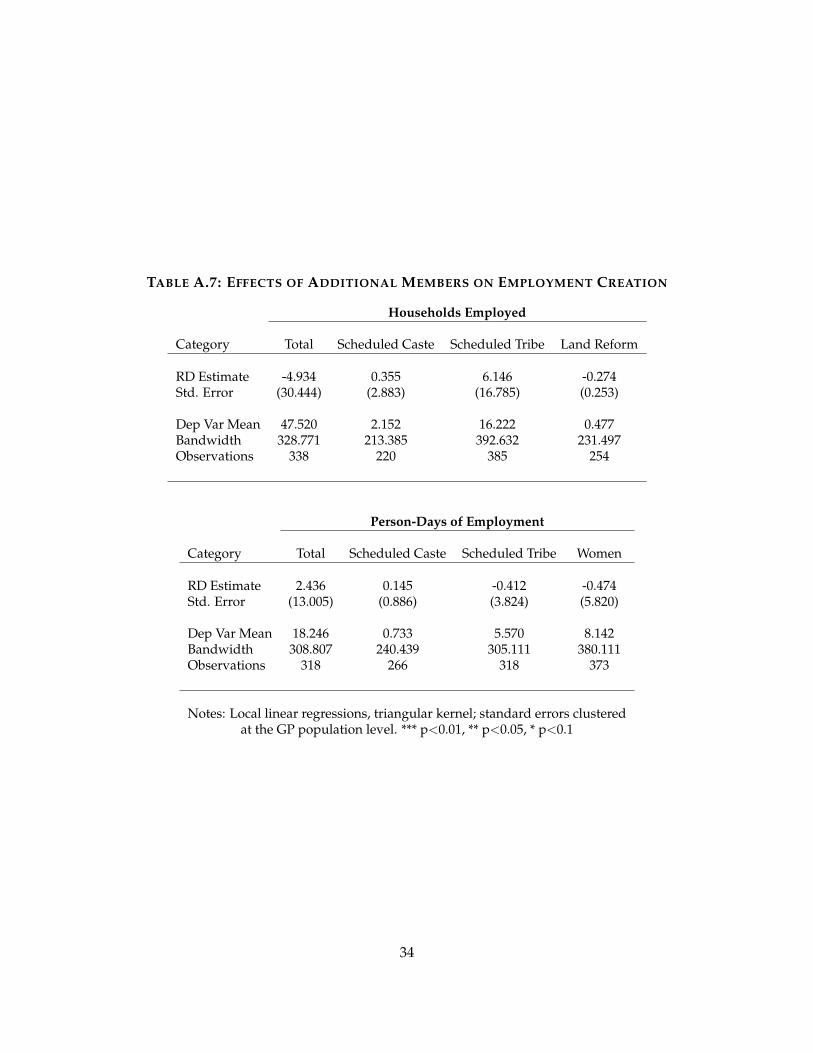
TABLE A.7: EFFECTS OF ADDITIONAL MEMBERS ON EMPLOYMENT CREATION
Households Employed
Category Total Scheduled Caste Scheduled Tribe Land Reform
RD Estimate -4.934 0.355 6.146 -0.274Std. Error (30.444) (2.883) (16.785) (0.253)
Dep Var Mean 47.520 2.152 16.222 0.477Bandwidth 328.771 213.385 392.632 231.497Observations 338 220 385 254
Person-Days of Employment
Category Total Scheduled Caste Scheduled Tribe Women
RD Estimate 2.436 0.145 -0.412 -0.474Std. Error (13.005) (0.886) (3.824) (5.820)
Dep Var Mean 18.246 0.733 5.570 8.142Bandwidth 308.807 240.439 305.111 380.111Observations 318 266 318 373
Notes: Local linear regressions, triangular kernel; standard errors clusteredat the GP population level. *** p<0.01, ** p<0.05, * p<0.1
34