electric vehicle penetration and its impact on …
TRANSCRIPT
BY MARIANNE KAHDECEMBER 2019
ELECTRIC VEHICLE PENETRATION AND ITS IMPACT ON GLOBAL OIL DEMAND: A SURVEY OF 2019 FORECAST TRENDS
ABOUT THE CENTER ON GLOBAL ENERGY POLICY
The Center on Global Energy Policy provides independent, balanced, data-driven analysis to help policymakers navigate the complex world of energy. We approach energy as an economic, security, and environmental concern. And we draw on the resources of a world-class institution, faculty with real-world experience, and a location in the world’s finance and media capital. Visit us at www.energypolicy.columbia.edu
@ColumbiaUenergy
ABOUT THE SCHOOL OF INTERNATIONAL AND PUBLIC AFFAIRS
SIPA’s mission is to empower people to serve the global public interest. Our goal is to foster economic growth, sustainable development, social progress, and democratic governance by educating public policy professionals, producing policy-related research, and conveying the results to the world. Based in New York City, with a student body that is 50 percent international and educational partners in cities around the world, SIPA is the most global of public policy schools.
For more information, please visit www.sipa.columbia.edu
ELECTRIC VEHICLE PENETRATION AND ITS IMPACT ON GLOBAL OIL DEMAND: A SURVEY OF 2019 FORECAST TRENDS
BY MARIANNE KAHDECEMBER 2019
1255 Amsterdam Ave New York NY 10027
www.energypolicy.columbia.edu
@ColumbiaUenergy
ELECTRIC VEHICLE PENETRATION AND ITS IMPACT ON GLOBAL OIL DEMAND: A SURVEY OF 2019 FORECAST TRENDS
ENERGYPOLICY.COLUMBIA.EDU | DECEMBER 2019 | 3
Marianne Kah is an Adjunct Senior Research Scholar and Advisory Board member at the Center on Global Energy Policy (CGEP). Before joining CGEP, Ms. Kah worked as the Chief Economist of ConocoPhillips for 25 years. Previously, she was the Manager of Corporate Planning at Cabot Corporation and a Coordinator of Strategic Planning at Conoco. In the early 1980s, Ms. Kah was a Senior Analyst in the Policy Development Group of the Synthetic Fuels Corporation in Washington, D.C. Prior to that she was a Policy Analyst at the Energy and Minerals Division of the Government Accountability Office. She is currently the President of the U.S. Association for Energy Economics and is co-chairing the Energy Roundtable for the National Association for Business Economics. She is also an independent director of PGS and ATI.
This work was made possible by support from the Center on Global Energy Policy. More information is available at https://energypolicy.columbia.edu/about/partners.
ABOUT THE AUTHOR
ACKNOWLEDGEMENTS
ELECTRIC VEHICLE PENETRATION AND ITS IMPACT ON GLOBAL OIL DEMAND: A SURVEY OF 2019 FORECAST TRENDS
4 | CENTER ON GLOBAL ENERGY POLICY | COLUMBIA SIPA
Introduction
About This Study
Rationale for Studying the Passenger Vehicle Sector
Summary
Methodology
Underlying Drivers of Global Oil Demand Growth: Global Population and Economic Growth
Global Population Growth
Global Economic Growth
EV Penetration
EV Penetration of New Car Sales
EV Sales in 2019 versus 2018 Survey
EV Penetration in the Global Auto Fleet
Regional Views of EV Fleets
EV Share of VMT
Battery EVs versus Plug-In Hybrid Vehicles
Battery Cost
Fuel Efficiency Improvement in Internal Combustion Engine Cars
Forecasts of Global Passenger Sector Oil Demand
Notes
TABLE OF CONTENTS
05
05
05
07
10
11
11
12
14
14
15
16
17
18
20
21
22
23
27
TABLE OF CONTENTS

ELECTRIC VEHICLE PENETRATION AND ITS IMPACT ON GLOBAL OIL DEMAND: A SURVEY OF 2019 FORECAST TRENDS
ENERGYPOLICY.COLUMBIA.EDU | DECEMBER 2019 | 5
About This Study
Columbia University’s Center for Global Energy Policy is undertaking a multiyear study on the prospects for and timing of peak oil demand. An essential piece of the puzzle is understanding what happens to global oil demand in the passenger vehicle sector, since it is the sector with the largest oil demand use today. Policy makers in a growing number of countries are supporting passenger vehicle electrification or a phaseout of fossil fuel passenger vehicles to reduce greenhouse gas emissions and improve urban air quality. To understand the trajectory of oil demand in this sector, it is important to comprehend the magnitude and timing of electric vehicle (EV) penetration.
The pace of demand growth matters. If the world doesn’t move off oil at a rapid rate, it is important that policy makers recognize the need for investment in new oil supplies to prevent supply shortages and accompanying oil price spikes.
Numerous studies analyzing the impact of EVs on oil demand have been published. It is difficult to compare these studies because they do not define the passenger vehicle sector the same way or provide underlying assumptions on a comparable basis. Last year, the author conducted a survey of all available global electric passenger vehicle penetration forecasts to compare underlying assumptions and the impact on oil demand. The author conducted a similar survey in 2019 to understand how views on EV penetration are changing. This report describes the results from the 2019 survey and indicates how views have changed since last year.
Rationale for Studying the Passenger Vehicle Sector
As shown in figure 1, the passenger vehicle sector is the largest sector of oil use, representing about one-quarter of the oil demand barrel. The passenger vehicle sector is a target for policy makers because full penetration of EVs could ultimately take nearly 25 million barrels per day of oil use out of the market. However, it is important to understand the other 75 percent of the oil demand barrel before assessing the prospects of peak oil demand. It should be noted that the passenger vehicle sector gets a disproportionate amount of attention from policy makers and the media because of the current focus on electrification and the greater ease of electrifying passenger cars versus other modes of transportation. For example, it is easier to electrify a passenger car than a heavy-duty truck, where the large and costly batteries required will reduce cargo carrying capacity due to weight limits on roads. It is also more challenging to electrify airplanes than passenger cars.
INTRODUCTION

ELECTRIC VEHICLE PENETRATION AND ITS IMPACT ON GLOBAL OIL DEMAND: A SURVEY OF 2019 FORECAST TRENDS
6 | CENTER ON GLOBAL ENERGY POLICY | COLUMBIA SIPA
Figure 1: Global oil demand percentages by sector
Source: International Energy Agency, 2018 World Energy Outlook, New Policies scenario. Other includes biofuels.Note: 95 million barrels per day in total (2017)
Figure 2 shows the International Energy Agency’s reference case global oil demand growth forecast. It indicates that little growth in oil demand is expected in the passenger vehicle sector even without rapid penetration of EVs. The lack of growth is primarily due to fuel efficiency improvements with the expected growth in developing nations offset by a decline in industrialized nations. The large growth sectors are shown to be trucks, aviation and shipping, and petrochemicals.
Figure 2: World oil demand growth by sector: 2017 to 2040
Source: International Energy Agency, 2018 World Energy Outlook, New Policies scenario. Other includes biofuels.

ELECTRIC VEHICLE PENETRATION AND ITS IMPACT ON GLOBAL OIL DEMAND: A SURVEY OF 2019 FORECAST TRENDS
ENERGYPOLICY.COLUMBIA.EDU | DECEMBER 2019 | 7
This report summarizes the results of the 2019 survey of global electric passenger vehicle penetration and compares them with the results from the 2018 survey. The author observed many of the same trends in the 2018 and 2019 surveys. None of the passenger vehicle forecasts projected much oil demand growth over the next 25 years, and the low carbon scenarios showed a considerable decline in demand beyond 2030.
There were some significant differences between the 2019 and 2018 surveys. Forecasts this year were less optimistic about the pace of electrification than the 2018 survey, due in part to weaker economic projections resulting in fewer new vehicles sold, weaker US policy drivers, and less optimistic views about when battery costs will fall to a level that competes without subsidy to the internal combustion engine. There is an even greater dichotomy of views of EV penetration in this year’s survey between those forecasts that have a rapid transition to a low carbon world and those that do not. Despite less rapid EV penetration, passenger vehicle oil demand forecasts were moderately lower than in last year’s survey, probably due to lower projected economic growth rates and EVs becoming responsible for a greater percentage of miles driven consistent with the concept of using EVs in automated ride-hailing services.
The main findings of the report on a global basis (except where noted) are reported below:
● Underlying drivers—Population and global economic growth are important drivers of passenger vehicle oil demand. Since their growth rates are declining over time, you would expect passenger vehicle oil demand growth to decline over time, even without significant penetration of EVs.
● Population growth—Some projections use a lower population growth forecast than the UN median case. That will result in lower vehicle purchases and miles driven and thus lower oil demand even before EV penetration is taken into account.
● Economic growth—Comparing the 2019 and 2018 surveys identified significant uncertainty about economic growth rates. More than half the forecasts lowered assumptions for global economic growth, while the others raised their assumptions for economic growth. However, a number of forecasts lowered long-term economic growth assumptions for developing countries specifically. That would have a disproportionately negative impact on oil demand since developing countries have most of the projected passenger vehicle oil demand growth.
● EV sales—Two-thirds of surveyed entities reduced sales of EVs in both the short and long term versus last year’s survey. The main reasons given were slower economic growth, which reduced all new car sales, including EVs, and US federal government policy becoming more negative toward EVs and automotive fuel efficiency improvements. Another reason for slower penetration is the later timing shown in this year’s survey of when battery costs fall to a competitive level with the internal combustion engine.
SUMMARY
ELECTRIC VEHICLE PENETRATION AND ITS IMPACT ON GLOBAL OIL DEMAND: A SURVEY OF 2019 FORECAST TRENDS
8 | CENTER ON GLOBAL ENERGY POLICY | COLUMBIA SIPA
● EVs in the fleet—EV share of the global passenger vehicle fleet is not projected to be substantial before 2030 given the long lead time in turning over the global automobile fleet. There is a greater divergence of views in this year’s survey versus last year’s on EVs’ market share of the global auto fleet. For example, in this year’s survey, the range of EVs in the 2040 fleet is 10 percent to 70 percent. Last year the range was from 15 percent to 60 percent. The lower carbon forecasts also had a lower overall automobile fleet size, which also gave EVs a larger market share in the global passenger vehicle pool.
● Battery cost—In both this and last year’s survey, the median timing of battery pack costs reaching $100/kWh (from an estimated $175–$200/kWh today) to become competitive with the internal combustion engine without government subsidy is 2025. However, in this year’s survey, the low carbon forecasts delayed the timing of when battery pack cost would fall to $100/kWh. In last year’s survey, a number of low carbon forecasts pegged the $100/kWh timing at 2020–2022, while in this year’s survey, the earliest low carbon forecast is timed at 2023. Possible explanations for the delay could be the periodic rise in battery metals costs when battery production is ramped up and technology breakthroughs taking longer than previously expected.
● Vehicle miles traveled (VMT)—VMT is a large driver of passenger vehicle oil demand, along with how many of those miles are driven by EVs. Ride hailing and the potential development of autonomous taxi services are likely to increase miles traveled by making it more convenient and reducing the cost of travel. This would greatly increase oil demand unless these vehicles are EVs. In the low carbon projections submitted, 40 percent to 70 percent of VMT was driven by EVs in 2040. Even the lowest EV share forecast has EVs driving 15 percent of VMT in 2040.
● Passenger vehicle oil demand—Through 2025, passenger vehicle oil demand is generally projected to be either flat or growing. Beyond 2025, most of the forecasts show passenger vehicle oil demand declining with no available forecasts showing growth. In the lowest low carbon scenario, oil demand in this sector would decline from about 25 million barrels per day today to 10 million barrels per day in 2040 Passenger vehicle oil demand forecasts were moderately lower in the 2019 survey than the 2018 survey. That was surprising given the lower projections of EV penetration. A likely explanation is the lower economic growth in developing nations, which limits vehicle purchases and miles traveled. Another possible explanation is that this year’s survey expects a greater number of miles traveled to be driven by EVs.
● Total oil demand—Even if passenger vehicle oil demand were to decline by 2040, it doesn’t necessarily mean that total oil demand will decline because of the growth expected in sectors that are more challenging to electrify or find substitutes (e.g., truck, air, marine, petrochemicals). Through 2025, projections show flat or rising total oil demand. The average of all the forecasts indicates that total oil demand could grow slightly through 2030–2035 and decline modestly thereafter. However, there is more downside than upside risk to oil demand throughout the projection period due to the possibility of a policy-driven transition to a lower carbon world. There is still a

ELECTRIC VEHICLE PENETRATION AND ITS IMPACT ON GLOBAL OIL DEMAND: A SURVEY OF 2019 FORECAST TRENDS
ENERGYPOLICY.COLUMBIA.EDU | DECEMBER 2019 | 9
sharp contrast between total oil demand and oil demand in the passenger sector that only has downside risk during this time period. It is important to remember that even without any oil demand growth, investment in new oil supplies would still be needed to offset the expected decline in existing production.
The remainder of the report provides the details for all aspects of EV drivers and penetration and oil demand covered by the survey.

ELECTRIC VEHICLE PENETRATION AND ITS IMPACT ON GLOBAL OIL DEMAND: A SURVEY OF 2019 FORECAST TRENDS
10 | CENTER ON GLOBAL ENERGY POLICY | COLUMBIA SIPA
To compare global passenger vehicle oil demand forecasts more consistently, a survey of 17 forecasts was conducted at the end of the second quarter of 2019. The author collected key EV penetration and oil demand results along with their underlying assumptions. The surveyed entities represent governments, think tanks, consultants, investment banks, and oil companies.
Since unpublished data was collected, it was agreed that sources would not be disclosed. The charts in the report will identify the type of forecaster (e.g., government, oil company, other) and whether the forecast was intended to be a “low carbon” forecast. In some cases, it is not clear whether the low carbon forecast is an actual forecast or a back cast of what would need to happen to achieve a 1.5- to 2-degree carbon trajectory.
The forecasters in this survey did not provide information on the assumptions around their low carbon scenarios. In several of these low carbon scenarios that are published, the assumption is that the CO2 emissions trajectory to 2040 is consistent with a long-term global average temperature rise of 1.7–1.8°C above preindustrial levels. In the case of another scenario that was published, the forecaster indicated that emissions would not fall sufficiently by 2050 to bring global warming to well below 2°C. The “low carbon” forecasts were not consistent in their targeted temperature or the timing in which they achieved their targets. Given that this data wasn’t collected in the survey this year or last year, it is not possible to compare climate assumptions from year to year. However, in one case where those assumptions were published in a broader energy forecast, the climate target strengthened from 2 degrees in 2018 to 1.7–1.8 degrees in 2019.
A few forecasters submitted multiple scenarios, with a number of them submitting low carbon scenarios. Since these scenarios require a sharp reduction in passenger vehicle oil demand but aren’t necessarily the forecaster’s base case, they have been identified separately in this report. These scenarios could have been developed by governments, oil companies, or other forecasters.
The trends shown in this study should be viewed as directional and not statistically significant due to the relatively small sample size of comparable forecasts from year to year. The trends are also more important than the absolute numbers because there were different base values in some of the forecast variables. This primarily resulted from slightly different definitions of light duty vehicles and the use of different conversion factors in the different studies. Some of the forecasters were unable to provide data in the exact form that was requested. There were also differences in the methodologies for calculating purchasing power parity in the gross domestic product (GDP) growth estimates and forecasts.
METHODOLOGY

ELECTRIC VEHICLE PENETRATION AND ITS IMPACT ON GLOBAL OIL DEMAND: A SURVEY OF 2019 FORECAST TRENDS
ENERGYPOLICY.COLUMBIA.EDU | DECEMBER 2019 | 11
Presented here are two underlying drivers of passenger vehicle oil demand that can have a large impact on demand even without EV penetration. They are world population and economic growth.
Global Population Growth
Figure 3 shows various forecasts used for population growth by the surveyed entities along with the United Nations’ medium variant projection. If there are only circles, it means that forecasts were provided for every five years instead of every year.
Figure 3: Forecasts of global population growth in the 2019 survey
Source: CGEP survey and analysis
All of the projections indicate a downward trend in global population growth rates as a result of reduced fertility rates from rising urbanization and education levels. Declining growth in population will slow the rate of economic growth, which in turn will reduce vehicle purchases and travel along with passenger sector oil demand growth.
Several of the population forecasts used lower growth rates than the United Nations’ “medium variant” projection. In fact, one of the low carbon forecasts used a population growth
UNDERLYING DRIVERS OF GLOBAL OIL DEMAND GROWTH: GLOBAL POPULATION AND ECONOMIC GROWTH
ELECTRIC VEHICLE PENETRATION AND ITS IMPACT ON GLOBAL OIL DEMAND: A SURVEY OF 2019 FORECAST TRENDS
12 | CENTER ON GLOBAL ENERGY POLICY | COLUMBIA SIPA
assumption that was similar to the United Nations’ “constant mortality” case (no further lowering of the mortality rate). The economic growth and oil demand impacts of this low carbon projection will be greater than would be required by the transition to a low carbon transportation sector due to its low population growth assumption.
Global Economic Growth
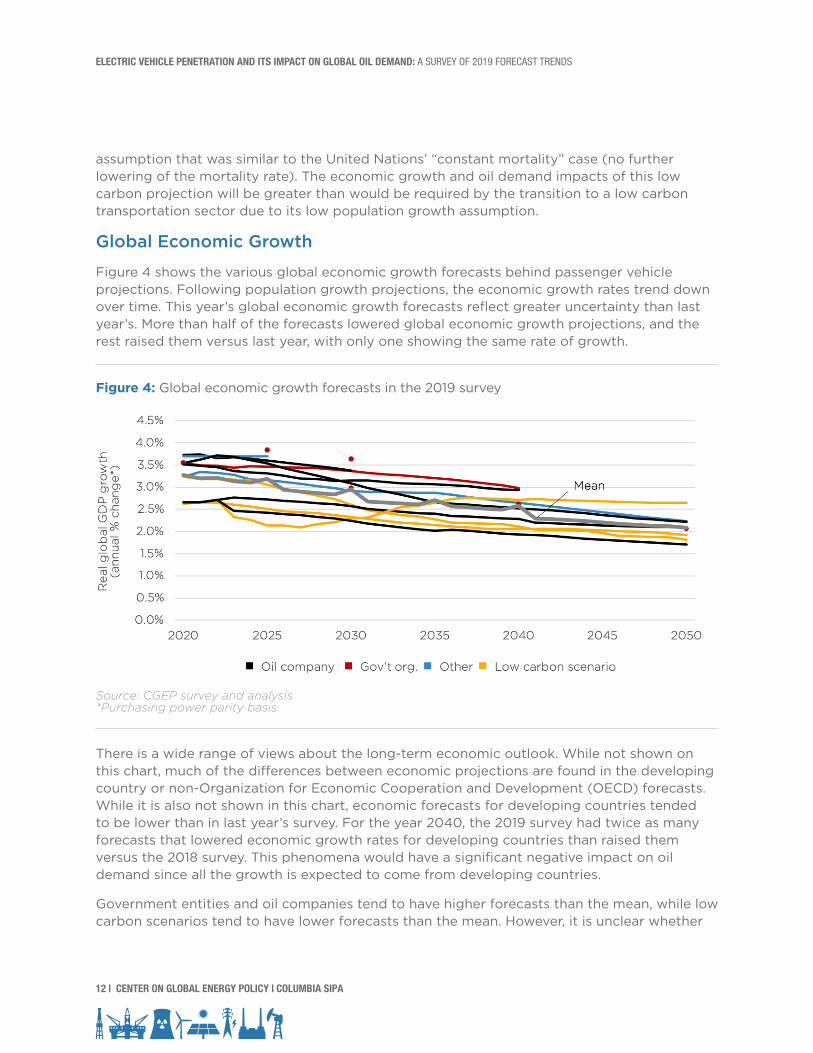
Figure 4 shows the various global economic growth forecasts behind passenger vehicle projections. Following population growth projections, the economic growth rates trend down over time. This year’s global economic growth forecasts reflect greater uncertainty than last year’s. More than half of the forecasts lowered global economic growth projections, and the rest raised them versus last year, with only one showing the same rate of growth.
Figure 4: Global economic growth forecasts in the 2019 survey
Source: CGEP survey and analysis *Purchasing power parity basis
There is a wide range of views about the long-term economic outlook. While not shown on this chart, much of the differences between economic projections are found in the developing country or non-Organization for Economic Cooperation and Development (OECD) forecasts. While it is also not shown in this chart, economic forecasts for developing countries tended to be lower than in last year’s survey. For the year 2040, the 2019 survey had twice as many forecasts that lowered economic growth rates for developing countries than raised them versus the 2018 survey. This phenomena would have a significant negative impact on oil demand since all the growth is expected to come from developing countries.
Government entities and oil companies tend to have higher forecasts than the mean, while low carbon scenarios tend to have lower forecasts than the mean. However, it is unclear whether

ELECTRIC VEHICLE PENETRATION AND ITS IMPACT ON GLOBAL OIL DEMAND: A SURVEY OF 2019 FORECAST TRENDS
ENERGYPOLICY.COLUMBIA.EDU | DECEMBER 2019 | 13
the lower carbon forecasts have lower economic growth as a result of actions taken to reduce greenhouse gas emissions or the adverse impacts of climate change or whether their starting point was a lower economic growth trajectory for other reasons. In addition, some forecasters do not vary economic growth rates across their scenarios whether or not the scenario depicts a low carbon transition.
The variations between the forecasts of global GDP growth rates will have a large impact on global energy and total oil demand. For example, there is a 1.5 percentage point difference between the lowest and highest forecasts, which could amount to over 1 million barrels per day of oil demand growth difference per year.
ELECTRIC VEHICLE PENETRATION AND ITS IMPACT ON GLOBAL OIL DEMAND: A SURVEY OF 2019 FORECAST TRENDS
14 | CENTER ON GLOBAL ENERGY POLICY | COLUMBIA SIPA
The outlook for global EV penetration in the passenger vehicle sector remains highly uncertain. While battery pack costs have declined considerably, they are still significantly above the $100/kWh level required to be competitive with cars powered by an internal combustion engine. Rising costs of critical battery metals (e.g., cobalt, nickel) as EVs penetrate will make it more difficult for battery costs to fall to a competitive level.
Some countries, like China, have strong policy drivers, and a number of countries and cities, particularly in Europe, are banning the use of fossil fuel–powered vehicles by a certain date. Even with strong policy drivers, how rapidly consumers will adopt EVs is uncertain. In Norway, EVs are more than 50 percent of new car sales this year due to strong policy drivers. Some consumers in countries with less aggressive policy drivers will adopt EVs due to the ability to charge their cars at home overnight, the environmental benefits, the quietness of the ride, and the rapid acceleration of EVs. Other consumers will be concerned about EVs’ more limited range versus conventional vehicles, greater charging than refueling time, and dearth of charging stations versus gasoline stations. It is also possible that some consumers may not accept government policies that raise their vehicle costs, similar to what was observed with the fuel tax hike that triggered the mouvement des gilets jaunes (yellow vests movement) in France.
EV Penetration of New Car Sales
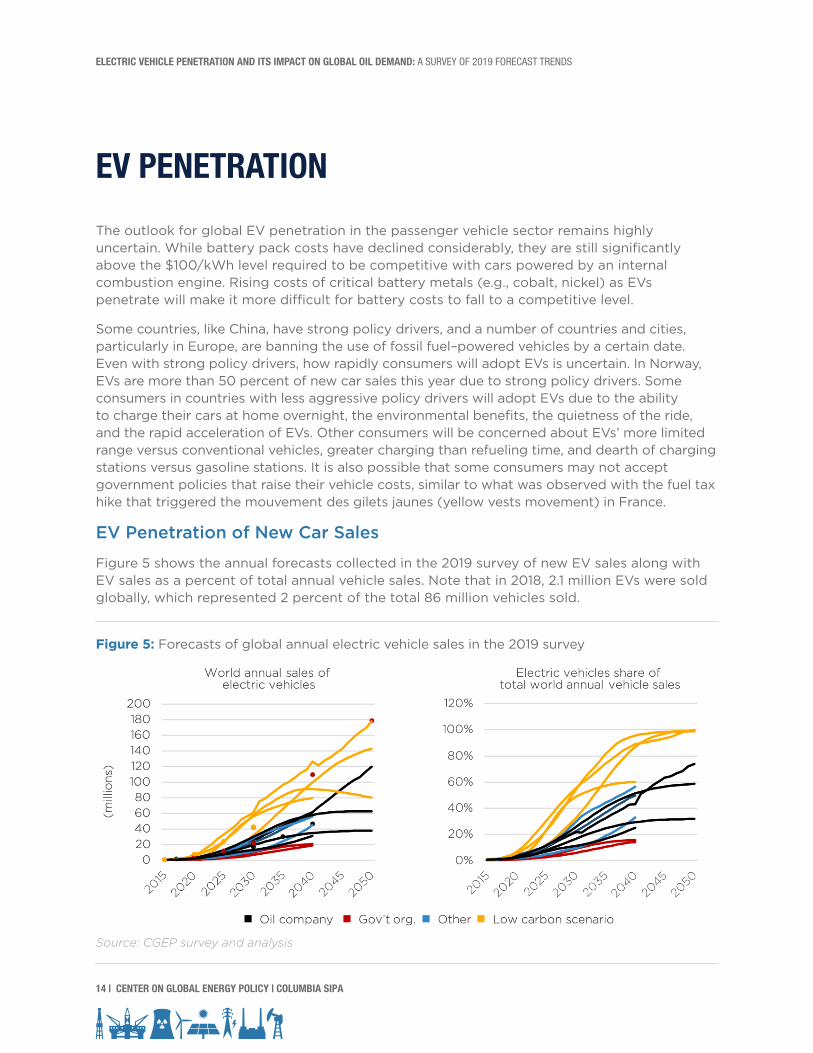
Figure 5 shows the annual forecasts collected in the 2019 survey of new EV sales along with EV sales as a percent of total annual vehicle sales. Note that in 2018, 2.1 million EVs were sold globally, which represented 2 percent of the total 86 million vehicles sold.
Figure 5: Forecasts of global annual electric vehicle sales in the 2019 survey
Source: CGEP survey and analysis
EV PENETRATION
ELECTRIC VEHICLE PENETRATION AND ITS IMPACT ON GLOBAL OIL DEMAND: A SURVEY OF 2019 FORECAST TRENDS
ENERGYPOLICY.COLUMBIA.EDU | DECEMBER 2019 | 15
Figure 5 also indicates that excluding the low carbon scenarios, EV sales are forecasted to remain relatively modest until 2025, when battery costs are expected to become more competitive with the internal combustion engine. In the low carbon scenarios, government policies drive more rapid penetration of EVs. There is still a wide range in views of penetration between low carbon and other forecasts, with some forecasts in 2025 remaining below 10 percent, while low carbon cases show 25 percent to 30 percent EV penetration in passenger vehicle sales. By 2040, the range of EVs’ market share is from 15 percent at the bottom to over 90 percent for the low carbon scenarios. Thus, there is no agreement on whether EVs will be a niche car or whether they will dominate vehicle sales by 2040.
EV Sales in 2019 versus 2018 Survey
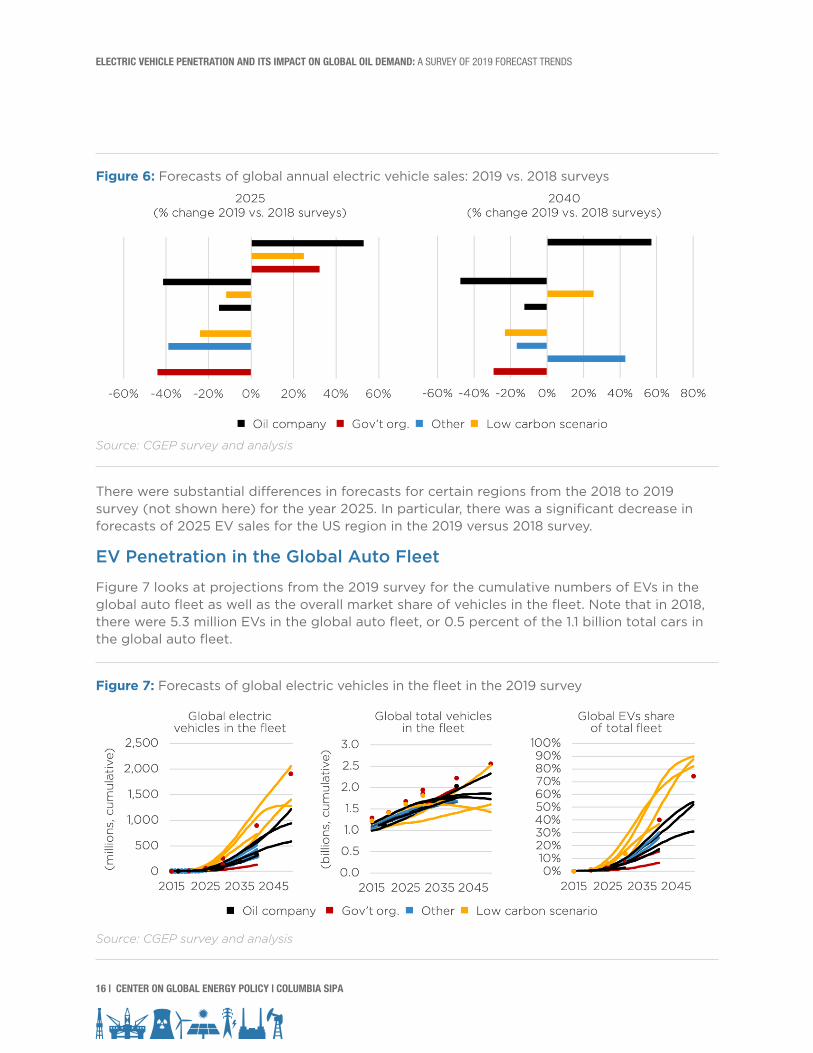
Figure 6 shows how results have changed from the 2018 survey to the 2019 survey. It shows the percentage change of the 2019 EV sales volumes over the 2018 survey EV sales volumes for the years 2025 and 2040. The only forecasts compared are those that submitted projections in both the 2018 and 2019 surveys.
For sales in both 2025 and 2040, more forecasting entities lowered versus raised their estimates of EV sales. There were several reasons given for this trend. The first one was the economic slowdown in China and Europe. Weaker economic growth is reducing new car sales in both areas. The second reason given was a weakening of government policies toward EVs in the US. The Trump administration does not favor EVs and froze vehicle fuel efficiency standards. The administration has also revoked California’s waiver to set more efficient vehicle efficiency standards, which puts its zero emissions vehicle program at risk. The federal EV tax credit will be available only until 200,000 qualified EVs have been sold in the United States by each manufacturer, at which point the credit begins to phase out for that manufacturer. The credit phaseout has already started for key US EV manufacturers (e.g., Tesla, General Motors). In addition, several key states in the US that offer EV tax subsidies, including California, will run out of funding for subsidizing EV purchases before the end of the year, limiting the availability of the subsidy.
While not cited explicitly by the survey participants, another reason for a slowdown in EV penetration rates is the delay in timing of when lithium-ion batteries reach a cost structure competitive with the internal combustion engine.
There were also three entities that increased EV sales in the 2019 versus 2018 forecasts. Reasons cited for this increase include Chinese policy support, the aftermath of “diesel gate” driving EV adoption to meet European efficiency and CO2 standards, and falling battery costs. Perhaps the biggest new trend is that automobile manufacturers are responding to government policy signals and announcing ambitious plans to electrify the car market. There are also major investments being made to expand battery production and charging infrastructure.
ELECTRIC VEHICLE PENETRATION AND ITS IMPACT ON GLOBAL OIL DEMAND: A SURVEY OF 2019 FORECAST TRENDS
16 | CENTER ON GLOBAL ENERGY POLICY | COLUMBIA SIPA
Figure 6: Forecasts of global annual electric vehicle sales: 2019 vs. 2018 surveys
Source: CGEP survey and analysis
There were substantial differences in forecasts for certain regions from the 2018 to 2019 survey (not shown here) for the year 2025. In particular, there was a significant decrease in forecasts of 2025 EV sales for the US region in the 2019 versus 2018 survey.
EV Penetration in the Global Auto Fleet
Figure 7 looks at projections from the 2019 survey for the cumulative numbers of EVs in the global auto fleet as well as the overall market share of vehicles in the fleet. Note that in 2018, there were 5.3 million EVs in the global auto fleet, or 0.5 percent of the 1.1 billion total cars in the global auto fleet.
Figure 7: Forecasts of global electric vehicles in the fleet in the 2019 survey
Source: CGEP survey and analysis
ELECTRIC VEHICLE PENETRATION AND ITS IMPACT ON GLOBAL OIL DEMAND: A SURVEY OF 2019 FORECAST TRENDS
ENERGYPOLICY.COLUMBIA.EDU | DECEMBER 2019 | 17
Given the years it takes to turn over the passenger auto fleet, EVs aren’t projected to be a large part of the fleet before 2030. The average age of cars in the US, for example, is 11.8 years.
The middle chart shows that there is a wide range of views of how many passenger vehicles (both conventional and EVs) will be part of the global auto fleet in the long term. In 2050, the range of forecasts is from about 1.5 billion vehicles on the road to 2.5 billion vehicles on the road. One would expect the low carbon scenarios to have a lower number of cars in the global auto fleet in response to government policies to curb driving due to congestion, air pollution, and climate change. However, a few of the low carbon scenarios have a robust outlook for passenger vehicles despite the potential for government disincentives.
In figure 7, the chart on the right shows market share forecasts for EVs in the global automobile fleet. The range in views is very wide by 2040 from EVs having a 10 percent share of the fleet to a 70 percent share of the fleet. This is a wider range than was reflected in the 2018 survey, when the range from the lowest to highest market share for EVs was a narrower 15 percent to 60 percent. Forecasters are taking more decisive positions on whether EVs penetrate the global market, with the low carbon forecasts having the highest EV penetration. By 2050, the low carbon scenarios project that EVs will be 80 percent to 90 percent of the global auto fleet.
Regional Views of EV Fleets
China is the world’s largest EV market. Nearly 1.1 million electric cars were sold there in 2018. With 2.3 million EVs in its fleet, it accounted for almost half of the global EV stock. Europe had the next highest EV fleet in 2018 with 1.2 million EVs, while the United States had 1.1 million on the road by the end of 2018. Norway remained the global leader at 46 percent of its new car sales in 2018 being electric versus about 2 percent for the world.
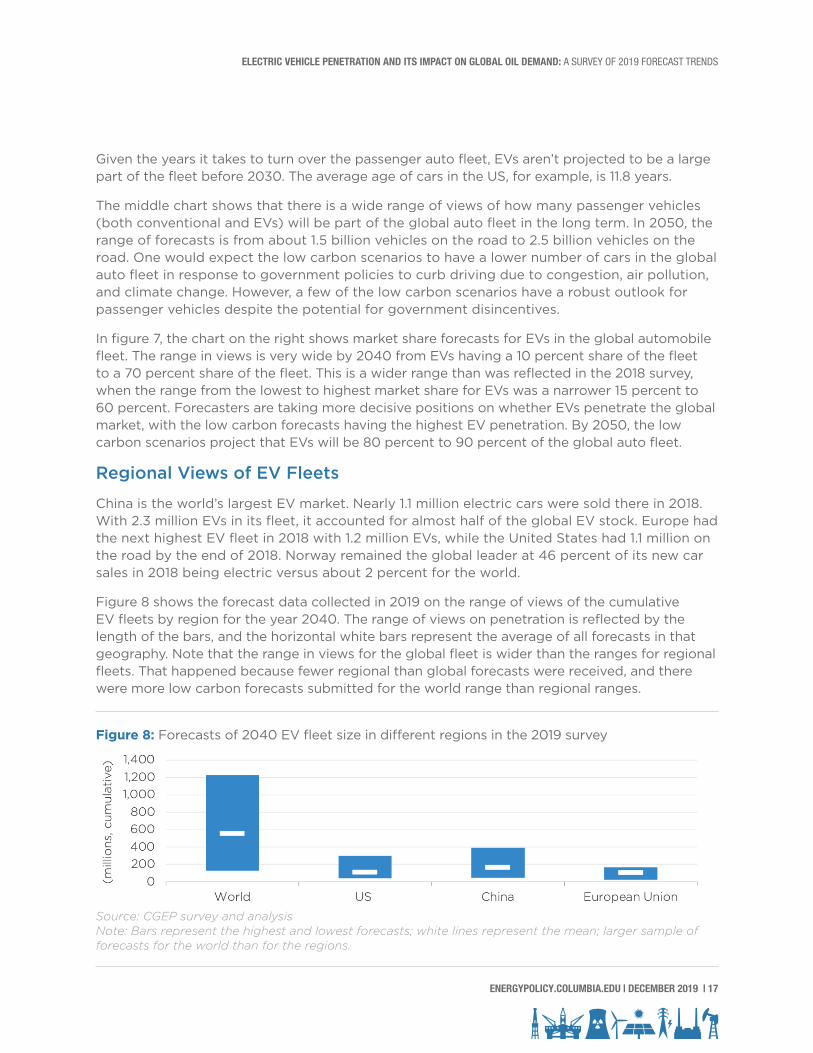
Figure 8 shows the forecast data collected in 2019 on the range of views of the cumulative EV fleets by region for the year 2040. The range of views on penetration is reflected by the length of the bars, and the horizontal white bars represent the average of all forecasts in that geography. Note that the range in views for the global fleet is wider than the ranges for regional fleets. That happened because fewer regional than global forecasts were received, and there were more low carbon forecasts submitted for the world range than regional ranges.
Figure 8: Forecasts of 2040 EV fleet size in different regions in the 2019 survey
Source: CGEP survey and analysisNote: Bars represent the highest and lowest forecasts; white lines represent the mean; larger sample of forecasts for the world than for the regions.

ELECTRIC VEHICLE PENETRATION AND ITS IMPACT ON GLOBAL OIL DEMAND: A SURVEY OF 2019 FORECAST TRENDS
18 | CENTER ON GLOBAL ENERGY POLICY | COLUMBIA SIPA
The figure shows views about the size of the EV fleet in 2040 are widest for China, with more upside versus the mean than the other regions. Chinese EV support is driven by multiple motivations (e.g., energy security, urban air emissions, industrial policy), and it uses multiple policy levers to achieve its EV goals. One analyst holds the view that China is weakening its policy drivers for EVs, as indicated by the nation reducing subsidies for EV purchases and relaxing restrictions on purchasing conventional vehicles in Guangdong province. However, the nation has always intended to phase out these subsidies to make sure its domestic EV industry becomes profitable. Relaxing restrictions on conventional vehicles should be viewed as a measure to stimulate China’s economy in light of particularly weak internal combustion engine car sales. In the first four months of 2019, sales of passenger cars and commercial vehicles declined by 12 percent compared with the same period in 2018. At the same time, EV sales increased 50 percent year over year in the first half of 2019. Another sign that China’s EV policies remain intact is that China recently announced it will launch pilot programs in some cities to phase out vehicles that run on fossil fuels.
To put figure 8 in perspective, the total US fleet in 2018 (conventional and EVs) was about 280 million vehicles, or nearly one-quarter of the global fleet. Europe’s total fleet size in 2018 was about 250 million vehicles, or 22 percent of the total global vehicle fleet. China’s total fleet size in 2018 was about 180 million vehicles, or 16 percent of the total global fleet.
EV Share of VMT
Important drivers of global oil demand for passenger vehicles are how rapidly VMT for the entire fleet increases and the percentage of the miles driven by EVs versus conventional cars. Forecasts contemplating rapid increases in ride hailing showed a significant increase in total VMT through 2040. There already is evidence that the rapid rise in ride hailing is increasing VMT. Annual ridership of ride-hailing services (e.g., taxis, Uber, Lyft) in the US has increased by 240 percent over the last six years, while it rose by only 36 percent over the previous 12 years.1 In a study conducted about how riders would have traveled to their destinations if ride hailing didn’t exist, it was found that about 60 percent of ride-hailing users in large, dense cities in the US would have taken public transit, walked, biked, or not made the trip at all.2 Thus, ride hailing is inducing new travel demand that would increase oil use in passenger travel unless vehicles are electrified (in that case it will increase electricity demand) or passengers share rides, which would require significant policy intervention to bring about. If and when ride-hailing vehicles become autonomous, the cost of travel will be even lower, which will further promote travel.
While it can be asserted that new VMT is currently being induced because ride-hailing services are underpriced, the “low” price may eventually be ascertained due to the availability and eventual affordability of autonomous vehicles, which remove the cost of the driver. In addition, ride-hailing services are inherently less expensive than private vehicles because the capital cost of the vehicle is amortized over a much greater number of people and miles.
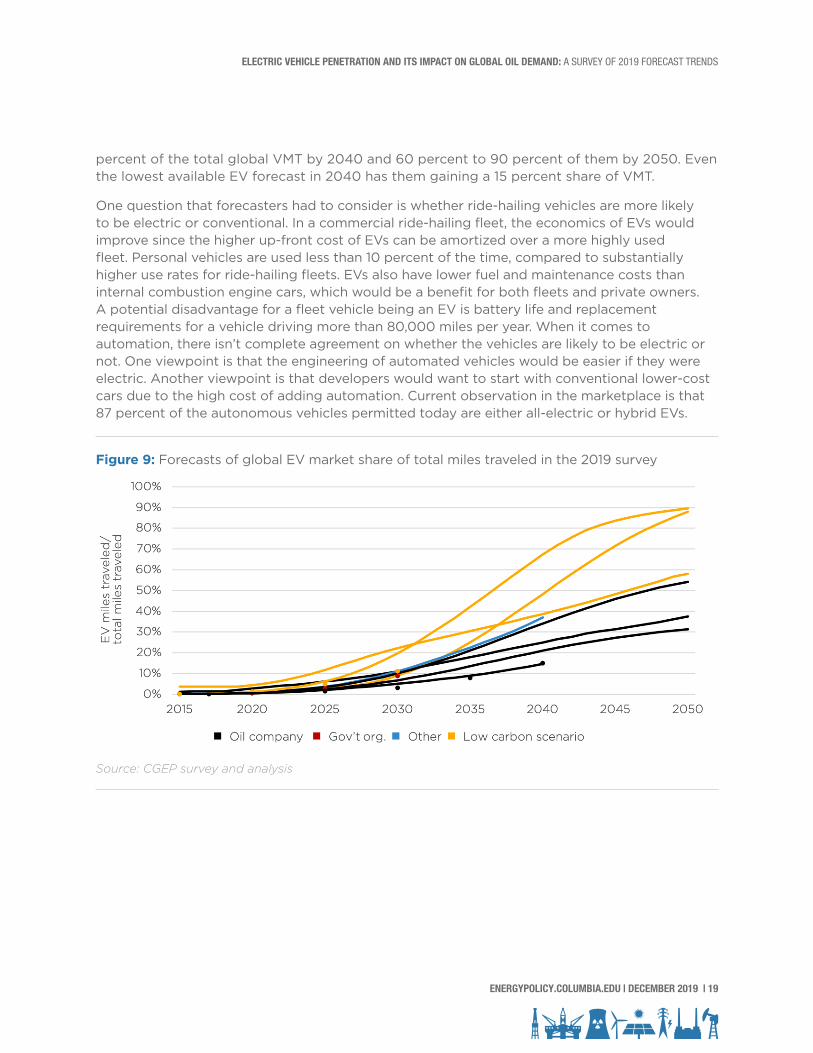
Some forecasters indicated their belief that EVs will be used as fleet-owned autonomous taxis that will replace private vehicle ownership to some degree and get a rising share of total global VMT. Figure 9 shows that the low carbon forecasts project EVs having 40 percent to 70
ELECTRIC VEHICLE PENETRATION AND ITS IMPACT ON GLOBAL OIL DEMAND: A SURVEY OF 2019 FORECAST TRENDS
ENERGYPOLICY.COLUMBIA.EDU | DECEMBER 2019 | 19
percent of the total global VMT by 2040 and 60 percent to 90 percent of them by 2050. Even the lowest available EV forecast in 2040 has them gaining a 15 percent share of VMT.
One question that forecasters had to consider is whether ride-hailing vehicles are more likely to be electric or conventional. In a commercial ride-hailing fleet, the economics of EVs would improve since the higher up-front cost of EVs can be amortized over a more highly used fleet. Personal vehicles are used less than 10 percent of the time, compared to substantially higher use rates for ride-hailing fleets. EVs also have lower fuel and maintenance costs than internal combustion engine cars, which would be a benefit for both fleets and private owners. A potential disadvantage for a fleet vehicle being an EV is battery life and replacement requirements for a vehicle driving more than 80,000 miles per year. When it comes to automation, there isn’t complete agreement on whether the vehicles are likely to be electric or not. One viewpoint is that the engineering of automated vehicles would be easier if they were electric. Another viewpoint is that developers would want to start with conventional lower-cost cars due to the high cost of adding automation. Current observation in the marketplace is that 87 percent of the autonomous vehicles permitted today are either all-electric or hybrid EVs.
Figure 9: Forecasts of global EV market share of total miles traveled in the 2019 survey
Source: CGEP survey and analysis
ELECTRIC VEHICLE PENETRATION AND ITS IMPACT ON GLOBAL OIL DEMAND: A SURVEY OF 2019 FORECAST TRENDS
20 | CENTER ON GLOBAL ENERGY POLICY | COLUMBIA SIPA
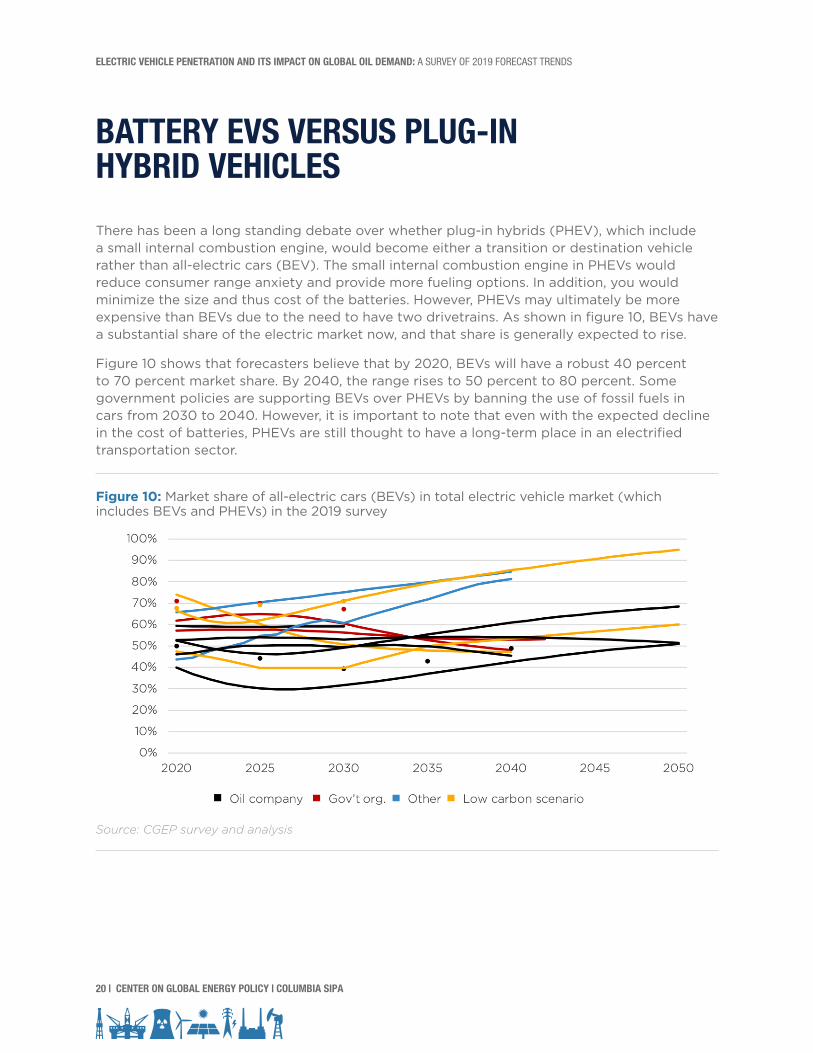
There has been a long standing debate over whether plug-in hybrids (PHEV), which include a small internal combustion engine, would become either a transition or destination vehicle rather than all-electric cars (BEV). The small internal combustion engine in PHEVs would reduce consumer range anxiety and provide more fueling options. In addition, you would minimize the size and thus cost of the batteries. However, PHEVs may ultimately be more expensive than BEVs due to the need to have two drivetrains. As shown in figure 10, BEVs have a substantial share of the electric market now, and that share is generally expected to rise.
Figure 10 shows that forecasters believe that by 2020, BEVs will have a robust 40 percent to 70 percent market share. By 2040, the range rises to 50 percent to 80 percent. Some government policies are supporting BEVs over PHEVs by banning the use of fossil fuels in cars from 2030 to 2040. However, it is important to note that even with the expected decline in the cost of batteries, PHEVs are still thought to have a long-term place in an electrified transportation sector.
Figure 10: Market share of all-electric cars (BEVs) in total electric vehicle market (which includes BEVs and PHEVs) in the 2019 survey
Source: CGEP survey and analysis
BATTERY EVS VERSUS PLUG-IN HYBRID VEHICLES
ELECTRIC VEHICLE PENETRATION AND ITS IMPACT ON GLOBAL OIL DEMAND: A SURVEY OF 2019 FORECAST TRENDS
ENERGYPOLICY.COLUMBIA.EDU | DECEMBER 2019 | 21
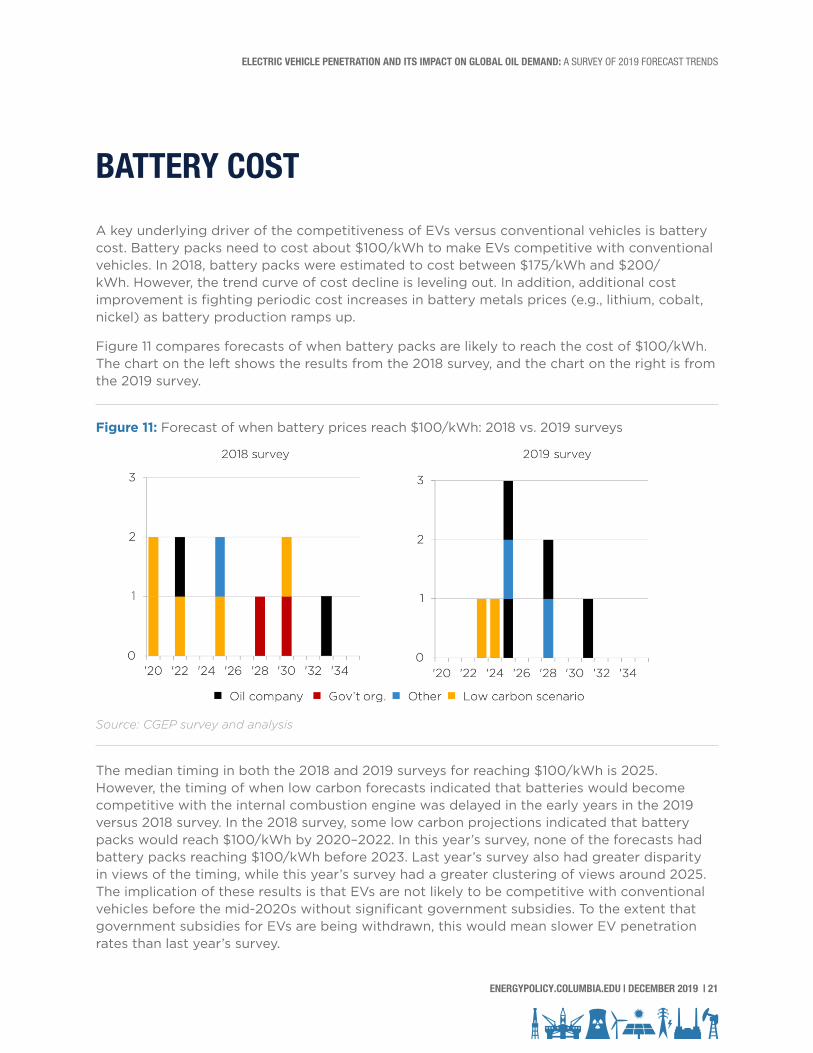
A key underlying driver of the competitiveness of EVs versus conventional vehicles is battery cost. Battery packs need to cost about $100/kWh to make EVs competitive with conventional vehicles. In 2018, battery packs were estimated to cost between $175/kWh and $200/kWh. However, the trend curve of cost decline is leveling out. In addition, additional cost improvement is fighting periodic cost increases in battery metals prices (e.g., lithium, cobalt, nickel) as battery production ramps up.
Figure 11 compares forecasts of when battery packs are likely to reach the cost of $100/kWh. The chart on the left shows the results from the 2018 survey, and the chart on the right is from the 2019 survey.
Figure 11: Forecast of when battery prices reach $100/kWh: 2018 vs. 2019 surveys
Source: CGEP survey and analysis
The median timing in both the 2018 and 2019 surveys for reaching $100/kWh is 2025. However, the timing of when low carbon forecasts indicated that batteries would become competitive with the internal combustion engine was delayed in the early years in the 2019 versus 2018 survey. In the 2018 survey, some low carbon projections indicated that battery packs would reach $100/kWh by 2020–2022. In this year’s survey, none of the forecasts had battery packs reaching $100/kWh before 2023. Last year’s survey also had greater disparity in views of the timing, while this year’s survey had a greater clustering of views around 2025. The implication of these results is that EVs are not likely to be competitive with conventional vehicles before the mid-2020s without significant government subsidies. To the extent that government subsidies for EVs are being withdrawn, this would mean slower EV penetration rates than last year’s survey.
BATTERY COST

ELECTRIC VEHICLE PENETRATION AND ITS IMPACT ON GLOBAL OIL DEMAND: A SURVEY OF 2019 FORECAST TRENDS
22 | CENTER ON GLOBAL ENERGY POLICY | COLUMBIA SIPA
Another key factor in forecasting passenger vehicle oil demand is the rate of fuel efficiency improvement in internal combustion engine cars. Figure 12 shows a smaller sample of forecasts submitted on global fuel efficiency trends for conventional vehicles. Historically, the large differences in the estimates of fuel efficiency can likely be explained by the forecasters not having actual data on this but instead having to back into what it should have been based on their different vehicle fleet models. In addition, it looks like 2015 was the base starting point, and every year after that is estimated from a model. Thus, it is important to focus on the trends rather than the absolute percentages.
The wide range of efficiency forecasts shown likely results from different assumptions about crude oil and gasoline price levels and various governments’ fuel economy standards. With a higher fuel price, consumers are likely to purchase more fuel efficient cars. Higher fuel economy standards will lower passenger vehicle oil demand except to the extent the impact is offset by consumers purchasing larger or more powerful cars or driving more like has been seen in the US.
While regional detail is not shown here, there was greater variation in forecast fuel efficiency trends in the US and China than there was for Europe. High government fuel taxes in Europe continue to incentivize the purchase of fuel efficient cars.
In the low carbon cases, the efficiency of conventional vehicles may not mean as much to oil demand. These scenarios tend to have high penetrations of EVs and low usage of conventional vehicles.
Figure 12: Global fuel efficiency improvement in conventional vehicles in the 2019 survey
Source: CGEP survey and analysis
FUEL EFFICIENCY IMPROVEMENT IN INTERNAL COMBUSTION ENGINE CARS

ELECTRIC VEHICLE PENETRATION AND ITS IMPACT ON GLOBAL OIL DEMAND: A SURVEY OF 2019 FORECAST TRENDS
ENERGYPOLICY.COLUMBIA.EDU | DECEMBER 2019 | 23
Figure 13 contains forecasts for oil demand in the global passenger vehicle sector. Passenger vehicle sector oil demand is currently about 25 million barrels per day. While there is slight growth in some of the forecasts through 2025, beyond that, demand is expected to remain flat or decline. In the lowest low carbon case, passenger vehicle oil demand declines to 10 million barrels per day by 2040, representing a loss from today of 15 million barrels per day. By 2050, these scenarios show demand falling to under 5 million barrels. Oil company forecasts show a much more moderate decline after modest growth through 2025–2030.
Most of these forecasts show rising non-OECD passenger vehicle oil demand through at least 2040. However, this rise is offset by the decline in the OECD area beyond 2020–2025.
Figure 13: Forecasts of global passenger sector oil demand in the 2019 survey
Source: CGEP survey and analysis
Some of the forecasts submitted included two-wheelers and three-wheelers in the passenger vehicle sector. Those forecasts are not shown in the accompanying chart because most of the submitted data the author is showing did not include those categories. These missing forecasts generally showed slight growth in oil demand through 2030–2035 followed by a slight decline.
Passenger vehicle oil demand forecasts in the 2019 survey were generally moderately lower than in the 2018 survey. That direction was surprising given that EV penetration rates in the forecasts were generally down. One explanation could be the forecasts for lower economic growth rates in developing countries in the 2019 versus 2018 forecast. Another explanation is
FORECASTS OF GLOBAL PASSENGER SECTOR OIL DEMAND
ELECTRIC VEHICLE PENETRATION AND ITS IMPACT ON GLOBAL OIL DEMAND: A SURVEY OF 2019 FORECAST TRENDS
24 | CENTER ON GLOBAL ENERGY POLICY | COLUMBIA SIPA
the expectation that EVs will be used in ride-hailing fleets and will have sharp gains in market share of VMT. The forecast that had the biggest decline in oil demand in the 2019 survey also had a substantial increase in EV sales, but that was not typical of the other forecasts. A chart comparing the 2019 and 2018 surveys is not included because there were too few forecasts that reported demand on exactly the same basis in both years.
Figure 14 shows forecasts for how much oil demand is projected to be displaced by electric passenger vehicles. It is calculated by subtracting forecasts with EVs from what the forecasters said their forecast would have been without EVs, which you cannot see in figure 13. In 2040, most forecasts project no more than a 5 million barrel per day loss in all demand. However, several low carbon scenarios put the loss at as high as 18 million barrels per day in 2040, rising to 35 million barrels per day by 2050.
Note that this survey did not include reductions in oil demand due to efficiency improvements but rather focused on EV penetration, which forecasts generally categorize as fuel switching. The demand loss shown below would obviously be higher if fuel efficiency improvements in conventional vehicles were included. One example of a published forecast that has both efficiency improvements as well as fuel switching (including alternative fuels as well as electrification) is the International Energy Agency’s New Policies Scenario in the World Energy Outlook 2018. In this scenario, improvements in fuel efficiency are the single largest contributor to moderating oil demand growth in cars. In this scenario, by 2040, 6 million barrels per day of potential oil demand is lost due to efficiency improvements, with alternative fuels (biofuels and natural gas) accounting for 4 million barrels per day and electrification accounting for 3 million barrels per day.3 Again, figure 14 includes only the impact of electrification, which is the topic of this paper. The other sources of demand loss are accounted for in each forecast’s case of what demand would have been without EVs.
It was interesting to observe that in some cases, the low carbon cases had higher rates of fuel efficiency improvement than other cases, and in some cases, they had lower rates of fuel efficiency improvement. In the higher efficiency cases, both fuel efficiency and electrification were likely driven by stringent government regulation. In the cases in which low carbon cases had low fuel efficiency improvement, it was likely due to lower oil prices resulting from oil demand loss from electrification and perhaps because EVs enable automobile manufacturers to meet low carbon regulations without having to improve the efficiency of conventional vehicles.

ELECTRIC VEHICLE PENETRATION AND ITS IMPACT ON GLOBAL OIL DEMAND: A SURVEY OF 2019 FORECAST TRENDS
ENERGYPOLICY.COLUMBIA.EDU | DECEMBER 2019 | 25
Figure 14: World oil demand displaced by EVs in the 2019 survey
Source: CGEP survey and analysis
It is important to keep in mind that a decline in passenger vehicle oil demand does not necessarily mean a decline in total oil demand. All the expected global oil demand growth is found in the truck, aviation and marine, and petrochemical sectors.
Figure 15 shows the range of published forecasts for total global oil demand, including all sectors and products. The average of all oil demand forecasts indicates that total oil demand is projected to grow slightly through 2025–2030 and decline modestly thereafter. Before 2025, there is little expectation that global oil demand will decline. However, there is more downside than upside risk to oil demand for the projection period due to the potential for a policy-driven transition to a low carbon world. In the lowest low carbon case available, oil demand declines precipitously beyond 2030, falling by one-third from 2020 levels by 2040. In the highest forecast, global oil demand grows by nearly 20 percent from 2020 to 2040. This outlook has more balanced upside and downside risk than the passenger vehicle sector, which has little upside beyond 2025.

ELECTRIC VEHICLE PENETRATION AND ITS IMPACT ON GLOBAL OIL DEMAND: A SURVEY OF 2019 FORECAST TRENDS
26 | CENTER ON GLOBAL ENERGY POLICY | COLUMBIA SIPA
Figure 15: Range of current views in published global total oil demand forecasts
Source: From published forecasts in 2019 that include Equinor, IEA, BP, ExxonMobil, DNV, EIA, and OPEC, including different scenarios where available. .
It is also important to note that even in the lowest demand case, investment is still needed in new oil supplies to replace the expected decline in existing production. There is a risk that policy makers and shareholders overestimate how quickly the global oil demand trajectory can flatten and decline and underestimate the decline in existing production that needs investment to replace it.

ELECTRIC VEHICLE PENETRATION AND ITS IMPACT ON GLOBAL OIL DEMAND: A SURVEY OF 2019 FORECAST TRENDS
ENERGYPOLICY.COLUMBIA.EDU | DECEMBER 2019 | 27
1. Bruce Schaller, The New Automobility: Lyft, Uber and the Future of American Cities, 2018, 2, 7.
2. Daniel Sperling, Three Revolutions: Steering Automated, Shared, and Electric Vehicles to a Better Future, 113.
3. International Energy Agency, World Energy Outlook 2018, 154.
NOTES

ELECTRIC VEHICLE PENETRATION AND ITS IMPACT ON GLOBAL OIL DEMAND: A SURVEY OF 2019 FORECAST TRENDS
28 | CENTER ON GLOBAL ENERGY POLICY | COLUMBIA SIPA