electric vehicles - australian energy market operator · electric vehicles currently (in 2015) ......
TRANSCRIPT
AUGUST 2016
Electric Vehicles
Author: AEMO and Energeia
Electric Vehicles
EXECUTIVE SUMMARY
Key points
The 20-year impact of electric vehicles on energy consumption is projected to be small, adding
almost 4% to 2035–36 projections of electricity use in Australia.
Despite buyer interest, public charging infrastructure remains undeveloped, electricity pricing
structures for electric vehicles are not yet established, and full model ranges remain unavailable.
Analysis has also shown that the transition to electric vehicles can be greatly influenced by
decisions on industry policy, in particular, vehicle fleet emission standards. Australia’s regulatory
and policy framework for electric vehicles is yet to be resolved.
For all these reasons, projections of uptake can vary over a wide range, and in most cases will
feature a slow start.
These uncertainties are likely to be resolved over the next 10 years, a period when AEMO expects
a major transformation of the energy system due to a continuing embrace of renewable energy and
new energy-efficient technologies, and a shift away from energy-intensive manufacturing.
AEMO intends to monitor the emergence of electric vehicles in Australia, while working with
industry on developing the energy system of tomorrow.
Our first AEMO Insights report
The transformation of Australia’s energy system – driven by changes in technology, the economy, and
consumer behaviour – has implications for the operation and evolution of the physical, market, and
regulatory infrastructure of the energy industry.
This rapid and continuing transformation will require new ways of thinking about energy challenges, and
innovative methods to accommodate a very different consumer and economy. It also has profound
implications for AEMO’s operational roles. The magnitude and extent of change makes it harder to
project with certainty, as the past is no longer indicative of the future.
This is the first of AEMO’s new AEMO Insights reports, which:
Will explore a range of topical issues that have the potential to challenge the future management
and operation of gas and electricity markets and infrastructure systems.
Are intended to provide information in a timely and agile fashion to assist industry with its
developing understanding of rapidly emerging challenges.
This inaugural report is about electric vehicles (EVs), and has been produced in response to keen
interest on this topic. It provides a view of how this emerging technology may develop in Australia, and
what this could mean for electricity consumption and demand.
The analysis has been prepared with our consultancy partner, Energeia, and expands on the work
AEMO started in its 2015 Emerging Technologies Information Paper. AEMO will use this analysis as a
starting point for monitoring the emergence and use of EVs in the light vehicle fleet in Australia.
This EV projection is aligned with the scenarios and major assumptions of AEMO’s recently published
2016 National Electricity Forecasting Report (NEFR), to show how EV uptake could affect the 2016
NEFR forecasts of electricity consumption and demand in the National Electricity Market (NEM) over a
20-year outlook period to 2035–36. As well as projections for the NEM, EV uptake projections are also
provided for Western Australia’s Wholesale Electricity Network (WEM) based on the same scenarios.
AEMO welcomes feedback on this report, and will use it to inform the development of AEMO’s
forecasting and planning publications. Please email [email protected] by
30 September 2016 with comments.

Electric Vehicles
The electric vehicle (EV) analysis
The 20-year impact of electric vehicles on electricity consumption and demand is projected to be small
relative to the impact of other changes expected to take place, such as investment in renewable energy
technologies, restructuring of the Australian economy, and energy efficiency improvements of
major appliances.
Electric vehicles currently (in 2015) make up 0.2% of annual vehicle sales in Australia. This is likely
to increase in coming years with anticipated decline in costs, increased availability and capacity of
new EV models, and assumed government and industry support.
Growth in uptake of electric vehicles may remain constrained until a fuller product/style range is
available and public charging infrastructure is developed.
In the NEM, based on the NEFR’s neutral sensitivity1, by 2035–36 Australian EV sales are forecast to
reach 277,000 vehicles a year (27.1% of vehicle sales). Total EVs on the road are estimated to reach
over 2.8 million (18.4% of all vehicles).
For this projected uptake, by 2036 EVs would add 6,941 gigawatt hours (GWh) of grid-supplied
electricity consumption a year. This is an increase of about 3.8% compared to 2016 NEFR
forecasts of operational consumption for the NEM under the neutral sensitivity.
Within the NEM, projected uptake varies by region. These differences are attributed to the different
regional effects of market size, the relative differential between petrol prices and electricity prices,
and the assumed introduction of a fleet-based greenhouse gas emissions standard2 from 2026.
In the Western Australian WEM, based on assumptions consistent with the neutral sensitivity from the
2016 NEFR, EV sales are forecast to reach 43,000 per year by 2036, or approximately 33% of total
sales. Total EVs on the road that year are estimated to reach 389,000 (approximately 20% of the light
vehicle fleet).
This uptake is estimated to add 958 GWh to annual grid-supplied consumption in the WEM
by 2036.
Table 1 shows the projected impact of EVs on operational consumption forecasts for both the NEM
and WEM.3
Table 1 Operational consumption and EV uptake forecasts for the NEM and WEM
2015–16 consumption 2025–26 consumption 2035–36 Consumption
Non-EV
(GWh)
EV
(GWh)
EV impact
(%)
Non-EV
(GWh)
EV
(GWh)
EV impact
(%)
Non-EV
(GWh)
EV
(GWh)
EV impact
(%)
NEM 183,258 6 0.00% 187,129 1,620 0.87% 184,467 6,941 3.76%
WEM 18,475 0.5 0.00% 20,318 185 0.91% n/a3 958 n/a3
1 AEMO’s forecasts explore a range of sensitivities that represent the probable pathway for Australia across weak, neutral (considered the most
likely), and strong economic and consumer outlooks. All three sensitivities assume Australia achieves its commitment at the 21st Conference of the Parties for the United Nations Framework Convention on Climate Change (to reduce greenhouse gas emissions by between 26% and 28% below 2005 levels by 2030), and state governments continue to target increasing levels of renewable generation, although instruments to achieve these targets are yet to be determined.
2 As part of the National Energy Productivity Plan, implementation of vehicle emission standards will be examined. See: https://scer.govspace.gov.au/files/2015/12/NEPP-Work-Plan-version-for-release-20151203sc.pdf.
3 For the WEM, AEMO only has a 10-year operational consumption forecast as published in the deferred 2015 WEM Electricity Statement of Opportunities. See: http://www.aemo.com.au/Electricity/Wholesale-Electricity-Market-WEM/Planning-and-forecasting/WEM-Electricity-Statement-of-Opportunities.

Electric Vehicles
AEMO has considered these EV projections in the context of AEMO’s broader forecasting and
planning role:
The introduction and growth of EVs signals yet another consumer-driven technological shift in a
wider process of transformational change, risk, and uncertainty for the electricity industry.
The approximate 3.8% forecast increase in operational consumption from EV uptake by 2035–36
appears relatively small compared to other projected drivers, as shown in Figure 1 (with the
projected addition to operational consumption from EVs highlighted in bright green). By contrast, for
example, AEMO forecasts that trends in rooftop photovoltaic (PV) and energy efficiency uptake are
likely to reduce electricity consumption from the grid in 20 years by 18% and 15% respectively.
Figure 1 NEM operational consumption 2005–06 to 2035–36 (from 2016 NEFR, neutral sensitivity, with
EV forecast impact added)
More importantly, there are major uncertainties affecting the emergence of EVs that need to be
investigated to better appreciate their likely impact on the energy system. These include:
The design, technology, and commercialisation of future public charging infrastructure.
Potential development of government policies affecting transport, such as transportation fleet
energy efficiency standards or local policy measures that further support EV uptake.
Price and tariff structures to accommodate electric vehicles.
Heavy transport, which was outside the scope of the study.
The role of electric vehicles in the future power grid, in particular their contribution of energy
storage to households and the grid, and their contribution of network support services to address
the management of frequency, energy, and voltage.
0
25,000
50,000
75,000
100,000
125,000
150,000
175,000
200,000
225,000
250,000
275,000
300,000
2006
2007
2008
2009
2010
2011
2012
2013
2014
2015
2016
2017
2018
2019
2020
2021
2022
2023
2024
2025
2026
2027
2028
2029
2030
2031
2032
2033
2034
2035
2036
Op
era
tio
nal
Co
nsu
mp
tio
n (
GW
h)
Actual Business (excl. LNG) Residential LNG
Electric Vehicles Total Losses 2016 Forecast 2015 Forecast
Addition due to Electric Vehicles
Business (excluding LNG)
Residential2016 Forecast(as sent out)
Small Non-Scheduled Generation
Reduction due to the impact of Price Change
Reduction due to Energy Efficiency
Reduction due to Solar PV
2015 Forecast(as sent out)
Electric Vehicles
Over a 20-year projection, differences between actual and assumed incentives could shift operational
consumption projections by more than the 3.8% total EV impact now forecast. These EV projections
factor in the assumptions in the 2016 NEFR’s strong and weak sensitivities to explore some of this
uncertainty, resulting in variations in the projections of 20-year forecast growth in operational
consumption from EVs of 6.2% and 2.4% respectively.
The impact of uncertainty is particularly high when it comes to forecasting maximum and
minimum demand.
In this study, EV charging has been modelled to occur mainly overnight. This assumption results in
negligible impact of EVs on projected regional maximum demands, because EVs were assumed to
charge in the lower overnight demand period. (The same slight impact is seen on
longer-term forecasts of minimum demand, which by the mid-2020s is forecast to shift to midday in
all NEM regions when the sun is strongest and rooftop PV generates at its highest levels.)
Different pricing incentives and consumer behaviours could result in different usage and charge
profiles, potentially with greater effects on daily demand patterns, particularly at the local level.
This level of uncertainty further signals the need for AEMO to increase its focus on the potential
implications for power system operation beyond technology to looking into the influences of alternative
tariff structures, pricing incentives, and shifts in consumers’ attitude and behaviours.
Next steps
Given the relatively small forecast impact of EVs highlighted in this report, and the level of uncertainty in
drivers for EV uptake, AEMO intends to:
Continue to closely monitor the emergence of EVs.
Investigate and inform stakeholders about the impact of potential future energy services and
pricing structures for operational consumption, demand profiles, and any implications for secure
and reliable power system operation.
Greater knowledge about these areas of uncertainty is key to projecting how consumer behaviour and
the economy may change in Australia, and therefore how the uptake and use of emerging technologies,
including EVs, may develop and impact electricity consumption.
Electric Vehicles Insights
Prepared by ENERGEIA for the Australian Energy Market Operator’s 2016 National
Electricity Forecasting Paper
August 2016

Version 3.3 Page 2 of 53 August 2016
Executive Summary
The National Electricity Forecasting Report (NEFR) provides electricity consumption forecasts over a 20-year forecast period for the National Electricity Market (NEM), and for each NEM region. While electric vehicle uptake in Australia is still very low (approximately 0.3% of annual vehicle sales), the combined impact of price declines in battery technology, the increasing introduction of new EV models into the market and both government and industry support will drive increased uptake over the next 20 years.
AEMO has commissioned Energeia to prepare an Electric Vehicles Insights paper, adopting the forecasts of AEMO’s recently published 2016 NEFR as the basis for an impact assessment of the introduction of electric vehicles to Australia’s electricity supply system.
Over the course of 2016, AEMO will monitor feedback on this report, and continue a work-program to enable the inclusion of electric vehicles in AEMO’s major Forecasting and Planning publications in 2017.
Scope and Approach
The Electric Vehicle Insights paper provides forecasts of EV uptake for each region of the NEM and the corresponding impact on annual electricity consumption and maximum and minimum demand because of charging of EVs from the grid.
Energeia has used its third generation EV forecasting model, updated to align with AEMO’s NEFR assumptions regarding electricity prices as well as market and policy settings, to derive the results.
Results
EV Uptake
EV sales within the National Electricity Market (NEM) are forecast to reach 276,800vehicles per annum by 2036 or 27.1% of sales under the NEFR’s neutral sensitivity. As a result, total vehicles on the road are forecast to reach over 2.85 million by 2036 or 17.7% of vehicles by 2036 as shown in Figure 1.
Figure 1 – EV Uptake (NEM, Neutral)
Source: Energeia
Uptake varies by region, predominantly due to market size, but also the relative differential between petrol prices and electricity prices experienced in each state in the early years, with NSW having the greatest differential due
0%
2%
4%
6%
8%
10%
12%
14%
16%
18%
20%
20
16
20
17
20
18
20
19
20
20
20
21
20
22
20
23
20
24
20
25
20
26
20
27
20
28
20
29
20
30
20
31
20
32
20
33
20
34
20
35
20
36
0
500
1,000
1,500
2,000
2,500
3,000
EVs o
n th
e R
oad
(%)
EV S
tock
('0
00
s)
Neutral Neutral (%)
Version 3.3 Page 3 of 53 August 2016
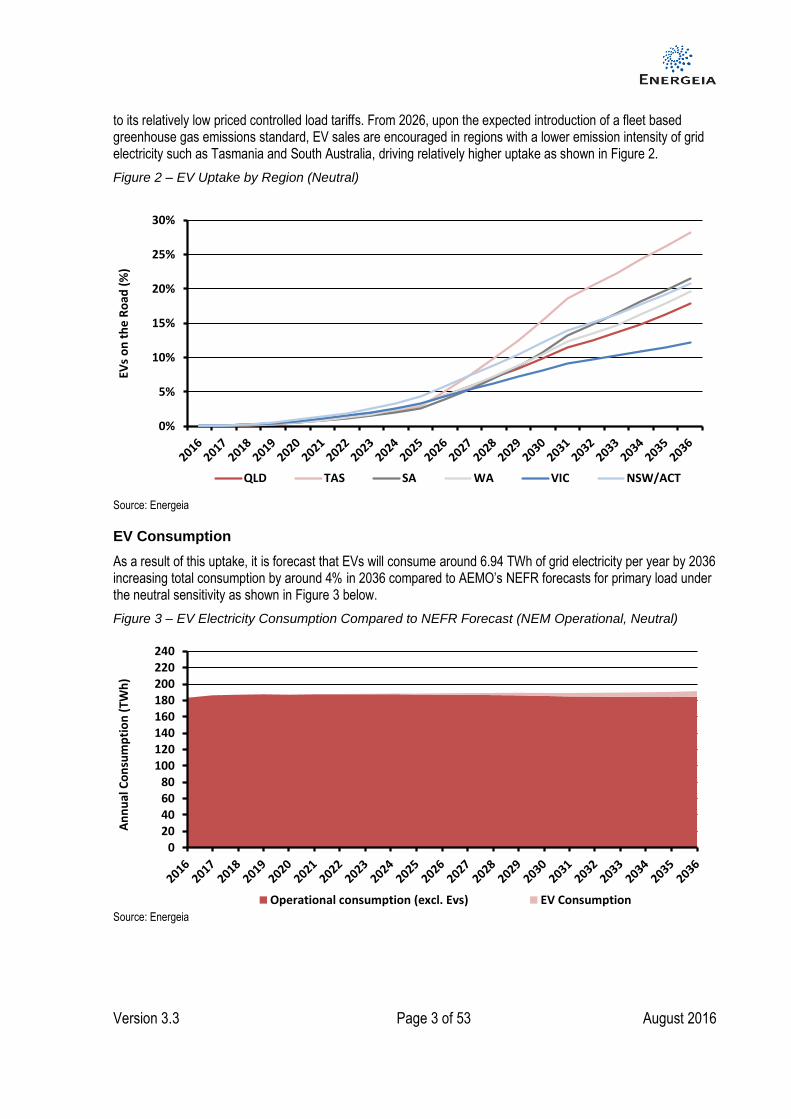
to its relatively low priced controlled load tariffs. From 2026, upon the expected introduction of a fleet based greenhouse gas emissions standard, EV sales are encouraged in regions with a lower emission intensity of grid electricity such as Tasmania and South Australia, driving relatively higher uptake as shown in Figure 2.
Figure 2 – EV Uptake by Region (Neutral)
Source: Energeia
EV Consumption
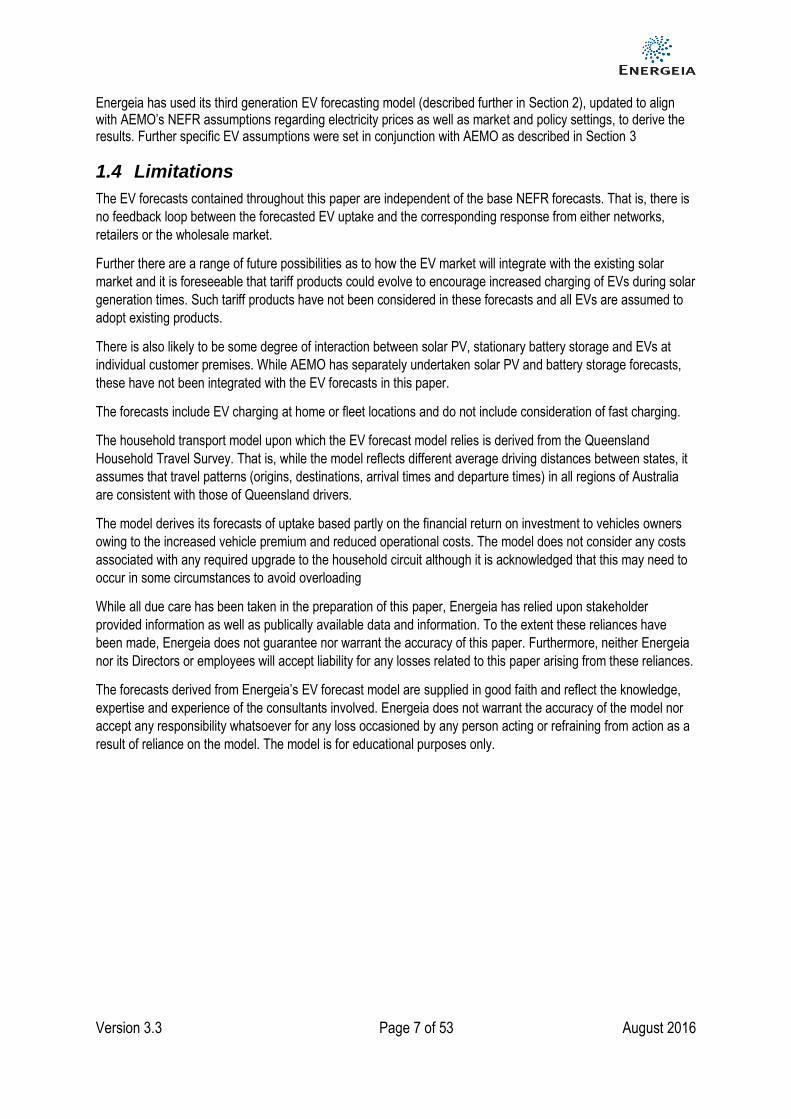
As a result of this uptake, it is forecast that EVs will consume around 6.94 TWh of grid electricity per year by 2036 increasing total consumption by around 4% in 2036 compared to AEMO’s NEFR forecasts for primary load under the neutral sensitivity as shown in Figure 3 below.
Figure 3 – EV Electricity Consumption Compared to NEFR Forecast (NEM Operational, Neutral)
Source: Energeia
0%
5%
10%
15%
20%
25%
30%
EVs
on
th
e R
oad
(%
)
QLD TAS SA WA VIC NSW/ACT
020406080
100120140160180200220240
An
nu
al C
on
sum
pti
on
(TW
h)
Operational consumption (excl. Evs) EV Consumption

Version 3.3 Page 4 of 53 August 2016
EV Maximum Demand
EV annual maximum demand is forecasted to vary by region as shown Figure 4 below. The results below refer to the maximum demand from EV charging which typically occurs late in the evening depending on the structure of the tariff.
It should be noted that EV maximum demand does not necessarily coincide with system maximum demand (and in fact is unlikely to coincide with system maximum demand due to tariff incentives).
Figure 4 – EV Maximum Demand by Region (Neutral)
Source: Energeia
The differences in regions are driven primarily by EV uptake and EV consumption, the latter of which is in turn driven by average driving distances in the region. Maximum demand is also influenced by the characteristics of the underpinning tariff. Tariffs with the greatest restrictions tending to concentrate EV charging over a shorter period and hence increase peak demand.
Impact on NEFR Maximum and Minimum Demand
Despite the increase in overnight demand, it is forecast that EVs will not cause any increase in system maximum demand for any of the regions over the period between 2015 and 2036 due to the non-coincident nature of EV maximum demand with the timing of system maximum demand.
The NEFR minimum demand is forecast to shift from overnight to the middle of the day by 2036 as solar PV penetration increases. As a result, any EV charging during the middle of the day increases minimum demand for all of the regions by 2036. Fleet charging of commercial vehicles slightly increases minimum demand, although the effect is almost insignificant due to the majority of charging still occurring overnight.
0
1
2
3
4
5
6
7
Max
imu
m D
em
and
(G
W)
QLD TAS SA WA VIC ACT/NSW

Version 3.3 Page 5 of 53 August 2016
Table of Contents
Executive Summary .......................................................................................................................................... 2
1 Introduction ............................................................................................................................................. 6
1.1 Background .......................................................................................................................................... 6
1.2 Objectives ............................................................................................................................................ 6
1.3 Scope and Approach ........................................................................................................................... 6
1.4 Limitations ............................................................................................................................................ 7
2 EV Forecasting Model Overview .............................................................................................................. 8
2.1 Overview .............................................................................................................................................. 8
2.2 EV Uptake ............................................................................................................................................ 9
2.3 EV Charging ....................................................................................................................................... 10
3 Sensitivities ........................................................................................................................................... 10
3.1 NEFR Sensitivities ............................................................................................................................. 10
3.2 EV Sensitivities .................................................................................................................................. 11
4 Results .................................................................................................................................................. 12
4.1 EV Uptake Forecasts ......................................................................................................................... 12
4.1.1 NEM .......................................................................................................................................... 12
4.1.2 Regions ..................................................................................................................................... 13
4.1.3 Sensitivities ............................................................................................................................... 14
4.2 EV Consumption Forecasts ............................................................................................................... 16
4.2.1 NEM .......................................................................................................................................... 16
4.2.2 Regions ..................................................................................................................................... 17
4.2.3 Sensitivities ............................................................................................................................... 17
4.3 EV Maximum Demand Forecasts ...................................................................................................... 18
4.3.1 EV Maximum Demand ............................................................................................................... 19
4.3.2 Impact on NEFR Maximum Demand ........................................................................................... 20
4.3.3 Impact on NEFR Minimum Demand............................................................................................ 23
5 Recommendations for Future Modelling ................................................................................................. 26
5.1 Key Uncertainties ............................................................................................................................... 26
5.2 Changes in EV Charging Tariffs over Time ........................................................................................ 26
5.3 Integration with Primary Load ............................................................................................................ 27
Appendix A: Detailed Assumptions .................................................................................................................. 28
Appendix B: Detailed Results .......................................................................................................................... 42

Version 3.3 Page 6 of 53 August 2016
1 Introduction
1.1 Background
The National Electricity Forecasting Report (NEFR) provides electricity consumption forecasts over a 20-year forecast period for the National Electricity Market (NEM), and for each NEM region. In 2015, the NEFR considered the impact of uptake of electric vehicles (EVs) for the first time via the Emerging Technologies Paper accompanying the 2015 NEFR1.
Accordingly, AEMO has commissioned Energeia to prepare an Electric Vehicles Insights paper to explore the impact of EVs as a key forecast uncertainty of relevance to the main NEFR forecasts.
AEMO will use this analysis as the starting point for monitoring the emergence and use of electric vehicles in Australia, as well as to provide a baseline to commence integration studies.
During the course of 2016 AEMO will monitor feedback on this report, and will continue a work-program to develop this analysis to enable the inclusion of electric vehicles in AEMO’s major Forecasting and Planning publications in 2017. A further objective is to provide recommendations as to how the EV forecasts may be better integrated into the NEFR in future years to continually improve forecasting accuracy.
1.2 Objectives
The primary objective of this Electric Vehicles Insights paper is to use the forecasts of AEMO’s recently published 2016 National Electricity Forecasting Report (NEFR) as the basis for an impact assessment of the introduction of electric vehicles to Australia’s electricity supply system. In doing so, the paper aims to reduce the potential forecasting uncertainty within the main NEFR forecasts with respect to EV uptake.
Specifically the paper provides forecasts of EV uptake for each region of the NEM and the corresponding impact on annual electricity consumption and maximum and minimum demand as a result of charging of EVs from the grid.
1.3 Scope and Approach
The EV forecasts consider impacts from EVs taken up within the passenger vehicle sector only. The passenger sector includes passenger cars, sport utility vehicles and light commercial vehicles adopted across the private, commercial and government markets. The forecasts exclude any uptake of EVs in the heavy vehicle sector.
EV forecasts include both battery electric vehicles (BEVs) and plug-in hybrid vehicles (PHEVs) to the extent that they utilise the grid for charging. The forecasts exclude hybrid electric vehicles (HEVs) which do not charge from the grid.
1 Emerging Technologies Information Paper, National Electricity Forecasting Report Published: June 2015
Battery Electric Vehicle (BEV) – Powered only by energy stored in batteries with batteries charged by plugging into the grid.
Internal Combustion Engine Vehicle (ICE) – Represents the majority of private vehicles, powered by a standard internal combustion engine using petrol, diesel or gas.
Hybrid Electric Vehicle (HEV) – Combines both an ICE with an electric engine. The electrical energy is stored in a battery with the battery charged by the internal combustion engine. Battery capacity is generally limited. Vehicle propulsion is a mix of the ICE and electric engine, but is predominantly powered by the ICE. Does not take energy from the electricity grid.
Plug-in Hybrid Electric Vehicle (PHEV) – Combines both an ICE with an electric engine. Electrical energy is stored in batteries by plugging into the grid. Vehicle propulsion is a mix of the ICE and electric engine, but is predominantly powered by the electric engine. The ICE is used to extend driving range beyond battery capacity for longer distances and to recharge the battery itself.
Version 3.3 Page 7 of 53 August 2016
Energeia has used its third generation EV forecasting model (described further in Section 2), updated to align with AEMO’s NEFR assumptions regarding electricity prices as well as market and policy settings, to derive the results. Further specific EV assumptions were set in conjunction with AEMO as described in Section 3
1.4 Limitations
The EV forecasts contained throughout this paper are independent of the base NEFR forecasts. That is, there is
no feedback loop between the forecasted EV uptake and the corresponding response from either networks,
retailers or the wholesale market.
Further there are a range of future possibilities as to how the EV market will integrate with the existing solar
market and it is foreseeable that tariff products could evolve to encourage increased charging of EVs during solar
generation times. Such tariff products have not been considered in these forecasts and all EVs are assumed to
adopt existing products.
There is also likely to be some degree of interaction between solar PV, stationary battery storage and EVs at
individual customer premises. While AEMO has separately undertaken solar PV and battery storage forecasts,
these have not been integrated with the EV forecasts in this paper.
The forecasts include EV charging at home or fleet locations and do not include consideration of fast charging.
The household transport model upon which the EV forecast model relies is derived from the Queensland
Household Travel Survey. That is, while the model reflects different average driving distances between states, it
assumes that travel patterns (origins, destinations, arrival times and departure times) in all regions of Australia
are consistent with those of Queensland drivers.
The model derives its forecasts of uptake based partly on the financial return on investment to vehicles owners
owing to the increased vehicle premium and reduced operational costs. The model does not consider any costs
associated with any required upgrade to the household circuit although it is acknowledged that this may need to
occur in some circumstances to avoid overloading
While all due care has been taken in the preparation of this paper, Energeia has relied upon stakeholder
provided information as well as publically available data and information. To the extent these reliances have
been made, Energeia does not guarantee nor warrant the accuracy of this paper. Furthermore, neither Energeia
nor its Directors or employees will accept liability for any losses related to this paper arising from these reliances.
The forecasts derived from Energeia’s EV forecast model are supplied in good faith and reflect the knowledge,
expertise and experience of the consultants involved. Energeia does not warrant the accuracy of the model nor
accept any responsibility whatsoever for any loss occasioned by any person acting or refraining from action as a
result of reliance on the model. The model is for educational purposes only.

Version 3.3 Page 8 of 53 August 2016
2 EV Forecasting Model Overview
The following section provides an overview of the Energeia’s EV forecasting model. The model is part of Energeia’s broader energy system model, but has been extracted for the purposes of this study to identify the (non-integrated) impacts of electric vehicles on the energy system. Detailed assumptions are provided in Appendix A.
2.1 Overview
Energeia’s EV forecasting model is comprised of two parts, EV uptake and EV charging as shown in Figure 5 below.
Figure 5 – Energeia EV Forecasting Model
Source: Energeia
The EV uptake component drives the forecasts of EV uptake as a percentage of annual vehicle sales for each category of vehicle type. This is based on vehicle model availability and the vehicle owner’s return on investment. The EV charging component then applies a charging regime to each vehicle adopted based on the arrival and departure time of the vehicle at the point of charge, the number of kilometres travelled and any incentives or restrictions of the prevailing tariff.
The model considers 45 categories of vehicle types including all combinations of:
Vehicle Markets
o Commercial
o Private
o Government
Vehicle class
o Passenger Car Large (PC-L)
o Passenger Car Medium (PC-M)
o Passenger Car Small (PC-S)
o Sport Utility Vehicle (SUV)
0%
2%
4%
6%
8%
10%
20
16
20
18
20
20
20
22
20
24
20
26
20
28
20
30
Policy Settings
Return on Investment
Vehicle Cost
Premiums
Model Availability
Driving Distances
Petrol/ Electricity
Prices
Vehicle Efficiency
Maint. Costs
Charging Profile
Arrival Time
Diversity
Driving Distance Diversity
Tariff Structure
Charging Rate
Home vs Work
Charging
EV uptake (as % of annual sales)
Categories
PHEV/BEV/ICE
PC-LPC-MPC-SSUV
Comm
Total Annual Sales (all vehicles)
EV Cons. Profile Regions
QLDNSWACTVICSATASWA
Version 3.3 Page 9 of 53 August 2016
o Light Commercial (LC)
Vehicle Technologies
o Battery Electric Vehicle (BEV)
o Plug-in Hybrid Electric Vehicle (PHEV)
o Internal Combustion Engine (ICE)
Each of these categories have specific characteristics which drive both uptake and charging.
2.2 EV Uptake
EV uptake is determined by a two-parameter function that describes vehicle uptake over time based on:
Model Availability: The percentage of models within a given vehicle class available in EV form
Return on Investment: The first year return to the vehicle owner investing in an EV in terms of reduced
operational costs (fuel and costs) on the premium paid compared to a conventional ICE vehicle
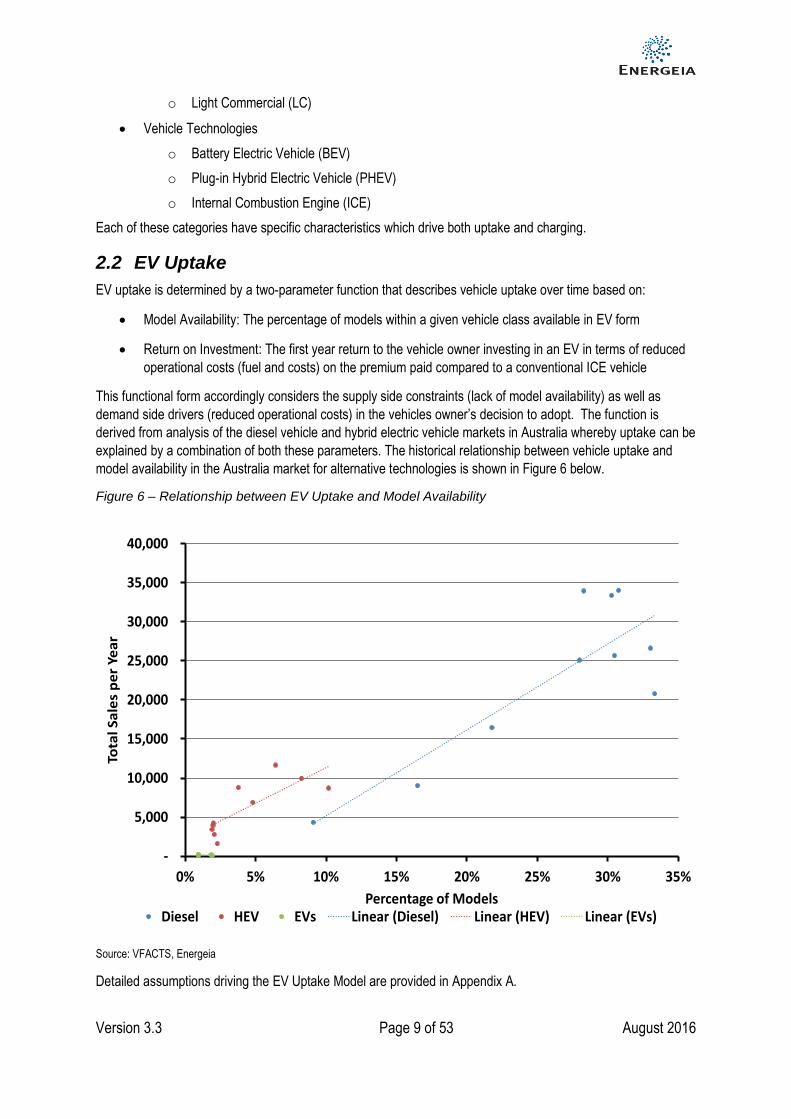
This functional form accordingly considers the supply side constraints (lack of model availability) as well as
demand side drivers (reduced operational costs) in the vehicles owner’s decision to adopt. The function is
derived from analysis of the diesel vehicle and hybrid electric vehicle markets in Australia whereby uptake can be
explained by a combination of both these parameters. The historical relationship between vehicle uptake and
model availability in the Australia market for alternative technologies is shown in Figure 6 below.
Figure 6 – Relationship between EV Uptake and Model Availability
Source: VFACTS, Energeia
Detailed assumptions driving the EV Uptake Model are provided in Appendix A.
-
5,000
10,000
15,000
20,000
25,000
30,000
35,000
40,000
0% 5% 10% 15% 20% 25% 30% 35%
Tota
l S
ale
s p
er
Yea
r
Percentage of ModelsDiesel HEV EVs Linear (Diesel) Linear (HEV) Linear (EVs)

Version 3.3 Page 10 of 53 August 2016
2.3 EV Charging
The EV charging profile is determined by aggregating the unique charging profile of each individual electric vehicle adopted. The individual profiles are assigned based on:
Whether the vehicle is assigned as home charging or fleet charging (charges at work or depot location)
The daily travel distance for both weekday and weekend travel (drawn from a database of regionally specific diversified travel distances), which determines the amount of charge to be supplied by day type
An arrival time for both weekday and weekend travel (drawn from a database of diversified times specific to either home charging or fleet charging) which dictates when charging starts, in the absence of any other tariff restrictions
A departure time for both weekday and weekend travel (drawn from a database of diversified times specific to either home charging or fleet charging) which dictates when charging must cease in the absence of any other tariff restrictions
The prevailing tariff and the extent to which it restricts or incentivises charging during certain times. For home charging this is assumed to be the existing controlled load tariff specific to each region generally allowing for charging overnight only, and for fleet charging this is assumed to be the standard business tariff specific to each region without charging restrictions
Detailed assumptions driving the EV charging profiles are provided in Appendix A.
3 Sensitivities
The EV forecasting compares three sensitivities that represent the probable pathway for Australia across weak, neutral (considered the most likely), and strong economic and consumer outlooks aligned with AEMO’s broader NEFR sensitivities. The results for the neutral sensitivity are the focus of this paper.
3.1 NEFR Sensitivities
AEMO’s 2016 NEFR uses the terms “weak”, “neutral”, and “strong” throughout the 2016 NEFR documents to identify the three sensitivities with the neutral sensitivity considered the most likely (P50). The weak and strong sensitivities are based on dynamics affecting the total energy consumption of households and businesses and are not necessarily a low and high outcome for the consumption of grid-supplied energy, but rather an internally consistent set of assumptions aligned to strong and weak economies and associated consumer sentiment. The key characteristics of these sensitivities of relevance to EVs are shown in Table 1.
Version 3.3 Page 11 of 53 August 2016
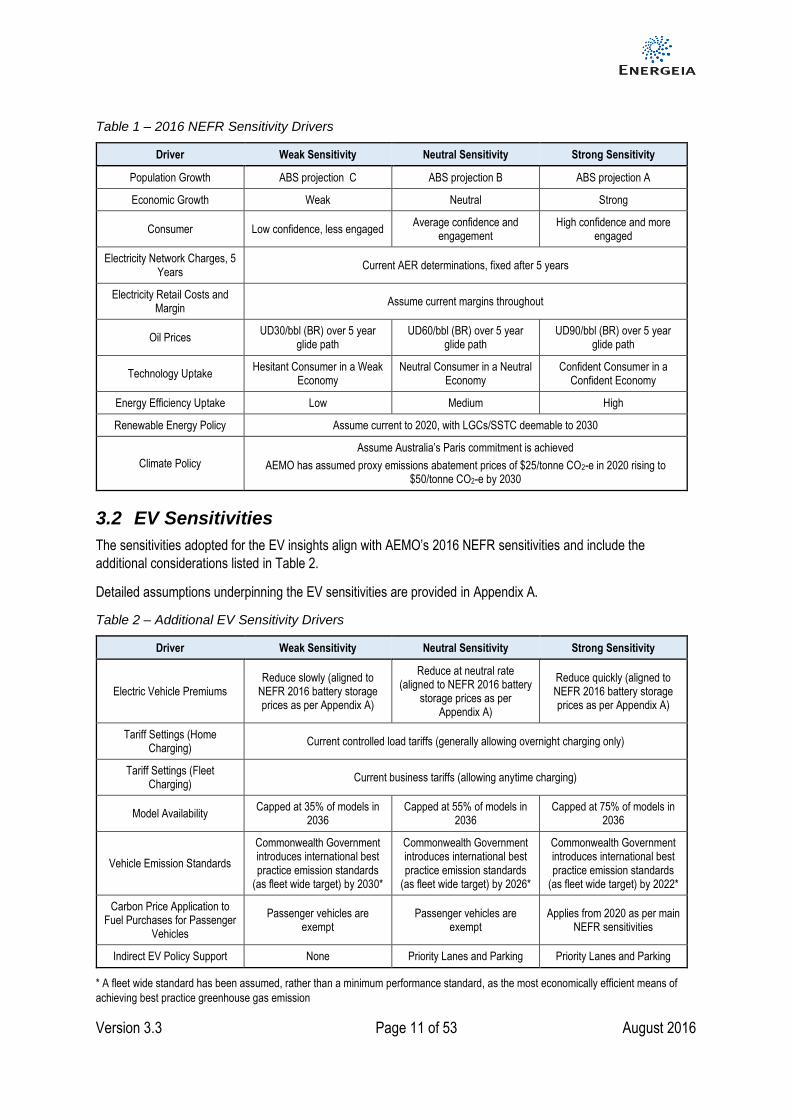
Table 1 – 2016 NEFR Sensitivity Drivers
Driver Weak Sensitivity Neutral Sensitivity Strong Sensitivity
Population Growth ABS projection C ABS projection B ABS projection A
Economic Growth Weak Neutral Strong
Consumer Low confidence, less engaged Average confidence and
engagement High confidence and more
engaged
Electricity Network Charges, 5 Years
Current AER determinations, fixed after 5 years
Electricity Retail Costs and Margin
Assume current margins throughout
Oil Prices UD30/bbl (BR) over 5 year
glide path UD60/bbl (BR) over 5 year
glide path UD90/bbl (BR) over 5 year
glide path
Technology Uptake Hesitant Consumer in a Weak
Economy Neutral Consumer in a Neutral
Economy Confident Consumer in a
Confident Economy
Energy Efficiency Uptake Low Medium High
Renewable Energy Policy Assume current to 2020, with LGCs/SSTC deemable to 2030
Climate Policy
Assume Australia’s Paris commitment is achieved
AEMO has assumed proxy emissions abatement prices of $25/tonne CO2-e in 2020 rising to $50/tonne CO2-e by 2030
3.2 EV Sensitivities
The sensitivities adopted for the EV insights align with AEMO’s 2016 NEFR sensitivities and include the
additional considerations listed in Table 2.
Detailed assumptions underpinning the EV sensitivities are provided in Appendix A.
Table 2 – Additional EV Sensitivity Drivers
Driver Weak Sensitivity Neutral Sensitivity Strong Sensitivity
Electric Vehicle Premiums Reduce slowly (aligned to
NEFR 2016 battery storage prices as per Appendix A)
Reduce at neutral rate (aligned to NEFR 2016 battery
storage prices as per Appendix A)
Reduce quickly (aligned to NEFR 2016 battery storage prices as per Appendix A)
Tariff Settings (Home Charging)
Current controlled load tariffs (generally allowing overnight charging only)
Tariff Settings (Fleet Charging)
Current business tariffs (allowing anytime charging)
Model Availability Capped at 35% of models in
2036 Capped at 55% of models in
2036 Capped at 75% of models in
2036
Vehicle Emission Standards
Commonwealth Government introduces international best practice emission standards
(as fleet wide target) by 2030*
Commonwealth Government introduces international best practice emission standards
(as fleet wide target) by 2026*
Commonwealth Government introduces international best practice emission standards
(as fleet wide target) by 2022*
Carbon Price Application to Fuel Purchases for Passenger
Vehicles
Passenger vehicles are exempt
Passenger vehicles are exempt
Applies from 2020 as per main NEFR sensitivities
Indirect EV Policy Support None Priority Lanes and Parking Priority Lanes and Parking
* A fleet wide standard has been assumed, rather than a minimum performance standard, as the most economically efficient means of
achieving best practice greenhouse gas emission
Version 3.3 Page 12 of 53 August 2016
4 Results
The results shown below describe forecast EV uptake over the period between 2016 and 2036 and the corresponding contribution to energy consumption and both maximum and minimum demand. The results are presented for the neutral sensitivity unless otherwise indicated.
4.1 EV Uptake Forecasts
Section 4.1 presents uptake of electric vehicles in terms of both annual sales and number of vehicles on the road (stock).
4.1.1 NEM
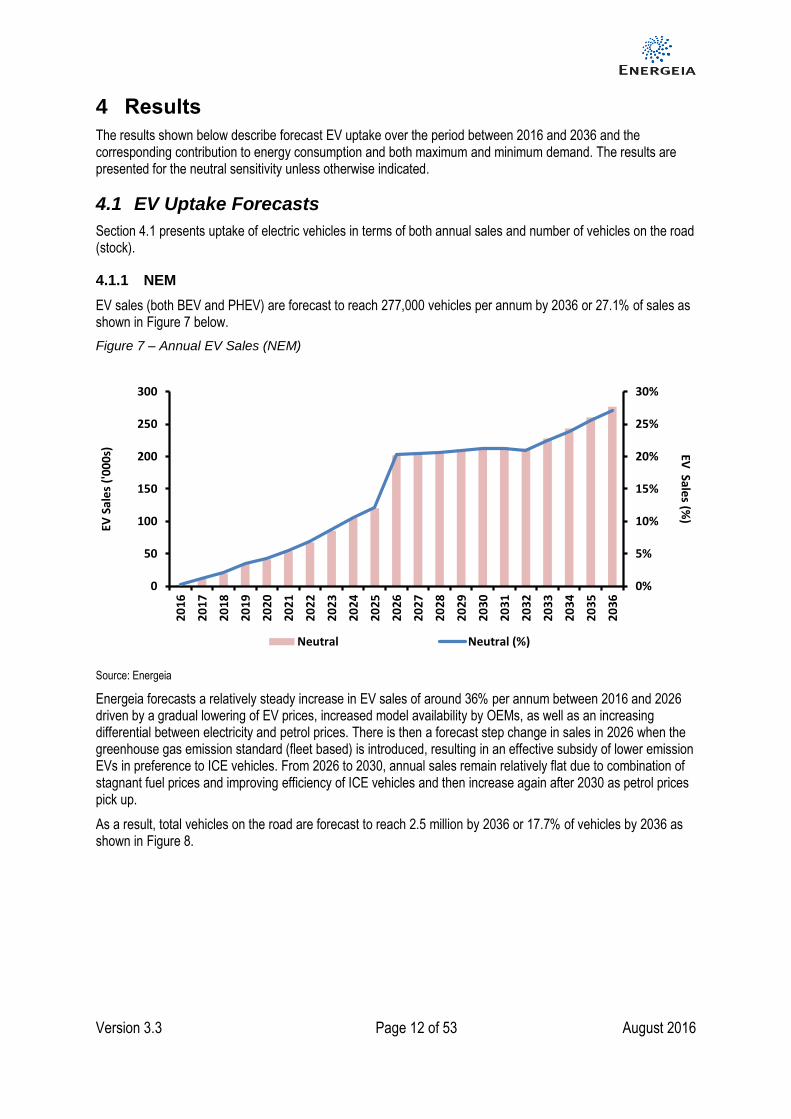
EV sales (both BEV and PHEV) are forecast to reach 277,000 vehicles per annum by 2036 or 27.1% of sales as shown in Figure 7 below.
Figure 7 – Annual EV Sales (NEM)
Source: Energeia
Energeia forecasts a relatively steady increase in EV sales of around 36% per annum between 2016 and 2026 driven by a gradual lowering of EV prices, increased model availability by OEMs, as well as an increasing differential between electricity and petrol prices. There is then a forecast step change in sales in 2026 when the greenhouse gas emission standard (fleet based) is introduced, resulting in an effective subsidy of lower emission EVs in preference to ICE vehicles. From 2026 to 2030, annual sales remain relatively flat due to combination of stagnant fuel prices and improving efficiency of ICE vehicles and then increase again after 2030 as petrol prices pick up.
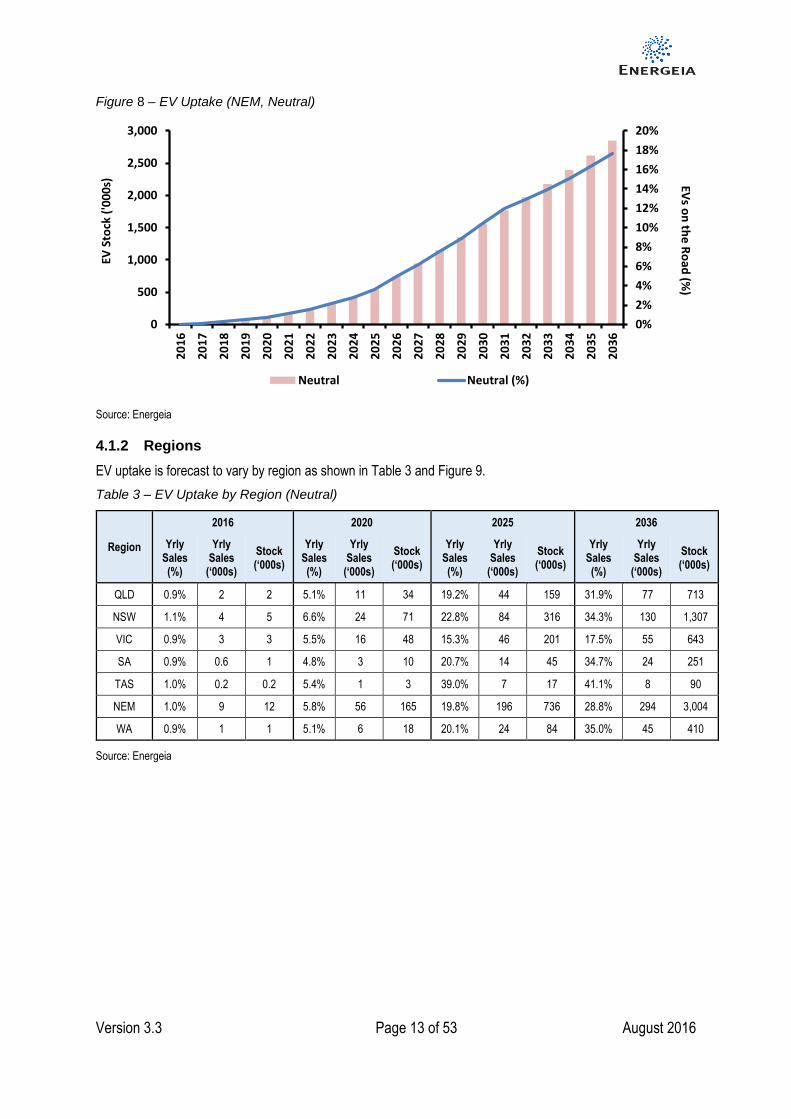
As a result, total vehicles on the road are forecast to reach 2.5 million by 2036 or 17.7% of vehicles by 2036 as shown in Figure 8.
0%
5%
10%
15%
20%
25%
30%
20
16
20
17
20
18
20
19
20
20
20
21
20
22
20
23
20
24
20
25
20
26
20
27
20
28
20
29
20
30
20
31
20
32
20
33
20
34
20
35
20
36
0
50
100
150
200
250
300
EV Sale
s (%)
EV S
ale
s ('
00
0s)
Neutral Neutral (%)
Version 3.3 Page 13 of 53 August 2016
Figure 8 – EV Uptake (NEM, Neutral)
Source: Energeia
4.1.2 Regions
EV uptake is forecast to vary by region as shown in Table 3 and Figure 9.
Table 3 – EV Uptake by Region (Neutral)
Region
2016 2020 2025 2036
Yrly Sales (%)
Yrly Sales
(‘000s)
Stock (‘000s)
Yrly Sales (%)
Yrly Sales
(‘000s)
Stock (‘000s)
Yrly Sales (%)
Yrly Sales
(‘000s)
Stock (‘000s)
Yrly Sales (%)
Yrly Sales
(‘000s)
Stock (‘000s)
QLD 0.9% 2 2 5.1% 11 34 19.2% 44 159 31.9% 77 713
NSW 1.1% 4 5 6.6% 24 71 22.8% 84 316 34.3% 130 1,307
VIC 0.9% 3 3 5.5% 16 48 15.3% 46 201 17.5% 55 643
SA 0.9% 0.6 1 4.8% 3 10 20.7% 14 45 34.7% 24 251
TAS 1.0% 0.2 0.2 5.4% 1 3 39.0% 7 17 41.1% 8 90
NEM 1.0% 9 12 5.8% 56 165 19.8% 196 736 28.8% 294 3,004
WA 0.9% 1 1 5.1% 6 18 20.1% 24 84 35.0% 45 410
Source: Energeia
0%
2%
4%
6%
8%
10%
12%
14%
16%
18%
20%
20
16
20
17
20
18
20
19
20
20
20
21
20
22
20
23
20
24
20
25
20
26
20
27
20
28
20
29
20
30
20
31
20
32
20
33
20
34
20
35
20
36
0
500
1,000
1,500
2,000
2,500
3,000
EVs o
n th
e R
oad
(%)
EV S
tock
('0
00
s)
Neutral Neutral (%)

Version 3.3 Page 14 of 53 August 2016
Figure 9 – EV Uptake by Region (Neutral)
Source: Energeia
Absolute number of EVs on the road is predominantly driven by market size. Beyond this, uptake also varies due to the relative differential between petrol prices and electricity prices in each state, with NSW having the greatest differential due to its relatively low priced controlled load tariff. Then, from 2026, upon the introduction of the fleet based greenhouse gas emissions standard, EV sales are in particular encouraged in regions with a lower emission intensity of grid electricity such as Tasmania and South Australia driving relatively higher uptake in these regions.
4.1.3 Sensitivities
Forecasts of EV uptake vary significantly for the weak and strong sensitivities as shown in Table 4, Figure 10 and Figure 11 below for the NEM. Detailed results by region and sensitivity are presented in Appendix B.
Table 4 – EV Uptake by Sensitivity (NEM)
Sens.
2016 2020 2025 2036
Yrly Sales (%)
Yrly Sales
(‘000s)
Stock (‘000s)
Yrly Sales (%)
Yrly Sales
(‘000s)
Stock (‘000s)
Yrly Sales (%)
Yrly Sales
(‘000s)
Stock (‘000s)
Yrly Sales (%)
Yrly Sales
(‘000s)
Stock (‘000s)
Strong 1.4% 13 13 15.1% 147 338 27.0% 269 1,471 44.6% 464 5,180
Neutral 1.0% 9 9 5.8% 56 165 19.8% 196 736 28.8% 294 3,004
Weak 0.6% 6 6 2.8% 27 84 6.5% 64 323 15.8% 160 1,621
Source: Energeia
0%
5%
10%
15%
20%
25%
30%
EVs
on
th
e R
oad
(%
)
QLD TAS SA WA VIC NSW/ACT

Version 3.3 Page 15 of 53 August 2016
Figure 10 – EV Annual Sales by Sensitivity (NEM)
Source: Energeia
In the strong sensitivity, EV sales initially increase at a faster rate than both the neutral or weak sensitivity due to an oil price translating to higher price differential between petrol and electricity, as well as a faster rate of decline in EV price premium and battery storage prices. Under the strong sensitivity, the sales rate further accelerates from 2022 due to the introduction of both a fleet wide greenhouse gas emission standard and a carbon price on petrol from 2020. As a result, by 2036, forecast EV stock under the strong sensitivity reaches 5.25 million vehicles, 84% higher than the neutral sensitivity.
In the weak sensitivity, EV sales increase gradually over time mostly driven by a slower decline in EV price premiums and battery storage prices, keeping the price differential between electricity and petrol relatively stable. The main impact on EV uptake then occurs in 2030 when the fleet based emission greenhouse gas standard is introduced, which has a larger effect than in other sensitivities due to the absence of other factors. As a result, by 2036, forecast EV stock in the weak sensitivity reaches almost 1.4 million vehicles, 51% lower than the neutral sensitivity.
Figure 11 –EV Uptake by Sensitivity (NEM)
Source: Energeia
0%
5%
10%
15%
20%
25%
30%
35%
40%
45%
50%
20
16
20
17
20
18
20
19
20
20
20
21
20
22
20
23
20
24
20
25
20
26
20
27
20
28
20
29
20
30
20
31
20
32
20
33
20
34
20
35
20
36
0
50
100
150
200
250
300
350
400
450
500
EV Sale
s (%)
EV S
ale
s ('
00
0s)
Strong Neutral WeakStrong (%) Neutral (%) Weak (%)
0%
5%
10%
15%
20%
25%
30%
35%
20
16
20
17
20
18
20
19
20
20
20
21
20
22
20
23
20
24
20
25
20
26
20
27
20
28
20
29
20
30
20
31
20
32
20
33
20
34
20
35
20
36
0
1,000
2,000
3,000
4,000
5,000
6,000
EVs o
n th
e R
oad
(%)
EV S
tock
('0
00
s)
Strong Neutral WeakStrong (%) Neutral (%) Weak (%)
Version 3.3 Page 16 of 53 August 2016
4.2 EV Consumption Forecasts
Section 4.2 presents the forecasts for grid electricity consumption from EV charging associated with EV uptake and assesses the impact of these on the 2016 NEFR forecasts prepared by AEMO. All of the forecasts present electricity consumption in terms of operational requirements (including losses).
4.2.1 NEM
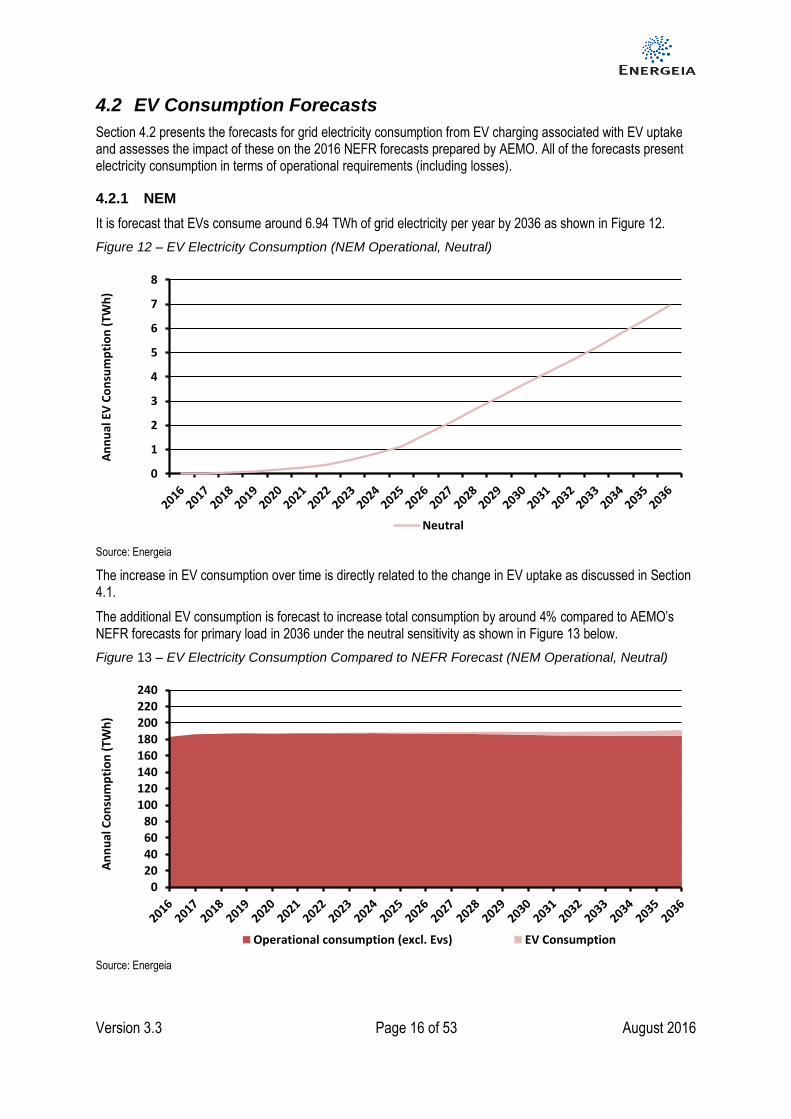
It is forecast that EVs consume around 6.94 TWh of grid electricity per year by 2036 as shown in Figure 12.
Figure 12 – EV Electricity Consumption (NEM Operational, Neutral)
Source: Energeia
The increase in EV consumption over time is directly related to the change in EV uptake as discussed in Section 4.1.
The additional EV consumption is forecast to increase total consumption by around 4% compared to AEMO’s NEFR forecasts for primary load in 2036 under the neutral sensitivity as shown in Figure 13 below.
Figure 13 – EV Electricity Consumption Compared to NEFR Forecast (NEM Operational, Neutral)
Source: Energeia
0
1
2
3
4
5
6
7
8
An
nu
al E
V C
on
sum
pti
on
(TW
h)
Neutral
020406080
100120140160180200220240
An
nu
al C
on
sum
pti
on
(TW
h)
Operational consumption (excl. Evs) EV Consumption
Version 3.3 Page 17 of 53 August 2016
4.2.2 Regions
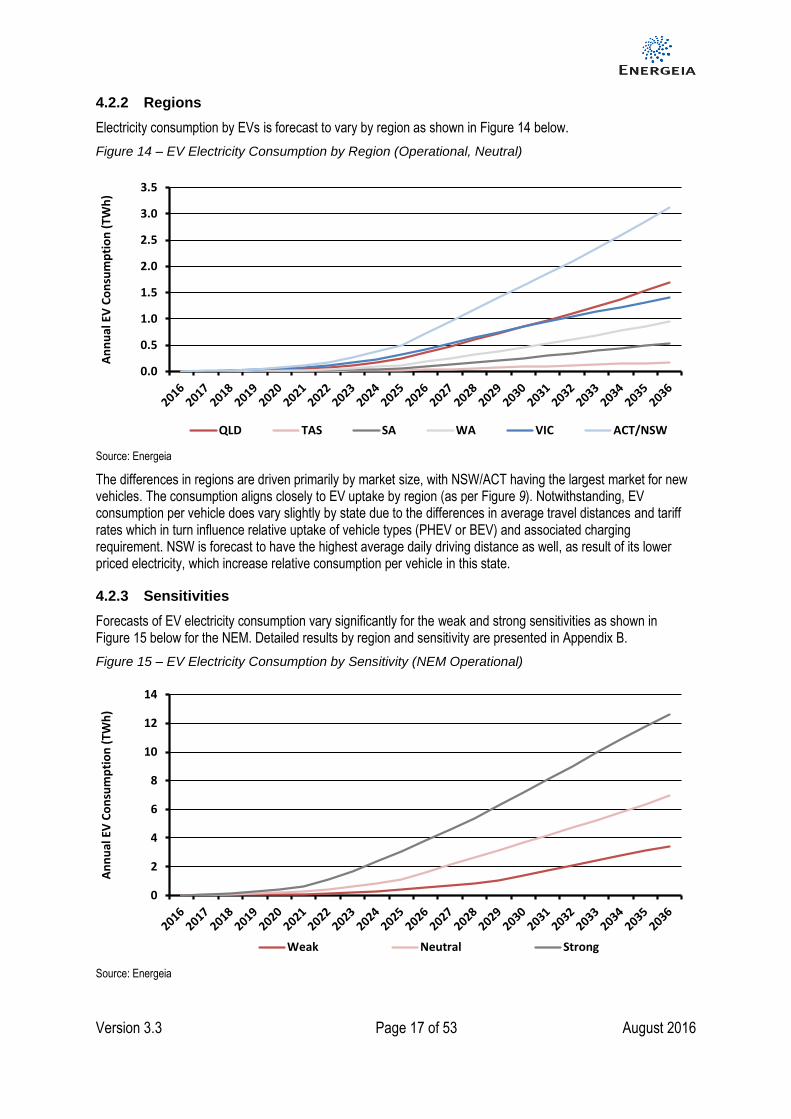
Electricity consumption by EVs is forecast to vary by region as shown in Figure 14 below.
Figure 14 – EV Electricity Consumption by Region (Operational, Neutral)
Source: Energeia
The differences in regions are driven primarily by market size, with NSW/ACT having the largest market for new vehicles. The consumption aligns closely to EV uptake by region (as per Figure 9). Notwithstanding, EV consumption per vehicle does vary slightly by state due to the differences in average travel distances and tariff rates which in turn influence relative uptake of vehicle types (PHEV or BEV) and associated charging requirement. NSW is forecast to have the highest average daily driving distance as well, as result of its lower priced electricity, which increase relative consumption per vehicle in this state.
4.2.3 Sensitivities
Forecasts of EV electricity consumption vary significantly for the weak and strong sensitivities as shown in Figure 15 below for the NEM. Detailed results by region and sensitivity are presented in Appendix B.
Figure 15 – EV Electricity Consumption by Sensitivity (NEM Operational)
Source: Energeia
0.0
0.5
1.0
1.5
2.0
2.5
3.0
3.5
An
nu
al E
V C
on
sum
pti
on
(TW
h)
QLD TAS SA WA VIC ACT/NSW
0
2
4
6
8
10
12
14
An
nu
al E
V C
on
sum
pti
on
(TW
h)
Weak Neutral Strong
Version 3.3 Page 18 of 53 August 2016
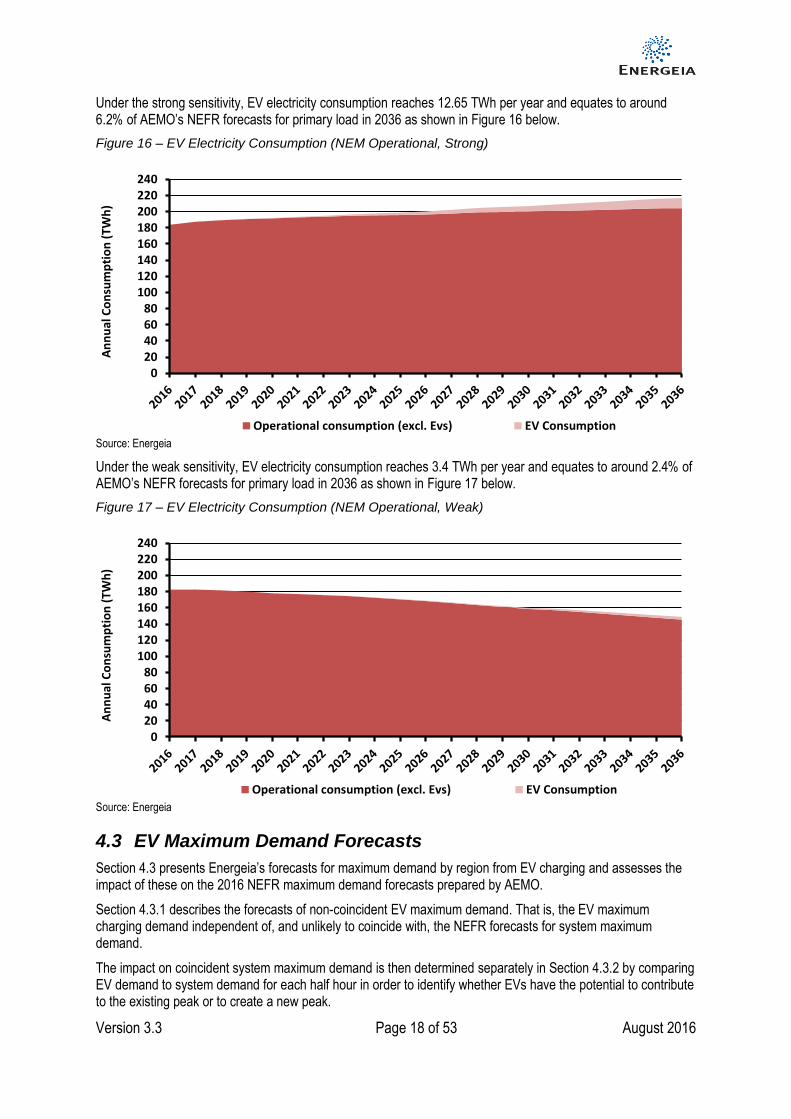
Under the strong sensitivity, EV electricity consumption reaches 12.65 TWh per year and equates to around 6.2% of AEMO’s NEFR forecasts for primary load in 2036 as shown in Figure 16 below.
Figure 16 – EV Electricity Consumption (NEM Operational, Strong)
Source: Energeia
Under the weak sensitivity, EV electricity consumption reaches 3.4 TWh per year and equates to around 2.4% of AEMO’s NEFR forecasts for primary load in 2036 as shown in Figure 17 below.
Figure 17 – EV Electricity Consumption (NEM Operational, Weak)
Source: Energeia
4.3 EV Maximum Demand Forecasts
Section 4.3 presents Energeia’s forecasts for maximum demand by region from EV charging and assesses the impact of these on the 2016 NEFR maximum demand forecasts prepared by AEMO.
Section 4.3.1 describes the forecasts of non-coincident EV maximum demand. That is, the EV maximum charging demand independent of, and unlikely to coincide with, the NEFR forecasts for system maximum demand.
The impact on coincident system maximum demand is then determined separately in Section 4.3.2 by comparing EV demand to system demand for each half hour in order to identify whether EVs have the potential to contribute to the existing peak or to create a new peak.
020406080
100120140160180200220240
An
nu
al C
on
sum
pti
on
(TW
h)
Operational consumption (excl. Evs) EV Consumption
020406080
100120140160180200220240
An
nu
al C
on
sum
pti
on
(TW
h)
Operational consumption (excl. Evs) EV Consumption
Version 3.3 Page 19 of 53 August 2016
All of the forecasts present maximum demand in terms of operational requirements (including losses).
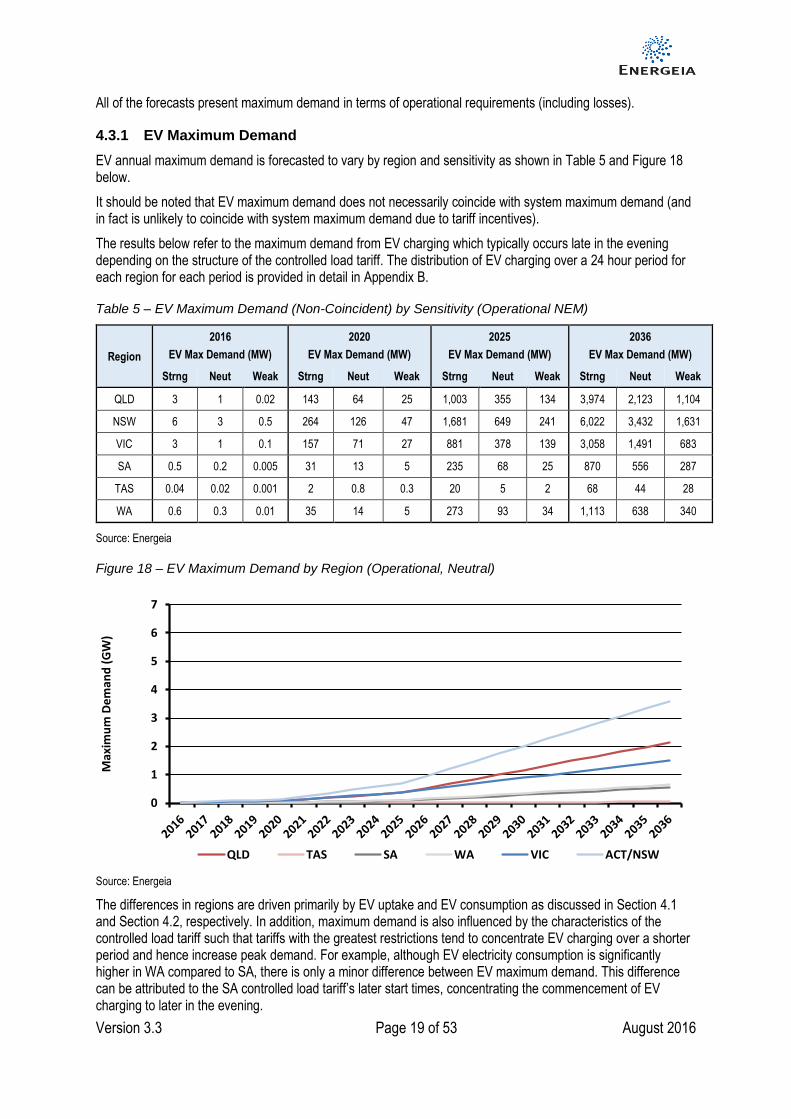
4.3.1 EV Maximum Demand
EV annual maximum demand is forecasted to vary by region and sensitivity as shown in Table 5 and Figure 18 below.
It should be noted that EV maximum demand does not necessarily coincide with system maximum demand (and in fact is unlikely to coincide with system maximum demand due to tariff incentives).
The results below refer to the maximum demand from EV charging which typically occurs late in the evening depending on the structure of the controlled load tariff. The distribution of EV charging over a 24 hour period for each region for each period is provided in detail in Appendix B.
Table 5 – EV Maximum Demand (Non-Coincident) by Sensitivity (Operational NEM)
Region
2016
EV Max Demand (MW)
2020
EV Max Demand (MW)
2025
EV Max Demand (MW)
2036
EV Max Demand (MW)
Strng Neut Weak Strng Neut Weak Strng Neut Weak Strng Neut Weak
QLD 3 1 0.02 143 64 25 1,003 355 134 3,974 2,123 1,104
NSW 6 3 0.5 264 126 47 1,681 649 241 6,022 3,432 1,631
VIC 3 1 0.1 157 71 27 881 378 139 3,058 1,491 683
SA 0.5 0.2 0.005 31 13 5 235 68 25 870 556 287
TAS 0.04 0.02 0.001 2 0.8 0.3 20 5 2 68 44 28
WA 0.6 0.3 0.01 35 14 5 273 93 34 1,113 638 340
Source: Energeia
Figure 18 – EV Maximum Demand by Region (Operational, Neutral)
Source: Energeia
The differences in regions are driven primarily by EV uptake and EV consumption as discussed in Section 4.1 and Section 4.2, respectively. In addition, maximum demand is also influenced by the characteristics of the controlled load tariff such that tariffs with the greatest restrictions tend to concentrate EV charging over a shorter period and hence increase peak demand. For example, although EV electricity consumption is significantly higher in WA compared to SA, there is only a minor difference between EV maximum demand. This difference can be attributed to the SA controlled load tariff’s later start times, concentrating the commencement of EV charging to later in the evening.
0
1
2
3
4
5
6
7
Max
imu
m D
em
and
(G
W)
QLD TAS SA WA VIC ACT/NSW

Version 3.3 Page 20 of 53 August 2016
Figure 19 and Figure 20 show EV maximum demand by sensitivity.
Figure 19 – EV Maximum Demand by Region (Operational, Strong)
Source: Energeia
By 2036, EV maximum demand under the strong sensitivity is between 53% and 105% greater than under the neutral sensitivity, depending on region, due to the higher EV uptake.
Figure 20 – EV Maximum Demand by Region (Operational, Weak)
Source: Energeia
By 2036, EV maximum demand under the weak sensitivity is between 38% and 54% less than under the neutral sensitivity, depending on region, due to the lower EV uptake.
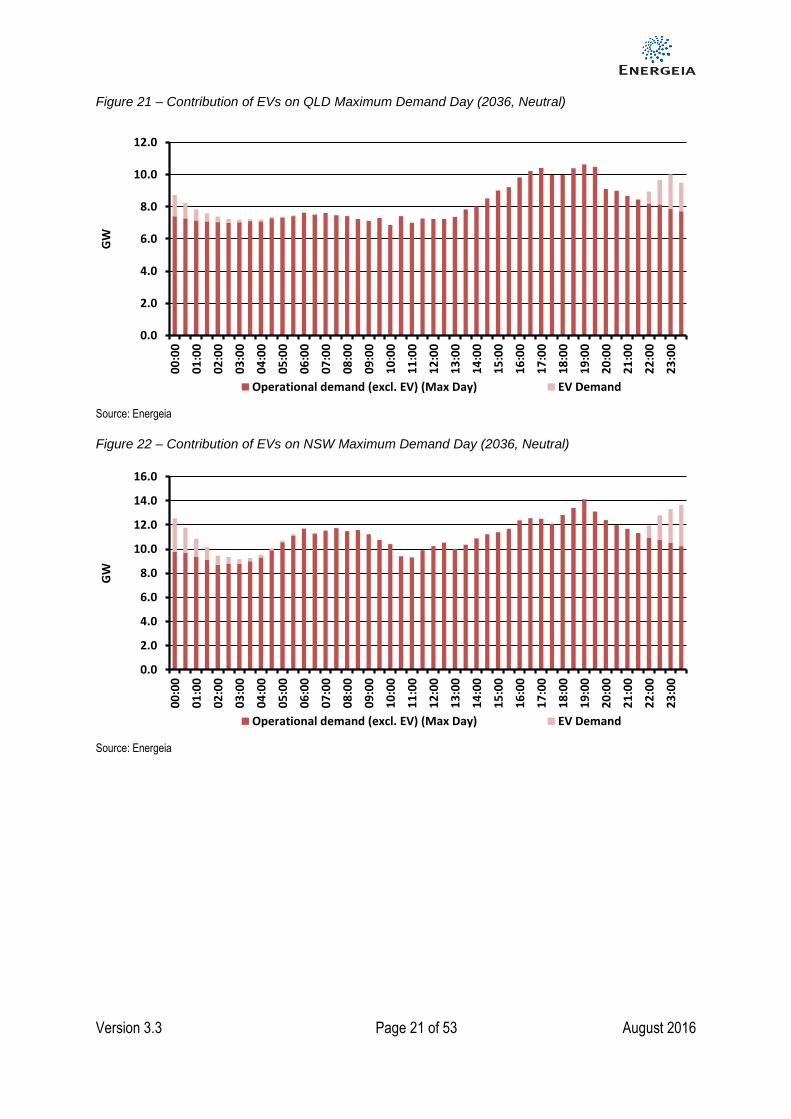
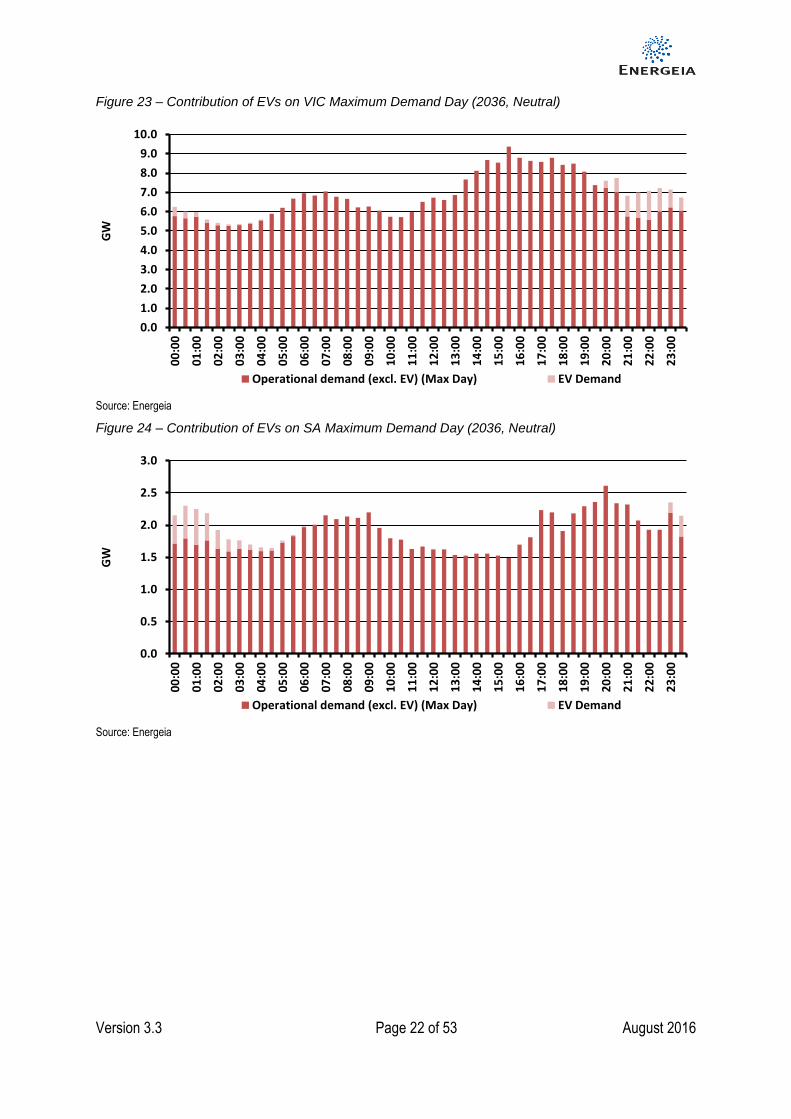
4.3.2 Impact on NEFR Maximum Demand
It is forecasted that EVs will not cause any increase in maximum demand for any of the regions over the period 2015 to 2036. Figure 21 to Figure 25 show the contribution of EVs on the NEFR maximum demand day for each region2 for the neutral sensitivity.
2 Not available for Western Australia
0
1
2
3
4
5
6
7
Max
imu
m D
em
and
(G
W)
QLD TAS SA WA VIC ACT/NSW
0
1
2
3
4
5
6
7
Max
imu
m D
em
and
(G
W)
QLD TAS SA WA VIC ACT/NSW
Version 3.3 Page 21 of 53 August 2016
Figure 21 – Contribution of EVs on QLD Maximum Demand Day (2036, Neutral)
Source: Energeia
Figure 22 – Contribution of EVs on NSW Maximum Demand Day (2036, Neutral)
Source: Energeia
0.0
2.0
4.0
6.0
8.0
10.0
12.0
00
:00
01
:00
02
:00
03
:00
04
:00
05
:00
06
:00
07
:00
08
:00
09
:00
10
:00
11
:00
12
:00
13
:00
14
:00
15
:00
16
:00
17
:00
18
:00
19
:00
20
:00
21
:00
22
:00
23
:00
GW
Operational demand (excl. EV) (Max Day) EV Demand
0.0
2.0
4.0
6.0
8.0
10.0
12.0
14.0
16.0
00
:00
01
:00
02
:00
03
:00
04
:00
05
:00
06
:00
07
:00
08
:00
09
:00
10
:00
11
:00
12
:00
13
:00
14
:00
15
:00
16
:00
17
:00
18
:00
19
:00
20
:00
21
:00
22
:00
23
:00
GW
Operational demand (excl. EV) (Max Day) EV Demand
Version 3.3 Page 22 of 53 August 2016
Figure 23 – Contribution of EVs on VIC Maximum Demand Day (2036, Neutral)
Source: Energeia
Figure 24 – Contribution of EVs on SA Maximum Demand Day (2036, Neutral)
Source: Energeia
0.0
1.0
2.0
3.0
4.0
5.0
6.0
7.0
8.0
9.0
10.0
00
:00
01
:00
02
:00
03
:00
04
:00
05
:00
06
:00
07
:00
08
:00
09
:00
10
:00
11
:00
12
:00
13
:00
14
:00
15
:00
16
:00
17
:00
18
:00
19
:00
20
:00
21
:00
22
:00
23
:00
GW
Operational demand (excl. EV) (Max Day) EV Demand
0.0
0.5
1.0
1.5
2.0
2.5
3.0
00
:00
01
:00
02
:00
03
:00
04
:00
05
:00
06
:00
07
:00
08
:00
09
:00
10
:00
11
:00
12
:00
13
:00
14
:00
15
:00
16
:00
17
:00
18
:00
19
:00
20
:00
21
:00
22
:00
23
:00
GW
Operational demand (excl. EV) (Max Day) EV Demand
Version 3.3 Page 23 of 53 August 2016
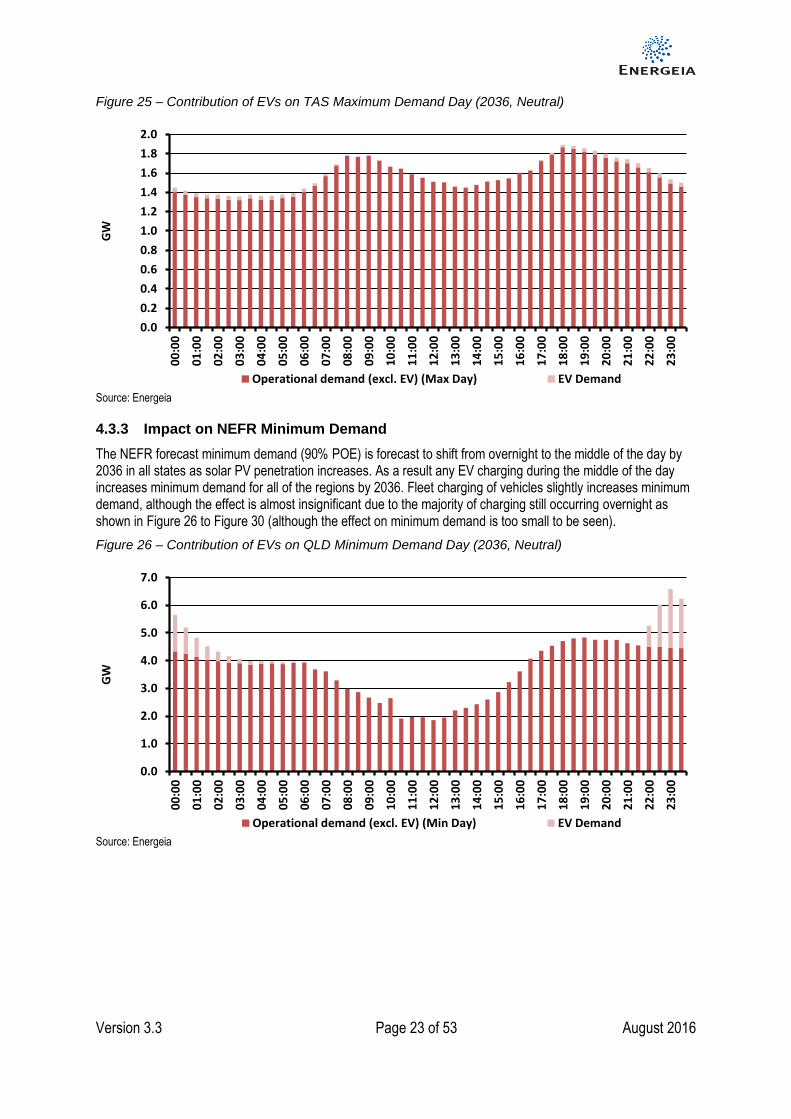
Figure 25 – Contribution of EVs on TAS Maximum Demand Day (2036, Neutral)
Source: Energeia
4.3.3 Impact on NEFR Minimum Demand
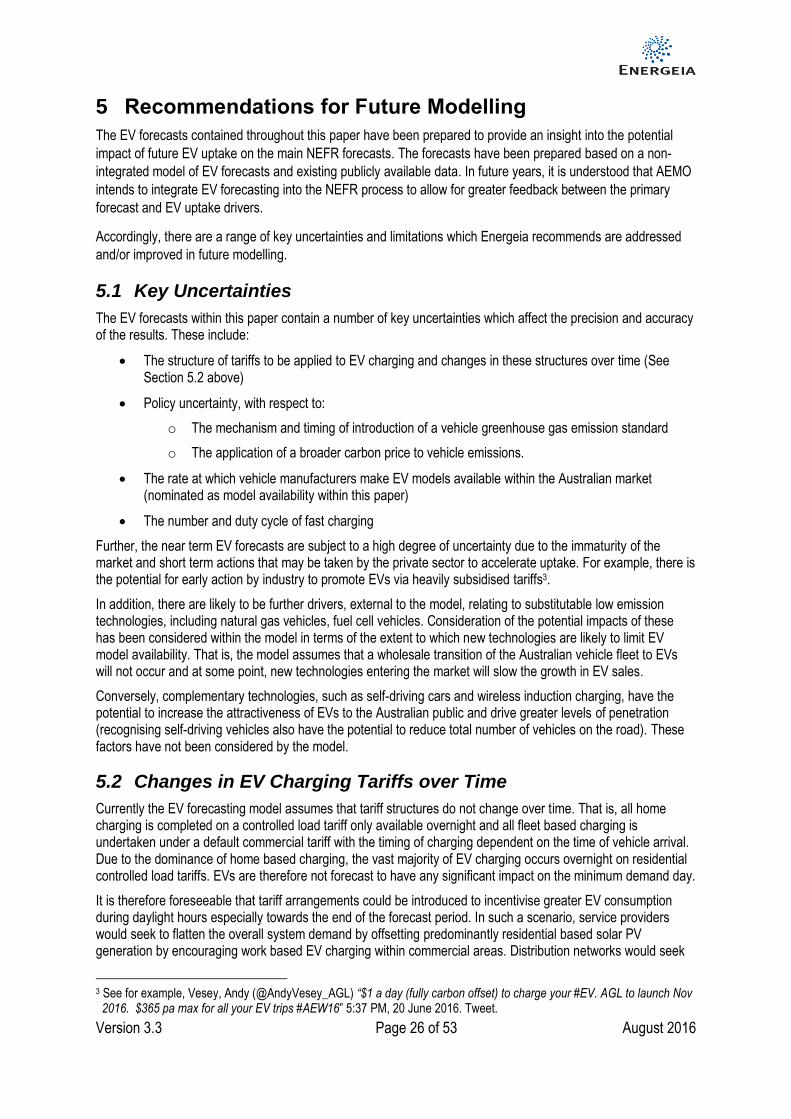
The NEFR forecast minimum demand (90% POE) is forecast to shift from overnight to the middle of the day by 2036 in all states as solar PV penetration increases. As a result any EV charging during the middle of the day increases minimum demand for all of the regions by 2036. Fleet charging of vehicles slightly increases minimum demand, although the effect is almost insignificant due to the majority of charging still occurring overnight as shown in Figure 26 to Figure 30 (although the effect on minimum demand is too small to be seen).
Figure 26 – Contribution of EVs on QLD Minimum Demand Day (2036, Neutral)
Source: Energeia
0.0
0.2
0.4
0.6
0.8
1.0
1.2
1.4
1.6
1.8
2.0
00
:00
01
:00
02
:00
03
:00
04
:00
05
:00
06
:00
07
:00
08
:00
09
:00
10
:00
11
:00
12
:00
13
:00
14
:00
15
:00
16
:00
17
:00
18
:00
19
:00
20
:00
21
:00
22
:00
23
:00
GW
Operational demand (excl. EV) (Max Day) EV Demand
0.0
1.0
2.0
3.0
4.0
5.0
6.0
7.0
00
:00
01
:00
02
:00
03
:00
04
:00
05
:00
06
:00
07
:00
08
:00
09
:00
10
:00
11
:00
12
:00
13
:00
14
:00
15
:00
16
:00
17
:00
18
:00
19
:00
20
:00
21
:00
22
:00
23
:00
GW
Operational demand (excl. EV) (Min Day) EV Demand

Version 3.3 Page 24 of 53 August 2016
Figure 27 – Contribution of EVs on NSW Minimum Demand Day (2036, Neutral)
Source: Energeia
Figure 28 – Contribution of EVs on VIC Minimum Demand Day (2036, Neutral)
Source: Energeia
0.0
1.0
2.0
3.0
4.0
5.0
6.0
7.0
8.0
9.0
10.0
00
:00
01
:00
02
:00
03
:00
04
:00
05
:00
06
:00
07
:00
08
:00
09
:00
10
:00
11
:00
12
:00
13
:00
14
:00
15
:00
16
:00
17
:00
18
:00
19
:00
20
:00
21
:00
22
:00
23
:00
GW
Operational demand (excl. EV) (Min Day) EV Demand
0.0
0.5
1.0
1.5
2.0
2.5
3.0
3.5
4.0
00
:00
01
:00
02
:00
03
:00
04
:00
05
:00
06
:00
07
:00
08
:00
09
:00
10
:00
11
:00
12
:00
13
:00
14
:00
15
:00
16
:00
17
:00
18
:00
19
:00
20
:00
21
:00
22
:00
23
:00
GW
Operational demand (excl. EV) (Min Day) EV Demand

Version 3.3 Page 25 of 53 August 2016
Figure 29 – Contribution of EVs on SA Minimum Demand Day (2036, Neutral)
Source: Energeia
Figure 30 – Contribution of EVs on TAS Minimum Demand Day (2036, Neutral)
Source: Energeia
The results above demonstrate an opportunity to encourage daytime charging which suggests future tariffs will need to change from today’s This would encourage more demand in the middle of the day which could be the subject of future EV forecasts.
-0.5
0.0
0.5
1.0
1.5
2.0
00
:00
01
:00
02
:00
03
:00
04
:00
05
:00
06
:00
07
:00
08
:00
09
:00
10
:00
11
:00
12
:00
13
:00
14
:00
15
:00
16
:00
17
:00
18
:00
19
:00
20
:00
21
:00
22
:00
23
:00
GW
Operational demand (excl. EV) (Min Day) EV Demand
0.0
0.2
0.4
0.6
0.8
1.0
1.2
00
:00
01
:00
02
:00
03
:00
04
:00
05
:00
06
:00
07
:00
08
:00
09
:00
10
:00
11
:00
12
:00
13
:00
14
:00
15
:00
16
:00
17
:00
18
:00
19
:00
20
:00
21
:00
22
:00
23
:00
GW
Operational demand (excl. EV) (Min Day) EV Demand
Version 3.3 Page 26 of 53 August 2016
5 Recommendations for Future Modelling
The EV forecasts contained throughout this paper have been prepared to provide an insight into the potential
impact of future EV uptake on the main NEFR forecasts. The forecasts have been prepared based on a non-
integrated model of EV forecasts and existing publicly available data. In future years, it is understood that AEMO
intends to integrate EV forecasting into the NEFR process to allow for greater feedback between the primary
forecast and EV uptake drivers.
Accordingly, there are a range of key uncertainties and limitations which Energeia recommends are addressed
and/or improved in future modelling.
5.1 Key Uncertainties
The EV forecasts within this paper contain a number of key uncertainties which affect the precision and accuracy of the results. These include:
The structure of tariffs to be applied to EV charging and changes in these structures over time (See Section 5.2 above)
Policy uncertainty, with respect to:
o The mechanism and timing of introduction of a vehicle greenhouse gas emission standard
o The application of a broader carbon price to vehicle emissions.
The rate at which vehicle manufacturers make EV models available within the Australian market (nominated as model availability within this paper)
The number and duty cycle of fast charging
Further, the near term EV forecasts are subject to a high degree of uncertainty due to the immaturity of the market and short term actions that may be taken by the private sector to accelerate uptake. For example, there is the potential for early action by industry to promote EVs via heavily subsidised tariffs3.
In addition, there are likely to be further drivers, external to the model, relating to substitutable low emission technologies, including natural gas vehicles, fuel cell vehicles. Consideration of the potential impacts of these has been considered within the model in terms of the extent to which new technologies are likely to limit EV model availability. That is, the model assumes that a wholesale transition of the Australian vehicle fleet to EVs will not occur and at some point, new technologies entering the market will slow the growth in EV sales.
Conversely, complementary technologies, such as self-driving cars and wireless induction charging, have the potential to increase the attractiveness of EVs to the Australian public and drive greater levels of penetration (recognising self-driving vehicles also have the potential to reduce total number of vehicles on the road). These factors have not been considered by the model.
5.2 Changes in EV Charging Tariffs over Time
Currently the EV forecasting model assumes that tariff structures do not change over time. That is, all home charging is completed on a controlled load tariff only available overnight and all fleet based charging is undertaken under a default commercial tariff with the timing of charging dependent on the time of vehicle arrival. Due to the dominance of home based charging, the vast majority of EV charging occurs overnight on residential controlled load tariffs. EVs are therefore not forecast to have any significant impact on the minimum demand day.
It is therefore foreseeable that tariff arrangements could be introduced to incentivise greater EV consumption during daylight hours especially towards the end of the forecast period. In such a scenario, service providers would seek to flatten the overall system demand by offsetting predominantly residential based solar PV generation by encouraging work based EV charging within commercial areas. Distribution networks would seek
3 See for example, Vesey, Andy (@AndyVesey_AGL) “$1 a day (fully carbon offset) to charge your #EV. AGL to launch Nov
2016. $365 pa max for all your EV trips #AEW16” 5:37 PM, 20 June 2016. Tweet.

Version 3.3 Page 27 of 53 August 2016
to flatten demand at spatial locations and so would need to carefully manage incentives to ensure that new localised daytime peaks did not arise in commercial areas to offset PV generation in residential areas. These complex interactions require consideration of demand at both the system level as well as the network level (at the zone substation level or lower).
It is recommended that for future EV modelling, AEMO consider incorporating a dynamically controlled load tariff with a structure that varies over time and differs between the commercial and residential sectors to reflect both network and retail drivers.
5.3 Integration with Primary Load
The forecasts assume that the decision to adopt an EV is made independently from any other decisions
regarding primary energy consumption. In reality, there will be a subset of customers for whom the decision to
purchase an EV could be made more attractive if combined with a solar PV system depending on the tariff
arrangements and individual driving patterns.
Further, the present modelling assumes that the EV is not capable of any vehicle to home or vehicle to grid
(V2G) charging. Where this is the case, integration with the primary load becomes critical to residential forecasts
and interacts with the stationary storage uptake.
While AEMO has separately undertaken solar PV and battery storage forecasts, these have not been integrated
with the EV forecasts in this paper.
It is recommended that for future EV modelling, AEMO integrates the EV uptake and charging decisions with the broader customer decision making with respect to solar PV and stationary battery storage uptake and operation.
Version 3.3 Page 28 of 53 August 2016
Appendix A: Detailed Assumptions
A.1 Overview of Model Approach
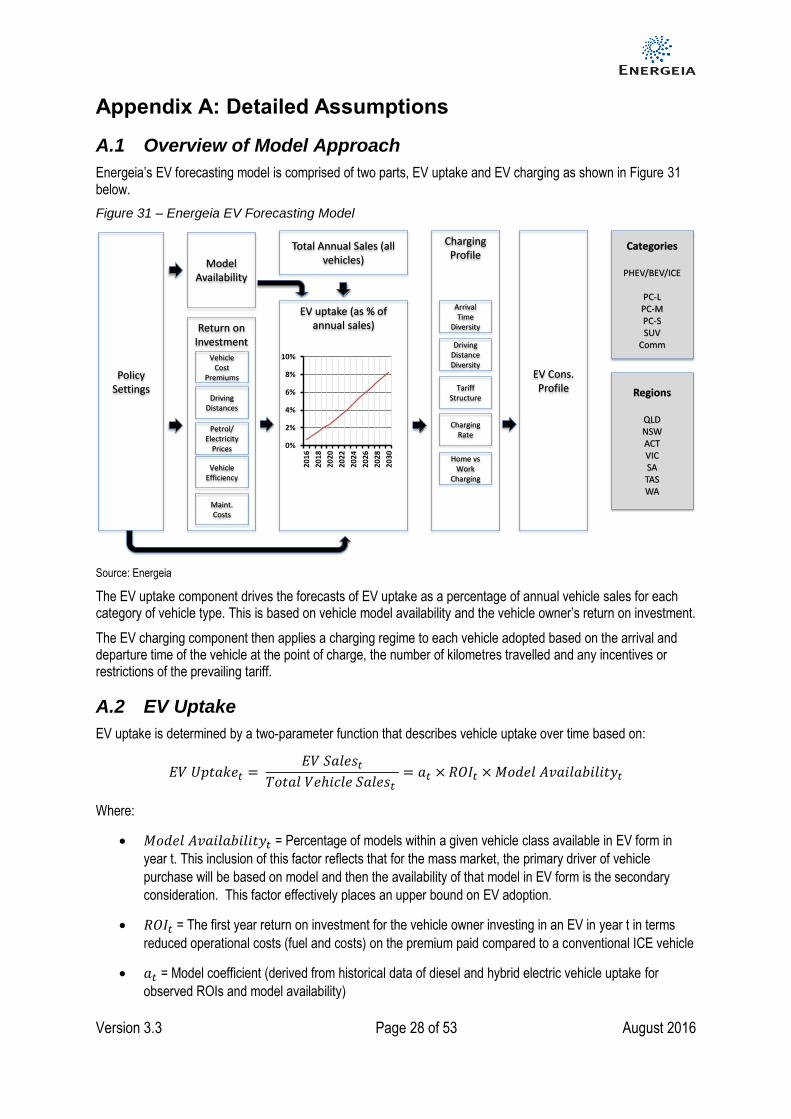
Energeia’s EV forecasting model is comprised of two parts, EV uptake and EV charging as shown in Figure 31 below.
Figure 31 – Energeia EV Forecasting Model
Source: Energeia
The EV uptake component drives the forecasts of EV uptake as a percentage of annual vehicle sales for each category of vehicle type. This is based on vehicle model availability and the vehicle owner’s return on investment.
The EV charging component then applies a charging regime to each vehicle adopted based on the arrival and departure time of the vehicle at the point of charge, the number of kilometres travelled and any incentives or restrictions of the prevailing tariff.
A.2 EV Uptake
EV uptake is determined by a two-parameter function that describes vehicle uptake over time based on:
𝐸𝑉 𝑈𝑝𝑡𝑎𝑘𝑒𝑡 = 𝐸𝑉 𝑆𝑎𝑙𝑒𝑠𝑡
𝑇𝑜𝑡𝑎𝑙 𝑉𝑒ℎ𝑖𝑐𝑙𝑒 𝑆𝑎𝑙𝑒𝑠𝑡 = 𝑎𝑡 × 𝑅𝑂𝐼𝑡 × 𝑀𝑜𝑑𝑒𝑙 𝐴𝑣𝑎𝑖𝑙𝑎𝑏𝑖𝑙𝑖𝑡𝑦𝑡
Where:
𝑀𝑜𝑑𝑒𝑙 𝐴𝑣𝑎𝑖𝑙𝑎𝑏𝑖𝑙𝑖𝑡𝑦𝑡 = Percentage of models within a given vehicle class available in EV form in
year t. This inclusion of this factor reflects that for the mass market, the primary driver of vehicle
purchase will be based on model and then the availability of that model in EV form is the secondary
consideration. This factor effectively places an upper bound on EV adoption.
𝑅𝑂𝐼𝑡 = The first year return on investment for the vehicle owner investing in an EV in year t in terms
reduced operational costs (fuel and costs) on the premium paid compared to a conventional ICE vehicle
𝑎𝑡 = Model coefficient (derived from historical data of diesel and hybrid electric vehicle uptake for
observed ROIs and model availability)
0%
2%
4%
6%
8%
10%
20
16
20
18
20
20
20
22
20
24
20
26
20
28
20
30
Policy Settings
Return on Investment
Vehicle Cost
Premiums
Model Availability
Driving Distances
Petrol/ Electricity
Prices
Vehicle Efficiency
Maint. Costs
Charging Profile
Arrival Time
Diversity
Driving Distance Diversity
Tariff Structure
Charging Rate
Home vs Work
Charging
EV uptake (as % of annual sales)
Categories
PHEV/BEV/ICE
PC-LPC-MPC-SSUV
Comm
Total Annual Sales (all vehicles)
EV Cons. Profile Regions
QLDNSWACTVICSATASWA
Version 3.3 Page 29 of 53 August 2016
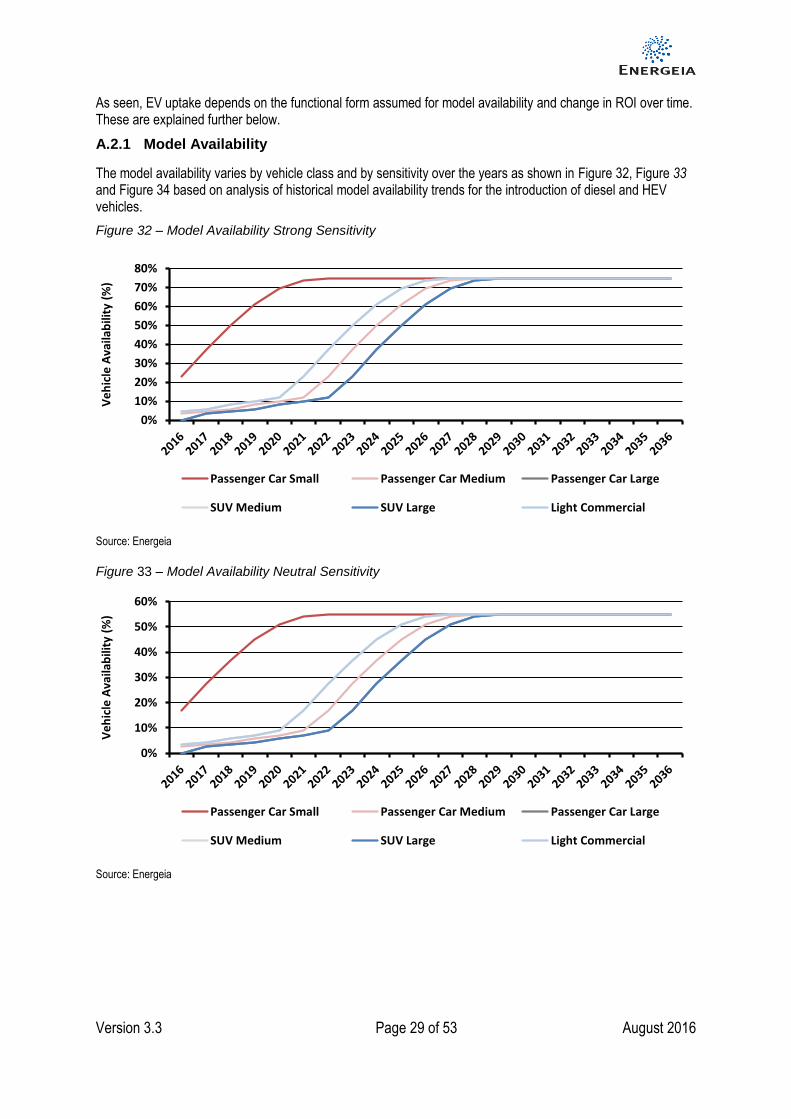
As seen, EV uptake depends on the functional form assumed for model availability and change in ROI over time. These are explained further below.
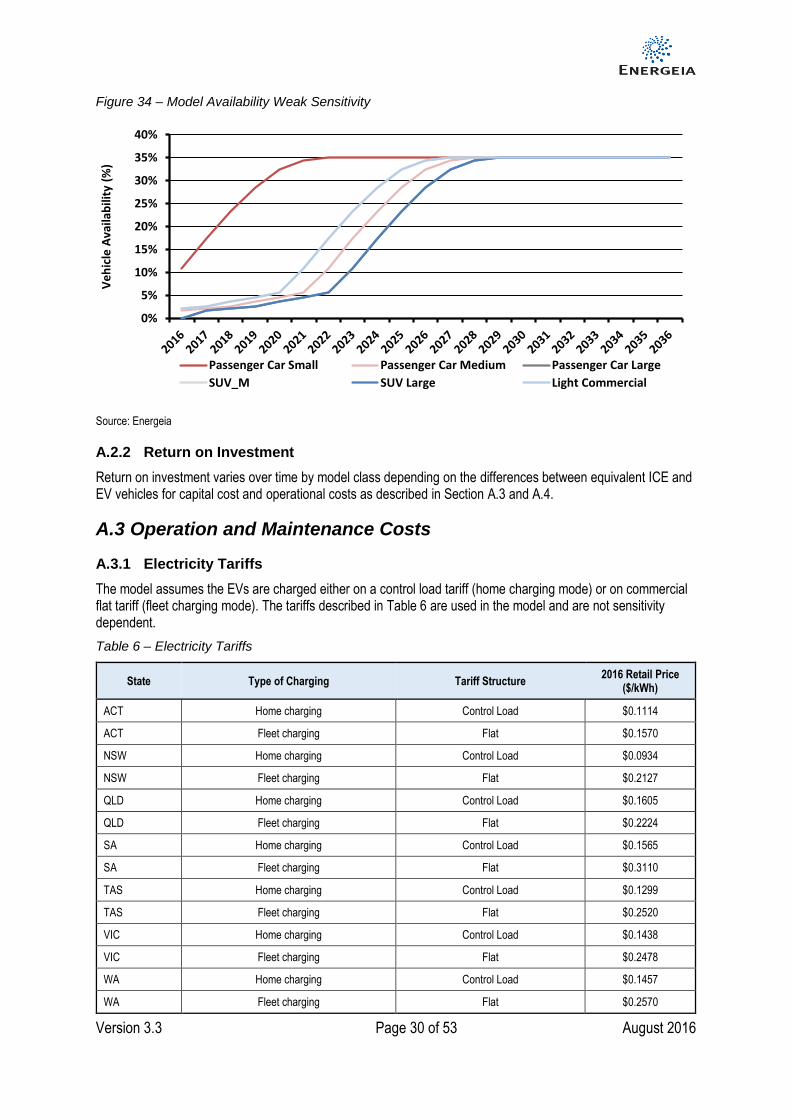
A.2.1 Model Availability
The model availability varies by vehicle class and by sensitivity over the years as shown in Figure 32, Figure 33 and Figure 34 based on analysis of historical model availability trends for the introduction of diesel and HEV vehicles.
Figure 32 – Model Availability Strong Sensitivity
Source: Energeia
Figure 33 – Model Availability Neutral Sensitivity
Source: Energeia
0%
10%
20%
30%
40%
50%
60%
70%
80%
Ve
hic
le A
vaila
bili
ty (
%)
Passenger Car Small Passenger Car Medium Passenger Car Large
SUV Medium SUV Large Light Commercial
0%
10%
20%
30%
40%
50%
60%
Ve
hic
le A
vaila
bili
ty (
%)
Passenger Car Small Passenger Car Medium Passenger Car Large
SUV Medium SUV Large Light Commercial
Version 3.3 Page 30 of 53 August 2016
Figure 34 – Model Availability Weak Sensitivity
Source: Energeia
A.2.2 Return on Investment
Return on investment varies over time by model class depending on the differences between equivalent ICE and EV vehicles for capital cost and operational costs as described in Section A.3 and A.4.
A.3 Operation and Maintenance Costs
A.3.1 Electricity Tariffs
The model assumes the EVs are charged either on a control load tariff (home charging mode) or on commercial flat tariff (fleet charging mode). The tariffs described in Table 6 are used in the model and are not sensitivity dependent.
Table 6 – Electricity Tariffs
State Type of Charging Tariff Structure 2016 Retail Price
($/kWh)
ACT Home charging Control Load $0.1114
ACT Fleet charging Flat $0.1570
NSW Home charging Control Load $0.0934
NSW Fleet charging Flat $0.2127
QLD Home charging Control Load $0.1605
QLD Fleet charging Flat $0.2224
SA Home charging Control Load $0.1565
SA Fleet charging Flat $0.3110
TAS Home charging Control Load $0.1299
TAS Fleet charging Flat $0.2520
VIC Home charging Control Load $0.1438
VIC Fleet charging Flat $0.2478
WA Home charging Control Load $0.1457
WA Fleet charging Flat $0.2570
0%
5%
10%
15%
20%
25%
30%
35%
40%
Ve
hic
le A
vaila
bili
ty (
%)
Passenger Car Small Passenger Car Medium Passenger Car Large
SUV_M SUV Large Light Commercial
Version 3.3 Page 31 of 53 August 2016
A.3.2 Electricity Price
Both the retail and network components of EV charging tariffs are grown over time in the EV uptake model and vary by state and by sensitivity. The model uses the retail electricity price projections developed by Jacobs for the AEMO4 in real terms.
The electricity price trend has a direct impact on EV fuel expenditure.
A.3.3 Fuel Price
Petrol and diesel price growth rates vary by state and by sensitivity as shown in Figure 35. The increase in petrol and diesel prices in 2020 under the strong sensitivity is due to the introduction of a carbon price. The carbon price escalates from $25/t CO2e in 2020 to $50/t CO2e in 2030. This overall linear trend is reflected in fuel prices.
4 Jacobs, Retail electricity price history and projections – Public, May 2016

Version 3.3 Page 32 of 53 August 2016
Figure 35 – Fuel Prices
Source: Energeia
Version 3.3 Page 33 of 53 August 2016
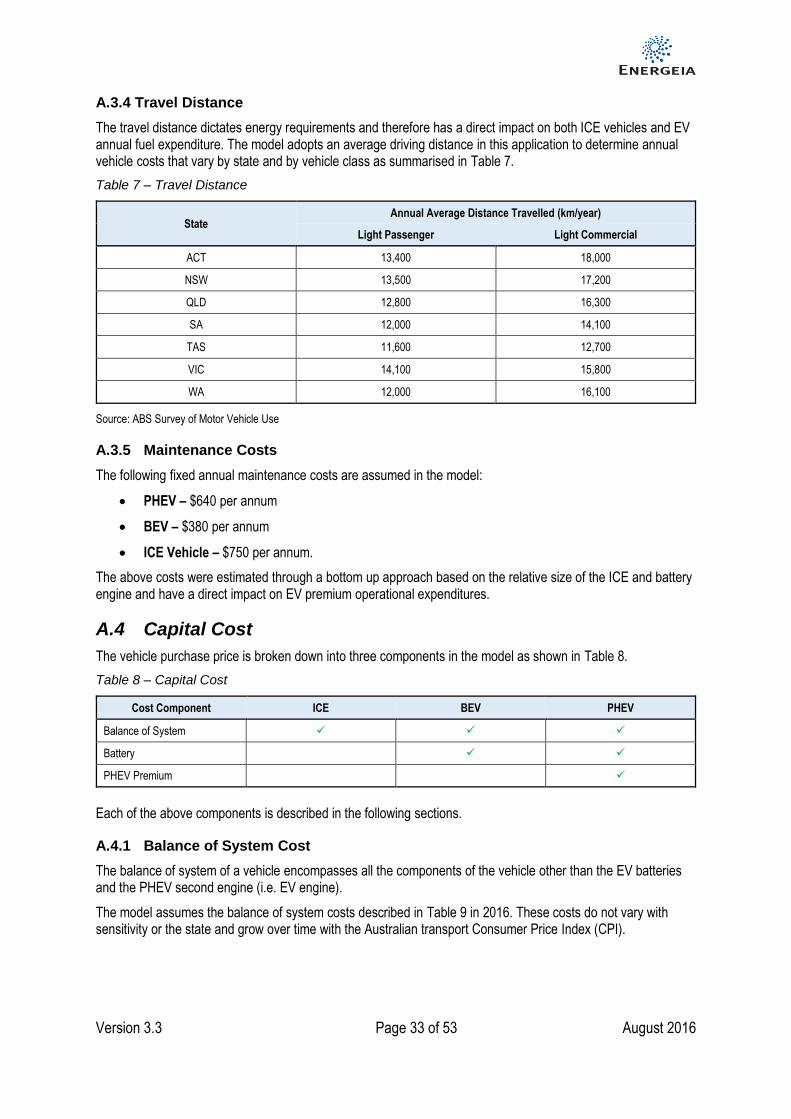
A.3.4 Travel Distance
The travel distance dictates energy requirements and therefore has a direct impact on both ICE vehicles and EV annual fuel expenditure. The model adopts an average driving distance in this application to determine annual vehicle costs that vary by state and by vehicle class as summarised in Table 7.
Table 7 – Travel Distance
State Annual Average Distance Travelled (km/year)
Light Passenger Light Commercial
ACT 13,400 18,000
NSW 13,500 17,200
QLD 12,800 16,300
SA 12,000 14,100
TAS 11,600 12,700
VIC 14,100 15,800
WA 12,000 16,100
Source: ABS Survey of Motor Vehicle Use
A.3.5 Maintenance Costs
The following fixed annual maintenance costs are assumed in the model:
PHEV – $640 per annum
BEV – $380 per annum
ICE Vehicle – $750 per annum.
The above costs were estimated through a bottom up approach based on the relative size of the ICE and battery engine and have a direct impact on EV premium operational expenditures.
A.4 Capital Cost
The vehicle purchase price is broken down into three components in the model as shown in Table 8.
Table 8 – Capital Cost
Cost Component ICE BEV PHEV
Balance of System
Battery
PHEV Premium
Each of the above components is described in the following sections.
A.4.1 Balance of System Cost
The balance of system of a vehicle encompasses all the components of the vehicle other than the EV batteries and the PHEV second engine (i.e. EV engine).
The model assumes the balance of system costs described in Table 9 in 2016. These costs do not vary with sensitivity or the state and grow over time with the Australian transport Consumer Price Index (CPI).
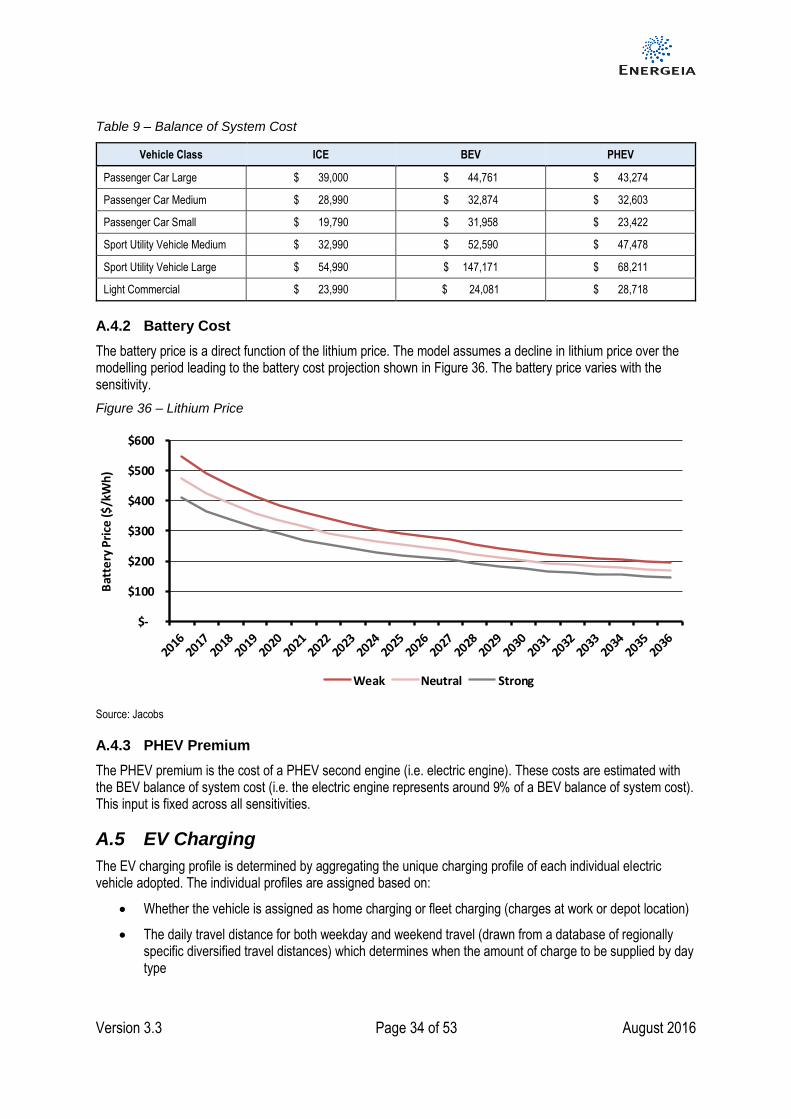
Version 3.3 Page 34 of 53 August 2016
Table 9 – Balance of System Cost
Vehicle Class ICE BEV PHEV
Passenger Car Large $ 39,000 $ 44,761 $ 43,274
Passenger Car Medium $ 28,990 $ 32,874 $ 32,603
Passenger Car Small $ 19,790 $ 31,958 $ 23,422
Sport Utility Vehicle Medium $ 32,990 $ 52,590 $ 47,478
Sport Utility Vehicle Large $ 54,990 $ 147,171 $ 68,211
Light Commercial $ 23,990 $ 24,081 $ 28,718
A.4.2 Battery Cost
The battery price is a direct function of the lithium price. The model assumes a decline in lithium price over the modelling period leading to the battery cost projection shown in Figure 36. The battery price varies with the sensitivity.
Figure 36 – Lithium Price
Source: Jacobs
A.4.3 PHEV Premium
The PHEV premium is the cost of a PHEV second engine (i.e. electric engine). These costs are estimated with the BEV balance of system cost (i.e. the electric engine represents around 9% of a BEV balance of system cost). This input is fixed across all sensitivities.
A.5 EV Charging
The EV charging profile is determined by aggregating the unique charging profile of each individual electric vehicle adopted. The individual profiles are assigned based on:
Whether the vehicle is assigned as home charging or fleet charging (charges at work or depot location)
The daily travel distance for both weekday and weekend travel (drawn from a database of regionally specific diversified travel distances) which determines when the amount of charge to be supplied by day type
$-
$100
$200
$300
$400
$500
$600
Bat
tery
Pri
ce ($
/kW
h)
Weak Neutral Strong

Version 3.3 Page 35 of 53 August 2016
An arrival time for both weekday and weekend travel (drawn from a database of diversified times specific to either home charging or fleet charging) which dictates when charging starts, in the absence of any other tariff restrictions
A departure time for both weekday and weekend travel (drawn from a database of diversified times specific to either home charging or fleet charging) which dictates when charging must cease in the absence of any other tariff restrictions
The prevailing tariff and the extent to which it restricts or incentivises charging during certain times. For home charging this is assumed to be the existing controlled load tariff specific to each region generally allowing for charging overnight only, and for fleet charging this is assumed to be the standard business tariff specific to each region without charging restrictions
A.5.1 Type of Charging
A vehicle can be assigned to either a home charging mode or a fleet charging mode. The model assumes:
100% of the residential EV fleet charges at home
90% of the commercial EV fleet charges at home and the remaining 10% charges at work (i.e. fleet charging)
90% of the government EV fleet charges at home and the remaining 10% charges at work (i.e. fleet charging.
A.5.2 Vehicle Charging Parameters
Vehicle specific parameters which dictate charging times and rates are shown in Table 10 below.
Table 10 – Vehicle Charging Parameters
Engine type Vehicle class Battery size
(kWh) % km ICE Charge Rate
BEV
Passenger Car – Small 24 - 3.7 kW
Passenger Car - Medium 50 - 3.7 kW
Passenger Car - Large 70 - 3.7 kW
SUV- Medium 50 - 3.7 kW
SUV - Large 75 - 3.7 kW
Light Commercial 23 - 3.7 kW
PHEV
Passenger Car – Small 24 59% 3.7 kW
Passenger Car - Medium 50 59% 3.7 kW
Passenger Car - Large 70 59% 3.7 kW
SUV- Medium 50 57% 3.7 kW
SUV - Large 75 70% 3.7 kW
Light Commercial 23 83% 3.7 kW
A.5.3 Home Based Charging Start Times
The home based charging start time is determined by arrival times and the restrictions of the controlled load tariffs.
The model uses the arrival time distribution shown in Figure 37.

Version 3.3 Page 36 of 53 August 2016
Figure 37 – Arrival and Departure Time Distribution
Source: Queensland Household Travel Survey
However, EVs arriving home before the controlled load start hour are not permitted to charge until such time as the controlled load tariff commences. All EVs that have arrived home before the start time are assigned to a controlled load “channel” with charging commencing when each channel opens, staggered by half-hourly intervals.
The control load hours and minimum service requirements assumed in the model are described in Table 11.
Table 11 – Control Load Tariffs
State CL – Start Hour CL – End Hour Minimum Hours of Service
VIC 8:00 PM 7:00 AM 9
ACT 10:00 PM 7:00 AM 7.5
NSW 10:00 PM 7:00 AM 7.5
WA 9:00 PM 7:30 AM 6.5
QLD 10:00 PM 7:00 AM 8
SA 11:00PM 7:00 AM 6
TAS 4:30 PM 11:30 AM 5.5
Source: DNSP Pricing Proposals (Various), Australian Energy Regulator
A.5.4 Home Based Charging Completion Times
The home based charging completion time depends upon the end hour of the controlled load tariff (as per Table 11) and/or amount of charge required which is in turn dependent on the daily driving distance.
For the purposes of determining the charging profile, it is assumed that the daily travel distance varies between vehicles using a distribution profile derived from the Queensland Household Travel Survey. The vehicle charging will be complete, once the vehicle is fully charged or once the controlled load tariff end time is reached, whichever occurs soonest.
The distribution of daily distance shown in Figure 38 is scaled down (or up) for each vehicle class and state average travelled distances.
0%
2%
4%
6%
8%
10%
12%
14%
16%
12
:00
AM
1:0
0 A
M
2:0
0 A
M
3:0
0 A
M
4:0
0 A
M
5:0
0 A
M
6:0
0 A
M
7:0
0 A
M
8:0
0 A
M
9:0
0 A
M
10
:00
AM
11
:00
AM
12
:00
PM
1:0
0 P
M
2:0
0 P
M
3:0
0 P
M
4:0
0 P
M
5:0
0 P
M
6:0
0 P
M
7:0
0 P
M
8:0
0 P
M
9:0
0 P
M
10
:00
PM
11
:00
PM
Dis
trib
uti
on
(%
)
Arrival Workday Departure Workday Arrival Weekend Departure Weekend
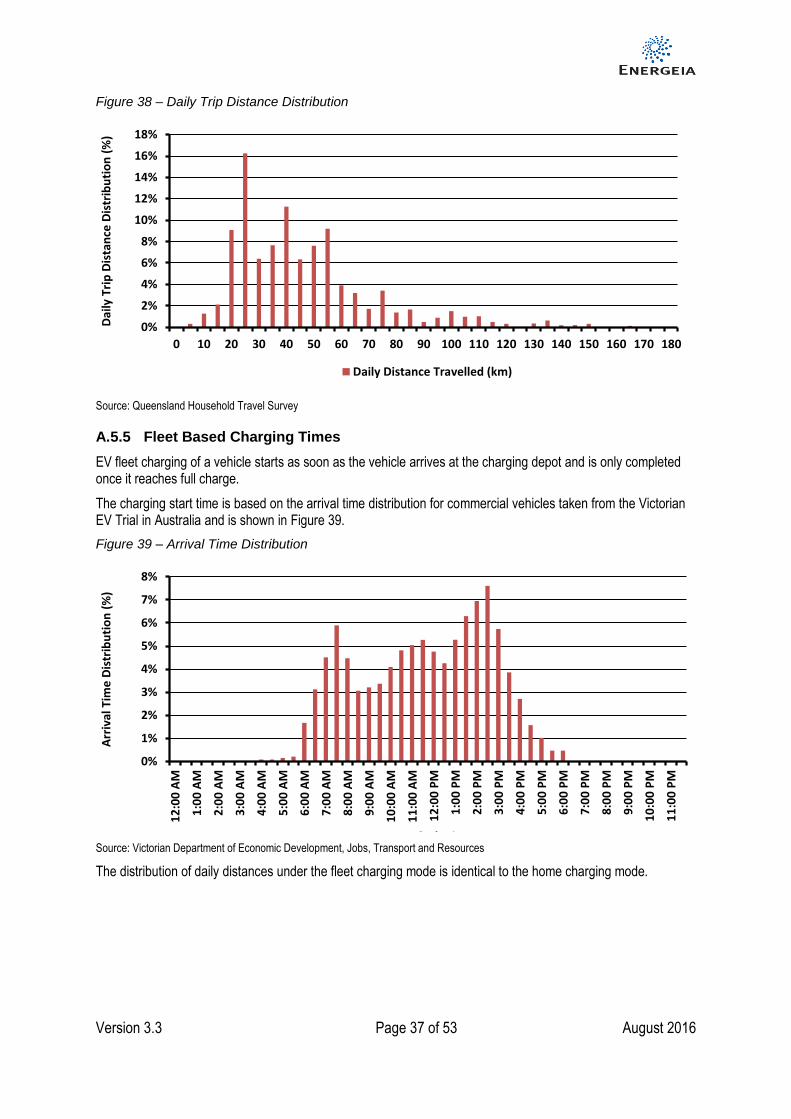
Version 3.3 Page 37 of 53 August 2016
Figure 38 – Daily Trip Distance Distribution
Source: Queensland Household Travel Survey
A.5.5 Fleet Based Charging Times
EV fleet charging of a vehicle starts as soon as the vehicle arrives at the charging depot and is only completed once it reaches full charge.
The charging start time is based on the arrival time distribution for commercial vehicles taken from the Victorian EV Trial in Australia and is shown in Figure 39.
Figure 39 – Arrival Time Distribution
Source: Victorian Department of Economic Development, Jobs, Transport and Resources
The distribution of daily distances under the fleet charging mode is identical to the home charging mode.
0%
2%
4%
6%
8%
10%
12%
14%
16%
18%
0 10 20 30 40 50 60 70 80 90 100 110 120 130 140 150 160 170 180
Dai
ly T
rip
Dis
tan
ce D
istr
ibu
tio
n (
%)
Daily Distance Travelled (km)
0%
1%
2%
3%
4%
5%
6%
7%
8%
12
:00
AM
1:0
0 A
M
2:0
0 A
M
3:0
0 A
M
4:0
0 A
M
5:0
0 A
M
6:0
0 A
M
7:0
0 A
M
8:0
0 A
M
9:0
0 A
M
10
:00
AM
11
:00
AM
12
:00
PM
1:0
0 P
M
2:0
0 P
M
3:0
0 P
M
4:0
0 P
M
5:0
0 P
M
6:0
0 P
M
7:0
0 P
M
8:0
0 P
M
9:0
0 P
M
10
:00
PM
11
:00
PM
Arr
ival
Tim
e D
istr
ibu
tio
n (
%)
Series1

Version 3.3 Page 38 of 53 August 2016
A.6 Vehicle Stock Model
The vehicle stock model uses the following approach to determine overall change in stock for each state.
𝐼𝐶𝐸𝑡 = ∑ [𝐼𝐶𝐸𝑖,𝑗(𝑡−1) + (1 − 𝐸𝑉 𝑈𝑝𝑡𝑎𝑘𝑒𝑖,𝑗(𝑡)) × 𝑉𝑒ℎ𝑖𝑐𝑙𝑒 𝑆𝑎𝑙𝑒𝑠𝑖,𝑗(𝑡)
𝑖,𝑗
− if (𝑡 ≤ 𝐴𝑣𝑔𝐿𝑖𝑓𝑒𝑡𝑖𝑚𝑒 ,𝐼𝐶𝐸𝑖,𝑗(0)
𝐴𝑣𝑔𝐿𝑖𝑓𝑒𝑡𝑖𝑚𝑒, 0)
− ∑[(1 − 𝐸𝑉 𝑈𝑝𝑡𝑎𝑘𝑒𝑖,𝑗(𝑡−𝑘)) × 𝑉𝑒ℎ𝑖𝑐𝑙𝑒 𝑆𝑎𝑙𝑒𝑠𝑖,𝑗(𝑡−𝑘)
𝑡
𝑘=0
× 𝐹𝑎𝑖𝑙𝑢𝑟𝑒 𝑅𝑎𝑡𝑒𝑘]]
𝐸𝑉𝑡 = ∑ [𝐸𝑉𝑖,𝑗(𝑡−1) + 𝐸𝑉 𝑈𝑝𝑡𝑎𝑘𝑒𝑖,𝑗(𝑡) × 𝑉𝑒ℎ𝑖𝑐𝑙𝑒 𝑆𝑎𝑙𝑒𝑠𝑖,𝑗(𝑡)
𝑖,𝑗
− if (𝑡 ≤ 𝐴𝑣𝑔𝐿𝑖𝑓𝑒𝑡𝑖𝑚𝑒 ,𝐸𝑉𝑖,𝑗(0)
𝐴𝑣𝑔𝐿𝑖𝑓𝑒𝑡𝑖𝑚𝑒, 0)
− ∑[𝐸𝑉 𝑈𝑝𝑡𝑎𝑘𝑒𝑖,𝑗(𝑡−𝑘) × 𝑉𝑒ℎ𝑖𝑐𝑙𝑒 𝑆𝑎𝑙𝑒𝑠𝑖,𝑗(𝑡−𝑘)
𝑡
𝑘=0
× 𝐹𝑎𝑖𝑙𝑢𝑟𝑒 𝑅𝑎𝑡𝑒𝑘]]
Where:
ICEt = Total stock of ICE vehicles in year t
EVt= Total stock of EV vehicles in year t
ICE0 = Opening stock of ICE vehicles
EV0 = Opening stock of EV vehicles
ICEi,j(t-1) = Stock of ICE vehicles in market i in class j in year t-1
EVi,j(t-1) = Stock of EV vehicles in market i in class j in year t-1
EV Uptakei,j(t) = % EV sales in market i in class j in year t
Vehicle Salesi,j(t) = Vehicle sales in market i in class j in year t
Failure Ratek = Probability a vehicle fails at age k from failure rate function

Version 3.3 Page 39 of 53 August 2016
Average Lifetime = Mean age of failure derived from failure rate function
A.6.1 Opening Stock
The opening stock of vehicles by vehicle class is sourced from VFACTS data for the calendar year 20155 for both EV and ICE vehicles for each state. The opening stock feeds into the vehicle stock model at t=0 in the above equations.
A.6.2 Market Growth
Each year, each of the vehicle classes in each vehicle market is assumed to grow at a constant rate per capita based on growth observed over the last five years5. This allows for observed trends such as decline in the large passenger car vehicle to be reflected in the results.
Population growth data is taken from ABS.
A.6.3 Average Lifetime
Average vehicle lifetime of all vehicles is assumed to be 16.2 years6.
.A.6.4 Failure Rate
The assumed failure rate for new vehicles relative to purchase date is shown in Figure 40.
Figure 40 – Failure Rate
Source: Ricardo-AEA Ltd
5 Federal Chamber of Automotive Industry, VFACTS December National Report, 2015 6 Ricardo-AEA Ltd, Report for European Commission – DG Climate Action, Improvements to the definition of lifetime
mileage of light duty vehicles, 2015 <http://ec.europa.eu/clima/policies/transport/vehicles/docs/ldv_mileage_improvement_en.pdf>
0%
2%
4%
6%
8%
10%
12%
14%
16%
1 2 3 4 5 6 7 8 9 10 11 12 13 14 15 16 17 18 19 20 21 22 23 24 25 26
% o
f C
oh
ort
Failures
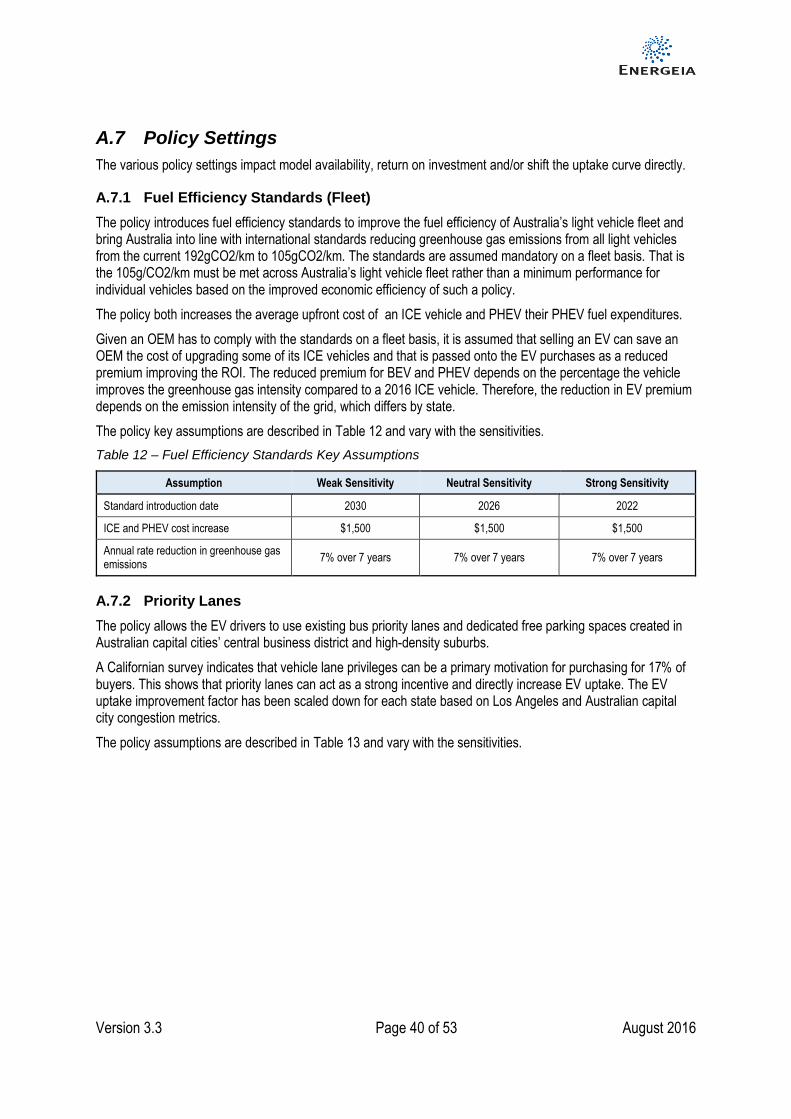
Version 3.3 Page 40 of 53 August 2016
A.7 Policy Settings
The various policy settings impact model availability, return on investment and/or shift the uptake curve directly.
A.7.1 Fuel Efficiency Standards (Fleet)
The policy introduces fuel efficiency standards to improve the fuel efficiency of Australia’s light vehicle fleet and bring Australia into line with international standards reducing greenhouse gas emissions from all light vehicles from the current 192gCO2/km to 105gCO2/km. The standards are assumed mandatory on a fleet basis. That is the 105g/CO2/km must be met across Australia’s light vehicle fleet rather than a minimum performance for individual vehicles based on the improved economic efficiency of such a policy.
The policy both increases the average upfront cost of an ICE vehicle and PHEV their PHEV fuel expenditures.
Given an OEM has to comply with the standards on a fleet basis, it is assumed that selling an EV can save an OEM the cost of upgrading some of its ICE vehicles and that is passed onto the EV purchases as a reduced premium improving the ROI. The reduced premium for BEV and PHEV depends on the percentage the vehicle improves the greenhouse gas intensity compared to a 2016 ICE vehicle. Therefore, the reduction in EV premium depends on the emission intensity of the grid, which differs by state.
The policy key assumptions are described in Table 12 and vary with the sensitivities.
Table 12 – Fuel Efficiency Standards Key Assumptions
Assumption Weak Sensitivity Neutral Sensitivity Strong Sensitivity
Standard introduction date 2030 2026 2022
ICE and PHEV cost increase $1,500 $1,500 $1,500
Annual rate reduction in greenhouse gas emissions
7% over 7 years 7% over 7 years 7% over 7 years
A.7.2 Priority Lanes
The policy allows the EV drivers to use existing bus priority lanes and dedicated free parking spaces created in Australian capital cities’ central business district and high-density suburbs.
A Californian survey indicates that vehicle lane privileges can be a primary motivation for purchasing for 17% of buyers. This shows that priority lanes can act as a strong incentive and directly increase EV uptake. The EV uptake improvement factor has been scaled down for each state based on Los Angeles and Australian capital city congestion metrics.
The policy assumptions are described in Table 13 and vary with the sensitivities.
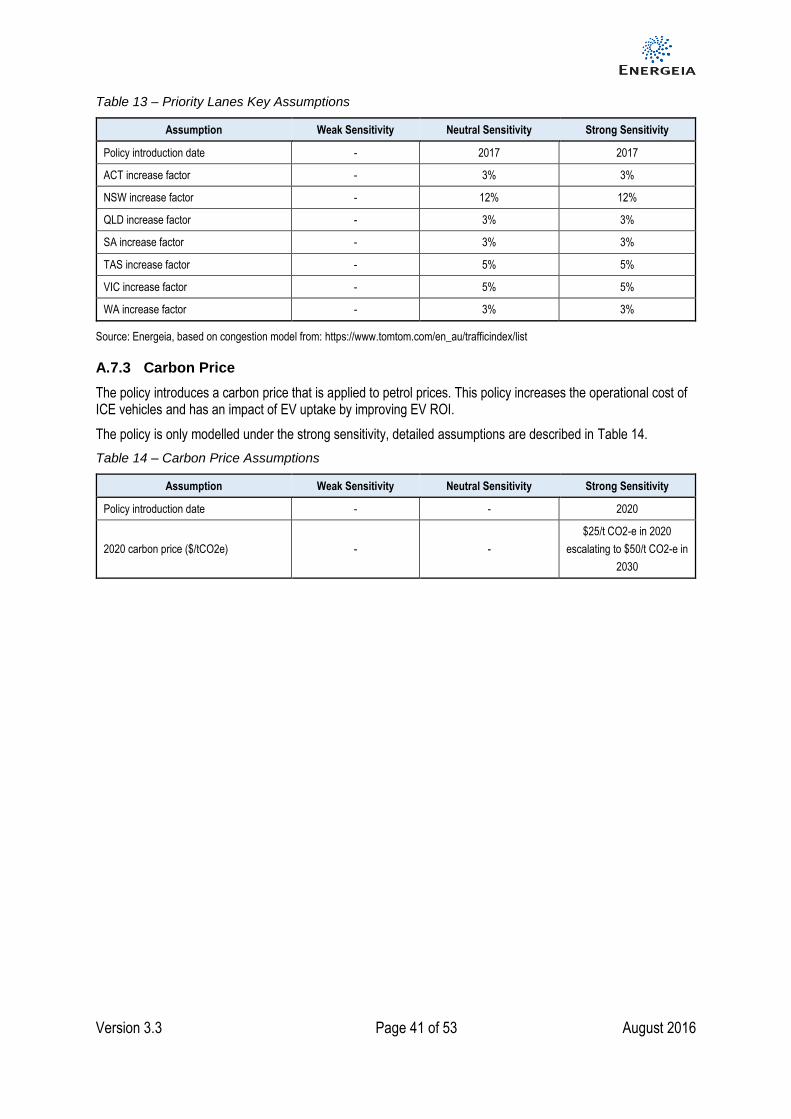
Version 3.3 Page 41 of 53 August 2016
Table 13 – Priority Lanes Key Assumptions
Assumption Weak Sensitivity Neutral Sensitivity Strong Sensitivity
Policy introduction date - 2017 2017
ACT increase factor - 3% 3%
NSW increase factor - 12% 12%
QLD increase factor - 3% 3%
SA increase factor - 3% 3%
TAS increase factor - 5% 5%
VIC increase factor - 5% 5%
WA increase factor - 3% 3%
Source: Energeia, based on congestion model from: https://www.tomtom.com/en_au/trafficindex/list
A.7.3 Carbon Price
The policy introduces a carbon price that is applied to petrol prices. This policy increases the operational cost of ICE vehicles and has an impact of EV uptake by improving EV ROI.
The policy is only modelled under the strong sensitivity, detailed assumptions are described in Table 14.
Table 14 – Carbon Price Assumptions
Assumption Weak Sensitivity Neutral Sensitivity Strong Sensitivity
Policy introduction date - - 2020
2020 carbon price ($/tCO2e) - -
$25/t CO2-e in 2020
escalating to $50/t CO2-e in
2030
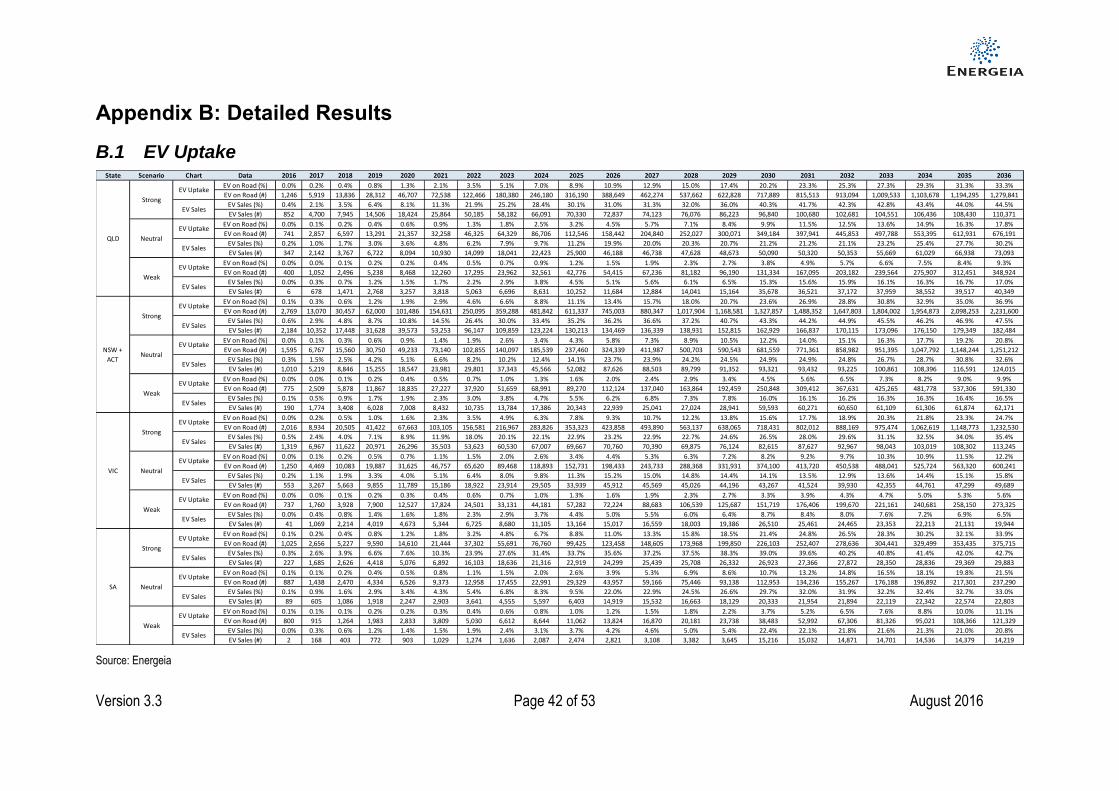
Version 3.3 Page 42 of 53 August 2016
Appendix B: Detailed Results
B.1 EV Uptake
Source: Energeia
State Scenario Chart Data 2016 2017 2018 2019 2020 2021 2022 2023 2024 2025 2026 2027 2028 2029 2030 2031 2032 2033 2034 2035 2036
EV on Road (%) 0.0% 0.2% 0.4% 0.8% 1.3% 2.1% 3.5% 5.1% 7.0% 8.9% 10.9% 12.9% 15.0% 17.4% 20.2% 23.3% 25.3% 27.3% 29.3% 31.3% 33.3%
EV on Road (#) 1,246 5,919 13,836 28,312 46,707 72,538 122,466 180,380 246,180 316,190 388,649 462,274 537,662 622,828 717,889 815,513 913,094 1,009,533 1,103,678 1,194,295 1,279,841
EV Sales (%) 0.4% 2.1% 3.5% 6.4% 8.1% 11.3% 21.9% 25.2% 28.4% 30.1% 31.0% 31.3% 32.0% 36.0% 40.3% 41.7% 42.3% 42.8% 43.4% 44.0% 44.5%
EV Sales (#) 852 4,700 7,945 14,506 18,424 25,864 50,185 58,182 66,091 70,330 72,837 74,123 76,076 86,223 96,840 100,680 102,681 104,551 106,436 108,430 110,371
EV on Road (%) 0.0% 0.1% 0.2% 0.4% 0.6% 0.9% 1.3% 1.8% 2.5% 3.2% 4.5% 5.7% 7.1% 8.4% 9.9% 11.5% 12.5% 13.6% 14.9% 16.3% 17.8%
EV on Road (#) 741 2,857 6,597 13,291 21,357 32,258 46,325 64,329 86,706 112,546 158,442 204,840 252,027 300,071 349,184 397,941 445,853 497,788 553,395 612,931 676,191
EV Sales (%) 0.2% 1.0% 1.7% 3.0% 3.6% 4.8% 6.2% 7.9% 9.7% 11.2% 19.9% 20.0% 20.3% 20.7% 21.2% 21.2% 21.1% 23.2% 25.4% 27.7% 30.2%
EV Sales (#) 347 2,142 3,767 6,722 8,094 10,930 14,099 18,041 22,423 25,900 46,188 46,738 47,628 48,673 50,090 50,320 50,353 55,669 61,029 66,938 73,093
EV on Road (%) 0.0% 0.0% 0.1% 0.2% 0.2% 0.4% 0.5% 0.7% 0.9% 1.2% 1.5% 1.9% 2.3% 2.7% 3.8% 4.9% 5.7% 6.6% 7.5% 8.4% 9.3%
EV on Road (#) 400 1,052 2,496 5,238 8,468 12,260 17,295 23,962 32,561 42,776 54,415 67,236 81,182 96,190 131,334 167,095 203,182 239,564 275,907 312,451 348,924
EV Sales (%) 0.0% 0.3% 0.7% 1.2% 1.5% 1.7% 2.2% 2.9% 3.8% 4.5% 5.1% 5.6% 6.1% 6.5% 15.3% 15.6% 15.9% 16.1% 16.3% 16.7% 17.0%
EV Sales (#) 6 678 1,471 2,768 3,257 3,818 5,063 6,696 8,631 10,252 11,684 12,884 14,041 15,164 35,678 36,521 37,172 37,959 38,552 39,517 40,349
EV on Road (%) 0.1% 0.3% 0.6% 1.2% 1.9% 2.9% 4.6% 6.6% 8.8% 11.1% 13.4% 15.7% 18.0% 20.7% 23.6% 26.9% 28.8% 30.8% 32.9% 35.0% 36.9%
EV on Road (#) 2,769 13,070 30,457 62,000 101,486 154,631 250,095 359,288 481,842 611,337 745,003 880,347 1,017,904 1,168,581 1,327,857 1,488,352 1,647,803 1,804,002 1,954,873 2,098,253 2,231,600
EV Sales (%) 0.6% 2.9% 4.8% 8.7% 10.8% 14.5% 26.4% 30.0% 33.4% 35.2% 36.2% 36.6% 37.2% 40.7% 43.3% 44.2% 44.9% 45.5% 46.2% 46.9% 47.5%
EV Sales (#) 2,184 10,352 17,448 31,628 39,573 53,253 96,147 109,859 123,224 130,213 134,469 136,339 138,931 152,815 162,929 166,837 170,115 173,096 176,150 179,349 182,484
EV on Road (%) 0.0% 0.1% 0.3% 0.6% 0.9% 1.4% 1.9% 2.6% 3.4% 4.3% 5.8% 7.3% 8.9% 10.5% 12.2% 14.0% 15.1% 16.3% 17.7% 19.2% 20.8%
EV on Road (#) 1,595 6,767 15,560 30,750 49,233 73,140 102,855 140,097 185,539 237,460 324,339 411,987 500,703 590,543 681,559 771,361 858,982 951,395 1,047,792 1,148,244 1,251,212
EV Sales (%) 0.3% 1.5% 2.5% 4.2% 5.1% 6.6% 8.2% 10.2% 12.4% 14.1% 23.7% 23.9% 24.2% 24.5% 24.9% 24.9% 24.8% 26.7% 28.7% 30.8% 32.6%
EV Sales (#) 1,010 5,219 8,846 15,255 18,547 23,981 29,801 37,343 45,566 52,082 87,626 88,503 89,799 91,352 93,321 93,432 93,225 100,861 108,396 116,591 124,015
EV on Road (%) 0.0% 0.0% 0.1% 0.2% 0.4% 0.5% 0.7% 1.0% 1.3% 1.6% 2.0% 2.4% 2.9% 3.4% 4.5% 5.6% 6.5% 7.3% 8.2% 9.0% 9.9%
EV on Road (#) 775 2,509 5,878 11,867 18,835 27,227 37,920 51,659 68,991 89,270 112,124 137,040 163,864 192,459 250,848 309,412 367,631 425,265 481,778 537,306 591,330
EV Sales (%) 0.1% 0.5% 0.9% 1.7% 1.9% 2.3% 3.0% 3.8% 4.7% 5.5% 6.2% 6.8% 7.3% 7.8% 16.0% 16.1% 16.2% 16.3% 16.3% 16.4% 16.5%
EV Sales (#) 190 1,774 3,408 6,028 7,008 8,432 10,735 13,784 17,386 20,343 22,939 25,041 27,024 28,941 59,593 60,271 60,650 61,109 61,306 61,874 62,171
EV on Road (%) 0.0% 0.2% 0.5% 1.0% 1.6% 2.3% 3.5% 4.9% 6.3% 7.8% 9.3% 10.7% 12.2% 13.8% 15.6% 17.7% 18.9% 20.3% 21.8% 23.3% 24.7%
EV on Road (#) 2,016 8,934 20,505 41,422 67,663 103,105 156,581 216,967 283,826 353,323 423,858 493,890 563,137 638,065 718,431 802,012 888,169 975,474 1,062,619 1,148,773 1,232,530
EV Sales (%) 0.5% 2.4% 4.0% 7.1% 8.9% 11.9% 18.0% 20.1% 22.1% 22.9% 23.2% 22.9% 22.7% 24.6% 26.5% 28.0% 29.6% 31.1% 32.5% 34.0% 35.4%
EV Sales (#) 1,319 6,967 11,622 20,971 26,296 35,503 53,623 60,530 67,007 69,667 70,760 70,390 69,875 76,124 82,615 87,627 92,967 98,043 103,019 108,302 113,245
EV on Road (%) 0.0% 0.1% 0.2% 0.5% 0.7% 1.1% 1.5% 2.0% 2.6% 3.4% 4.4% 5.3% 6.3% 7.2% 8.2% 9.2% 9.7% 10.3% 10.9% 11.5% 12.2%
EV on Road (#) 1,250 4,469 10,083 19,887 31,625 46,757 65,620 89,468 118,893 152,731 198,433 243,733 288,368 331,931 374,100 413,720 450,538 488,041 525,724 563,320 600,241
EV Sales (%) 0.2% 1.1% 1.9% 3.3% 4.0% 5.1% 6.4% 8.0% 9.8% 11.3% 15.2% 15.0% 14.8% 14.4% 14.1% 13.5% 12.9% 13.6% 14.4% 15.1% 15.8%
EV Sales (#) 553 3,267 5,663 9,855 11,789 15,186 18,922 23,914 29,505 33,939 45,912 45,569 45,026 44,196 43,267 41,524 39,930 42,355 44,761 47,299 49,689
EV on Road (%) 0.0% 0.0% 0.1% 0.2% 0.3% 0.4% 0.6% 0.7% 1.0% 1.3% 1.6% 1.9% 2.3% 2.7% 3.3% 3.9% 4.3% 4.7% 5.0% 5.3% 5.6%
EV on Road (#) 737 1,760 3,928 7,900 12,527 17,824 24,501 33,131 44,181 57,282 72,224 88,683 106,539 125,687 151,719 176,406 199,670 221,161 240,681 258,150 273,325
EV Sales (%) 0.0% 0.4% 0.8% 1.4% 1.6% 1.8% 2.3% 2.9% 3.7% 4.4% 5.0% 5.5% 6.0% 6.4% 8.7% 8.4% 8.0% 7.6% 7.2% 6.9% 6.5%
EV Sales (#) 41 1,069 2,214 4,019 4,673 5,344 6,725 8,680 11,105 13,164 15,017 16,559 18,003 19,386 26,510 25,461 24,465 23,353 22,213 21,131 19,944
EV on Road (%) 0.1% 0.2% 0.4% 0.8% 1.2% 1.8% 3.2% 4.8% 6.7% 8.8% 11.0% 13.3% 15.8% 18.5% 21.4% 24.8% 26.5% 28.3% 30.2% 32.1% 33.9%
EV on Road (#) 1,025 2,656 5,227 9,590 14,610 21,444 37,302 55,691 76,760 99,425 123,458 148,605 173,968 199,850 226,103 252,407 278,636 304,441 329,499 353,435 375,715
EV Sales (%) 0.3% 2.6% 3.9% 6.6% 7.6% 10.3% 23.9% 27.6% 31.4% 33.7% 35.6% 37.2% 37.5% 38.3% 39.0% 39.6% 40.2% 40.8% 41.4% 42.0% 42.7%
EV Sales (#) 227 1,685 2,626 4,418 5,076 6,892 16,103 18,636 21,316 22,919 24,299 25,439 25,708 26,332 26,923 27,366 27,872 28,350 28,836 29,369 29,883
EV on Road (%) 0.1% 0.1% 0.2% 0.4% 0.5% 0.8% 1.1% 1.5% 2.0% 2.6% 3.9% 5.3% 6.9% 8.6% 10.7% 13.2% 14.8% 16.5% 18.1% 19.8% 21.5%
EV on Road (#) 887 1,438 2,470 4,334 6,526 9,373 12,958 17,455 22,991 29,329 43,957 59,166 75,446 93,138 112,953 134,236 155,267 176,188 196,892 217,301 237,290
EV Sales (%) 0.1% 0.9% 1.6% 2.9% 3.4% 4.3% 5.4% 6.8% 8.3% 9.5% 22.0% 22.9% 24.5% 26.6% 29.7% 32.0% 31.9% 32.2% 32.4% 32.7% 33.0%
EV Sales (#) 89 605 1,086 1,918 2,247 2,903 3,641 4,555 5,597 6,403 14,919 15,532 16,663 18,129 20,333 21,954 21,894 22,119 22,342 22,574 22,803
EV on Road (%) 0.1% 0.1% 0.1% 0.2% 0.2% 0.3% 0.4% 0.6% 0.8% 1.0% 1.2% 1.5% 1.8% 2.2% 3.7% 5.2% 6.5% 7.6% 8.8% 10.0% 11.1%
EV on Road (#) 800 915 1,264 1,983 2,833 3,809 5,030 6,612 8,644 11,062 13,824 16,870 20,181 23,738 38,483 52,992 67,306 81,326 95,021 108,366 121,329
EV Sales (%) 0.0% 0.3% 0.6% 1.2% 1.4% 1.5% 1.9% 2.4% 3.1% 3.7% 4.2% 4.6% 5.0% 5.4% 22.4% 22.1% 21.8% 21.6% 21.3% 21.0% 20.8%
EV Sales (#) 2 168 403 772 903 1,029 1,274 1,636 2,087 2,474 2,821 3,108 3,382 3,645 15,216 15,032 14,871 14,701 14,536 14,379 14,219
QLD
Weak
EV Uptake
EV Sales
Strong
EV Uptake
EV Sales
Neutral
EV Uptake
EV Sales
NSW +
ACT
VIC
EV Sales
EV Uptake
EV Sales
Neutral
EV Uptake
EV Sales
Strong
Weak
EV Uptake
EV Sales
Strong
EV Uptake
Neutral
EV Uptake
Weak
EV Uptake
EV Sales
Weak
EV Uptake
EV Sales
SA
EV Sales
Strong
EV Uptake
EV Sales
Neutral
EV Uptake
EV Sales
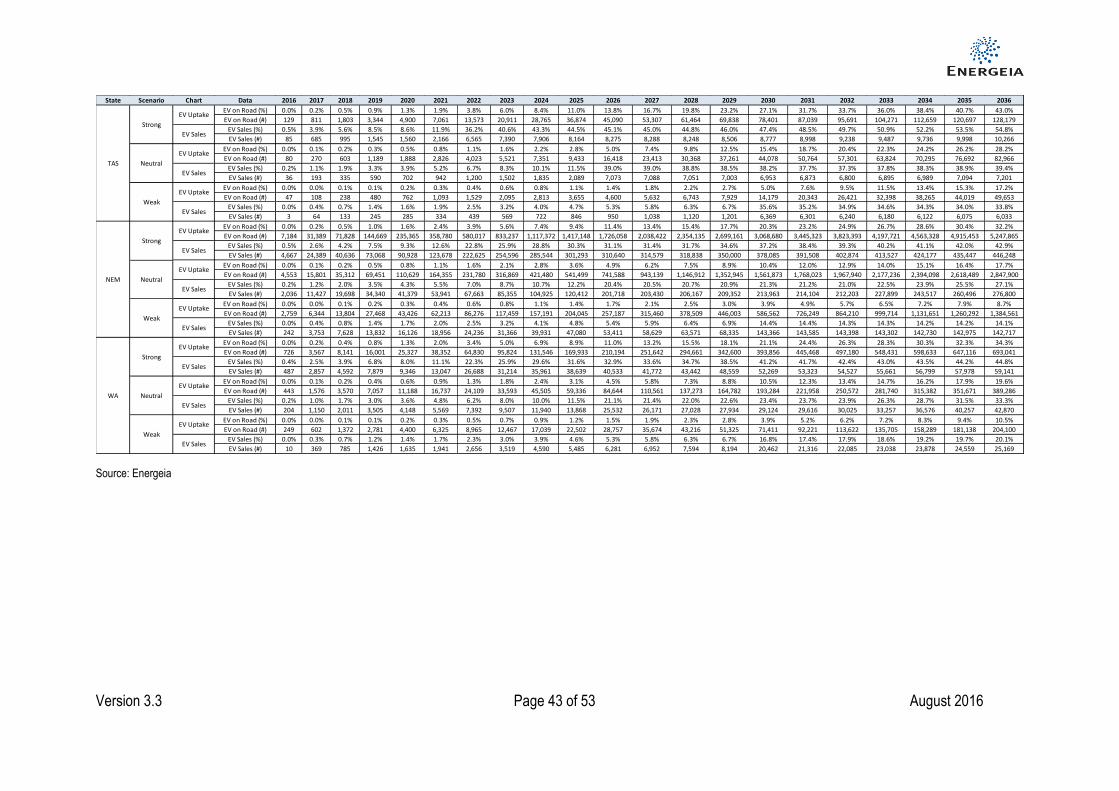
Version 3.3 Page 43 of 53 August 2016
Source: Energeia
State Scenario Chart Data 2016 2017 2018 2019 2020 2021 2022 2023 2024 2025 2026 2027 2028 2029 2030 2031 2032 2033 2034 2035 2036
EV on Road (%) 0.0% 0.2% 0.5% 0.9% 1.3% 1.9% 3.8% 6.0% 8.4% 11.0% 13.8% 16.7% 19.8% 23.2% 27.1% 31.7% 33.7% 36.0% 38.4% 40.7% 43.0%
EV on Road (#) 129 811 1,803 3,344 4,900 7,061 13,573 20,911 28,765 36,874 45,090 53,307 61,464 69,838 78,401 87,039 95,691 104,271 112,659 120,697 128,179
EV Sales (%) 0.5% 3.9% 5.6% 8.5% 8.6% 11.9% 36.2% 40.6% 43.3% 44.5% 45.1% 45.0% 44.8% 46.0% 47.4% 48.5% 49.7% 50.9% 52.2% 53.5% 54.8%
EV Sales (#) 85 685 995 1,545 1,560 2,166 6,565 7,390 7,906 8,164 8,275 8,288 8,248 8,506 8,777 8,998 9,238 9,487 9,736 9,998 10,266
EV on Road (%) 0.0% 0.1% 0.2% 0.3% 0.5% 0.8% 1.1% 1.6% 2.2% 2.8% 5.0% 7.4% 9.8% 12.5% 15.4% 18.7% 20.4% 22.3% 24.2% 26.2% 28.2%
EV on Road (#) 80 270 603 1,189 1,888 2,826 4,023 5,521 7,351 9,433 16,418 23,413 30,368 37,261 44,078 50,764 57,301 63,824 70,295 76,692 82,966
EV Sales (%) 0.2% 1.1% 1.9% 3.3% 3.9% 5.2% 6.7% 8.3% 10.1% 11.5% 39.0% 39.0% 38.8% 38.5% 38.2% 37.7% 37.3% 37.8% 38.3% 38.9% 39.4%
EV Sales (#) 36 193 335 590 702 942 1,200 1,502 1,835 2,089 7,073 7,088 7,051 7,003 6,953 6,873 6,800 6,895 6,989 7,094 7,201
EV on Road (%) 0.0% 0.0% 0.1% 0.1% 0.2% 0.3% 0.4% 0.6% 0.8% 1.1% 1.4% 1.8% 2.2% 2.7% 5.0% 7.6% 9.5% 11.5% 13.4% 15.3% 17.2%
EV on Road (#) 47 108 238 480 762 1,093 1,529 2,095 2,813 3,655 4,600 5,632 6,743 7,929 14,179 20,343 26,421 32,398 38,265 44,019 49,653
EV Sales (%) 0.0% 0.4% 0.7% 1.4% 1.6% 1.9% 2.5% 3.2% 4.0% 4.7% 5.3% 5.8% 6.3% 6.7% 35.6% 35.2% 34.9% 34.6% 34.3% 34.0% 33.8%
EV Sales (#) 3 64 133 245 285 334 439 569 722 846 950 1,038 1,120 1,201 6,369 6,301 6,240 6,180 6,122 6,075 6,033
EV on Road (%) 0.0% 0.2% 0.5% 1.0% 1.6% 2.4% 3.9% 5.6% 7.4% 9.4% 11.4% 13.4% 15.4% 17.7% 20.3% 23.2% 24.9% 26.7% 28.6% 30.4% 32.2%
EV on Road (#) 7,184 31,389 71,828 144,669 235,365 358,780 580,017 833,237 1,117,372 1,417,148 1,726,058 2,038,422 2,354,135 2,699,161 3,068,680 3,445,323 3,823,393 4,197,721 4,563,328 4,915,453 5,247,865
EV Sales (%) 0.5% 2.6% 4.2% 7.5% 9.3% 12.6% 22.8% 25.9% 28.8% 30.3% 31.1% 31.4% 31.7% 34.6% 37.2% 38.4% 39.3% 40.2% 41.1% 42.0% 42.9%
EV Sales (#) 4,667 24,389 40,636 73,068 90,928 123,678 222,625 254,596 285,544 301,293 310,640 314,579 318,838 350,000 378,085 391,508 402,874 413,527 424,177 435,447 446,248
EV on Road (%) 0.0% 0.1% 0.2% 0.5% 0.8% 1.1% 1.6% 2.1% 2.8% 3.6% 4.9% 6.2% 7.5% 8.9% 10.4% 12.0% 12.9% 14.0% 15.1% 16.4% 17.7%
EV on Road (#) 4,553 15,801 35,312 69,451 110,629 164,355 231,780 316,869 421,480 541,499 741,588 943,139 1,146,912 1,352,945 1,561,873 1,768,023 1,967,940 2,177,236 2,394,098 2,618,489 2,847,900
EV Sales (%) 0.2% 1.2% 2.0% 3.5% 4.3% 5.5% 7.0% 8.7% 10.7% 12.2% 20.4% 20.5% 20.7% 20.9% 21.3% 21.2% 21.0% 22.5% 23.9% 25.5% 27.1%
EV Sales (#) 2,036 11,427 19,698 34,340 41,379 53,941 67,663 85,355 104,925 120,412 201,718 203,430 206,167 209,352 213,963 214,104 212,203 227,899 243,517 260,496 276,800
EV on Road (%) 0.0% 0.0% 0.1% 0.2% 0.3% 0.4% 0.6% 0.8% 1.1% 1.4% 1.7% 2.1% 2.5% 3.0% 3.9% 4.9% 5.7% 6.5% 7.2% 7.9% 8.7%
EV on Road (#) 2,759 6,344 13,804 27,468 43,426 62,213 86,276 117,459 157,191 204,045 257,187 315,460 378,509 446,003 586,562 726,249 864,210 999,714 1,131,651 1,260,292 1,384,561
EV Sales (%) 0.0% 0.4% 0.8% 1.4% 1.7% 2.0% 2.5% 3.2% 4.1% 4.8% 5.4% 5.9% 6.4% 6.9% 14.4% 14.4% 14.3% 14.3% 14.2% 14.2% 14.1%
EV Sales (#) 242 3,753 7,628 13,832 16,126 18,956 24,236 31,366 39,931 47,080 53,411 58,629 63,571 68,335 143,366 143,585 143,398 143,302 142,730 142,975 142,717
EV on Road (%) 0.0% 0.2% 0.4% 0.8% 1.3% 2.0% 3.4% 5.0% 6.9% 8.9% 11.0% 13.2% 15.5% 18.1% 21.1% 24.4% 26.3% 28.3% 30.3% 32.3% 34.3%
EV on Road (#) 726 3,567 8,141 16,001 25,327 38,352 64,830 95,824 131,546 169,933 210,194 251,642 294,661 342,600 393,856 445,468 497,180 548,431 598,633 647,116 693,041
EV Sales (%) 0.4% 2.5% 3.9% 6.8% 8.0% 11.1% 22.3% 25.9% 29.6% 31.6% 32.9% 33.6% 34.7% 38.5% 41.2% 41.7% 42.4% 43.0% 43.5% 44.2% 44.8%
EV Sales (#) 487 2,857 4,592 7,879 9,346 13,047 26,688 31,214 35,961 38,639 40,533 41,772 43,442 48,559 52,269 53,323 54,527 55,661 56,799 57,978 59,141
EV on Road (%) 0.0% 0.1% 0.2% 0.4% 0.6% 0.9% 1.3% 1.8% 2.4% 3.1% 4.5% 5.8% 7.3% 8.8% 10.5% 12.3% 13.4% 14.7% 16.2% 17.9% 19.6%
EV on Road (#) 443 1,576 3,570 7,057 11,188 16,737 24,109 33,593 45,505 59,336 84,644 110,561 137,273 164,782 193,284 221,958 250,572 281,740 315,382 351,671 389,286
EV Sales (%) 0.2% 1.0% 1.7% 3.0% 3.6% 4.8% 6.2% 8.0% 10.0% 11.5% 21.1% 21.4% 22.0% 22.6% 23.4% 23.7% 23.9% 26.3% 28.7% 31.5% 33.3%
EV Sales (#) 204 1,150 2,011 3,505 4,148 5,569 7,392 9,507 11,940 13,868 25,532 26,171 27,028 27,934 29,124 29,616 30,025 33,257 36,576 40,257 42,870
EV on Road (%) 0.0% 0.0% 0.1% 0.1% 0.2% 0.3% 0.5% 0.7% 0.9% 1.2% 1.5% 1.9% 2.3% 2.8% 3.9% 5.2% 6.2% 7.2% 8.3% 9.4% 10.5%
EV on Road (#) 249 602 1,372 2,781 4,400 6,325 8,965 12,467 17,039 22,502 28,757 35,674 43,216 51,325 71,411 92,221 113,622 135,705 158,289 181,138 204,100
EV Sales (%) 0.0% 0.3% 0.7% 1.2% 1.4% 1.7% 2.3% 3.0% 3.9% 4.6% 5.3% 5.8% 6.3% 6.7% 16.8% 17.4% 17.9% 18.6% 19.2% 19.7% 20.1%
EV Sales (#) 10 369 785 1,426 1,635 1,941 2,656 3,519 4,590 5,485 6,281 6,952 7,594 8,194 20,462 21,316 22,085 23,038 23,878 24,559 25,169
Neutral
EV Uptake
EV Sales
Strong
EV Uptake
EV Sales
Neutral
EV Uptake
EV Sales
Weak
EV Uptake
EV Sales
Weak
EV Uptake
EV Sales
Strong
EV Uptake
Strong
EV Uptake
EV Sales
Neutral
EV Uptake
TAS
NEM
WA
Weak
EV Uptake
EV Sales
EV Sales
EV Sales
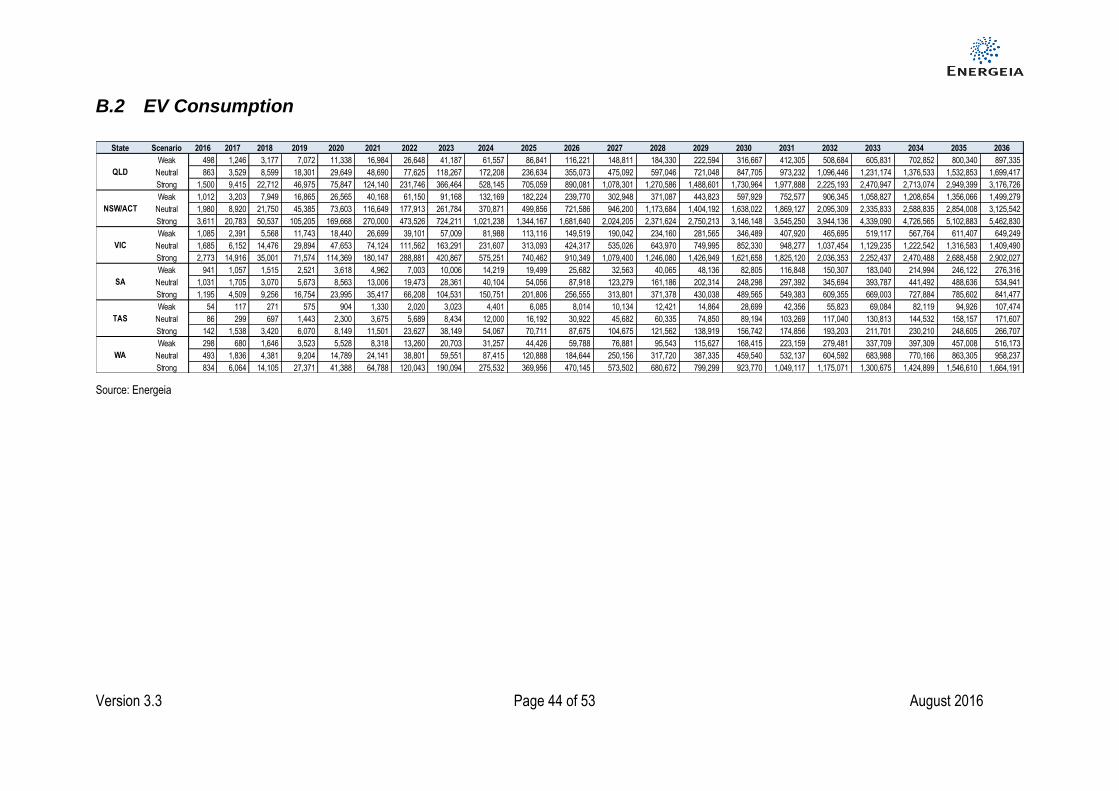
Version 3.3 Page 44 of 53 August 2016
B.2 EV Consumption
Source: Energeia
State Scenario 2016 2017 2018 2019 2020 2021 2022 2023 2024 2025 2026 2027 2028 2029 2030 2031 2032 2033 2034 2035 2036
Weak 498 1,246 3,177 7,072 11,338 16,984 26,648 41,187 61,557 86,841 116,221 148,811 184,330 222,594 316,667 412,305 508,684 605,831 702,852 800,340 897,335
Neutral 863 3,529 8,599 18,301 29,649 48,690 77,625 118,267 172,208 236,634 355,073 475,092 597,046 721,048 847,705 973,232 1,096,446 1,231,174 1,376,533 1,532,853 1,699,417
Strong 1,500 9,415 22,712 46,975 75,847 124,140 231,746 366,464 528,145 705,059 890,081 1,078,301 1,270,586 1,488,601 1,730,964 1,977,888 2,225,193 2,470,947 2,713,074 2,949,399 3,176,726
Weak 1,012 3,203 7,949 16,865 26,565 40,168 61,150 91,168 132,169 182,224 239,770 302,948 371,087 443,823 597,929 752,577 906,345 1,058,827 1,208,654 1,356,066 1,499,279
Neutral 1,980 8,920 21,750 45,385 73,603 116,649 177,913 261,784 370,871 499,856 721,586 946,200 1,173,684 1,404,192 1,638,022 1,869,127 2,095,309 2,335,833 2,588,835 2,854,008 3,125,542
Strong 3,611 20,783 50,537 105,205 169,668 270,000 473,526 724,211 1,021,238 1,344,167 1,681,640 2,024,205 2,371,624 2,750,213 3,146,148 3,545,250 3,944,136 4,339,090 4,726,565 5,102,883 5,462,830
Weak 1,085 2,391 5,568 11,743 18,440 26,699 39,101 57,009 81,988 113,116 149,519 190,042 234,160 281,565 346,489 407,920 465,695 519,117 567,764 611,407 649,249
Neutral 1,685 6,152 14,476 29,894 47,653 74,124 111,562 163,291 231,607 313,093 424,317 535,026 643,970 749,995 852,330 948,277 1,037,454 1,129,235 1,222,542 1,316,583 1,409,490
Strong 2,773 14,916 35,001 71,574 114,369 180,147 288,881 420,867 575,251 740,462 910,349 1,079,400 1,246,080 1,426,949 1,621,658 1,825,120 2,036,353 2,252,437 2,470,488 2,688,458 2,902,027
Weak 941 1,057 1,515 2,521 3,618 4,962 7,003 10,006 14,219 19,499 25,682 32,563 40,065 48,136 82,805 116,848 150,307 183,040 214,994 246,122 276,316
Neutral 1,031 1,705 3,070 5,673 8,563 13,006 19,473 28,361 40,104 54,056 87,918 123,279 161,186 202,314 248,298 297,392 345,694 393,787 441,492 488,636 534,941
Strong 1,195 4,509 9,256 16,754 23,995 35,417 66,208 104,531 150,751 201,806 256,555 313,801 371,378 430,038 489,565 549,383 609,355 669,003 727,884 785,602 841,477
Weak 54 117 271 575 904 1,330 2,020 3,023 4,401 6,085 8,014 10,134 12,421 14,864 28,699 42,356 55,823 69,084 82,119 94,926 107,474
Neutral 86 299 697 1,443 2,300 3,675 5,689 8,434 12,000 16,192 30,922 45,682 60,335 74,850 89,194 103,269 117,040 130,813 144,532 158,157 171,607
Strong 142 1,538 3,420 6,070 8,149 11,501 23,627 38,149 54,067 70,711 87,675 104,675 121,562 138,919 156,742 174,856 193,203 211,701 230,210 248,605 266,707
Weak 298 680 1,646 3,523 5,528 8,318 13,260 20,703 31,257 44,426 59,788 76,881 95,543 115,627 168,415 223,159 279,481 337,709 397,309 457,008 516,173
Neutral 493 1,836 4,381 9,204 14,789 24,141 38,801 59,551 87,415 120,888 184,644 250,156 317,720 387,335 459,540 532,137 604,592 683,988 770,166 863,305 958,237
Strong 834 6,064 14,105 27,371 41,388 64,788 120,043 190,094 275,532 369,956 470,145 573,502 680,672 799,299 923,770 1,049,117 1,175,071 1,300,675 1,424,899 1,546,610 1,664,191
VIC
SA
TAS
WA
QLD
NSW/ACT

Version 3.3 Page 45 of 53 August 2016
B.3 EV Load Profiles
B.3.1 Queensland - Neutral
2020
Source: Energeia
2025
Source: Energeia
10
20
30
40
50
60
70
00
:00
:00
01
:00
:00
02
:00
:00
03
:00
:00
04
:00
:00
05
:00
:00
06
:00
:00
07
:00
:00
08
:00
:00
09
:00
:00
10
:00
:00
11
:00
:00
12
:00
:00
13
:00
:00
14
:00
:00
15
:00
:00
16
:00
:00
17
:00
:00
18
:00
:00
19
:00
:00
20
:00
:00
21
:00
:00
22
:00
:00
23
:00
:00
Max
imu
m D
em
and
(M
W)
Home Based Fleet Based
50
100
150
200
250
300
350
400
00
:00
:00
01
:00
:00
02
:00
:00
03
:00
:00
04
:00
:00
05
:00
:00
06
:00
:00
07
:00
:00
08
:00
:00
09
:00
:00
10
:00
:00
11
:00
:00
12
:00
:00
13
:00
:00
14
:00
:00
15
:00
:00
16
:00
:00
17
:00
:00
18
:00
:00
19
:00
:00
20
:00
:00
21
:00
:00
22
:00
:00
23
:00
:00
Max
imu
m D
em
and
(M
W)
Home Based Fleet Based
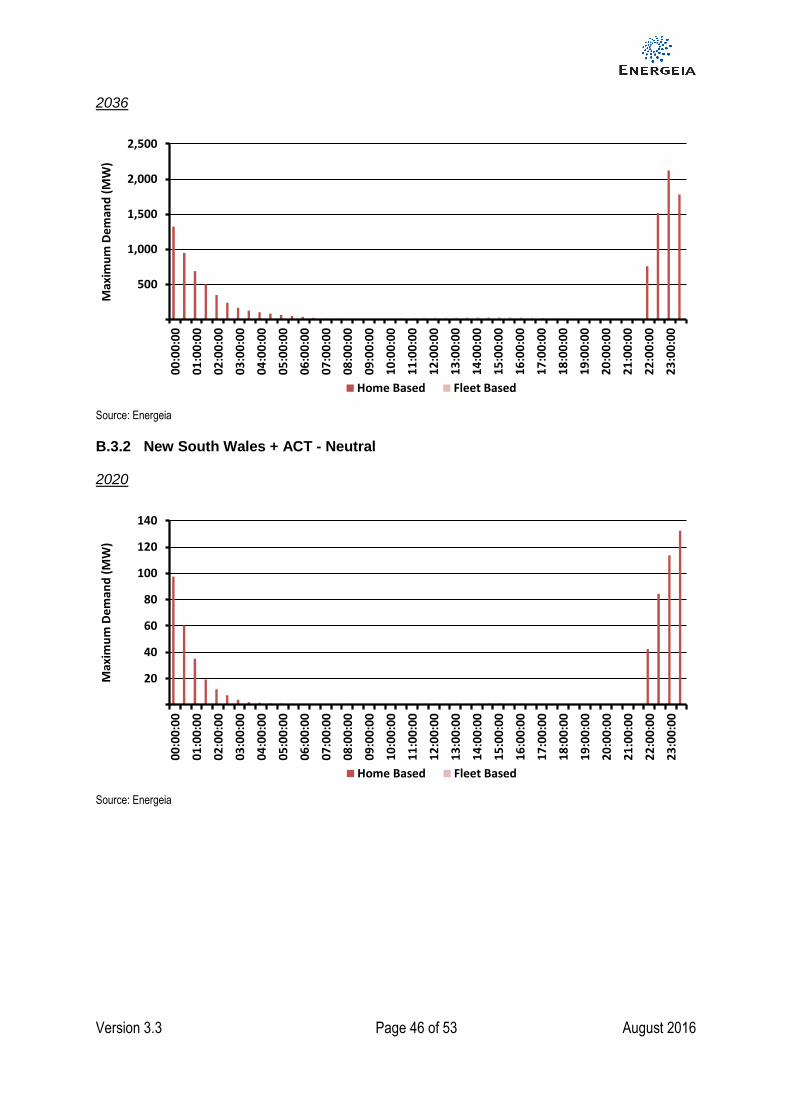
Version 3.3 Page 46 of 53 August 2016
2036
Source: Energeia
B.3.2 New South Wales + ACT - Neutral
2020
Source: Energeia
500
1,000
1,500
2,000
2,500
00
:00
:00
01
:00
:00
02
:00
:00
03
:00
:00
04
:00
:00
05
:00
:00
06
:00
:00
07
:00
:00
08
:00
:00
09
:00
:00
10
:00
:00
11
:00
:00
12
:00
:00
13
:00
:00
14
:00
:00
15
:00
:00
16
:00
:00
17
:00
:00
18
:00
:00
19
:00
:00
20
:00
:00
21
:00
:00
22
:00
:00
23
:00
:00
Max
imu
m D
em
and
(M
W)
Home Based Fleet Based
20
40
60
80
100
120
140
00
:00
:00
01
:00
:00
02
:00
:00
03
:00
:00
04
:00
:00
05
:00
:00
06
:00
:00
07
:00
:00
08
:00
:00
09
:00
:00
10
:00
:00
11
:00
:00
12
:00
:00
13
:00
:00
14
:00
:00
15
:00
:00
16
:00
:00
17
:00
:00
18
:00
:00
19
:00
:00
20
:00
:00
21
:00
:00
22
:00
:00
23
:00
:00
Max
imu
m D
em
and
(M
W)
Home Based Fleet Based
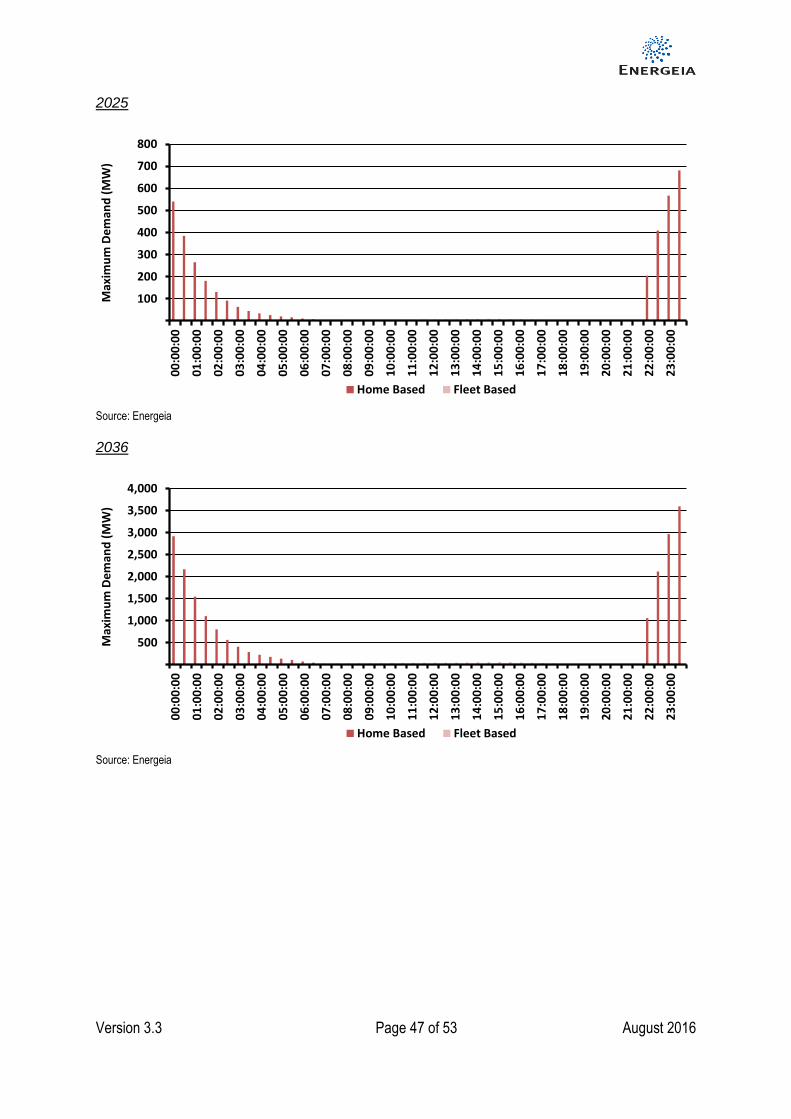
Version 3.3 Page 47 of 53 August 2016
2025
Source: Energeia
2036
Source: Energeia
100
200
300
400
500
600
700
800
00
:00
:00
01
:00
:00
02
:00
:00
03
:00
:00
04
:00
:00
05
:00
:00
06
:00
:00
07
:00
:00
08
:00
:00
09
:00
:00
10
:00
:00
11
:00
:00
12
:00
:00
13
:00
:00
14
:00
:00
15
:00
:00
16
:00
:00
17
:00
:00
18
:00
:00
19
:00
:00
20
:00
:00
21
:00
:00
22
:00
:00
23
:00
:00
Max
imu
m D
em
and
(M
W)
Home Based Fleet Based
500
1,000
1,500
2,000
2,500
3,000
3,500
4,000
00
:00
:00
01
:00
:00
02
:00
:00
03
:00
:00
04
:00
:00
05
:00
:00
06
:00
:00
07
:00
:00
08
:00
:00
09
:00
:00
10
:00
:00
11
:00
:00
12
:00
:00
13
:00
:00
14
:00
:00
15
:00
:00
16
:00
:00
17
:00
:00
18
:00
:00
19
:00
:00
20
:00
:00
21
:00
:00
22
:00
:00
23
:00
:00
Max
imu
m D
em
and
(M
W)
Home Based Fleet Based

Version 3.3 Page 48 of 53 August 2016
B.3.3 Victoria - Neutral
2020
Source: Energeia
2025
Source: Energeia
10
20
30
40
50
60
70
800
0:0
0:0
0
01
:00
:00
02
:00
:00
03
:00
:00
04
:00
:00
05
:00
:00
06
:00
:00
07
:00
:00
08
:00
:00
09
:00
:00
10
:00
:00
11
:00
:00
12
:00
:00
13
:00
:00
14
:00
:00
15
:00
:00
16
:00
:00
17
:00
:00
18
:00
:00
19
:00
:00
20
:00
:00
21
:00
:00
22
:00
:00
23
:00
:00
Max
imu
m D
em
and
(M
W)
Home Based Fleet Based
50
100
150
200
250
300
350
400
00
:00
:00
01
:00
:00
02
:00
:00
03
:00
:00
04
:00
:00
05
:00
:00
06
:00
:00
07
:00
:00
08
:00
:00
09
:00
:00
10
:00
:00
11
:00
:00
12
:00
:00
13
:00
:00
14
:00
:00
15
:00
:00
16
:00
:00
17
:00
:00
18
:00
:00
19
:00
:00
20
:00
:00
21
:00
:00
22
:00
:00
23
:00
:00
Max
imu
m D
em
and
(M
W)
Home Based Fleet Based
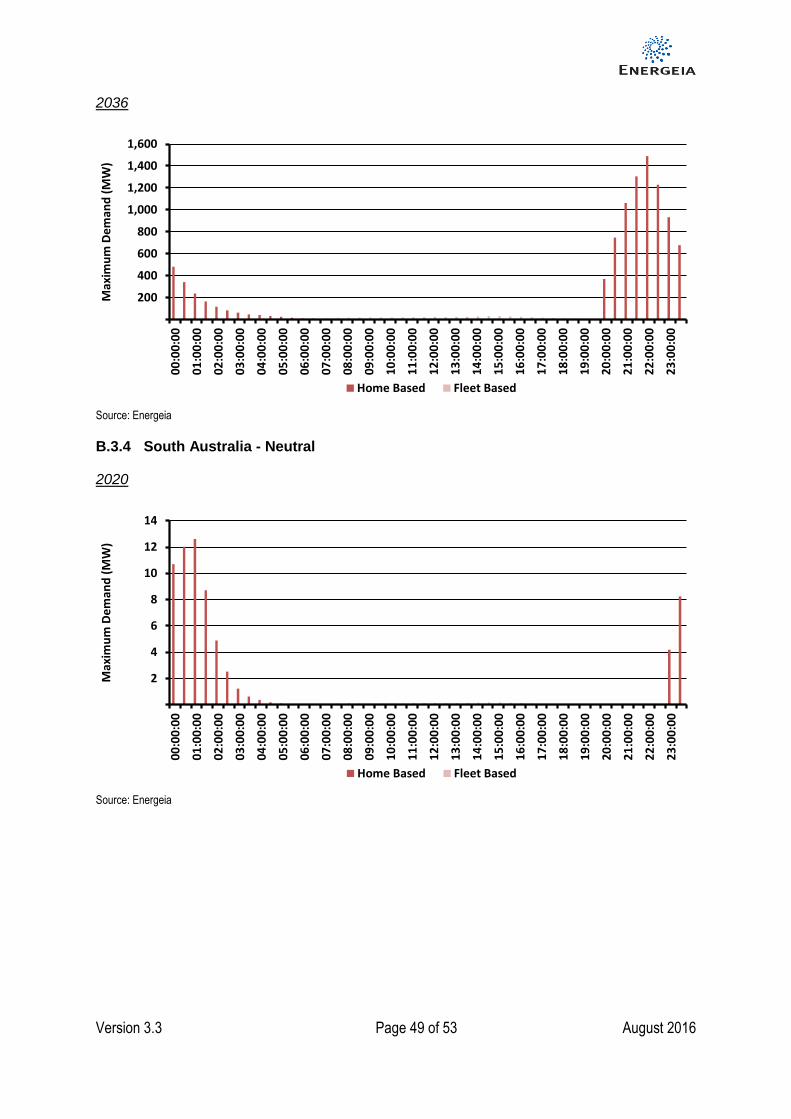
Version 3.3 Page 49 of 53 August 2016
2036
Source: Energeia
B.3.4 South Australia - Neutral
2020
Source: Energeia
200
400
600
800
1,000
1,200
1,400
1,600
00
:00
:00
01
:00
:00
02
:00
:00
03
:00
:00
04
:00
:00
05
:00
:00
06
:00
:00
07
:00
:00
08
:00
:00
09
:00
:00
10
:00
:00
11
:00
:00
12
:00
:00
13
:00
:00
14
:00
:00
15
:00
:00
16
:00
:00
17
:00
:00
18
:00
:00
19
:00
:00
20
:00
:00
21
:00
:00
22
:00
:00
23
:00
:00
Max
imu
m D
em
and
(M
W)
Home Based Fleet Based
2
4
6
8
10
12
14
00
:00
:00
01
:00
:00
02
:00
:00
03
:00
:00
04
:00
:00
05
:00
:00
06
:00
:00
07
:00
:00
08
:00
:00
09
:00
:00
10
:00
:00
11
:00
:00
12
:00
:00
13
:00
:00
14
:00
:00
15
:00
:00
16
:00
:00
17
:00
:00
18
:00
:00
19
:00
:00
20
:00
:00
21
:00
:00
22
:00
:00
23
:00
:00
Max
imu
m D
em
and
(M
W)
Home Based Fleet Based

Version 3.3 Page 50 of 53 August 2016
2025
Source: Energeia
2036
Source: Energeia
10
20
30
40
50
60
70
80
00
:00
:00
01
:00
:00
02
:00
:00
03
:00
:00
04
:00
:00
05
:00
:00
06
:00
:00
07
:00
:00
08
:00
:00
09
:00
:00
10
:00
:00
11
:00
:00
12
:00
:00
13
:00
:00
14
:00
:00
15
:00
:00
16
:00
:00
17
:00
:00
18
:00
:00
19
:00
:00
20
:00
:00
21
:00
:00
22
:00
:00
23
:00
:00
Max
imu
m D
em
and
(M
W)
Home Based Fleet Based
100
200
300
400
500
600
00
:00
:00
01
:00
:00
02
:00
:00
03
:00
:00
04
:00
:00
05
:00
:00
06
:00
:00
07
:00
:00
08
:00
:00
09
:00
:00
10
:00
:00
11
:00
:00
12
:00
:00
13
:00
:00
14
:00
:00
15
:00
:00
16
:00
:00
17
:00
:00
18
:00
:00
19
:00
:00
20
:00
:00
21
:00
:00
22
:00
:00
23
:00
:00
Max
imu
m D
em
and
(M
W)
Home Based Fleet Based
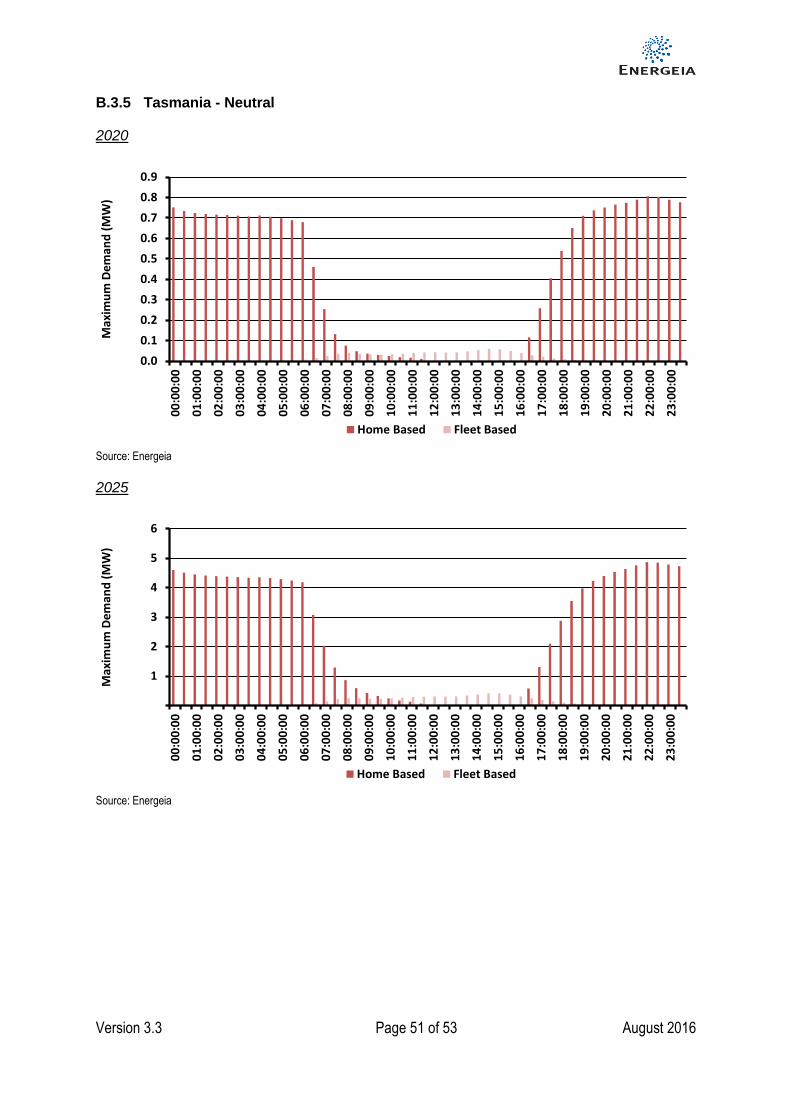
Version 3.3 Page 51 of 53 August 2016
B.3.5 Tasmania - Neutral
2020
Source: Energeia
2025
Source: Energeia
0.0
0.1
0.2
0.3
0.4
0.5
0.6
0.7
0.8
0.90
0:0
0:0
0
01
:00
:00
02
:00
:00
03
:00
:00
04
:00
:00
05
:00
:00
06
:00
:00
07
:00
:00
08
:00
:00
09
:00
:00
10
:00
:00
11
:00
:00
12
:00
:00
13
:00
:00
14
:00
:00
15
:00
:00
16
:00
:00
17
:00
:00
18
:00
:00
19
:00
:00
20
:00
:00
21
:00
:00
22
:00
:00
23
:00
:00
Max
imu
m D
em
and
(M
W)
Home Based Fleet Based
1
2
3
4
5
6
00
:00
:00
01
:00
:00
02
:00
:00
03
:00
:00
04
:00
:00
05
:00
:00
06
:00
:00
07
:00
:00
08
:00
:00
09
:00
:00
10
:00
:00
11
:00
:00
12
:00
:00
13
:00
:00
14
:00
:00
15
:00
:00
16
:00
:00
17
:00
:00
18
:00
:00
19
:00
:00
20
:00
:00
21
:00
:00
22
:00
:00
23
:00
:00
Max
imu
m D
em
and
(M
W)
Home Based Fleet Based
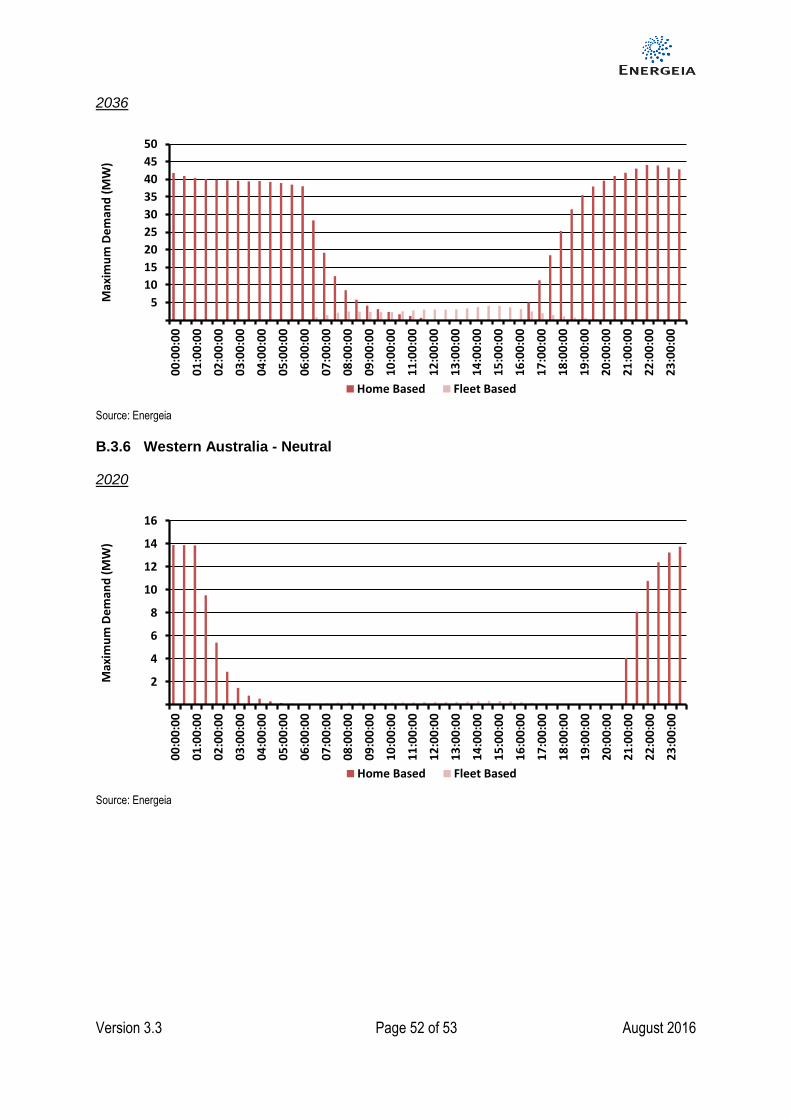
Version 3.3 Page 52 of 53 August 2016
2036
Source: Energeia
B.3.6 Western Australia - Neutral
2020
Source: Energeia
5
10
15
20
25
30
35
40
45
50
00
:00
:00
01
:00
:00
02
:00
:00
03
:00
:00
04
:00
:00
05
:00
:00
06
:00
:00
07
:00
:00
08
:00
:00
09
:00
:00
10
:00
:00
11
:00
:00
12
:00
:00
13
:00
:00
14
:00
:00
15
:00
:00
16
:00
:00
17
:00
:00
18
:00
:00
19
:00
:00
20
:00
:00
21
:00
:00
22
:00
:00
23
:00
:00
Max
imu
m D
em
and
(M
W)
Home Based Fleet Based
2
4
6
8
10
12
14
16
00
:00
:00
01
:00
:00
02
:00
:00
03
:00
:00
04
:00
:00
05
:00
:00
06
:00
:00
07
:00
:00
08
:00
:00
09
:00
:00
10
:00
:00
11
:00
:00
12
:00
:00
13
:00
:00
14
:00
:00
15
:00
:00
16
:00
:00
17
:00
:00
18
:00
:00
19
:00
:00
20
:00
:00
21
:00
:00
22
:00
:00
23
:00
:00
Max
imu
m D
em
and
(M
W)
Home Based Fleet Based

Version 3.3 Page 53 of 53 August 2016
2025
Source: Energeia
2036
Source: Energeia
10
20
30
40
50
60
70
80
90
100
00
:00
:00
01
:00
:00
02
:00
:00
03
:00
:00
04
:00
:00
05
:00
:00
06
:00
:00
07
:00
:00
08
:00
:00
09
:00
:00
10
:00
:00
11
:00
:00
12
:00
:00
13
:00
:00
14
:00
:00
15
:00
:00
16
:00
:00
17
:00
:00
18
:00
:00
19
:00
:00
20
:00
:00
21
:00
:00
22
:00
:00
23
:00
:00
Max
imu
m D
em
and
(M
W)
Home Based Fleet Based
100
200
300
400
500
600
700
00
:00
:00
01
:00
:00
02
:00
:00
03
:00
:00
04
:00
:00
05
:00
:00
06
:00
:00
07
:00
:00
08
:00
:00
09
:00
:00
10
:00
:00
11
:00
:00
12
:00
:00
13
:00
:00
14
:00
:00
15
:00
:00
16
:00
:00
17
:00
:00
18
:00
:00
19
:00
:00
20
:00
:00
21
:00
:00
22
:00
:00
23
:00
:00
Max
imu
m D
em
and
(M
W)
Home Based Fleet Based