electrical impedance tomography: the realisation … impedance tomography: the realisation of...
TRANSCRIPT
Electrical Impedance Tomography:The realisation of regional ventilation monitoring2nd edition
Eckhard Teschner Michael Imhoff Steffen Leonhardt
D-8
7-20
10


Electrical Impedance Tomography:The realisation of regional ventilation monitoring 2nd edition
Eckhard Teschner Michael Imhoff Steffen Leonhardt

04|
EditorDrägerwerk AG & Co. KGaAMoislinger Allee 53–55D-23542 Lübeckwww.draeger.com
Important notes
This brochure is for educational purposes only and does not replace the instructions for use. Prior to using the technique of EIT (Electrical Impedance Tomography), the corresponding instructions for use must always be read and complied with.
Medical knowledge is subject to constant change due to research and clinical experience. The authors of this publication have taken utmost care to ensure that all information provided, in particular concerning applications and effects, is current at the time of publication. This does not, however, absolve readers of the obligation to take clinical measures on their own responsibility.
The use of registered names, trademarks, etc. in this publication does not imply, even in the absence of a specific statement, that such names are exempt from the relevant protective laws and regulations.
Drägerwerk AG & Co. KGaA reserves all rights, especially the right of reproduction and distribution. No part of this publication may be reproduced or stored in any form by mechanical, electronic or photographic means without the prior written permission of Drägerwerk AG & Co. KGaA.

04|05
CONTENTS
1. Foreword 6
2. Introduction 9
3. ThehistoryofEIT 12
4. TheprinciplesofEITasappliedbyDrägerPulmoVista®500 19
5. ClinicalinformationderivedfromDrägerPulmoVista®500 34
6. Clinicalapplicationexamples 49
7. Indicationsandcontraindications 57
8. ConsiderationsforEITdatainterpretation 62
9. Validationstudies 72 Animalstudies 72 Patientstudies 75
10. Observationalexperimentalandclinicalstudies 78
11. EIT-derivednumericalindices 88
12. EITforguidanceofrespiratorytherapy 93
13. Acallforconsensus 95
14. ExamplesofEITstatusimages 96
15. Outlook 106
AppendixI:Literaturereferences 108AppendixII:Determiningthebiologicalimpedanceofthelung 123AppendixIII:Glossary 133

06|ELECTRICAL IMPEDANCE TOMOGRAPHY | 1. FOREWORD
This booklet accompanies the introduction of Electrical Impedance Tomography (EIT) as a clinical application for monitoring of regional lung function, especially in intensive care patients. In this context, four questions must be answered:
Why introduce EIT as a supplementary imaging technique in medicine?What information can be gained from EIT?Which clinical benefits can be expected?Why did it take about 30 years to develop appropriate clinical devices?
Today, clinicians are accustomed to rapid improvements of high resolution imaging techniques, such as 128-slice CT scanners, f-MRI methods, SPECT or 3D ultrasound scanning. Do we need EIT with its limited local resolution as an additional tool? The principle answer is that EIT, on the one hand, provides images based on new and different information, such as electrical tissue properties. On the other hand, EIT can be applied at the bedside as a continuous monitoring technique, as it only requires small devices and does not expose patients or users to any ionising radiation. These opportunities justify the search for application fields in which EIT will help to improve the care of patients.
EIT was introduced in the early 1980s by Barber and Brown. Soon thereafter, a wide spectrum of possible applications in medicine was suggested, ranging from gastric emptying to brain function monitoring and from breast imaging to lung function assessment. Our group, which had the opportunity to work with early system versions, predicted that, based on our own experiences, the greatest medical benefit of EIT would lie in monitoring regional lung function in intensive care patients. Before EIT was made available as a bedside monitoring tool, the heterogeneous distribution of lung injury, e.g.
1. Foreword

in ARDS (Acute Respiratory Distress Syndrome) patients, was only detectable outside the ICU, either by CT or by non-imaging techniques such as MIGET (Multiple Inert Gas Elimination Technique). EIT is the only method which can directly show whether closed lung regions can be opened by a recruitment manoeuvre and be kept open by optimised ventilator settings, all with the aim of minimising the risk of VALI (Ventilator Associated Lung Injury).
Major drawbacks of early EIT systems included their poor sensitivity and susceptibility to signal interference in clinical settings. Acceptable lung tomograms and ventilation images were only achieved using maximal inspiratory and expiratory hold manoeuvres which are not applicable in intensive care patients. The images did not provide valid information on the patient’s pulmonary status. Most of the research interest in EIT development focused on the extension of the technology towards multi-frequency systems which could deliver special information on tissue properties, on the introduction of new image reconstruction algorithms, or 3D imaging. The less spectacular, yet indispensable, goal of improving signal acquisition quality was not in the centre stage of activities.
The deficits of the existing EIT systems have been the motivation for our group to enhance sensitivity and to make improved EIT systems available for scientific studies on clinical issues. A major advantage was our opportunity for technical development, validation experiments in animals, volunteer studies and research with patients by affiliation of our group to the centre of Anesthesiology and Intensive Care of the University Hospital in Göttingen. These special conditions facilitated EIT development and brought it very close to practical clinical use, as it tied together all the essential factors for improving the technology and developing it further for use in the clinical setting.
A further substantial step was the cooperation with those commercial
06|07

08|ELECTRICAL IMPEDANCE TOMOGRAPHY | 1. FOREWORD
companies which stood out as leaders in ventilation technology equipment. Even with their commitment to this field and their substantial financial investment, it took many years to improve the system hardware, perform validation studies and develop simple but reliable software tools for bringing EIT into broad and successful clinical use. This booklet will tell the story of the considerable period of time devoted to EIT application and validation in patients in much more detail.
The final assessment of the particularly promising indications of EIT and their establishment in routine clinical work will result from the experience of a critical but constructive community of future EIT users.
by Prof. Gerhard Hellige
Prof. G. Hellige, born in 1943 in Berlin, Germany, was until his retirement in 2008 Head of the Department of Anaesthesiological Research at the Centre of Anaesthesiology and Vice Dean of the Medical Faculty at the University in Göttingen.
He was the leader of multiple research projects on experimental and clinical validation of EIT and Member Resp. Head of several executive boards, e.g. the Cardiolab module of the International Space Station ISS and the Committee on Measuring Technology in Medicine at the German Ministry of Research and Technology.
D-6
1-20
11
Acute Lung Injury (ALI) is a very common complication in intensive care. It has been shown that mechanical ventilation with ventilator settings which do not suit the individual requirements of the diseased lung can lead to injury of the cellular structures of the lung tissue. As a result, vascular and alveolar permeability increases and interstitial edema formation occurs. Due to the increased weight of the lung, alveolar collapse may predominantly occur in the dependent lung regions, resulting in even more severe arterial hypoxemia [1].
Lung protective ventilation may not only prevent mechanical pulmonary injury but may also reduce the risk of inducing the systemic release of cytokines, which is associated with the development of multi-organ failure [2, 3, 4]. Thus, over the past decades, clinicians have been searching for strategies to optimise alveolar recruitment, maintain an open lung and limit pulmonary overdistension.
However, finding optimal PEEP (Positive End-Expiratory Pressure) and tidal volume settings for the individual patient remains a constant challenge in clinical practice [5, 6].
For more than 30 years, clinicians have been examining various approaches and monitoring devices to guide ventilation management. As the lung of an ALI patient has heterogeneous properties, global parameters reflecting the condition of the lung as a whole have proved to be insufficient to adequately guide lung protective ventilation [7, 8].
CT (Computed Tomography) imaging reveals the underlying problem of treating patients based on global parameters alone. Fig. 1 schematically shows a slice of the lung of an ALI patient with non-aerated, poorly aerated,
08|09
2. Introduction

10|ELECTRICAL IMPEDANCE TOMOGRAPHY | 2. INTRODUCTION
normally aerated and hyperinflated lung regions. In order to achieve a more homogeneous distribution of tidal volume and to keep the lung as open as possible, it has been suggested that therapy settings should be made based on regional information of pulmonary status [9, 10, 11].
Although CT provides detailed regional information about the lung, it is, for obvious reasons, not suited for continuous regional lung monitoring at the bedside and thus cannot be used to guide the routine adjustment of ventilator settings.
Electrical Impedance Tomography (EIT) has emerged as a new modality
Fig. 1: CT image showing hyperinflated (A), normally aerated (B), poorly aerated (C) and non-aerated (D) lung regions
D-3
428-
2011

for non-invasive, radiation-free monitoring of regional lung function. With the Dräger PulmoVista 500, this unique tool is now available as a mature, clinically usable product for the very first time.
Being complementary to well-established radiological techniques and conventional pulmonary monitoring, EIT can be used to continuously visualise the lung function at the bedside and to instantly assess the effects of therapeutic manoeuvres on regional ventilation distribution.
The purpose of this booklet is to provide an overview of the technological aspects and clinical application of EIT, the appearance of EIT images, the parameters that can be derived and the clinical situations where EIT can be used.
It was written for the clinician who wants to gain a good understanding of EIT, but this booklet may also serve as a valuable source of information for scientists and engineers.
As with every new modality, EIT and its clinical application will evolve over time. If this booklet contributes to our understanding of this new approach to lung function monitoring, thereby accelerating this evolution, then its mission will have been accomplished.
10|11
12|ELECTRICAL IMPEDANCE TOMOGRAPHY | 3. THE HISTORY OF EIT
Ever since the first EIT device (Sheffield Mark I) was developed by Barber and Brown in the early 1980s, EIT has received increasing attention within the scientific community. By the mid-1990s more than 30 research groups were actively engaged in EIT-related research. The first available EIT devices, although technologically limited, have been applied exemplarily in various scientific fields, including the monitoring of gastric emptying, regional lung monitoring, lung perfusion, cardiac function, neurological function, quantification of lung water and breast cancer screening.
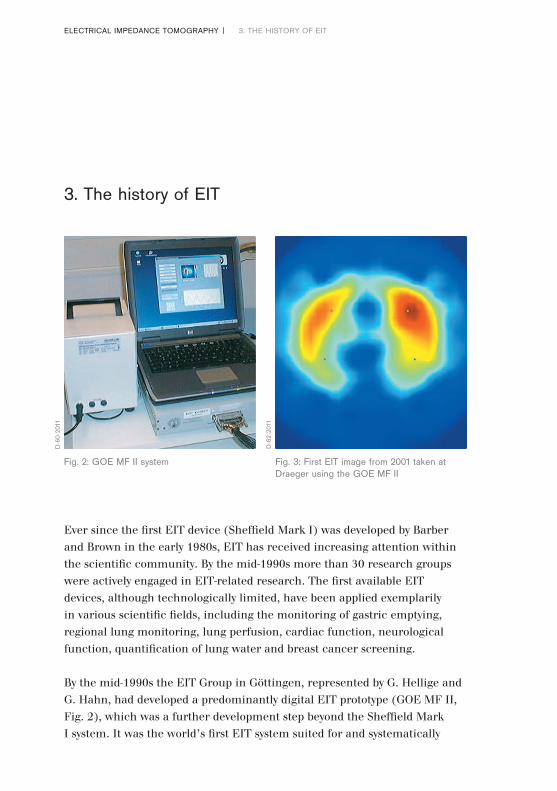
By the mid-1990s the EIT Group in Göttingen, represented by G. Hellige and G. Hahn, had developed a predominantly digital EIT prototype (GOE MF II, Fig. 2), which was a further development step beyond the Sheffield Mark I system. It was the world’s first EIT system suited for and systematically
3. The history of EIT
Fig. 2: GOE MF II system Fig. 3: First EIT image from 2001 taken at Draeger using the GOE MF II
D-6
0-20
11
D-6
2-20
11

used in experimental validation studies in animals, physiological studies in volunteers and clinical research. The GOE MF II was specifically designed for the assessment of tidal volume distribution and it was mainly used to evaluate the capability of EIT to monitor regional lung function.
In 2001 the EIT-Group Göttingen and Dräger initiated a scientific exchange of experience in the field of EIT with the mutual objective of improving the technology, design, and software in such a way as to facilitate the use of EIT lung function monitors, not only in experimental research but also in daily clinical practice. Initial measurements on volunteers and subsequent reconstruction of functional EIT images were conducted at Dräger in 2001 (Fig. 3 and 4).
During the initial phase of this cooperative effort, the first major task was to understand why, despite a history of more than 20 years at that time,
BOOKS ABOUT EIT
In 1993, Holder published a book about clinical and physiological applications of EIT which summarised the results of the first conference entirely dedicated to EIT (held in 1992 at the Royal Society in London) [12].
All the studies that Holder presented in his book were performed with the Sheffield Mark I or its derivatives.
In 2004, Holder published a second EIT book in which the state of reconstruction algorithms and hardware developments were described [13].
Additionally, he presented and discussed the experimental use of EIT in specific clinical fields in great detail.
12|
Fig. 4: Early ventilation images made with the GOE MF II
13
D-6
4-20
11

14|ELECTRICAL IMPEDANCE TOMOGRAPHY | 3. THE HISTORY OF EIT
EIT had still not found a place in clinical practice, even though the results of all experimental studies had suggested the tremendous potential clinical benefits of EIT when used for regional lung monitoring.
It quickly became obvious that the failure to adopt EIT as a viable clinical tool was closely related to the experience of those who had tried to use it in the clinical setting. EIT devices of that time still were not sufficiently adapted to the “real world” requirements for use in ICUs. This was mainly due to specific limitations in the design of those EIT devices:
Fig. 5: A historic CT Scanner of EMI
HISTORY OF CT
By way of comparison, Computed Tomography (CT) was invented by G. N. Hounsfield in 1967, a British engineer who worked for EMI (the record label which marketed the Beatles records). The first prototype (Fig. 5), dedicated to imaging the brain and completed in 1971, had a resolution of 80 × 80 pixels. The first commercial CT system (SIRETOM) developed by Siemens was launched in 1974. In the following years CT rapidly emerged as a well-established diagnostic modality all over the world. So, the history
of computed tomography appears to be only about 10 years older than that of EIT.
Up until the introduction of Dräger PulmoVista® 500, the use of EIT for regional lung function monitoring has been limited to a growing, but still small, number of experts and research groups. These groups continue to investigate EIT technology within the context of various scientific studies. However, from today’s perspective, it seems that the “path to the Holy Grail” [14] has been much longer than had been initially expected.
D-5
9-20
11
– Intra-thoracic bioelectric properties are only very slightly changed by ventilation. At the body surface, this may result in voltage changes of less than 100µV. In 2001, the most crucial components of EIT devices had only been developed to a point where they could reliably be used in animal trials and healthy humans but not in all intensive care patients. Yet, patients with e.g. lung edema where EIT measurements can be challenging are precisely those who would be likely to benefit the most from EIT monitoring.
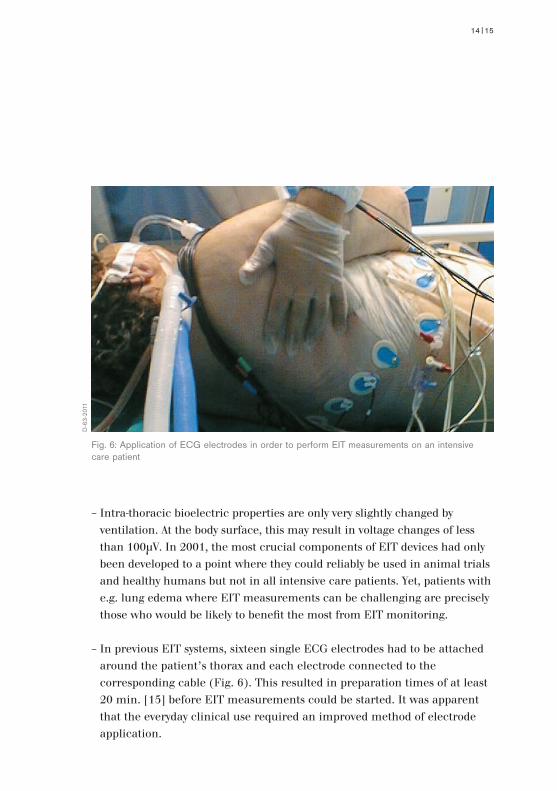
– In previous EIT systems, sixteen single ECG electrodes had to be attached around the patient’s thorax and each electrode connected to the corresponding cable (Fig. 6). This resulted in preparation times of at least 20 min. [15] before EIT measurements could be started. It was apparent that the everyday clinical use required an improved method of electrode application.
14|
Fig. 6: Application of ECG electrodes in order to perform EIT measurements on an intensive care patient
15
D-6
3-20
11

16|ELECTRICAL IMPEDANCE TOMOGRAPHY | 3. THE HISTORY OF EIT
– Various EIT software tools had been developed to address scientific questions and identify relevant parameters – but all tools were designed for off-line use and thus did not allow clinicians to perform on-line data interpretation, i.e. directly at the bedside.
EIT EVALUATION KIT 2
In 2006 Dräger had finalised the development of a limited series of EIT prototypes (EIT Evaluation Kit 2, Fig. 8). Its design addressed various aspects of the identified obstacles related to data acquisition and clinical usability.
– The electronics for the data acquisition and also the patient cables were completely redesigned to achieve reliable measurements with sufficient signal quality even in those patients with wet lungs and small tidal volumes, where previous EIT systems failed.
– An EIT electrode belt (Fig. 7) was developed which made electrode application and maintenance much easier. Also, the surface of the electrodes became larger and thus stability of the skin-electrode contact improved so EIT measurements were much more reliable and feasible for longer time periods.
– Additionally, the Dräger MonoLead™ cables that had already been successfully introduced by Dräger for ECG measurements were adapted for use with the newly developed electrode belt. This meant that the cables could be attached to the belt before it was applied to the patient. As with the belt the cable also contributed to a significant improvement of signal quality compared to previously used single lead cables.
– The experience Dräger has in software and user interface design was utilised in the development of software for the EIT Evaluation Kit 2. In contrast to previous EIT systems, the EIT Evaluation Kit 2 made the continuous display of EIT images and waveforms possible. The user interface was designed according to principles of the graphical user interfaces of the latest Dräger medical devices at that time.

Fig. 7: Electrode belt of the EIT Evaluation Kit 2 attached to an intensive care patient after abdominal surgery
16|17
D-7
1-20
11

18|ELECTRICAL IMPEDANCE TOMOGRAPHY | 3. THE HISTORY OF EIT
The EIT Evaluation Kit 2 was limited to use within clinical studies in order to answer the most important question: Could EIT emerge as a tool for routine clinical practice or would its previous limitations cause it to remain a research tool?
In an early evaluation, EIT measurements were performed at 11 hospitals around the world. Results from 183 patients mainly suffering from ALI / ARDS were analysed. After each EIT measurement clinicians wrote a report which addressed the general usability of the device.
Also, analysis of the collected EIT data revealed, from a technical point of view, that EIT measurements were successfully performed on all patients.
Fig. 8: EIT Evaluation Kit 2
D-4
7-20
11
DYNAMIC DETERMINATION OF REGIONAL BIOELECTRICAL PROPERTIES
WITHIN THE THORAX
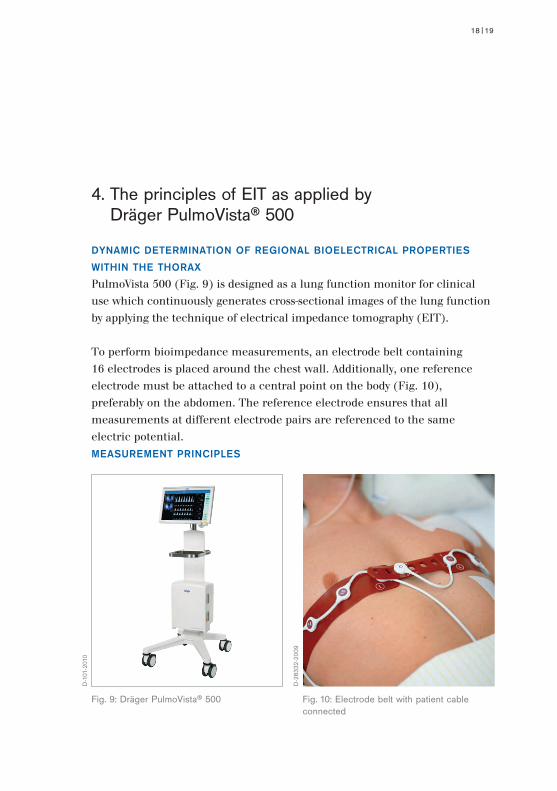
PulmoVista 500 (Fig. 9) is designed as a lung function monitor for clinical use which continuously generates cross-sectional images of the lung function by applying the technique of electrical impedance tomography (EIT).
To perform bioimpedance measurements, an electrode belt containing 16 electrodes is placed around the chest wall. Additionally, one reference electrode must be attached to a central point on the body (Fig. 10), preferably on the abdomen. The reference electrode ensures that all measurements at different electrode pairs are referenced to the same electric potential.MEASUREMENT PRINCIPLES
18|
4. The principles of EIT as applied by Dräger PulmoVista® 500
19
Fig. 9: Dräger PulmoVista® 500 Fig. 10: Electrode belt with patient cable connected
D-1
01-2
010
D-2
8332
-200
9

20|
PulmoVista 500 determines the distribution of intra-thoracic bioimpedance by applying a known alternating current “I1” to a first pair of electrodes and measuring the resulting surface potentials “Vn” at the remaining 13 electrode pairs (Fig. 11). Applying Ohm’s law, the bioelectrical impedance between the injecting and the measuring electrode pairs is determined from the known applied current and the measured voltages. Subsequently, the adjacent electrode pair is used for the next current application and another 13 voltage measurements are performed. The location of the injecting and measuring electrode pairs successively rotates around the entire thorax. One complete rotation creates voltage profiles at 16 electrode positions, each consisting of 13 voltage measurements (Fig. 13). The resulting 208 values, also called a frame, are used to reconstruct one cross-sectional EIT image.
Please see Appendix II for more details about bioimpedance measurements.
Fig. 11: Current application and voltage measurements around the thorax
1615
14
13
12
11
109
12
3
4
5
6
78
V13
I1
V12
V11
V10
V9
V8
V1
V2
V3
V4
V5
V6V7
D-3
420-
2011
ELECTRICAL IMPEDANCE TOMOGRAPHY | 4. THE PRINCIPLES OF EIT AS APPLIED BY
DRÄGER PULMOVISTA® 500

IMAGE RECONSTRUCTION
A current application (A) at the surface of a subject with homogenous bioelectric properties causes a reproducible distribution of potentials inside the subject (Fig. 12). The regions in the thorax with the same electrical potential, as a result of current application, are called isopotential lines (B). The distribution of isopotential lines contributes to a predictable voltage profile on the surface of the body.
Fig. 12: Distribution of isopotential lines inside the subject. The voltages (C) next to the current application are the highest, as indicated by the white colour. The voltage (D) on the side opposite the current application is the lowest, indicated by the dark blue colour
20|21
D
A
C
B
162
3
4
5
6
789
10
11
12
13
14
151
D-8
2-20
11

22|ELECTRICAL IMPEDANCE TOMOGRAPHY | 4. THE PRINCIPLES OF EIT AS APPLIED BY
DRÄGER PULMOVISTA® 500
A regional increase of impedance (E) of the subject results in a change in each of the 16 voltage profiles which make up one frame. Regardless of where the current is applied, the regional increase of impedance always causes an increase of the voltages “behind” the region of increased impedance.
Fig. 13: Profiles of voltage deviations in the presence of a regional increase of impedance. In this figure, white and light blue colours represent deviations of the voltage distribution in an inhomogeneous medium. Voltages without deviation are indicated by the black colour
162
3
4
5
6
789
10
11
12
13
14
151 16
2
3
4
5
6
789
10
11
12
13
14
151 16
2
3
4
5
6
789
10
11
12
13
14
151 16
2
3
4
5
6
789
10
11
12
13
14
151
162
3
4
5
6
789
10
11
12
13
14
151 16
2
3
4
5
6
789
10
11
12
13
14
151 16
2
3
4
5
6
789
10
11
12
13
14
151 16
2
3
4
5
6
789
10
11
12
13
14
151
162
3
4
5
6
789
10
11
12
13
14
151 16
2
3
4
5
6
789
10
11
12
13
14
151 16
2
3
4
5
6
789
10
11
12
13
14
151 16
2
3
4
5
6
789
10
11
12
13
14
151
162
3
4
5
6
789
10
11
12
13
14
151 16
2
3
4
5
6
789
10
11
12
13
14
151 16
2
3
4
5
6
789
10
11
12
13
14
151 16
2
3
4
5
6
789
10
11
12
13
14
151
E
D-8
3-20
11

22|
Originally the Sheffield Back-Projection reconstruction algorithm, described by Barber and Brown [16] and drawing on principles similar to those used for computed tomography, was developed to compile the recorded voltage profiles into cross-sectional images.
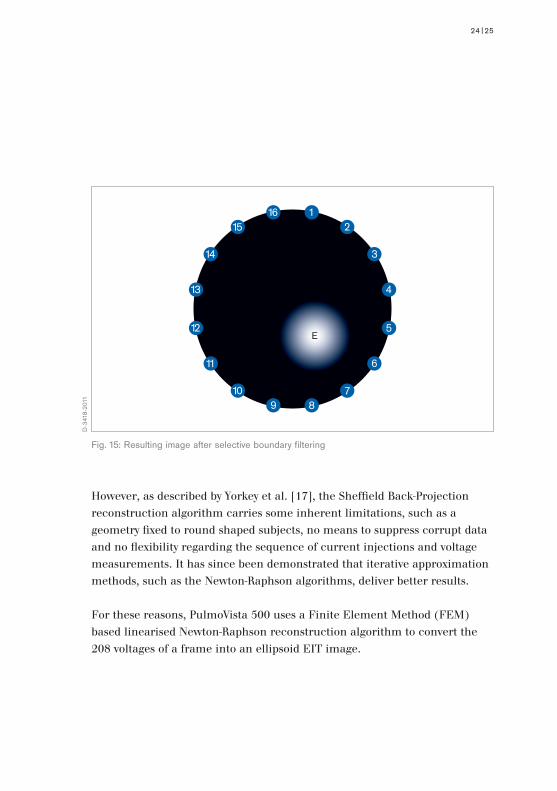
The reconstruction algorithm superposes the 16 voltage profiles on each other (Fig. 14). Reconstruction artifacts are eliminated by applying selective boundary filtering. The resulting image (Fig. 15) displays the region of increased impedance (E) at the correct location.
As with CT scans, the projection of the displayed EIT images is from caudal to cranial. This means that the left side of the image displays the right side of the patient. The upper part of the image displays the ventral aspect of the patient.
23

ELECTRICAL IMPEDANCE TOMOGRAPHY | 4. THE PRINCIPLES OF EIT AS APPLIED BY
DRÄGER PULMOVISTA® 500
24|
Fig. 14: Successive superposition of the 16 voltage profiles
162
3
4
5
6
789
10
11
12
13
14
151 16
2
3
4
5
6
789
10
11
12
13
14
151 16
2
3
4
5
6
789
10
11
12
13
14
151 16
2
3
4
5
6
789
10
11
12
13
14
151
162
3
4
5
6
789
10
11
12
13
14
151 16
2
3
4
5
6
789
10
11
12
13
14
151 16
2
3
4
5
6
789
10
11
12
13
14
151 16
2
3
4
5
6
789
10
11
12
13
14
151
162
3
4
5
6
789
10
11
12
13
14
151 16
2
3
4
5
6
789
10
11
12
13
14
151 16
2
3
4
5
6
789
10
11
12
13
14
151 16
2
3
4
5
6
789
10
11
12
13
14
151
162
3
4
5
6
789
10
11
12
13
14
151 16
2
3
4
5
6
789
10
11
12
13
14
151 16
2
3
4
5
6
789
10
11
12
13
14
151 16
2
3
4
5
6
789
10
11
12
13
14
151
D-3
417-
2011
ELECTRICAL IMPEDANCE TOMOGRAPHY | 4. THE PRINCIPLES OF EIT AS APPLIED BY
DRÄGER PULMOVISTA® 500
24|25
However, as described by Yorkey et al. [17], the Sheffield Back-Projection reconstruction algorithm carries some inherent limitations, such as a geometry fixed to round shaped subjects, no means to suppress corrupt data and no flexibility regarding the sequence of current injections and voltage measurements. It has since been demonstrated that iterative approximation methods, such as the Newton-Raphson algorithms, deliver better results.
For these reasons, PulmoVista 500 uses a Finite Element Method (FEM) based linearised Newton-Raphson reconstruction algorithm to convert the 208 voltages of a frame into an ellipsoid EIT image.
162
3
4
5
6
789
10
11
12
13
14
151
E
Fig. 15: Resulting image after selective boundary filtering
D-3
418-
2011

26|ELECTRICAL IMPEDANCE TOMOGRAPHY | 4. THE PRINCIPLES OF EIT AS APPLIED BY
DRÄGER PULMOVISTA® 500
This method divides the electrode plane into 340 triangular elements, where each element is assigned homogeneous and isotropic bioelectrical properties (Fig. 16).
This method allows the calculation of the resulting surface voltages at the boundary nodes of the model, for any arbitrary distribution of impedance values within this mesh, which is the numerical solution of the so-called „forward problem“.
Fig. 16: 2D mesh with 340 finite elements for 16 surface electrodes
D-3
419-
2011

For reconstruction of EIT images however, the approach is reversed: after the voltages at the body surface have been measured, their relative changes are fed into the Newton-Raphson reconstruction algorithm by multiplying them with a sensitivity matrix. This matrix has been optimized over the last several years by taking into account real EIT data from several hundred patients.
This algorithm assigns a relative impedance change to each individual finite element to achieve a best match for the numerical solution of this so-called „inverse problem“ of the FEM to the actual voltage profile (Fig. 17).
Fig. 17: FEM based reconstruction of regional bioimpedance distribution based on 208 measured surface voltages
26|27
D-3
421-
2011

28|ELECTRICAL IMPEDANCE TOMOGRAPHY | 4. THE PRINCIPLES OF EIT AS APPLIED BY
DRÄGER PULMOVISTA® 500
Following image reconstruction, the triangular structure is converted into a rectangular pattern (“co-registration”) for further image processing (Fig. 18). Also, damping of boundary artifacts is applied.
Fig. 18: Co-registration and damping of boundary artifacts
D-3
423-
2011

In the next step, a Gaussian filter is used to smooth the image (Fig. 19). Gaussian filtering is widely used in graphics software, typically to reduce image noise and details. The visual effect of this technique is that of a smooth blur, which resembles viewing the image through a translucent screen. Gaussian smoothing is also widely used as a pre-processing stage in computer vision algorithms in order to enhance image structures at different scales.
Fig. 19: Smoothing by applying Gaussian filtering
28|29
D-3
424-
2011

30|ELECTRICAL IMPEDANCE TOMOGRAPHY | 4. THE PRINCIPLES OF EIT AS APPLIED BY
DRÄGER PULMOVISTA® 500
Each EIT image consists of a matrix of 32 × 32 pixels. In order to create larger images for better graphical representation and interpretability, bilinear interpolation allows to increase the virtual resolution of the EIT images to a matrix of any size, as EIT images in a larger format enable better separation of the displayed structures by the viewer (Fig. 20). However, the underlying resolution of the images remains unchanged.
Fig. 20: Bilinear filtering
D-3
425-
2011

BIOELECTRICAL PROPERTIES OF LUNG TISSUE
As discussed in detail in Appendix II, it is well known that the impedance of lung tissue varies with the air content. Thus ventilation and changes of end-expiratory lung volume that occur within the EIT sensitivity region result in changes of the voltages measured at the body surface. The correlation between Tidal (Impedance) Variations and Tidal Volumes is typically high (Fig. 21) and has been assessed in various validation studies (see chapter 8).
In humans, an inspiration manoeuvre from residual volume to total lung capacity amplifies regional bioimpedance by around 300 % [18, 19]. Cardiac activity and perfusion cause a change in thoracic bioimpedance, from diastole to systole, in the range of 3 % [20].
Extravascular lung water, body movement and the skin-electrode resistance may also have various effects on thoracic bioimpedance.
30|
Fig. 21: Correlation of tidal volumes and tidal variations, i.e. ventilation related impedance changes, in a patient with aortic valve replacement after a PEEP reduction from 17 down to 10 cm H2O
31
Tidal Volume [ml]
Tida
l Var
iatio
n [A
.U.]
450 500 550 600 650 700 750 800
1.200
1.400
1.600
1.800
2.000
2.200
2.400
y = 2,3924x + 306,3
R2 = 0,9864
D-3
426-
2011
32|ELECTRICAL IMPEDANCE TOMOGRAPHY | 4. THE PRINCIPLES OF EIT AS APPLIED BY
DRÄGER PULMOVISTA® 500
THE EIT SENSITIVITY REGION
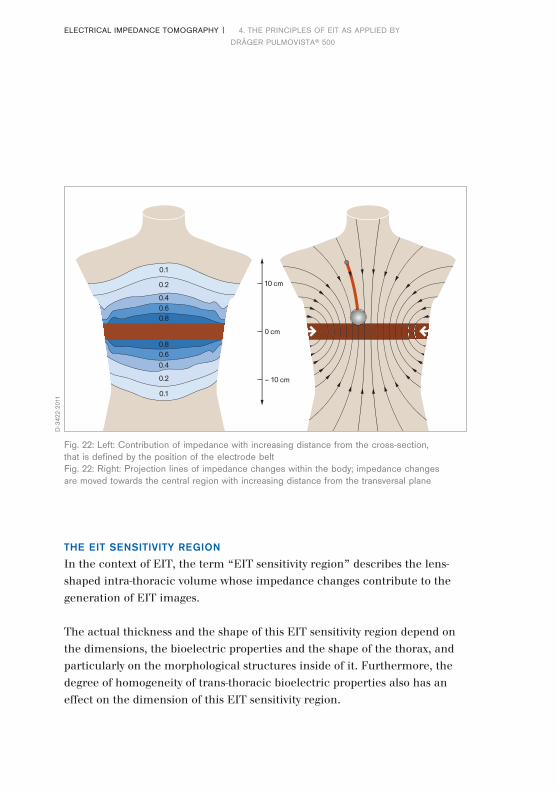
In the context of EIT, the term “EIT sensitivity region” describes the lens-shaped intra-thoracic volume whose impedance changes contribute to the generation of EIT images.
The actual thickness and the shape of this EIT sensitivity region depend on the dimensions, the bioelectric properties and the shape of the thorax, and particularly on the morphological structures inside of it. Furthermore, the degree of homogeneity of trans-thoracic bioelectric properties also has an effect on the dimension of this EIT sensitivity region.
Fig. 22: Left: Contribution of impedance with increasing distance from the cross-section, that is defined by the position of the electrode beltFig. 22: Right: Projection lines of impedance changes within the body; impedance changes are moved towards the central region with increasing distance from the transversal plane
0.1
0.2
0.40.60.8
0.1
0.2
0.40.60.8
0 cm
10 cm
– 10 cm
D-3
422-
2011

The electrode belt used with PulmoVista 500 uses electrodes which are 40 mm wide. Hence, close to the body surface the EIT sensitivity region is at least 40 mm thick. The thickness of the sensitivity region increases towards the central region of the body. The contribution of impedance changes is reduced with increasing distance from the cross-sectional plane (Fig. 22 left). Increasing distance from the cross-sectional plane moves the position of impedance changes close to the body surface, towards the central region along the depicted projection lines (Fig. 22 right). However, as the contribution of impedance changes is reduced with increasing distance from the cross-sectional plane, the effect on the image is limited.
FUNCTIONAL EIT
PulmoVista 500 performs functional EIT, meaning that it mainly displays relative impedance changes as a result of lung function, i.e., ventilation and changing end-expiratory lung volume. If the signals are not filtered, cardiac related impedance changes are also displayed. Factors affecting the absolute impedance are eliminated by only displaying relative impedance changes, rather than absolute impedance values.
Thus, the Dynamic Images generated by PulmoVista 500 contain information on the functional condition of different lung regions within the EIT sensitivity region.
32|33

34|ELECTRICAL IMPEDANCE TOMOGRAPHY | 5. CLINICAL INFORMATION DERIVED FROM
DRÄGER PULMOVISTA® 500
PulmoVista 500 (Fig. 23) is the first EIT system of its kind which continuously provides graphical information about the regional distribution of ventilation and changes of end-expiratory lung volume. The temporal resolution of this information is high and can even be presented as trend data. While this opens up a number of new approaches to observing specific conditions of different lung regions, it generally also carries the risk that the information provided by EIT devices may be too complex to be used by clinicians who have limited experience in this field.
With reference to EIT measurements it is important to remember the terms “distribution of ventilation” or “lung volume changes” refer to physiological processes inside the previously described EIT sensitivity region, i.e. the
5. Clinical information derived from Dräger PulmoVista® 500
Fig. 23: Dräger PulmoVista® 500 in a clinical setting
D-8
7-20
10

lens-shaped intra-thoracic volume. PulmoVista 500 captures a relatively thick slice of the lung which might represent about 20 % to 30 % of the entire lung.
5.1 SCREEN ELEMENTS DISPLAYED BY PULMOVISTA 500
DYNAMIC IMAGE
The Dynamic Image continuously displays relative impedance changes within the EIT sensitivity region as a movie which represents the dynamics of ventilation (Fig. 24). PulmoVista 500 can generate up to 50 EIT images per second. This high temporal resolution facilitates the visualisation of regional ventilation even at higher respiratory rates. For example, when
Fig. 24: Series of dynamic images representing air filling during inspiration
34|ELECTRICAL IMPEDANCE TOMOGRAPHY | 5. CLINICAL INFORMATION DERIVED FROM
DRÄGER PULMOVISTA® 500
35
D-4
6-20
11
36|
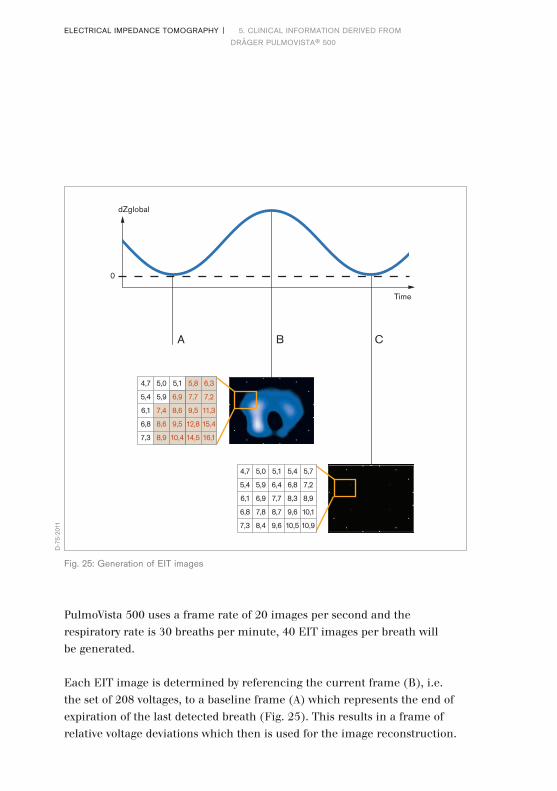
PulmoVista 500 uses a frame rate of 20 images per second and the respiratory rate is 30 breaths per minute, 40 EIT images per breath will be generated.
Each EIT image is determined by referencing the current frame (B), i.e. the set of 208 voltages, to a baseline frame (A) which represents the end of expiration of the last detected breath (Fig. 25). This results in a frame of relative voltage deviations which then is used for the image reconstruction.
4,7 5,0 5,1 5,8 6,3
5,4 5,9 6,9 7,7 7,2
6,1 7,4 8,6 9,5 11,3
6,8 8,6 9,5 12,8 15,4
7,3 8,9 10,4 14,5 16,1
4,7 5,0 5,1 5,4 5,7
5,4 5,9 6,4 6,8 7,2
6,1 6,9 7,7 8,3 8,9
6,8 7,8 8,7 9,6 10,1
7,3 8,4 9,6 10,5 10,9
dZglobal
Time
A B C
0
Fig. 25: Generation of EIT images
D-7
5-20
11
ELECTRICAL IMPEDANCE TOMOGRAPHY | 5. CLINICAL INFORMATION DERIVED FROM
DRÄGER PULMOVISTA® 500

This means that, regardless of the actual values of the baseline frame (which also reflect a certain distribution of absolute impedance), only regional differences between the current frame and the baseline frame are displayed.
If the end-expiratory impedance distribution of the next breath is identical to the former one, the next end-expiratory image (C) is black. As the baseline frame is continuously updated following each detected breath, mainly impedance changes due to tidal ventilation are displayed. Due to this baseline definition, waveform offsets caused by changes in end-expiratory lung impedance are not displayed in the Dynamic Image.
This behaviour is somewhat comparable to the volume waveform of a ventilator, which is calculated from the flow waveform and requires calibration to zero after each detected breath. In the ventilator, the volume waveform is zeroed because the external flow sensor cannot distinguish between differences between inspiratory and expiratory volumes either due to air leaks or those caused by changes in end-expiratory lung volume.
STATUS IMAGES
Further analysis of the lung regions, e.g. comparative evaluation at different times or quantification of regional ventilation distribution, can be achieved using status images. With PulmoVista 500, the status image can be configured as either a Tidal Image, or as a Minute Image.
The Tidal Image is a differential image of the end of inspiration compared to the beginning of inspiration which represents the regional distribution of ventilation of the last detected breath. The Tidal Image is automatically updated after each breath.
The Minute Image represents regional impedance distribution changes as averaged Tidal Images over the last minute. The Minute Images are ideal for the assessment of regional distribution during ventilation with varying tidal volumes.
36|37ELECTRICAL IMPEDANCE TOMOGRAPHY | 5. CLINICAL INFORMATION DERIVED FROM
DRÄGER PULMOVISTA® 500

38|
REGIONS OF INTEREST
A region of interest (ROI) is a user-defined area within a status image. The image can be divided into 4 ROIs and arranged either horizontally, as quadrants or in a customised way (Fig. 26, 27, 28). The area covered by each ROI is represented by the corresponding regional impedance waveform and the regional numeric value.
Fig. 26: An arrangement as “Layers” allows assessing the effects of gravity and thus the different properties of dependent and non-dependent lung regions
This arrangement helps to assess the effects of e.g. PEEP changes, recruitment manoeuvres and to monitor any pathology which equally affects both sides of the lungs
D-4
3-20
11
ELECTRICAL IMPEDANCE TOMOGRAPHY | 5. CLINICAL INFORMATION DERIVED FROM
DRÄGER PULMOVISTA® 500

38|
Fig. 27: An arrangement as “Quadrants” allows assessing regional characteristics of the upper and lower left lung vs. the upper and lower right lung
This arrangement helps to assess the effects of e.g. lateral positioning, lung suction, pleural drainages and to monitor any pathology which affects both sides of the lungs differently
Fig. 28: An arrangement in the “Free” mode allows assessing status images pixel by pixel and comparison of non-adjacent lung regions
39
D-4
2-20
11
D-4
9-20
11
ELECTRICAL IMPEDANCE TOMOGRAPHY | 5. CLINICAL INFORMATION DERIVED FROM
DRÄGER PULMOVISTA® 500

40|
IMPEDANCE WAVEFORMS
The status images present the ventilatory status in a somewhat compressed fashion. The temporal behaviour of the lung regions cannot be assessed just by interpreting those images.
In contrast, the impedance waveforms represent the impedance changes within the EIT sensitivity region over time (Fig. 29). All displayed impedance waveforms, i.e. one global and four regional waveforms, are plotted simultaneously over the same time base. The impedance waveforms can be assessed in a manner similar to the assessment of waveforms on the ventilator.
The global impedance waveform represents the sum of relative impedance changes in all pixels of each Dynamic Image plotted over time.
Fig. 29: Generation of the global impedance waveform
dZglobal
Time
D-7
6-20
11
ELECTRICAL IMPEDANCE TOMOGRAPHY | 5. CLINICAL INFORMATION DERIVED FROM
DRÄGER PULMOVISTA® 500
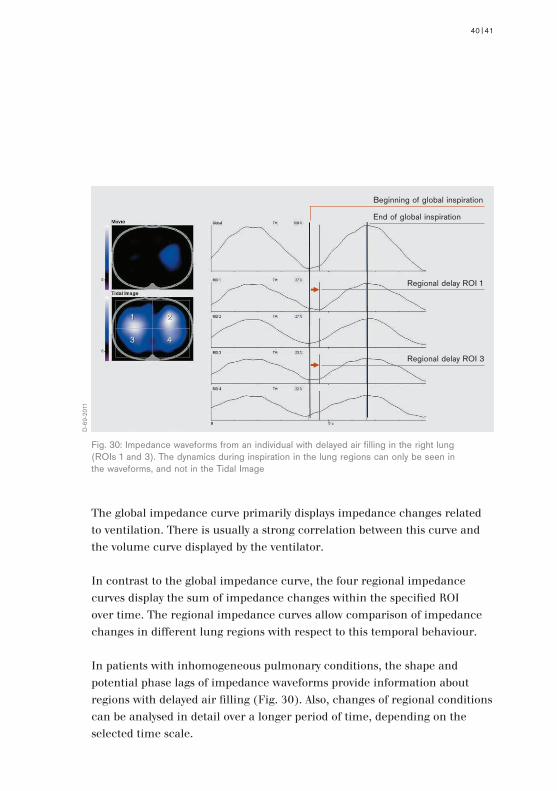
The global impedance curve primarily displays impedance changes related to ventilation. There is usually a strong correlation between this curve and the volume curve displayed by the ventilator.
In contrast to the global impedance curve, the four regional impedance curves display the sum of impedance changes within the specified ROI over time. The regional impedance curves allow comparison of impedance changes in different lung regions with respect to this temporal behaviour.
In patients with inhomogeneous pulmonary conditions, the shape and potential phase lags of impedance waveforms provide information about regions with delayed air filling (Fig. 30). Also, changes of regional conditions can be analysed in detail over a longer period of time, depending on the selected time scale.
Fig. 30: Impedance waveforms from an individual with delayed air filling in the right lung (ROIs 1 and 3). The dynamics during inspiration in the lung regions can only be seen in the waveforms, and not in the Tidal Image
40|41
D-6
9-20
11
End of global inspiration
Regional delay ROI 1
Beginning of global inspiration
Regional delay ROI 3
1 2
3 4
1 2
3 4
ELECTRICAL IMPEDANCE TOMOGRAPHY | 5. CLINICAL INFORMATION DERIVED FROM
DRÄGER PULMOVISTA® 500

42|
NUMERIC VALUES
Numeric values are continuously calculated and displayed so that quantification and comparison of regional impedance changes at different times is possible. PulmoVista 500 uses a very straightforward method to express distribution of ventilation within the EIT sensitivity region – it simply expresses the distribution as regional proportions (Fig. 31).
The parameter Tidal Rate, determined from the global impedance curve, typically represents the number of breaths detected per minute.
The parameter TV global (Tidal Variation global) represents the difference between the minimum and maximum value of the global impedance curve for each breath. The TV global is always 100 %, regardless of the tidal volume. It serves solely as a reference for the display of regional tidal variations.
The regional Tidal Variation TV ROIn represents the difference between the minimum and maximum values on the regional impedance curves for each breath, i.e. from end of expiration and the end of inspiration.
End of expiration and inspiration are detected on the global impedance curve and indicated by markers. Regional Tidal Variations show the percentage of impedance change which takes place in the corresponding ROI.
Fig. 31: Numeric values of Dräger PulmoVista® 500D
-342
9-20
11
ELECTRICAL IMPEDANCE TOMOGRAPHY | 5. CLINICAL INFORMATION DERIVED FROM
DRÄGER PULMOVISTA® 500

5.2 MAIN VIEW
The “Main” view (Fig. 32) is the usual monitoring screen and displays the following: A “Dynamic Image”, showing impedance changes over time, a “Status Image”, a global impedance waveform at the top, and below this, four regional impedance waveforms, representing relative impedance changes of the Regions Of Interest (ROI) defined in the “Status Image”. On the right side of this screen, parameter fields are arranged which contain the numeric values described.
Based on the feedback provided by more than 30 clinical users of EIT over several years, it had become increasingly obvious that the best way to present EIT data is to combine EIT status images (containing regional information), impedance curves (containing regional and temporal information) and derived numerical parameters (allowing quantitative assessment). Consequently, the “Main” view of the PulmoVista 500 provides EIT data in a graphical layout similar to that which clinicians know from patient monitors.
Fig. 32: Screenshot of “Main” view
42|43
D-7
513-
2014
ELECTRICAL IMPEDANCE TOMOGRAPHY | 5. CLINICAL INFORMATION DERIVED FROM
DRÄGER PULMOVISTA® 500

44|
5.3 FULL SCREEN IMAGE VIEW
The view “Full Screen Image” (Fig. 33) displays contents similar to the “Main” view. However, by providing a large format view of either the Dynamic Image or a status image, it allows users to easily snatch an impression of ventilation distribution from a remote position. Thus this view may be especially helpful during clinical rounds, during training or in other situations when the presentation of EIT images in front of a larger group of people is required.
Fig. 33: Full Screen Image view
D-7
514-
2014
ELECTRICAL IMPEDANCE TOMOGRAPHY | 5. CLINICAL INFORMATION DERIVED FROM
DRÄGER PULMOVISTA® 500
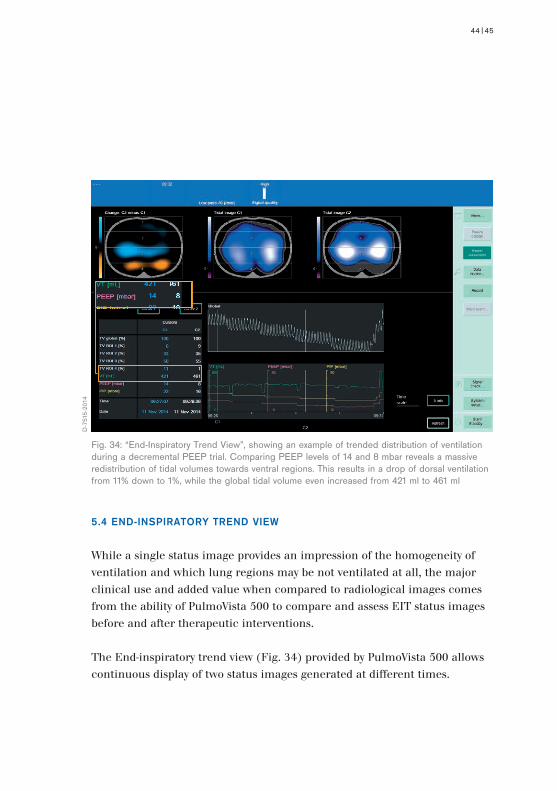
5.4 END-INSPIRATORY TREND VIEW
While a single status image provides an impression of the homogeneity of ventilation and which lung regions may be not ventilated at all, the major clinical use and added value when compared to radiological images comes from the ability of PulmoVista 500 to compare and assess EIT status images before and after therapeutic interventions.
The End-inspiratory trend view (Fig. 34) provided by PulmoVista 500 allows continuous display of two status images generated at different times.
Fig. 34: “End-Inspiratory Trend View”, showing an example of trended distribution of ventilation during a decremental PEEP trial. Comparing PEEP levels of 14 and 8 mbar reveals a massive redistribution of tidal volumes towards ventral regions. This results in a drop of dorsal ventilation from 11% down to 1%, while the global tidal volume even increased from 421 ml to 461 ml
44|45
D-7
515-
2014
ELECTRICAL IMPEDANCE TOMOGRAPHY | 5. CLINICAL INFORMATION DERIVED FROM
DRÄGER PULMOVISTA® 500

46|
Regional ventilation distribution can thus be reviewed over a time period of up to 120 minutes. Two cursors can be easily navigated through the global impedance curve: an additional image, reflecting the difference between the status images at each cursor position, displays regional changes associated with changed lung conditions or a change of therapy.
If a Dräger Evita family ventilator is connected to PulmoVista 500 via the Medibus interface, ventilation parameters such as e.g. PEEP, which can affect regional distribution, can also be displayed in this view.
ELECTRICAL IMPEDANCE TOMOGRAPHY | 5. CLINICAL INFORMATION DERIVED FROM
DRÄGER PULMOVISTA® 500

5.5 ΔΔEELI TREND VIEW
It is well known that not only ventilation but also changes of the End-Expiratory Lung Volume (EELV) affect the intra-thoracic impedance.
In order to continuously display the impedance changes due to ventilation, all offsets induced by changes of EELV and concurrent changes of End-Expiratory Lung Impedance (ΔEELI) are suppressed in the Main view by referencing all impedance values to a dynamic baseline.
Nevertheless, the ability to continuously display ΔEELI on a regional level provides further information which is potentially as useful as the display of regional ventilation. Continuous information about ΔEELI is especially suited to assess the dynamics of slow recruitment and derecruitment processes within the lungs. Not surprisingly, the early users of EIT devices had consistently asked for a means with which to assess ΔEELI.
Therefore the ΔEELI trend view, dedicated to the display and quantification of global and regional changes in end-expiratory lung impedance over time, has been implemented in PulmoVista 500 (Fig. 35).
The ΔEELI trend displays a differential image “ΔEELI: C2 minus C1”, which represents the difference between end-expiratory images at the two cursor positions C1 and C2.
Up to 120 minutes of global and regional impedance waveforms are displayed, which are referenced to a fixed baseline. Parameter fields display the numerical parameters ΔEELI global and four ΔEELI ROI. The numeric value ΔEELI global displays the deviation of the global end-expiratory status at the cursor positions C1 and C2 in relation to the global tidal variation at C1. The numeric value ΔEELI ROI displays the regional deviations within the respective ROI.
46|47ELECTRICAL IMPEDANCE TOMOGRAPHY | 5. CLINICAL INFORMATION DERIVED FROM
DRÄGER PULMOVISTA® 500

The change in end-expiratory lung impedance ΔEELI at C1 and C2 is expressed as follows:
Zero change (black colour): no difference between values at C1 and C2Positive changes (turquoise colour): value at C2 is greater than the value at C1Negative changes (orange colour): value at C2 is less than the value at C1
A positive change in ΔEELI global of 1.00 * TVglobal C1 indicates an increase in end-expiratory lung impedance equal to the global tidal variation (at C1), which in turn is related to the tidal volume, that was present within the EIT sensitivity region at the cursor position C1.
Fig. 35: Trended distribution of ΔEELI, where the status before and after a recruitment manoeuvre is compared. The differential image “ΔEELI: C2 minus C1” reveals an increase of end-expiratory lung volume which was induced by the RM. This increase is equal to the tidal volume, that was present at C1 (416 ml). However, the regional information of ΔEELI ROI 4 also confirms that this RM only led to a minor increase of lung volume (0.04 % of the tidal volume at C1) in the dorsal region
D-7
516-
2014
ROI 4
48|ELECTRICAL IMPEDANCE TOMOGRAPHY | 5. CLINICAL INFORMATION DERIVED FROM
DRÄGER PULMOVISTA® 500

48|49
The titration of PEEP after a successful RM is aimed at preventing end-expiratory collapse of depended pulmonary areas. At the same time, the selection of appropriate PEEP levels also plays an important role for achieving homogeneous distribution of tidal volumes and thus lung protective ventilation.
A reasonable approach to determine the “right level of PEEP” requires a comprehensive understanding of the mechanisms establishing alveolar recruitment, the mechanical forces opposing PEEP-induced reopening of atelectatic areas, and the determinants of PEEP-induced lung overinflation and ventilator-induced lung injury (VILI). An important prerequisite for the safe and effective determination of the “right level of PEEP” are clinical tools facilitating the assessment of the effect from therapeutic interventions, for instance, the early detection of overinflation and derecruitment during PEEP trials.
In order to illustrate which role PulmoVista 500 can play in this context, three typical application examples are described below for which data* are used that have been collected from a post-operative patient right after admission to the ICU.
Initially, the patient remained on the ventilator settings according to the hospital’s standard clinical protocol. Then, an RM and a subsequent decremental PEEP trial were performed under pressure controlled ventilation.
After a second RM, PEEP was set according to the highest dynamic compliance (Cdyn) as determined by the ventilator. As Cdyn only started dropping at a PEEP of 6 mbar in this patient, “best” PEEP was set to 8 mbar.
* unpublished data, provided with kind permission by Christiane Grusnick and Hermann Heinze,
6. Application examples of Dräger PulmoVista® 500
ELECTRICAL IMPEDANCE TOMOGRAPHY | 5. CLINICAL INFORMATION DERIVED FROM
DRÄGER PULMOVISTA® 500

ELECTRICAL IMPEDANCE TOMOGRAPHY | 6. APPLICATION EXAMPLES OF DRÄGER PULMOVISTA® 500 50|
Fig. 36: Assessing the patient’s response during a RM
D-7
517-
2014
UKSH Campus Lübeck, Germany
Ventilator parameters such as Tidal Volume (VT), Compliance (Cdyn), Peak Inspiratory Pressure (PIP) and Positive End-Expiratory Pressure (PEEP) were simultaneously measured by the ventilator and transmitted to and displayed by PulmoVista 500.

50|51
6.1 ASSESSING THE PATIENT’S RESPONSE DURING A RECRUITMENT
MANOEUVRE
In order to assess the patient’s response to the RM, the End-inspiratory trend view of PulmoVista 500 is opened and the first cursor C1 used as a reference. Hence, the Tidal image C1 (mid position) represents the initial ventilation distribution prior to the RM. The second cursor C2 is then set to the position where the RM was performed, represented by the image on the right. (Fig. 36).
This example shows a patient with major increase in dorsal ventilation during the RM, represented by turquoise colour on the differential image Change C2 minus C1 (on the left).
The transient increase of PEEP from 5 to 15 mbar in combination with an increase of peak inspiratory pressure (PIP) from 20 to 39 mbar results in an increase from 2 % to 15 % in Region Of Interest 4 (ROI 4), which represents the ventilation in the dorsal region. Even though this increase in the percentage is partly caused by the decrease of ventral ventilation in the right lung (represented by orange colour), the comparison of the Tidal images C1 and C2 clearly reveals that ROI 4 was not ventilated before but properly ventilated during the RM.

52|
Fig. 37: Identifying the onset of loss of dorsal ventilation (PEEP decrease from 14 to 12 mbar)
D-7
518-
2014
6.2 IDENTIFYING THE ONSET OF DERECRUITMENT DURING
A DECREMENTAL PEEP TRIAL
In order to monitor potential derecruitment during a decremental PEEP trial, the first cursor C1 again is used as a reference, but now set to the highest PEEP level (14 mbar) after the RM, thus representing the “open lung”. Cursor C2 is set to the next lower PEEP (12 mbar) (Fig. 37).
Even though the decrease of PEEP results in a slight decrease of dorsal ventilation (in ROI 4, from 11 % to 9 %), the Tidal image C2 (on the right) reveals that dorsal ventilation was not significantly reduced by this PEEP reduction.
Consequently, the differential image remains black, indicating that in this patient no significant change of ventilation distribution has occurred when reducing PEEP from 14 to 12 mbar.
ELECTRICAL IMPEDANCE TOMOGRAPHY | 6. APPLICATION EXAMPLES OF DRÄGER PULMOVISTA® 500

52|53
Fig. 38: Identifying the onset of loss of dorsal ventilation (PEEP decrease from 14 to 10 mbar)
D-7
519-
2014
However, when comparing PEEP levels of 14 and 10 mbar, a drop in ventilation from 11 % to 5 % can be observed in ROI 4 (Fig. 38). The loss of dorsal ventilation, represented by orange colour, can be interpreted as the onset of derecruitment, which becomes more prominent with further reduction of PEEP.
At a PEEP level of 8 mbar, with 4 % dorsal ventilation in ROI 4, has almost returned to the initial status (2 %).
Interestingly, this derecruitment does not become obvious by monitoring the tidal volume or the dynamic compliance on the ventilator, both of which even slightly increase at a PEEP level of 8 mbar – due to the increase of ventilation in the upper half of the lung, the onset of regional derecruitment is masked in the global information.

54|ELECTRICAL IMPEDANCE TOMOGRAPHY | 6. APPLICATION EXAMPLES OF DRÄGER PULMOVISTA® 500
Fig. 39: Estimating the loss of ventral ventilation due to overdistension (PEEP increase from 6 to 8 mbar)
D-7
520-
2014
6.3 ESTIMATING THE LOSS OF VENTRAL VENTILATION DUE TO
OVERDISTENSION
In order to monitor a potential loss of ventral ventilation induced by overdistension during a decremental PEEP trial, the cursor C1 is again used as a reference, but now set to the lowest PEEP level (6 mbar). It is assumed that no overdistension is present at this relatively low PEEP level. Cursor C2 is now set to the next higher PEEP level (Fig. 39).
Even though the increase of PEEP results in a slight decrease of ventral ventilation in ROI 1 and ROI 2, Tidal image C2 reveals that ventral ventilation is not significantly impaired at a PEEP of 8 mbar.
Consequently, the differential image remains almost black, indicating that there is no significant overdistension at a PEEP of 8 mbar.
54|55
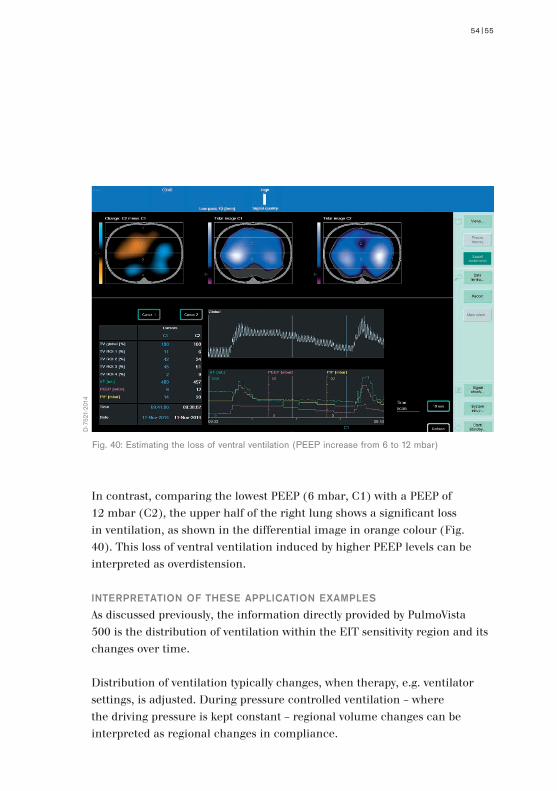
Fig. 40: Estimating the loss of ventral ventilation (PEEP increase from 6 to 12 mbar)
D-7
521-
2014
In contrast, comparing the lowest PEEP (6 mbar, C1) with a PEEP of 12 mbar (C2), the upper half of the right lung shows a significant loss in ventilation, as shown in the differential image in orange colour (Fig. 40). This loss of ventral ventilation induced by higher PEEP levels can be interpreted as overdistension.
INTERPRETATION OF THESE APPLICATION EXAMPLES
As discussed previously, the information directly provided by PulmoVista 500 is the distribution of ventilation within the EIT sensitivity region and its changes over time.
Distribution of ventilation typically changes, when therapy, e.g. ventilator settings, is adjusted. During pressure controlled ventilation – where the driving pressure is kept constant – regional volume changes can be interpreted as regional changes in compliance.

ELECTRICAL IMPEDANCE TOMOGRAPHY | 6. APPLICATION EXAMPLES OF DRÄGER PULMOVISTA® 500 56|
Furthermore, it is well known, that regional compliance in ventral parts of the lung tends to be reduced by overdistension at high PEEP levels, and vice versa regional compliance in dorsal parts tends to be reduced by derecruitment at low PEEP levels.
Hence, valuable clinical information can be derived from EIT data collected during decremental PEEP trials, that is not directly available during steady mechanical ventilation.

INDICATIONS
PulmoVista 500 is designed to perform thoracic bioimpedance measurements by applying the technique of electrical impedance tomography (EIT). PulmoVista 500 displays regional information on ventilation-related changes of air content within the EIT sensitivity region.
While PulmoVista 500 does not provide absolute values for end-expiratory lung volume, it does display regional information on short-term changes of end-expiratory lung volume within the EIT sensitivity region.
PulmoVista 500 can be used during mechanical ventilation, mask ventilation and spontaneous breathing.
PulmoVista 500 is intended for use on intensive care patients, whose regional (lung) volume distribution is of clinical interest. The electrode belts used with the device have been designed for use on recumbent patients in supine, lateral or prone position.
Generally speaking, in order to perform EIT measurements, the subject can be in an upright, sitting, or supine position, as long as there is no excessive body movement during the measurements. When using an electrode belt for PulmoVista 500, measurements of seated or standing patients may only give satisfactory results when the patient leans against a backrest as some electrodes may, depending on the shape of the posterior muscular structures (latissimus dorsi), not have sufficient skin contact. If required, the belt must be sufficiently secured with adhesive tape during measurements in an upright position.
7. Indications and contraindications
56|57

ELECTRICAL IMPEDANCE TOMOGRAPHY | 7. INDICATIONS AND CONTRAINDICATIONS
Due to the fact that EIT monitoring is primarily beneficial in the treatment of patients with severe respiratory complications, PulmoVista 500 is intended for stationary use, at the bedside, in clinical environments and on recumbent intensive care patients.
In principle, EIT measurements can be performed on a wide range of adult patient populations, but also on paediatric and even neonatal patients.
The range of electrode belts which are currently provided with PulmoVista 500 allows EIT measurements on patients with a chest circumference from 70 cm (27.6 in) to 150 cm (59 in).
MEDICAL CONTRAINDICATIONS
GENERAL PRECAUTIONS
PulmoVista 500 should not be used on patients where the application of the electrode belt may pose a risk to the patients, e.g. patients with unstable spinal lesions or fractures.
LOW SIGNAL QUALITY
Certain, extremely rare patient conditions, such as massive lung and /or tissue edema, can lead to compromised signal quality. When the signal quality indicator reads “Low” and even applying electrode gel or reducing the frame rate do not lead to an improvement, then PulmoVista 500 should not be used on such patients.
High Medium Low
D-3
438-
2011
58|

Similar precautions apply to obese patients. PulmoVista 500 should not be used on patients with a BMI over 50. The signal quality of obese patients with a BMI less than 50 should be monitored closely. Within the electrode plane, the ratio between lung tissue and fatty tissue surrounding the ribcage is reduced. For this reason, the ventilated lung areas appear smaller in EIT images of massively obese patients (Fig. 50).
EIT measurements are generally relatively sensitive to body movements. For example, lifting the arms will cause the skin over the thorax to shift; a subsequent shift of the belt will also occur, while the position of the lung tissue remains almost unchanged. The resulting change in position of the electrodes relative to the lung tissue will induce impedance changes which are much larger than those related to ventilation.
As sufficient signal quality requires that all electrodes have proper skin contact, the electrode belt must not be placed over wound dressings and the like.
ACTIVE IMPLANTS
So far, little experience exists regarding the interference between active implants and impedance tomography measurements.
For this reason, PulmoVista 500 must not be used on patients with a cardiac pacemaker, an implantable cardioverter-defibrillator (ICD) or any other active implants where the function of PulmoVista 500, especially the alternating current application, may interfere with the function of the active medical device.
In the future, compatibility tests will be performed to identify those devices where interference is likely. In case of any doubt about the compatibility with an implanted active device, the PulmoVista 500 must not be used.
58|59
ELECTRICAL IMPEDANCE TOMOGRAPHY | 7. INDICATIONS AND CONTRAINDICATIONS
DEFIBRILLATION
PulmoVista 500 must not be used during cardiac defibrillation as the energy needed for defibrillation may disperse into the PulmoVista 500 and decrease the effectiveness of defibrillation.
There is also a risk of damage to the components of the PulmoVista 500 if the patient belt remains connected to the patient during defibrillation, and the electrode belt may mechanically interfere with the correct positioning of the defibrillation electrodes or paddles.
Consequently, before defibrillation is carried out the lateral patient cable connectors should be removed from the patient cable ports and the electrode belt opened.
SKIN CONDITIONS
In contrast to ECG measurements, electrodes must also be placed in the posterior region of the thorax. As the belt is positioned around the thorax, the body weight of the patient always causes parts of the electrode belt to be pressed against the respective skin area, regardless of whether the patient is in a supine, lateral or prone position.
The silicone belt has a cushioning effect and lesions, as a result of the patient lying on the belt, patient cable or its snaps, have been observed only rarely in patients where the belt was attached tightly for many hours or in patients with extremely vulnerable skin, e.g. in septic shock. Shallow indentations and skin redness may occur at the position of the edges of the silicone belt when it has been in place for some time. These marks are similar to those caused by a crease in a bed sheet. The time it takes for these marks to dissipate mainly depends on the skin condition of the individual as well as the tightness of the belt during its application.
60|

In contrast to creases, the EIT belt will remain in exactly the same position for the duration of the measurement period. Thus, prolonged measurement times may increase the risk of skin injury. Therefore the maximum allowable time for the belt to be in place is 24 hours – during this time the skin in the area of the electrode belt must be checked regularly. Special care needs to be taken in patients whose peripheral / skin perfusion is compromised, e.g. septic shock or other severe cardiovascular compromise.
The electrode belt of PulmoVista 500 must not be placed over injured, inflamed or otherwise damaged skin areas.
INTERFERENCE FROM OTHER MEDICAL DEVICES
To date, little experience exists regarding interference of EIT measurements with other electromedical devices and particular other bioimpedance measurements.
This includes non-invasive cardiac output monitors which use bioimpedance measurements, respiration monitors using impedance measurements, instruments for electrocautery and electrosurgery and devices designed for electricity-based therapy.
PulmoVista 500 is not intended for use in the presence of strong magnetic fields, e.g., MRI, as PulmoVista 500 or the respective device may be damaged.
60|61

ELECTRICAL IMPEDANCE TOMOGRAPHY | 8. CONSIDERATIONS FOR EIT DATA INTERPRETATION
SPATIAL RESOLUTION
PulmoVista 500 uses 16 electrodes to measure the voltages that are used for image reconstruction. There is a distance of approximately 3 cm between the electrodes of a large size belt (for chest circumferences between 92 cm and 110 cm). Mathematical simulations based on this electrode arrangement demonstrate a spatial resolution of 15% of the thoracic diameter, however the resolution decreases to 20% towards the centre of the body.
While CT scanners typically provide images consisting of 512 × 512 pixels, EIT images from PulmoVista 500 only consist of 32 × 32 pixels, which are 256 times fewer pixels compared to CT images. Even though the first CT scanner, developed in 1970, only provided an array of 80 × 80 pixels, it is not expected that the spatial resolution of EIT images can be improved in the near future to a point comparable with that of CT.
As current pathways do not lead straight through the body (unlike X-rays) and can easily change directions to bypass non-conductive regions, e.g. a pneumothorax, it is assumed that the drawbacks of an increased number of electrodes, such as additional cables and connections, a lower signal strength, and higher crosstalk, will outweigh the potential benefits of a slight increase in spatial resolution.
In contrast to CT and MRI, the intended role of EIT in clinical practice is to guide ventilation therapy rather than the absolute diagnosis; it is unlikely that increased spatial resolution would significantly improve the ability of EIT to guide ventilation therapy.
8. Considerations for EIT data interpretation
62|

ONE SINGLE CROSS-SECTIONAL PLANE
PulmoVista 500 displays EIT status images and related information which represent only the distribution of the tidal volume in one single cross-sectional plane.
As previously described, it can be assumed that, due to the three-dimensional current flow, the area at the centre of the thorax which is reflected by EIT data is several centimetres thick; this thickness decreases towards the surface near the electrodes, resulting in a lens-shaped sample volume.
The mapping of complex three-dimensional morphological structures on a two-dimensional template further decreases spatial resolution. Additionally, there is no precise information about the size of the portion of the lungs represented by an EIT image.
When interpreting EIT data, it must be accepted that, as a result of the conditions explained above, the displayed circumference of the electrode plane does not exactly match the geometry of the patient. It also must be taken into account that the displayed position of impedance changes does not always exactly match the position where the impedance changes occur.
Physiological changes, such as increased intra-abdominal pressure, or changes in ventilator settings like the PEEP, may cause caudal-cranial shifts of intra-thoracic structures.
Those shifts have to be considered when relating tidal volumes to tidal variations or changes of EELV to ΔEELI.
Since tidal volume reflects the volume of the entire lung while tidal variations represent only the volume within the EIT sensitivity region, the assumption of a linear relationship between changes in global tidal impedance and tidal volume cannot be used to directly calculate the EELV [21].
62|63
ELECTRICAL IMPEDANCE TOMOGRAPHY | 8. CONSIDERATIONS FOR EIT DATA INTERPRETATION
As major changes in PEEP can alter the portion of lung tissue which is captured within the EIT sensitivity region, and as recruitment and derecruitment is not necessarily evenly distributed in a caudal/cranial orientation, the strong correlation of volume changes within the EIT sensitivity region and FRC changes reflecting the entire lung, that were previously described by Hinz et al. [22] and Odenstedt et al. [23], is not seen under all clinical circumstances.
Thus, when interpreting the ΔEELI, the fact that this information only reflects changes of end-expiratory lung impedance of one slice of the lung (the EIT sensitivity region), as opposed to the entire lung, must be taken into account.
Nevertheless, assuming that the electrode belt is put at a sufficient distance from the diaphragm, the dynamics of ongoing recruitment or de-recruitment, e.g. after changes in PEEP, can be visualised [24]. Also, with its regional information on end-expiratory lung impedance changes, PulmoVista 500 is the only bedside tool which enables assessment of whether such an increase was caused by hyperinflation (in the ventral regions) or the reopening of atelectatic lung tissue (in the dorsal regions).
When a global FRC parameter is used, regional atelectasis could be masked by increased compliance in other regions during deflation [25]. Hickling [26] has described, in the context of the interpretation of global pressure-volume curves, that recruitment of lung regions and hyperinflation of other lung regions is likely to happen simultaneously in the lungs of ARDS patients.
64|

BELT POSITION
In an experimental study, Reske [27] assessed the correlation between non-aerated lung volume and total lung volume and PaO2, first using a small number of representative CT slices from different planes rather then 21 CT slices representing the entire lung. It was found that one single juxta-diaphragmatic cross-section reflects the condition of the (atelectatic) lungs better than the conventional combination of apical, hiliar and juxta-diaphragmatic slices. It is known that anaesthesia-induced atelectasis occurs predominantly in dependent juxta-diaphragmatic lung regions, which may account for the superior performance of one single juxta-diaphragmatic slice when assessing atelectasis.
Fig. 41: Recommended position of the electrode belt
D-2
8332
-200
9
64|65

ELECTRICAL IMPEDANCE TOMOGRAPHY | 8. CONSIDERATIONS FOR EIT DATA INTERPRETATION
Thus it can be seen that selecting a single plane in the appropriate position – as done with EIT – may provide the best possible representation of those juxta-diaphragmatic lung regions which are most affected by atelectasis, tidal recruitment and overdistension. However, due to the lens-shaped EIT sensitivity region, the belt does not need be placed in the juxta-diaphragmatic position in order to detect recruitment and derecruitment. It is recommended to position the belt at about the 5th intercostal space at the parasternal line (Fig. 41).
66|
Fig. 42: Impact of belt position on tidal images: L01 was recorded at the highest possible belt position (i.e., below the armpits), for L02 the belt was placed 1 cm further down, and so on. Colours were enhanced to make the effects more obvious. L11 represents ICS 6, where the mediastinum enters into the plane. The diagram reveals that from L02 to L10, the ratio of tidal variation and tidal volume remains almost constant, but begins to rapidly drop from L10. The images L12 to L15 which represent the juxta-diaphragmatic position, can only be interpreted with great caution. At L16 and L17 the ventilation-related signal is inverted and now represented in purple, because the artifacts induced by diaphragmatic movements are larger than the tidal variations
D-7
533-
2014

In patients where an elevated diaphragmatic position is likely (e.g. obesity, diaphragmatic palsy), the belt should not be positioned below intercostal space 5, in order to avoid artifacts (check spelling with client) caused by diaphragmatic movement. Placement of the belt close to the diaphragmatic position increasingly leads to phase shifts in the mediastinal and lateral regions, which are represented in the tidal images in purple colour (Fig. 42).
A small number of EIT research groups continue to work on prototypes of three-dimensional EIT imaging devices. However, it is not expected that these systems will be developed beyond the research setting within the foreseeable future.
CARDIOPULMONARY INTERACTION
The impedance changes measured by PulmoVista 500 reflect an interaction of different physiological processes rather than the effects of a single, isolated phenomenon. In some publications and review papers, this is perceived as a limitation.
This point of view does not take into account that impedance changes due to ventilation are normally about 10 times greater than impedance changes due to cardiac activity. Also, cardiac-related impedance changes can easily be isolated using low-pass filtering.
66|67

ELECTRICAL IMPEDANCE TOMOGRAPHY | 8. CONSIDERATIONS FOR EIT DATA INTERPRETATION
As PulmoVista 500 incorporates low-pass filtering, the concurrent presence of impedance signals due to ventilation and cardiac activity does not limit the assessment of regional ventilation distribution and changes of end-expiratory lung impedance (Fig. 43).
Fig. 43: Unfiltered impedance waveform (upper curve) and filtered waveform (Cut-off frequency 35 [1/min]) from the same EIT data
D-6
5-20
11
68|

ARTIFACTS
PulmoVista 500 was designed to continuously display ventilation related changes of air content within the EIT sensitivity region; however, as with many medical imaging systems, changes in the body position and movement may cause significant artifacts.
Just as moving an ultrasound probe to a different part of the body may change the ultrasound image, so may altering the position of the electrode belt change the distribution of ventilation displayed by EIT; end-expiratory lung impedance values are particularly affected by changes in belt position.
Additionally, changes in position of the electrode belt, or the application of electrode gel, may alter the skin-electrode resistance and thus the EIT data so that the interpretation of the trend data provided by PulmoVista 500 may be compromised. This means that the changes, e.g., from moving the belt, must be taken into consideration when analysing trend data.
End-expiratory lung impedance may also be affected by changes of extravascular lung water content, but in contrast to belt repositioning, changes of extravascular lung water content are relatively slow.
It has occasionally been reported that strong electromagnetic fields in the range of the operating frequency of the EIT device, induced by e.g. CT scanners, have caused major artifacts in EIT data. These electromagnetic fields may exert their effect via the pathway of the patient, the mains power supply, the trunk cable or the patient cable.
68|69

ELECTRICAL IMPEDANCE TOMOGRAPHY | 8. CONSIDERATIONS FOR EIT DATA INTERPRETATION
Electromagnetic interference is usually limited to particular frequency bands. PulmoVista 500 prevents superposition of this kind of noise on EIT signals by analysing the relevant spectrum of electromagnetic background noise during the calibration cycle and automatically setting the operating frequency to a range with a low background noise level (Fig. 44). It is this feature of PulmoVista 500 which makes it less sensitive to interference from electromagnetic fields than previous generations of EIT devices.
RELATIVE IMPEDANCE CHANGES
Until now, most studies were performed using functional EIT (f-EIT), which measures impedance changes relative to a baseline. Absolute EIT (a-EIT) may also become clinically useful, as being able to measure absolute regional impedance values would allow one to directly distinguish between lung conditions which result from regions with lower resistivity
Fig. 44: Graphical display of the noise spectrum determined by Dräger PulmoVista® 500 during the last calibration
D-7
2-20
11
70|

(e.g. hemothorax, pleural effusion, atelectasis and lung edema) and those with higher resistivity (e.g. pneumothorax, emphysema).
However, the reconstruction of absolute impedance images requires that the exact dimensions and the shape of the body, as well as the precise location of the electrodes, be taken into account, as simplified assumptions would lead to major reconstruction artifacts.
While initial studies assessing aspects of a-EIT have already been published [28], as of today this area of research has not yet reached the level of maturity which would make it suitable for clinical use. Consequently, PulmoVista 500 does not currently provide a-EIT functionality.
70|71
ELECTRICAL IMPEDANCE TOMOGRAPHY | 9. VALIDATION STUDIES
Electrical impedance tomography has been extensively validated in animal experiments and clinical (human) studies. In animal experiments, the spatial distribution of pulmonary aeration determined by EIT is well correlated with results from CT, single photon emission CT (SPECT) and electron beam CT (EBCT). These findings were obtained using different EIT devices, and diverse ventilation modes and settings.
Notably a strong correlation between EIT and CT was demonstrated in critically ill patients.
A comprehensive collection of corresponding references can be found in several recent reviews [29, 54, 97].
ANIMAL STUDIES
The correlation of global ventilation with global impedance measurements resulting from EIT image streams has been investigated by several researchers for quite some time. One of the early re ports was published in 1997. In 19 dogs, Adler et al. investigated the relation between EIT rea d ings and predefined gas or fluid volume (air, albumin solution) injected with a large syringe into the lungs [30]. Excellent correlations between syringe gas volume and EIT-based estimates for lung volume change were reported.
Similarly, Meier and co-workers [31] reported very good correlations between tidal volume administered by an anaesthesia workstation (Primus, Dräger Medical, Lübeck, Germany) and global impedance changes obtained from EIT readings in 3 pigs.
Of course the validation of regional ventilation is more challenging than global ventilation, as suitable reference techniques are more complex and costly. In 2005, Luepschen et al. compared EIT to CT in 10 domestic
9. Validation studies
72|
pigs undergoing laparoscopic surgery and pulmonary lavage [32]. The authors found good spatial correlation between EIT images and the CT reference. With the high temporal resolution of EIT, effects of changed ventilator settings can be seen immediately. Functional activity and tidal variation show an ex cellent linear correlation with tidal volume (i.e. global ventilation). The results of comparing EIT with CT and tidal volume indicate that information on regional ventilation may be gained from EIT images and/or local impedance changes.
Hinz et al. validated EIT for the measurement of regional distribution of ventilation by comparing it to single photon emission CT (SPECT) [33]. In twelve pigs, they investigated whether regional impedance changes obtained by EIT are quantitatively related to regional ventilation as determined by SPECT. Different modes of mechanical and spontaneous ventilation were analysed in this study. A highly significant linear correlation between regional ventilation measured by EIT and SPECT scanning was found (r² = 0.92; range 0.86 to 0.97). The mode of ventilation, or presence of spon taneous breathing, did not affect the correlation to a relevant extent. Moreover, induced lung in jury, induced changes of compliance of the respiratory system or of extravascular lung water con tent caused no significant effects on the correlation between EIT and SPECT.
Frerichs et al. validated the ability of EIT to detect local changes in air content resulting from mo di fied ventilator settings by comparing data from EIT with data from Electron Beam CT (EBCT), ob tained under identical steady state conditions [34]. The experiments were carried out in 6 pigs using 5 different tidal volumes at three PEEP levels. The analysis was performed in 6 regions of interest, lo cated in the ventral, middle and dorsal areas of each lung. Good correlation between the changes in lung air content determined by EIT and EBCT was revealed, with mean correlation coefficients in the ventral, middle and dorsal regions of 0.81, 0.87 and 0.93 respectively.
72|73

ELECTRICAL IMPEDANCE TOMOGRAPHY | 9. VALIDATION STUDIES
In another study, Frerichs et al. investigated the reproducibility of EIT images showing lung ventilation distribution at different PEEP levels in 10 pigs [35]. Regional lung ventilation was determined in the right and left hemi thorax as well as in 64 regions of interest evenly distributed over each side of the chest in the ven tro-dorsal direction. Ventilation distribution in both lungs was visualised as ventro-dorsal ven ti lation profiles and shifts in ventilation distribution quantified in terms of centres of ventilation in re-la tion to the chest diameter. The proportion of the right lung on total ven-tilation in the chest cross-sec tion was 0.54 ± 0.04 and remained unaffected by repetitive PEEP changes. In summary, the authors found excellent reproducibility of the results in individual regions of interest with almost identical patterns of ventilation distribution during repeated PEEP changes.
In 2003, van Genderingen et al. investigated the value of EIT for the assessment of regional lung mechanics during high-frequency oscillatory ventilation (HFOV) in eight pigs [36]. Lung volume determined by EIT was estimated by calibrated strain-gauge plethysmography (SGP) during a P-V manoeuvre. Regional lung volume changes were assessed by electrical impedance tomography in various regions of interest. The study showed good agreement between global impedance from EIT and lung volume estimated by SGP, during both the P-V maneuver and subsequent HFOV. However, baseline measurements performed at the end of the experiments suggested that accumulation of intra-thoracic fluid may limit the accuracy for determining small changes in lung volume over a longer period of time.
Meier et al. investigated the capability of EIT to monitor regional lung recruitment and lung collapse using different levels of PEEP in a lavage model of lung injury in six domestic pigs by comparing EIT findings to simultaneously acquired CT images and global ventilation parameters [37]. The authors found a close correlation between end-expiratory gas volumes assessed by EIT and end-expiratory gas volumes calculated from CT
74|

(r = 0.98 – 0.99). Also, correlation of tidal volumes was demonstrated (r = 0.55 – 0.88) for both EIT and CT. The authors concluded that EIT is suitable for monitoring the dynamic effects of PEEP variations on the regional change of tidal volume, and that it is superior to global ventilation parameters in assessing the beginning of alveolar recruitment and lung collapse.
PATIENT STUDIES
In 2003, Hinz et al. compared lung volume changes with end-expiratory lung impedance changes [38]. In their study, 10 intubated patients were enrolled and PEEP was changed from 0 to 15 mbar. During this manoeuvre, ΔEELV was measured by an open-circuit nitrogen washout ma noeu vre while EIT was used to assess end-expiratory lung impedance changes ΔEELI. The authors re port very high correlation and good accuracy in the Bland-Altman plot.
In 2006, Marquis et al. reported an excellent correlation between global EIT measurement and plethys mography readings used as a reference in 22 healthy volunteers [39].
Victorino et al. performed a validation study comparing EIT with dynamic CT in ten critically ill mechanically ventilated patients [40]. Their data showed that EIT reliably provides a means to assess imbalances in distribution of tidal volume in critically ill patients. When comparing regional ventilation across different thoracic regions, the quantitative information provided by EIT carries good proportionality to changes in air content – as calculated by dynamic CT scanning – but not with CT gas/tissue ratio or CT mean-densities. Further results from this study showed that EIT images from patients undergoing controlled mechanical ventilation were reproducible and presented good agreement to dynamic CT scanning. Moreover, regional impedance changes in the EIT slice were best explained by the corresponding changes in air-content detected in the CT slice (explaining 92 – 93% of its variance). Other CT derived variables, such as
74|75

ELECTRICAL IMPEDANCE TOMOGRAPHY | 9. VALIDATION STUDIES
regional X-ray mean-density or regional gas-tissue ratio, did not parallel regional changes in impedance as consistently. It was also noted that good correlation between EIT and CT could only be observed in sufficiently large regions of interest. This finding was to be expected considering the limited spatial resolution of EIT and is in line with results from mathematical calculations.
Riedel et al. evaluated the effect of body position and positive pressure ventilation on intra pulmonary tidal volume distribution in ten healthy adult subjects [41]. EIT measurements and mul tiple-breath sulphur hexafluoride (SF6) washout were performed. Profiles of average relative im pe dance change in regional lung areas were calculated. Relative impedance time course analysis and Lissajous figure loop analysis were used to calculate phase angles between dependent or in de pen dent lung and total lung (Φ). EIT data were compared to SF6 washout data measuring the lung clear ance index (LCI). Proposed EIT profiles allowed inter-individual comparison of EIT data and iden tified areas with reduced regional tidal volume using pressure support ventilation. The phase angle Φ of dependent lung in various body positions is as follows: supine 11.7 ±1.4, prone 5.3 ±0.5, right lateral 11.0 ±1.3 and left lateral 10.8 ±1.0. LCI increased in the supine position from 5.63 ±0.43 to 7.13 ±0.64 in the prone position. Measured Φ showed an inverse relationship to LCI in the four different body positions. The findings of this study demonstrate that functional EIT measures gravity dependent asynchronous emptying of the lung in different body positions and characterises local tidal volume distribution at different levels of pressure support. Although this study was limited to healthy subjects, and rather large lung areas were analysed, the authors state that the proposed method may be powerful enough to analyse uneven ventilation in diseased lungs and more specific lung regions.
In 2009, Bikker et al. reported on their findings in 25 ventilated ICU patients [42]. They compared EELV mea sure ments performed with a COVX module integrated into an Engström Carestation ventilator (both from GE Healthcare, Helsinki, Finland) with end-expiratory lung impedance readings
76|

obtained by EIT. The authors reported a sig ni ficant moderate correlation (r = 0.79; r² = 0.62) and a moderate agreement (bias 194 ml, SD 323 ml) between ΔEELV and changes in lung volume calculated from ΔEELI. The results indicate that the relationship between global tidal impedance variation and tidal volume may not be strictly linear. Hence, the authors concluded that such a relationship cannot be used to directly use ΔEELI as a linear surrogate for EELV differences and hence changes in FRC.
Recently, Karsten et al. [43] investigated a similar question in 54 post-operative cardiac patients. The authors used an oxygen wash-in/wash-out technique as a reference and looked at changes during open endotracheal suctioning (OPS) procedures and recruitment manoeuvres (RM) and reported limits of agreement for ΔEELV estimated from ΔEELI between – 0.83 and 1.31 l as compared to the reference measurements. These findings led the authors to the con clusion that the correlation between ΔEELI and ΔEELV may not be clinically acceptable.
The different findings in the validation studies can possibly be explained by the impact of belt position: When the belt is placed rather close to the diaphragm and PEEP is changed, the distance between the electrode plane and the diaphragm changes significantly, leading to an alteration of the ratio between impedance changes and lung volume changes. As a result, lung volume changes might get underestimated, when e.g. a PEEP reduction decreases the distance between the diaphragm and the belt significantly and thus the ratio between impedance changes and lung volume changes gets much smaller.
These effects are illustrated and explained in more detail in Fig. 42.
76|77

ELECTRICAL IMPEDANCE TOMOGRAPHY | 10. OBSERVATIONAL EXPERIMENTAL AND CLINICAL STUDIES
As discussed before, EIT provides a means of visualising the regional distribution of ventilation and chan ges of lung volume. This ability is particularly useful when therapy changes are intended to achieve a more homo gen ous gas distribution in mechanically ventilated patients.
Today, the assessment of regional gas distribution can only be based on CT or MRI scans. How ever, CT involves an exposure to significant doses of ionising radiation [44, 45]. Also, CT and MRI can usually not be performed at the bedside and thus require that the patient is transported to the ra dio lo gy department. The intra-hospital transport of critically ill ventilated patients represents a sig nifi cant risk for the patient and increased workload for caregivers.
Moreover, CT and MRI images are static and thus only represent lung volume at one specific point in time. Also, CT and MRI cannot provide real-time quantification of air content in predefined ROIs. Even though CT provides images of the regional gas distribution, experts do not consider CT to be sui table for the individual optimisation of ventilator settings at the bedside [15, 37].
Due to the general properties of EIT and its specific design, PulmoVista 500 can easily be used con tinuously at the bedside to provide regional information about distribution of ventilation as well as changes of end-expiratory lung volume. No side effects of EIT have ever been reported. Besides the unique information provided by EIT, its convenience and safety contribute to the increasing per cep tion expressed by various authors that EIT has the potential to be used as a valuable tool for optimising PEEP and other ventilator settings [46, 47].
The effects of various therapeutic interventions on ventilation distribution have already been assessed with the help of EIT, and this chapter gives an overview of the literature that has been published in this context.
10. Observational Experimental and Clinical Studies
78|

79
PEEP TITRATION
Currently, there is no consensus within the medical community on how to optimise ventilator settings such as PEEP. This is, among other issues, related to the fact that before the advent of EIT we did not have a bedside method to assess regional ventilation distribution and dynamic opening and collapse of pulmonary areas. Knowledge about the distribution of ventilation could help the cli ni cians to set ventilation parameters more appropriately for the individual patient and thus po ten tially re duce the risk of ven tilator associated lung injury (VALI).
EIT-based titration of PEEP to avoid atelectasis on the one hand and regional hyperinflation on the other hand has already been described by Hinz et al. [48]. The authors also interpreted the “filling charac teristics”, where local impedance waveforms are plotted over global waveforms and where they found significant differences between dependent and non-dependent lung regions. In the same pub li cation, the ability to find regional upper inflection points in regional pressure-impedance curves was estab lished; this can be used to assess a wide variety of PEEP trials.
Erlandson et al. [47] assessed slopes of the end-expiratory lung impedance (EELI) at diff er ent PEEP settings over time; it was hypothesised that a constant level of EELI would corres pond to a stable end-expiratory lung volume (within the EIT sensitivity region) and thus would indicate the op ti mal PEEP setting (Fig. 45).
78|
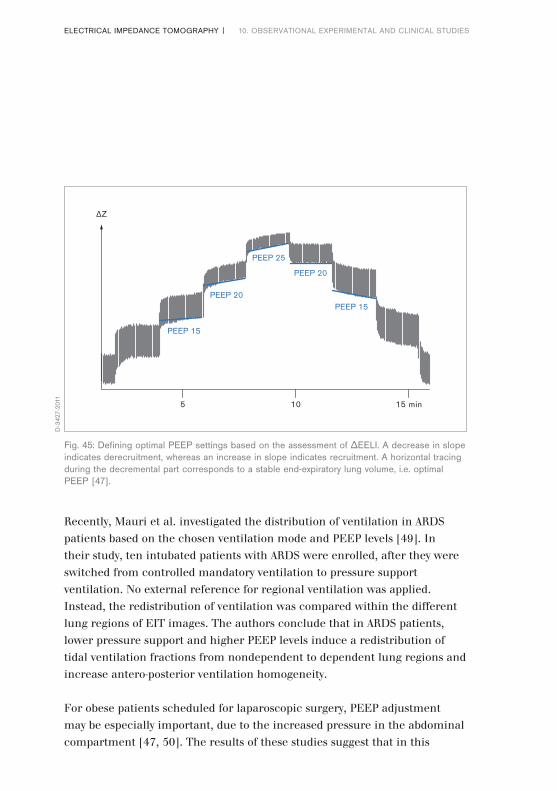
80|ELECTRICAL IMPEDANCE TOMOGRAPHY | 10. OBSERVATIONAL EXPERIMENTAL AND CLINICAL STUDIES
Fig. 45: Defining optimal PEEP settings based on the assessment of ΔEELI. A decrease in slope indicates derecruitment, whereas an increase in slope indicates recruitment. A horizontal tracing during the decremental part corresponds to a stable end-expiratory lung volume, i.e. optimal PEEP [47].
5 10 15 min
ΔZ
PEEP 15
PEEP 20
PEEP 25
PEEP 20
PEEP 15
D-3
427-
2011
Recently, Mauri et al. investigated the distribution of ventilation in ARDS patients based on the chosen ventilation mo de and PEEP levels [49]. In their study, ten intubated patients with ARDS were enrolled, after they were switched from controlled mandatory ventilation to pressure support ven tilation. No external reference for regional ventilation was applied. Instead, the redistribution of ven tilation was compared within the different lung regions of EIT images. The authors conclude that in ARDS patients, lower pressure support and higher PEEP levels induce a redistribution of tidal ven tilation fractions from nondependent to de pen dent lung regions and increase antero-posterior ven tilation homogeneity.
For obese patients scheduled for laparoscopic surgery, PEEP adjustment may be especially im por tant, due to the increased pressure in the abdominal compartment [47, 50]. The results of these studies suggest that in this

81
patient population, EIT monitoring might be helpful to adjust PEEP levels in order to prevent lung collapse. In morbidly obese patients, the PEEP level required appeared to be higher than previously anticipated.
ASSESSMENT OF RECRUITMENT MANOEUVRES
Recruitment manoeuvres aim at reopening collapsed lung regions, thus improving pulmonary aera tion and reducing mechanical stress during subsequent ventilation. The regional effects of recruit ment manoeuvres can be visualised and assessed with EIT [10, 37].
Indeed, the question whether patients benefit from a high PEEP or a recruitment manoeuvre has been investigated by many researchers. In 2006, Gattinoni et al. reported a high variability of added lung volume in response to high pressures [51]. However, the Italian authors used CT to determine the responsiveness of patients. To avoid the x-ray load, Lowhagen and co-workers introduced an EIT-based technique of regional P/V-monitoring during recruitment manoeuvres. In their study on 16 ventilated ALI patients [52], the authors presented a new method to quantify potentially recruitable regional lung volume by looking at the difference in regional tidal variations at tidal breathing and at 40 cm H2O. ΔEELI was calibrated against regional ΔEELV. In accordance with earlier statements about “Recruiters” and “Non-Recruiters” by Gattinoni [51], the authors found that only patients with a higher percentage of potentially recruitable lung benefited from a higher PEEP. The authors concluded that such a technique, after being validated sufficiently, might allow to distinguish recruiters from non-recruiters.
Odenstedt et al. evaluated the effects of different lung recruitment manoeuvres with EIT in fourteen ani mals with induced lung injury [23]. This study confirmed that EIT is capable of continuously moni toring lung volume changes and that EIT can help to identify responders to recruitment manoeuvres.
Slow de-recruitment after recruitment manoeuvres, caused by insufficient
80|

82|ELECTRICAL IMPEDANCE TOMOGRAPHY | 10. OBSERVATIONAL EXPERIMENTAL AND CLINICAL STUDIES
post-manoeuvre PEEP le vels, can also be identified.SPONTANEOUS BREATHING
Frerichs et al. [53] performed EIT studies in infants and concluded that EIT is capable of displaying the effect of spontaneous breathing on the distribution of ventilation.
In [54], Putensen presented a case of an intubated patient with acute respiratory failure breathing spon taneously with APRV. When spontaneous breathing in this patient was discontinued, ven ti la tion in the right dorsal region almost disappeared, indicating that during mechanical ven ti la tion re gion al ven tilation was predominantly redistributed to the ventral lung areas. Even though these effects are well known and the positive effects of spontaneous breathing on gas ex change, par ti cularly in the dor sal regions, are widely accepted, witnessing the disappearance of dor sal ventilation in asso ci a tion with sedation should provide valuable information for making clinical de cisions.
MONITORING OF DE-RECRUITMENT FOLLOWING SUCTIONING
PROCEDURES
Endotracheal suctioning is a very common procedure to remove secretions from the airways of in tu ba ted and mechanically ventilated patients. While this procedure is often inevitable, it carries the risk, especially in ALI or ARDS patients, of lung de-recruitment, further compromising gas exchange.Using EIT, it has been shown that in some patients, a relatively long period of time passes before end-expiratory lung impedance is restored to levels observed prior to airway suctioning. In an experimental animal setup, Lindgren et al. [55] used EIT to assess lung volume and com pli ance changes during open and closed suctioning and were able to confirm that EIT is ca pable of mo nitoring rapid lung vo lume changes such as those induced by endotracheal suctioning.
These results were replicated in a sub sequent clinical study by the same

group in 2008 where the effect of endotracheal suctioning on pul monary aeration was investigated in 13 ventilated ICU pa tients [56]. Using EIT the authors were able to monitor the de re cruit ment, as a direct result of suc tion ing, as well as the slow recruitment that occurred afterwards in some patients.
In 2009, van Veenendaal et al. described the results of their prospective observational clinical study in volving 11 preterm infants with RDS treated with open lung high frequency ventilation (HFV) [57]. The authors measured changes in global and regional lung volume with EIT during routine clo sed suctioning procedures. Tracking the global impedance values, the authors concluded that clo sed ETT suction may cause an acute, transient and heterogeneous loss of lung volume followed by a gradual recovery within the first minute after suctioning.
Tingay et al. investigated the differences between closed and open suctioning in an animal trial [58]. In this paper published in 2010, three suction methods (open, closed inline and closed using a side-port adapter) and two catheter sizes were applied to six two-week old piglets in random order. The authors concluded that ETT suction causes transient loss of EELI throughout the lung. The catheter size was of greater influence than the suction method, with closed suction only pro tec ting against derecruitment when a small catheter was used, indicating that the resistance to airflow is an important factor.
In 2012, Corley et al. reported on the differences between closed and open suctioning in humans [59]. In a randomised crossover study examining 20 patients post cardiac surgery, the authors exa mined the effects of open and closed suction on lung volume loss using EIT. Interestingly, the au thors found that closed suctioning minimised lung volume loss during suctioning but, coun ter in tui tively, resulted in a slower recovery of EELI compared with open suctioning.
8382|

MONITORING THE EFFECTS OF PATIENT POSITIONING
During lateral positioning, typically much more ventilation occurs in the dependent lung (in left lateral position, the left lung) than in the non-dependent lung. This is because at the end of expiration, gravity causes the dependent lung to be more compressed than the upper lung; however, in a healthy individual the dependent lung is fully inflated at the end of inspiration. This means that larger changes of air content occur in dependent regions (Fig. 46).
84|ELECTRICAL IMPEDANCE TOMOGRAPHY | 10. OBSERVATIONAL EXPERIMENTAL AND CLINICAL STUDIES
Fig. 46: Redistribution of ventilation in a healthy volunteer; while a typical left / right distribution of 52 % / 48 % is seen in supine position (left), in a right lateral position this ratio changed to 72 % / 28 % (centre), in a left lateral position to 35 % / 65 % (right)
D-4
8-20
11

85
Fig. 47: Changes of ventilation distribution – assessed with the End-inspiratory trend view of Dräger PulmoVista® 500 – in a chest trauma patient in a rotation bed, while being turned from supine to a 60° left lateral position. The first image represents supine position (reference), the following images represent a rotation of 15°, 30°, 45° and 60°. The images depict how ventilation increases in the upper right lung due to the gravity vector which changes over time during the rotation
D-7
534-
2014
While these phenomena are well known and quite intuitive in clinical practice, EIT allows visualisation and assessment of these dynamic changes at the bedside: see Fig. 47
In the last 20 years, prone positioning has been used increasingly in the treatment of ARDS pa tients [60, 61]. EIT may help to monitor ventilation redistribution due to such changes of position. More over, it may help to identify responders to this kind of treatment. It may also help identify the best body position in case of a highly uneven distribution of ventilation [62, 63].
POSITIONING OF DOUBLE LUMEN ENDOTRACHEAL TUBES
Steinmann et al. [64] used EIT to assess the correct placement of double lumen endotracheal tubes (DLT) and compared the findings with those obtained using fibreoptic bronchoscopy (FOB). While EIT enables immediate recognition of misplaced left-sided DLTs, EIT did not provide
84|

86|ELECTRICAL IMPEDANCE TOMOGRAPHY | 10. OBSERVATIONAL EXPERIMENTAL AND CLINICAL STUDIES
a method to de tect incorrectly positioned endobronchial cuffs (as diagnosed by FOB). Thus, EIT cannot replace FOB as a means of determining correct placement of DLTs. Nonetheless, the authors stated that EIT could be used as an additional tool, complementing auscultation as a non-invasive method of assess ing DLT placement.
In 2013, Steinmann and co-workers reported on the use of EIT to position endotracheal tubes (ETT) in paediatric anaesthesia applications [65]. The authors concluded that a correct ETT placement cor related very well with a homogeneous distribution of ventilation between left and right lung. DETECTION OF PNEUMOTHORAX
For intensive care patients, the incidence of acquiring an iatrogenic pneumothorax, which is a life-threatening complication, was reported to be 3% [66].
As the pneumothorax represents a lung region with an extremely high impedance, it has been assess ed by different groups whether EIT may be useful not only to detect to detect a pneumothorax, but also to track the potential success of the ra peutic interventions. In 2006, Hahn et al. reported that they were able to monitor pathological fluid and air accumulation in 5 pigs and 4 patients [67].
In a controlled experimental setting including 39 pigs, Costa et al. [68] demonstrated that EIT is able to quickly detect the development of an artificial pneumothorax. In the same year, Preis et al. reported on the time course of an accidental pneumothorax which unexpectedly occurred during an open lung animal experiment. The incident could be nicely monitored using EIT [69].
The first human neonatal case of a pneumothorax monitored by EIT was reported by Miedema et al. in 2011 [70]. In this case report, Chest X-ray and functional EIT images from a male preterm infant both clearly showed a right-sided pneumothorax.
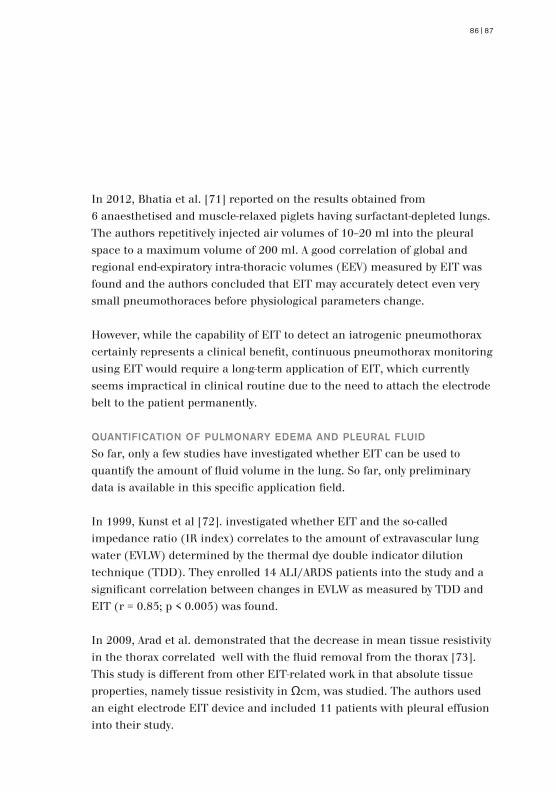
In 2012, Bhatia et al. [71] reported on the results obtained from 6 anaesthetised and muscle-relaxed piglets having surfactant-depleted lungs. The authors repetitively injected air volumes of 10–20 ml into the pleural space to a maximum volume of 200 ml. A good correlation of global and regional end-expiratory intra-thoracic volumes (EEV) measured by EIT was found and the authors con cluded that EIT may accurately detect even very small pneumothoraces before physiological para meters change.
However, while the capability of EIT to detect an iatrogenic pneumothorax certainly represents a clinical benefit, con tin u ous pneumothorax monitoring using EIT would require a long-term application of EIT, which currently seems impractical in clinical routine due to the need to attach the electrode belt to the patient per ma nently.
QUANTIFICATION OF PULMONARY EDEMA AND PLEURAL FLUID
So far, only a few studies have investigated whether EIT can be used to quantify the amount of fluid vo lume in the lung. So far, only preliminary data is available in this specific application field.
In 1999, Kunst et al [72]. investigated whether EIT and the so-called impedance ratio (IR index) correlates to the amount of extravascular lung water (EVLW) determined by the ther mal dye double in dicator dilution technique (TDD). They enrolled 14 ALI/ARDS patients into the study and a sig ni fi cant correlation between changes in EVLW as measured by TDD and EIT (r = 0.85; p < 0.005) was found.
In 2009, Arad et al. demonstrated that the decrease in mean tissue resistivity in the thorax correlated well with the fluid removal from the thorax [73]. This study is different from other EIT-related work in that absolute tissue properties, namely tissue resistivity in Ωcm, was studied. The authors used an eight electrode EIT device and included 11 patients with pleural effusion into their study.
8786|

88|ELECTRICAL IMPEDANCE TOMOGRAPHY | 11. EIT-DERIVED NUMERICAL INDICES
While the interpretation of EIT images provides a rough visual impression of ventilation distribution, these images alone may not be sufficient for quantification of the impact of thera peu tic procedures in clinical routine. EIT-derived numerical indices may be particularly useful for comparing the ventilation distribution at different points in time and for assessing the trend of ventilation distribution. Hence, the clinical community expressed its need for simple yet discriminative numerical indices which are also an important prerequisite for establishing thresholds, limits and proper target ranges for therapy. In the last decade, the race for the best approach to interpret EIT-based information was opened.
In 2000, Kunst et al. [9] introduced an index called the “impedance ratio” (IR) which divided the ven tilation activity in the upper (ventral) region VAventral of EIT images by the dorsal ventilation ac ti vi ty VAdorsal. The IR index turned out to be a sensitive parameter for monitoring vertical ven ti la tion changes induced by e.g. recruitment, derecruitment or overdistension.
The idea of using the “centre of gravity” (COG) as an index to characterise the shape of functional EIT images was first introduced by Frerichs et al. [74]. Originally named the “geometrical centre” of ven tilation, this index was later renamed either “centre of ventilation” (COV) or “centre of gravity” (COG). In fact, Luepschen et al. demonstrated in 2007 that COG may serve as a sensitive index to des cribe vertical shifts in ventilation due to lung opening and closing during incremental and de cre men tal PEEP trials [25].
Radke et al. [75] recently investigated the impact of spontaneous breathing on the COV during ge neral an aes thesia. As is generally known, controlled ventilation tends to ventilate ven tral lung re gions more than dorsal regions during anaesthesia. Hence, the authors assumed that spontaneous breath -ing and pressure support ventilation would reduce the extent of the
11. EIT-derived numerical indices

redistribution of ventilation as detected by electrical impedance tomography. 30 non-obese patients without severe cardiac or pul monary comorbidities scheduled for elective orthopaedic surgery were enrolled in their study. To quan ti fy the distribution of ventilation, the authors used the COV from EIT recordings, as the COV is a single number, has a good reproducibility, and simplifies the comparison of EIT recordings. The au thors conclude that according to the changes in COV, both PCV and PSV induce a redistribution of ventilation towards the ventral region. Spontaneous breathing prevented this redistribution.
In 2011, Luepschen et al. [76] demonstrated that EIT-based numerical indices like COV can be used as a guide for open-lung manoeuvres. In particular, the authors demonstrated that automatic open-lung manoeuvres based on EIT-COV can be part of closed-loop ventilation strategies. While earlier attempts for automatic ven tilation of the same group used PaO2 as a controlled output variable and EIT images as well as CT scans as independent references [25], this was the first time that EIT has actually been made part of the ventilation control loop.
In 2009 and 2010, Zhao et al. proposed another simple index called the “global in ho mo geneity” index (GI). To calculate this index, the median value of regional impedance changes from ventilated regions within the tidal image has to be computed, then the sum of differences between the median and every pixel value needs to be calculated, and the result must be normalised by the sum of im pe dance values within the lung area. As reported, this index was applied to quantify ventilation inhomogeneity during one-lung ventilation in a study enrolling 50 patients, out of which 40 patients were intubated with double-lu men endo tracheal tubes (test group) and another 10 patients were serving as a control group [77]. The au thors concluded that using the GI index, one-lung ventilation was clearly dis ting-uish able from doub le-lung ventilation in all patients. The same authors also found the GI index useful for PEEP ti tra tion in a pig trial where it correlated well with maximum compliance [78].
8988|

90|ELECTRICAL IMPEDANCE TOMOGRAPHY | 11. EIT-DERIVED NUMERICAL INDICES
In 2009, Muders et al. [79] described a new index of homogeneity of regional lung mechanics, the so-called “re gion al ventilation delay” (RVD) index (Fig. 48). Based on this RVD index, RVD maps may be ge ner ated from which the RVD standard deviation called SDRVD may be computed. This SDRVD index describes the variation of re gion al de lays of the beginning of inspiration com pared to the global beginning of inspiration during a slow in fla tion manoeuvre. Preliminary data showed an excellent correlation of SDRVD with cyclic open ing and closing, suggesting that this index could also be a promising approach to titrate PEEP settings to prevent tidal recruitment.
Two more indices which allow quantifying regional overdistension and atelectasis were introduced in [80]. Based on the assumption of a uniform
Fig. 48: Distribution of regional ventilation delay during a slow inflation manoeuvre: While the Tidal Image represents the distribution of ventilation, the RVD approach determines the delay of the beginning of regional inspiration relative to the beginning of global inspiration. In the RVD image, the regional ventilation delay is calculated for each pixel and plotted in a colour-coded map. A completely black RVD Image indicates a homogeneous beginning of inspiration, orange regions indicate a delayed and blue regions an early beginning of inspiration (preliminary colour scale).
D-1
9661
-201
5
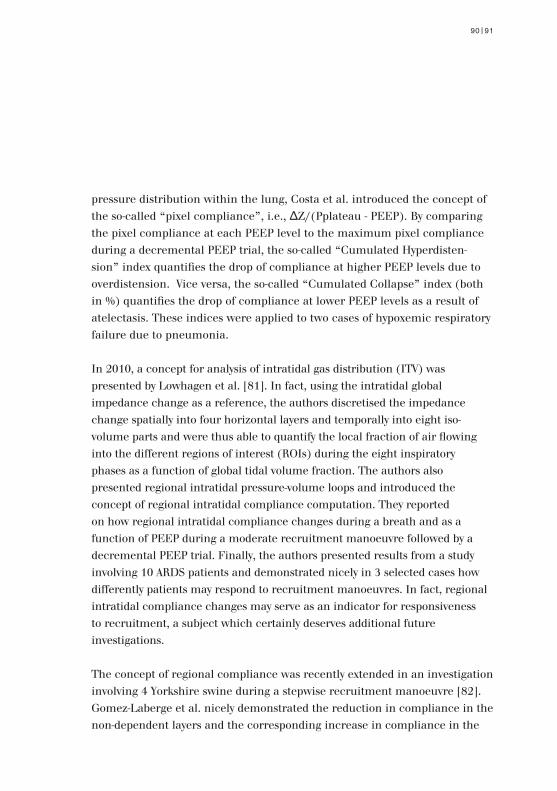
pressure distribution within the lung, Costa et al. in tro duced the concept of the so-called “pixel compliance”, i.e., ΔZ/(Pplateau - PEEP). By com paring the pixel compliance at each PEEP level to the maximum pixel compliance during a decremental PEEP trial, the so-called “Cumulated Hyper dis ten-sion” index quantifies the drop of compliance at higher PEEP levels due to overdistension. Vice versa, the so-called “Cumulated Collapse” index (both in %) quantifies the drop of compliance at lower PEEP levels as a result of atelectasis. These indices were applied to two cases of hypoxemic res pi ra tory failure due to pneumonia.
In 2010, a concept for analysis of intratidal gas distribution (ITV) was presented by Lowhagen et al. [81]. In fact, using the intratidal global impedance change as a reference, the authors discretised the impedance change spatially into four horizontal layers and temporally into eight iso-volume parts and were thus able to quantify the local fraction of air flowing into the different regions of interest (ROIs) during the eight inspiratory phases as a function of global tidal volume fraction. The authors also presented regional intratidal pressure-volume loops and introduced the concept of regional intratidal compliance computation. They reported on how regional intratidal compliance changes during a breath and as a function of PEEP during a moderate recruitment manoeuvre followed by a decremental PEEP trial. Finally, the authors presented results from a study involving 10 ARDS patients and demonstrated nicely in 3 selected cases how differently patients may respond to recruitment manoeuvres. In fact, regional intratidal compliance changes may ser ve as an indicator for responsiveness to recruitment, a subject which certainly deserves ad dition al future investigations.
The concept of regional compliance was recently extended in an investigation involving 4 Yorkshire swine during a stepwise re cruitment manoeuvre [82]. Gomez-Laberge et al. nicely demonstrated the reduction in compliance in the non-dependent layers and the corresponding increase in com pliance in the
9190|

92|ELECTRICAL IMPEDANCE TOMOGRAPHY | 11. EIT-DERIVED NUMERICAL INDICES 12. EIT FOR GUIDANCE OF RESPIRATORY THERAPY
dependent layer of the lung when PEEP was increased stepwise. By using two EIT silicone belts at the same time in different layers, Bikker et al. investigated the effect of varying the belt lo cation in the cranio-caudal axis [83]. In a decremental PEEP trial following a recruitment manoeuvre (40 cmH2O × 40 s), 12 mechanically ventilated post cardiac surgery patients were studied. The authors found that tidal impedance variation divided by tidal volume decreased in caudal EIT images, whereas it increased on the cranial EIT images. They also measured COV and found that this index decreased when PEEP decreased on both belt levels. The authors concluded that during a decremental PEEP trial, at least in this patient population, ventilation distribution may not only shift from the dorsal to ventral direction, but also from the caudal to cranial direction.
Besides assessing lung function in ventilated intensive care patients, EIT may also be used for extending diagnostic lung function procedures to include regional information in pneumo lo gi cal patients. Recently, new indices have been introduced for this specific application. In 2012, Zhao et al. studied the GI index in 14 patients with cystic fibrosis and in 14 healthy vo lun teers [84] and introduced the concept of regional MEF25/MEF75 maps to quantify regional ob struction during forced expiration manoeuvres.
In the same year, Pikkemaat et al. re por ted on pre lim inary results of the regional effects of using Salbutamol for broncho-spasmolysis in 8 paediatric pa tients with bronchial asthma [85]. For this, the authors introduced the new concept of the so-called “regional time constant maps” and were able to demonstrate diverse regional changes in the mech anical time constants, indicating inhomogeneous ad minis tration or effectiveness of the drug.
In 2012, Adler et al. published a comprehensive review and consensus paper [86] indicating different levels of maturity for EIT-based ventilation monitoring (quite mature) as compared to monitoring of perfusion, ventilation-to-perfusion mismatch and edema which still are at an early stage of investigation. The authors mentioned that various EIT measures have already been published which may capture different phenomena, but not the complete

9392|
More recently EIT has also been used to guide therapy directly, indicating its clinical relevance.
Based on regional compliance, Wolf et al. recently presented a three-step algorithm to adjust ven ti la tion based on EIT. Mainly, the authors proposed to reverse atelectasis in the dorsal regions by raising PEEP in gradations of 5 cm H2O (“recruitment”) and then reduce overdistension in the ventral regions by de cre men ting PEEP in gradations of 2 cm H2O while observing a potential decrease of compliance in the dorsal regions (PEEP titration). Their concept was eval uated in twelve Yorkshire swine, out of which 6 animals were ventilated based on the EIT al go rithm and 6 were ventilated based on the ARDSnet protocol serving as a control group [87]. Ventilation time was 6 h. The authors concluded that EIT-guided ventilation resulted in improved respiratory mechanics, improved gas exchange, and reduced histologic evidence of ventilator-induced lung injury.
Bikker et al. investigated an oleic acid ARDS model in eight pigs and calculated regional ventilation loops from EIT [88]. Comparing ventilation distribution in EIT during an incremental and decremental PEEP trial, the authors could determine the optimal PEEP level.
In 16 piglets with a lavage model of ARDS, representing a neonatal model,Dargaville et al. used EIT to determine the best PEEP level [89]. In this experiment, the best PEEP level was defined by the most even ventilation distribution and regional ventilation loops displayed by EIT. While this approach may be arbitrary, this endpoint represents a clinical rationale and pathophysiological understanding.
The use of EIT to guide ventilation was also studied in four prospective
12. EIT for guidance of respiratory therapy

94|ELECTRICAL IMPEDANCE TOMOGRAPHY | 12. EIT FOR GUIDANCE OF RESPIRATORY THERAPY 13. A CALL FOR CONSENSUS
interventional trials.In a study by Zhao et al. [78] EIT was used to find the “optimal” PEEP setting, i.e., the PEEP level that resulted in the most even distribution of ventilation across all lung regions. The authors analysed the EIT image for homogenous distribution of ventilation in 10 healthy patients during anaesthesia. They increased PEEP from 0 to 28 mbar in 2 mbar increments and analysed homogeneity at each PEEP level. In their patients, they found the best homogeneity of ventilation at a PEEP level of 14 mbar.
Lowhagen et al. used EIT in 16 patients with early acute lung injury to determine the potentially recruitable lung volume [52]. Based on this and the regional ventilation distribution shown in EIT, the authors could determine the best PEEP level.
A similar approach was chosen by Camporota et al. in two patients with severe ARDS [90]. Assessing the dynamic changes of ventilation distribution in EIT, the investigators could determine the potentially recruitable lung volume in both patients, and identify the one patient where a recruitment manoeuvre was possibly successful, while in the other patient no recruitable lung volume was identified.
Another study was conducted by Mauri et al. [49] in which EIT was used to identify the best combination of pressure support level and PEEP level. 10 patients with ARDS being ventilated with pressure support ventilation (PSV), the best combination of high-low PEEP with high-low pressure support was determined with EIT. The authors wanted to find the pressure combination that resulted in the best ventilation distribution. The combination of low pressure support with high PEEP appeared to be the best combination for this patient population.
The results of these studies clearly indicate that EIT provides useful information for optimising lung-protective ventilation. It is expected that more studies will investigate the value of EIT for guidance of respiratory therapy in the near future.

95
As has been proposed in several publications already, EIT is considered to be about to become one of the central means to guide mechanical ventilation. In fact, In 2012, Adler et al. answered the hypothetical question “How could EIT improve outcomes?” by claiming that “EIT can guide lung protective ventilator settings” and “EIT can set lung protective ventilator settings faster” [86].
In this paper, the authors nicely sketch the past and future EIT research roadmap agenda by a subsequent series of steps which they called the “4 R series”: Firstly, EIT had to become “Reliable” (i.e. it had to correspond to gold standards like CT, SPECT, etc.) and “Reproducible” (which both have finally been achieved with the market introduction of Pulmovista 500).
It now has to become “Relevant” (i.e. EIT calculates parameters relevant to clinical practice) and it will finally be come “Rewarding” (i.e. EIT will be capable of guiding therapy that results in better outcomes).
13. A Call for Consensus
94|

ELECTRICAL IMPEDANCE TOMOGRAPHY | 14. EXAMPLES OF EIT STATUS IMAGES
While radiological and EIT images both provide information about the regional distribution of air in the lungs, the image characteristics provided by these modalities are quite different.
The difference in spatial and temporal resolution has previously been discussed.
Radiological images of the lung provide information on the air content and reflect, depending on the moment the images were taken, the end-inspiratory or end-expiratory status, or a lung condition somewhere in between.
EIT images reflect the lung function, not the lung itself, which means EIT displays ventilated lung regions rather than morphological or anatomical structures of the lung.
Nonetheless, the regional information contained in EIT and CT images is closely related to each other when pathological conditions such as pleural effusion or atelectasis lead to non-aerated and non-ventilated lung regions. While CT images display lung regions with trapped air (e.g. pneumothorax) in black because of the large air content, EIT also displays those regions in black because they are not ventilated. Conversely a CT image may indicate a region of consolidated lung tissue in a white colour because of the high fluid content, while this region might be displayed in the EIT image in a black or dark blue colour, if this region is not or only partially ventilated.
In this chapter, various examples of EIT status images are provided as an introduction to the world of EIT images. Where available, radiographic chest images from the same patient are shown as well.
Please note that the comparability of the displayed EIT images and the related radiographic chest images or CT images may be limited due to the
14. Examples of EIT status images
96|

fact that the images were taken at different times, and there may also be some variation in the caudo-cranial aspect of the images.
EXAMPLE 1: HEALTHY LUNG
Ventilation is quite evenly distributed over the quadrants of the image (ROI 1 = 28 %, ROI 2 = 26 %, ROI 3 = 25 %, ROI 4 = 21 %). Typically, the right lung (ROI 1 and ROI 3 in this ROI arrangement) receives 50 – 55 % of global ventilation (100 %) in a sitting or supine individual, which corresponds to findings in the literature [91]. This distribution changes significantly, even in healthy volunteers, during lateral positioning.
Fig. 49: Tidal image of a healthy individual
D-5
0-20
11
96|97
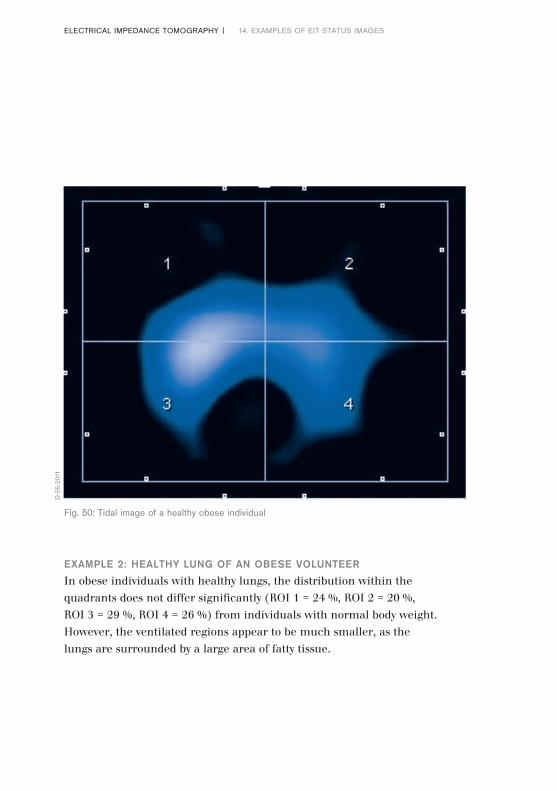
EXAMPLE 2: HEALTHY LUNG OF AN OBESE VOLUNTEER
In obese individuals with healthy lungs, the distribution within the quadrants does not differ significantly (ROI 1 = 24 %, ROI 2 = 20 %, ROI 3 = 29 %, ROI 4 = 26 %) from individuals with normal body weight. However, the ventilated regions appear to be much smaller, as the lungs are surrounded by a large area of fatty tissue.
Fig. 50: Tidal image of a healthy obese individual
ELECTRICAL IMPEDANCE TOMOGRAPHY | 14. EXAMPLES OF EIT STATUS IMAGES
D-5
5-20
11
98|
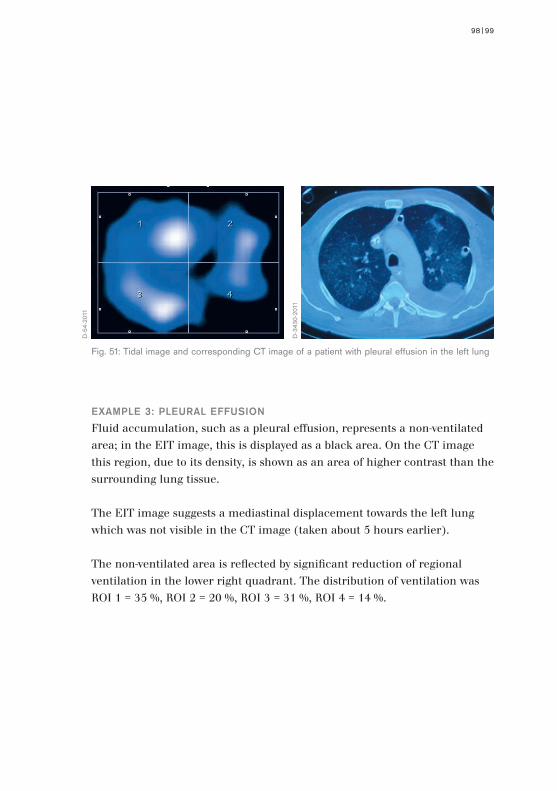
EXAMPLE 3: PLEURAL EFFUSION
Fluid accumulation, such as a pleural effusion, represents a non-ventilated area; in the EIT image, this is displayed as a black area. On the CT image this region, due to its density, is shown as an area of higher contrast than the surrounding lung tissue.
The EIT image suggests a mediastinal displacement towards the left lung which was not visible in the CT image (taken about 5 hours earlier).
The non-ventilated area is reflected by significant reduction of regional ventilation in the lower right quadrant. The distribution of ventilation was ROI 1 = 35 %, ROI 2 = 20 %, ROI 3 = 31 %, ROI 4 = 14 %.
Fig. 51: Tidal image and corresponding CT image of a patient with pleural effusion in the left lung
D-5
4-20
11
D-3
430-
2011
98|99

EXAMPLE 4: RIGHT SIDED PNEUMONECTOMY
As there is no ventilation in the right hemithorax after a pneumonectomy, the corresponding area on an EIT image (transverse plane) is black. In contrast on a chest X-ray (frontal plane) this area is white, as the right hemithorax is filled with fluid and connective tissue. The distribution of ventilation was ROI 1 = 2 %, ROI 2 = 55 %, ROI 3, = 1 %, ROI 4 = 42 %.
ELECTRICAL IMPEDANCE TOMOGRAPHY | 14. EXAMPLES OF EIT STATUS IMAGES
Fig. 52: Tidal image and corresponding chest X-ray of a patient with pneumonectomy
D-5
6-20
11
D-3
431-
2011
100|

EXAMPLE 5: PNEUMOTHORAX
This EIT image reveals that most of the ventilation is occurring in ROI 1; the cause of the poor distribution is revealed by the more anatomically specific CT image: a pneumothorax (marked by the blue line) in the ventral region of the left lung and bilateral dorsal atelectasis and effusion.
ROI 1 is receiving 56 % of the “Tidal Variation” while, due to the pneumothorax, ROI 2 is receiving just 16 % of the global “Tidal Variation” and due to the dorsal pathology ROI’s 3 and 4 are receiving just 15 and 13 % respectively.
Fig. 53: Tidal image and corresponding CT image of a patient with a pneumothorax in the left lung
D-5
2-20
11
D-3
432-
2011
100|101

EXAMPLE 6: ATELECTASIS
The EIT image shows that the functional impairment of the two basal lung regions was not symmetrical even though the chest X-ray indicates bilateral atelectasis. The basal portions of the right lung, (ROI 3) still received 31 % of the global “Tidal Variation” while the corresponding area of the left lung, (ROI 4) only received 15 %.
ELECTRICAL IMPEDANCE TOMOGRAPHY | 14. EXAMPLES OF EIT STATUS IMAGES
Fig. 54: Tidal image and corresponding chest X-ray of a patient with dorsal atelectasis
D-5
8-20
11
D-3
433-
2011
102|
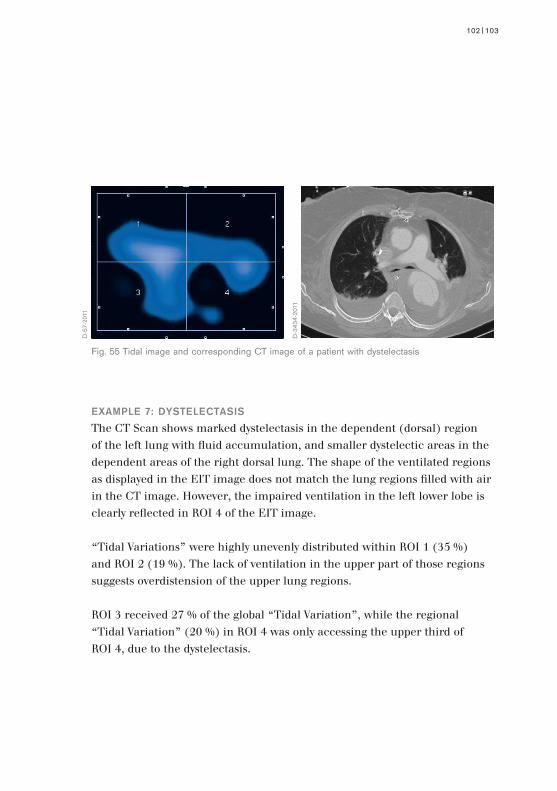
EXAMPLE 7: DYSTELECTASIS
The CT Scan shows marked dystelectasis in the dependent (dorsal) region of the left lung with fluid accumulation, and smaller dystelectic areas in the dependent areas of the right dorsal lung. The shape of the ventilated regions as displayed in the EIT image does not match the lung regions filled with air in the CT image. However, the impaired ventilation in the left lower lobe is clearly reflected in ROI 4 of the EIT image.
“Tidal Variations” were highly unevenly distributed within ROI 1 (35 %) and ROI 2 (19 %). The lack of ventilation in the upper part of those regions suggests overdistension of the upper lung regions.
ROI 3 received 27 % of the global “Tidal Variation”, while the regional “Tidal Variation” (20 %) in ROI 4 was only accessing the upper third of ROI 4, due to the dystelectasis.
Fig. 55 Tidal image and corresponding CT image of a patient with dystelectasis
D-5
7-20
11
D-3
434-
2011
102|103
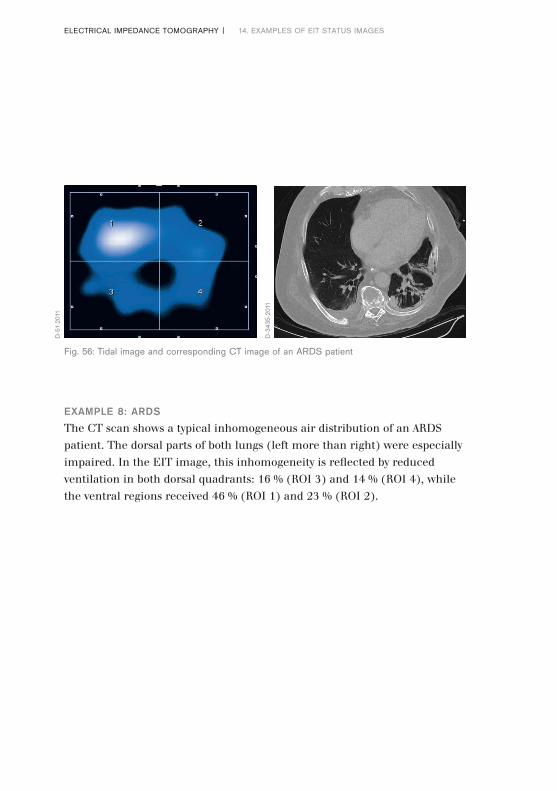
EXAMPLE 8: ARDS
The CT scan shows a typical inhomogeneous air distribution of an ARDS patient. The dorsal parts of both lungs (left more than right) were especially impaired. In the EIT image, this inhomogeneity is reflected by reduced ventilation in both dorsal quadrants: 16 % (ROI 3) and 14 % (ROI 4), while the ventral regions received 46 % (ROI 1) and 23 % (ROI 2).
ELECTRICAL IMPEDANCE TOMOGRAPHY | 14. EXAMPLES OF EIT STATUS IMAGES
Fig. 56: Tidal image and corresponding CT image of an ARDS patient
D-5
1-20
11
D-3
435-
2011
104|

EXAMPLE 9: ARDS
The CT scan shows the typical picture of late ARDS with diffuse infiltrates throughout nearly all lung regions. While the CT scan seems to show no major difference in the severity of alteration between both lungs, the EIT image shows a very uneven distribution of Tidal Variations. The upper right lung (ROI 1) received 46 %, the lower right lung (ROI 3) 39 %. The impedance waveforms revealed a significantly delayed filling in ROI 2 and ROI 4, leaving just 15 % of the tidal volume (ROI 2 = 5 %; ROI4 = 10 %) for the left lung. This example shows how EIT can provide additional information compared with other non-dynamic imaging modalities.
Fig. 57: Tidal image and corresponding CT image of an ARDS patient
D-5
3-20
11
D-3
436-
2011
104|105

ELECTRICAL IMPEDANCE TOMOGRAPHY | 15. OUTLOOK
Prior to the introduction of PulmoVista 500, all EIT devices were solely used in clinical and pre-clinical research, which means that at present there is still limited experience in using information from EIT in daily clinical practice.
It is anticipated that, initially, experts in mechanical ventilation and respiratory monitoring will rapidly gain further experience in using EIT in daily clinical practice now that PulmoVista 500 has been made available by Dräger.
At the same time however, the availability of PulmoVista 500 will probably also boost further research activities, as from now on EIT data can conveniently and reliably be collected over hours with an approved medical device.
For example, various approaches to the extraction of diagnostic information from EIT data have already been described by researchers: in the future these methods might be established as being suitable to notify the clinician about lung conditions that need to be avoided, such as overdistension or cyclic opening and closing of lung regions.
Costa et al. [80] have described an algorithm that estimates recruitable alveolar collapse and hyperdistension utilising EIT data collected during a decremental PEEP trial. Recently Löwhagen et al. [92] developed an algorithm to assess the regional redistribution of gas throughout the inspiratory phase during a decremental PEEP trial, subsequent to a recruitment manoeuvre.
It becomes more and more obvious that the greatest value in the diagnostic interpretation of EIT data can be obtained when algorithms are applied
15. Outlook
106|
during therapeutic manoeuvres that induce regional redistribution of tidal volumes and changes of end-expiratory lung volumes. It is this specific information that reveals how the lungs of the individual patient respond to different ventilation strategies.
Not surprisingly, initial approaches have already been described [25] about using EIT-based diagnostic information as an input source for future expert systems which automatically adjust ventilator settings according to the requirements of the individual patient, thus continuously maintaining lung protective ventilation strategies.
Another application field receiving increasing interest within the research community is the EIT-based estimation of regional distribution of pulmonary perfusion. While the approaches described so far [93, 94, 95] certainly need further validation, such supplementary information would be of even greater clinical value to the physician, as for the first time, not only the distribution of ventilation but also the regional ventilation/perfusion ratio could be determined non-invasively and continuously at the bedside.
In the research setup, early EIT devices have also been used with promising results to assess the amount of extravascular lung water [72], thus providing means to monitor lung edema. The latest experiments in this field [96, 97] utilised impedance spectroscopy where – in contrast to EIT – the frequency of the applied alternating current varies over a broad band. The generation of spectral information allows a classification or separation of different tissue types, a method which is also utilised by conventional body composition monitors.
In conclusion, even after 30 years of research and development, the field of EIT remains dynamic and vibrant, stimulating clinicians, researchers and developers in their quest for further enhancement and new applications. The market introduction of PulmoVista 500 is clearly a significant milestone
106|107

1 Gattinoni L, Pesenti A, Bombino M, Baglioni S, Rivolta M, Rossi F, Rossi G, Fumagalli R, Marcolin M, Mascheroni D, Torresin A. Relationships between lung computed tomographic density, gas exchange, and PEEP in Acute Respiratory Failure. Anesthesiology 1988; 69: 824-832
2 Slutsky AS, Tremblay LN. Multiple system organ failure. Is mechanical ventilation a contributing factor? Am J Respir Crit Care Med 1998; 157: 1721-1725
3 Simon BA, Easley RB, Grigoryev DN et al. Microarray analysis of regional cellular responses to local mechanical stress in acute lung injury. Am J Physiol Lung Cell Mol Physiol 2006; 291: L851-L86
4 Ranieri VM, Suter PM, Tortorella C, et al. Effect of mechanical venti-lation on inflammatory mediators in patients with acute respiratory distress syndrome – A randomized controlled trial. JAMA 1999; 282: 54-61
5 Gentile MA, Cheifetz IM. Optimal positive end-expiratory pressure: The search for the Holy Grail continues. Crit Care Med 2004; 32: 2553-2554
6 Markhorst D, Kneyber M, van Heerde M. The quest for optimal positive endexpiratory pressure continues. Crit Care 2008; 12: 408
7 Crotti S, Mascheroni D, Caironi P et al. Recruitment and derecruitment during acute respiratory failure: a clinical study. Am J Respir Crit Care Med 2001; 164: 131-140
8 Pelosi P, Goldner M, McKibben A et al. Recruitment and derecruitment during acute respiratory failure: an experimental study. Am J Respir Crit Care Med 2001; 164: 122-130
ELECTRICAL IMPEDANCE TOMOGRAPHY | APPENDIX I
Appendix I: Literature references
108|

9 Kunst PW, Vazquez de Anda G, Bohm SH, Faes TJ, Lachmann B, Postmus PE, de Vries PM. Monitoring of recruitment and derecruitment by electrical impedance tomography in a model of acute lung injury. Crit Care Med 2000; 28: 3891-3895.
10 Kunst PW, Bohm SH, Vazquez de Anda G, Amato MB, Lachmann B, Postmus PE, de Vries PM. Regional pressure volume curves by electrical impedance tomography in a model of acute lung injury. Crit Care Med 2000; 28: 178-183
11 Genderingen HR, Vught AJ, Jamsen JRC. Estimation of regional volume changes by electrical impedance tomography during a pressure-volume maneuver. Intensive Care Med 2003; 29: 233-240
12 Holder DS. Clinical and physiological applications of Electrical Impedance Tomography. UCL Press 1993; ISBN 1-85728-164-0 HB
13 Holder DS. Electrical Impedance Tomography Methods, History and Applications. IOP 2005; ISBN 0 7503 0952 0
14 Arnold JH. Electrical impedance tomography: On the path to the Holy Grail. Crit Care Med 2004; 32: 894-895
15 Hinz J, Hahn G, Quintel M. Elektrische Impedanztomographie – Reif für die klinische Routine bei beatmeten Patienten? Anaesthesist 2008; 57: 61-69
16 Barber DC, Brown BH. Recent developments in applied potential tomography-APT. In: Proceedings of 9th Conference on Information Processing in Medical Imaging. Ed. S.L. Bacharach, Martinus Nijhoff, Dordrecht 1986; pp. 106-121
108|109

ELECTRICAL IMPEDANCE TOMOGRAPHY | APPENDIX I 110|
17 Yorkey TJ, Webster JG, Tompkins WJ. Comparing Reconstruction Algorithms for Electrical Impedance Tomography. IEEE Trans. On Biomedical Engineering 1987; vol 34, no. 11, pp. 843-852
18 Faes TJ, Meij HA van der, Munck JC de, Heethaar RM. The electric resistivity of human tissues (100 Hz–10 MHz): a meta-analysis of review studies. Physiol Meas 1999; 20: R1-10
19 Barber DC. A review of image reconstruction techniques for electrical impedance tomography. Med Phys 1989; 16 (2): 162-169
20 Eyuboglu BM, Brown BH. Methods of cardiac gating applied potential tomography. Clin Phys Physiol Meas 1988; 9 (Suppl A): 43–48
21 Bikker IG et al. Lung volume calculated from electrical impedance tomography in ICU patients at different PEEP levels. Intensive Care Med. 2009 Aug; 35(8): 1362-7. Epub 2009 Jun 10
22 Hinz et al. End-expiratory lung impedance change enables bedside monitoring of end-expiratory lung volume change. Intensive Care Med 2003; 29:37–43
23 Odenstedt H, Lindgren S, Olegard C, Erlandsson K, Lethvall S, Aneman A, Stenqvist O, Lundin S. Slow moderate pressure recruitment maneuver minimizes negative cir cu la tory and lung mech anic side effects: evaluation of recruitment maneuvers using electric im pe dance tomo graphy. Intensive Care Med 2005; 31: 1706-1714.
24 Bikker IG, Leonhardt S, Miranda DR, Bakker J, Gommers D. Bedside measurement of changes in lung impedance to monitor alveolar ventilation in dependent and non-dependent parts by electrical impedance tomography during a positive end-expiratory pressure trial in mechanically ventilated intensive care unit patients. Critical Care 2010; 14: R100 1-9

25 Luepschen H, Meier T, Grossherr M, Leibecke T, Karsten J, Leonhardt S. Protective ven ti la tion using electrical impedance tomography. Physiol Meas 2007; 28: S247-S260.
26 Hickling KG. Reinterpreting the pressure-volume curve in patients with acute respiratory distress syndrome. Current Opinion in Critical Care 2002; Vol 8-1, 32-38
27 Reske AW. Analysis of the nonaerated lung volume in combinations of single computed tomography slices – is extrapolation to the entire lung feasible? Critical Care Volume 11 Suppl 2, 27th International Symposium on Intensive Care and Emergency Medicine 2007; P206, p.85
28 Hahn G. et al. Imaging pathologic pulmonary air and fluid accumulation by functional and absolute EIT. Physiol. Meas. 2006; 27 1-12
29 Leonhardt S, Lachmann B. Electrical impedance tomography: the holy grail of ven ti la tion and perfusion monitoring? Intensive Care Med. 2012 Dec; 38(12):1917-29. doi: 10.1007/ s00134-012-2684-z.
30 Adler A, Amyot R, Guardo R, Bates JH, Berthiaume Y. Monitoring changes in lung air and liquid volumes with electrical impedance tomography. J Appl Physiol 1997; 83:1762–1767.
31 Meier T, Leibecke T, Eckmann C, Gosch UW, Grossherr M, Bruch HP, Gehring H, Leon hardt S. Electrical impedance tomography: changes in distribution of pulmonary ven tilation during laparoscopic surgery in a porcine model. Langenbecks Arch Surg 2006; 391:383–389.
32 Luepschen H et al. Clinical applications of thoracic electrical impedance tomography. 6th Conference on Biomedical Applications of Electrical Impedance Tomography. London, June 22-24, 2005.
110|111

33 Hinz J, Neumann P, Dudykevych T, Andersson LG, Wrigge H, Burchardi H, Hedenstierna G. Regional Ventilation by Electrical Impedance Tomography: A Comparison With Ventilation Scintigraphy in Pigs. Chest 2003; 124:314-32.
34 Frerichs I, Hinz J, Herrmann P, Weisser G, Hahn G, Dudykevych T, Quintel M, Hellige G. Detection of local lung air content by electrical impedance tomography compared with electron beam CT. J Appl Physiol 2002; 93:660-666.
35 Frerichs I, Schmitz G, Pulletz S, Schadler D, Zick G, Scholz J, Weiler N. Reproducibility of regional lung ventilation distribution determined by electrical impedance tomography during mechanical ventilation. Physiol Meas 2007; 28:S261-267.
36 Van Genderingen HR, Vught AJ, Jamsen JRC. Estimation of regional volume changes by electrical impedance tomography during a pressu-re-volume maneuver. Intensive Care Med 2003; 29:233-240.
37 Meier T, Luepschen H, Karsten J, Leibecke T, Grossherr M, Gehring H, Leonhardt S. Assess ment of regional lung recruitment and derecru-itment during a PEEP trial based on electrical im pedance tomography. Intensive Care Med 2008; 34: 543-550.
38 Hinz J, Hahn G, Neumann P, Sydow M, Mohrenweiser P, Hellige G, Burchardi H. End-expiratory lung impedance change enables bedside monitoring of end-expiratory lung volume change. Intensive Care Med 2003; 29:37–43
39 Marquis F, Coulombe N, Costa R, Gagnon H, Guardo R, Skrobik Y. Electrical impe dance tomography’s correlation to lung volume is not influenced by anthropometric para meters. J Clin Monit Comput 2006; 20:201–207.
ELECTRICAL IMPEDANCE TOMOGRAPHY | APPENDIX I 112|

40 Victorino JA, Borges JB, Okamoto VN, Matos GF, Tucci MR, Caramez MP, Tanaka H, Sipmann FS, Santos DC, Barbas CS, Carvalho CR, Amato MB. Imbalances in regional lung ventilation: a validation study on electrical impedance tomography. Am J Respir Crit Care Med 2004; 169: 791-800
41 Riedel T, Richards T, Schibler A. The value of electrical impedance tomography in assessing the effect of body position and positive airway pressures on regional lung ventilation in spon tan eous breathing subjects. Intensive Care Med 2005; 31: 1522-1528
42 Bikker IG, Leonhardt S, Bakker J, Gommers D. Lung volume calculated from elec tri cal impedance tomography in ICU patients at different PEEP levels. Intensive Care Med 2009; 35:1362–1367. DOI 10.1007/ s00134-009-1512-6.
43 Karsten J, Meier T, Iblher P, Schindler A, Paarmann H, Heinze H. The suitability of EIT to estimate EELV in a clinical trial compared to oxygen wash-in/wash-out technique. Biomed Tech (Berl). 2014; 59(1): 59-64. doi: 10.1515/bmt-2012-0076
44 Brenner D, Elliston C, Hall E, Berdon W. Estimated risks of radiation-induced fatal cancer from pediatric CT. AJR Am J Roentgenol 2001; 176: 289-296.
45 Brenner DJ, Hall EJ. Computed tomography – an increasing source of radiation exposure. N Engl J Med 2007; 357: 2277-2284.
46 Wrigge H. et al. Electrical impedance tomography compared with thoracic computed tomo graphy during a slow inflation maneuver in experimental models of lung injury. Crit Care Med 2008; 36(3): 1-7.
112|113

47 Erlandson K et al. Positive end-expiratory pressure optimization using electric impedance tomo graphy in morbidly obese patients during laparoscopic gastric bypass surgery. Acta An aes thesiol Scand 2006; 50: 833-839.
48 Hinz J, Gehoff A, Moerer O, Frerichs I, Hahn G, Hellige G, Quintel M. Regional filling charac teristics of the lungs in mechanically ventilated patients with acute lung injury. Eur J Anaesthesiol 2007; 24: 414-424.
49 Mauri T, Bellani G, Confalonieri A, Tagliabue T, Turella M, Coppadoro A, Citerio G, Pa troniti N, Pesenti A. Topographic Distribution of Tidal Ventilation in Acute Res pi ra tory Distress Syndrome: Effects of Positive End-Expiratory Pressure and Pressure Support. Critical Care Med 2013; 41(7). DOI: 10.1097/CCM.0b013e318287 f6e7.
50 Karsten J, Luepschen H, Grossherr M, Bruch HP, Leonhardt S, Gehring H, Meier T. Effect of PEEP on regional ventilation during laparoscopic surgery monitored by elec tri cal impedance tomography. Acta Anaesthesiol Scand 2011; 55:878 – 86.
51 Gattinoni L, Caironi P, Cressoni M, Chiumello D, Ranieri VM, Quintel M, Russo S, Patroniti N, Cornejo R, Bugedo G. Lung recruitment in patients with the acute respiratory distress syndrome. N Engl J Med 2006; 354: 1775–86.
52 Lowhagen K, Lindgren S, Odenstedt H, Stenqvist O, Lundin S. A new non-radiological method to assess potential lung recruitability: a pilot study in ALI patients. Acta Anaesthesiol Scand 2011; 55: 165–174.
53 Frerichs I. et al. Topographic distribution of lung ventilation in artificially ventilated babies. In: Heart and Lung Assistance (Lecture Notes of the ICB Seminars), Eds. Z. Religa, Z. Rondio, G. Ferrari, M. Darowski; International Centre of Biocybernetics, Warsaw, 2000; 115-121.
ELECTRICAL IMPEDANCE TOMOGRAPHY | APPENDIX I 114|

54 Putensen C. Electrical impedance tomography guided ventilation therapy. Current Opinion in Critical Care 2007; 13: 344-350.
55 Lindgren S, Odenstedt H, Olegård C, Söndergaard S, Lundin S, Stenqvist O. Regional lung derecruitment after endotracheal suction during volume- or pressure-controlled ventilation: a study using electric impedance tomography. Intensive Care Med 2007; 33: 172-180.
56 Lindgren S, Odenstedt H, Erlandsson K, Grivans C, Lundin S, Stenqvist O. Bronchoscopic suctioning may cause lung collapse: a lung model and clinical evaluation. Acta Anaesthesiol Scand. 2008; 52: 209-218.
57 van Veenendaal MB, Miedema M, de Jongh FHC, van der Lee JH, Frerichs I, van Kaam AH. Effect of closed endotracheal suction in high-frequency ventilated pre ma ture infants measured with electrical impedance tomography. Intensive Care Med 2009; 35:2130–2134.
58 Tingay DG, Copnell B, Grant CA, Dargaville PA, Dunster KR, Schibler A. The effect of endotracheal suction on regional tidal ventilation and end-ex-piratory lung volume. Intensive Care Med 2010; 36:888–896.
59 Corley A, Spooner AJ, Barnett AG, Caruana LR, Hammond NE, Fraser JF. End-ex pi ra tory lung volume recovers more slowly after closed endot-racheal suctioning than af ter open suctioning: a randomized crossover study. J Crit Care 2012 Dec; 27(6): 742.e1-7.
60 Alsaghir AH, Martin CM. Effect of prone positioning in patients with acute respiratory distress syndrome: a meta-analysis. Crit Care Med 2008; 36: 603-609.
114|115

ELECTRICAL IMPEDANCE TOMOGRAPHY | APPENDIX I
61 Sud S, Sud M, Friedrich JO, Adhikari NK. Effect of mechanical venti-lation in the prone po si tion on clinical outcomes in patients with acute hypoxemic respiratory failure: a systematic re view and meta-analysis. CMAJ 2008; 178: 1153-1161.
62 Heinrich S, Schiffmann H, Frerichs A, Klockgether-Radke A, Frerichs I. Body and head posi tion effects on regional lung ventilation in infants: An electrical impedance tomography study. In tensive Care Med 2006; 32: 1392-1398.
63 Bein T, Ploner F, Ritzka M, Pfeifer M, Schlitt HJ, Graf BM. No change in the regional dis tri bution of tidal volume during lateral posture in mechanically ventilated patients assessed by electrical impedance tomography. Clin Physiol Funct Imaging 2010; 30(4): 234-240.
64 Steinmann D. Electrical impedance tomography to confirm correct placement of double-lumen tube: a feasibility study. British Journal of Anaesthesia 2008; 101(3): 411-418.
65 Steinmann D, Engehausen M, Stiller B, Guttmann J. Electrical impedance tomo graphy for verification of correct endotracheal tube placement in paediatric patients: a fea sibility study. Acta Anaesthesiol Scand. 2013 Aug; 57(7):881-7.
66 de Lassence A, Timsit JF, Tafflet M, Azoulay E, Jamali S, Vincent F, Cohen Y, Garrouste-Orgeas, M, Alberti C, Dreyfuss D. Pneumothorax in the Intensive Care Unit. Anesthesiology 2006; 104:5–13.
67 Hahn G, Just A, Dudykevych T, Frerichs I, Hinz J, Quintel M, Hellige G. Imaging pa tho logic pulmonary air and fluid accumulation by functional and absolute EIT. Physiol. Meas 2006; 27:S187–S198. doi:10.1088/ 0967-3334/27/5/S16
116|

68 Costa EL, Chaves CN, Gomes S, Beraldo MA, Volpe MS, Tucci MR, Schettino IA, Bohm SH, Carvalho CR, Tanaka H, Lima RG, Amato MB. Real-time detection of pneu mothorax using electrical impedance tomography. Crit Care Med 2008; 36:1230–1238.
69 Preis C, Luepschen H, Leonhardt S, Gommers D. Experimental case report: develop ment of a pneumothorax monitored by electrical impedance tomography. Clin Physiol Funct Imaging 2009 29:159–162.
70 Miedema M, Frerichs I, de Jongh FHC, van Veenendaal MB, van Kaam AH. Pneumo tho rax in a Preterm Infant Monitored by Electrical Impedance Tomography: A Case Re port. Neonatology 2011; 99:10–13.
71 Bhatia R, Schmoelzer GM, Davis PG, Tingay DG. Electrical impedance tomography can rapidly detect small pneumothoraces in surfactant-de-pleted piglets. Intensive Care Med 2012; 38:308–315.
72 Kunst PW, Vonk Noordegraaf A, Raaijmakers E, Bakker J, Groeneveld AB, Postmus PE, de Vries PM. Electrical impedance tomography in the assessment of extra vas cular lung water in noncardiogenic acute respiratory failure. CHEST 1999; 116:1695–1702.
73 Arad M, Zlochiver S, Davidson T, Shoenfeld Y, Adunsky A, Abboud S. The detection of pleural effusion using a parametric EIT technique. Physiol Meas 2009; 30:421–428.
74 Frerichs I, Hahn G, Golisch W, Kurpitz M, Burchardi H, Hellige G. Monitoring peri oper a tive changes in distribution of pulmonary ventilation by functional electrical im pe dance tomography. Acta Anaesthesiol Scand 1998; 42:721–726.
116|117

118|ELECTRICAL IMPEDANCE TOMOGRAPHY | APPENDIX I
75 Radke OC, Schneider T, Heller AR, Koch T. Spontaneous Breathing During General An esthesia Prevents the Ventral Redistribution of Ventilation as Detected by Elec tri cal Impedance Tomography – A Randomized Trial. Anesthesiology. 2012 Jun; 116(6):1227-34. doi: 10.1097/ALN.0b013e318256ee08.
76 Luepschen H, Meier T, Muders T, Konowalczyk S, Leonhardt S, Putensen C. In di vi dual ized, Automated Lung Recruitment Using Electrical Impedance Tomo graphy In A Por cine ARDS Mode. 2011 American Thoracic Society (ATS) Inter na tional Con ference, May 13-18, 2011 / Denver, Colorado. Abstract 19952
77 Zhao Z, Moller K, Steinmann D, Frerichs I, Guttmann J. Evaluation of an elec tri cal impedance tomography-based global inhomogeneity index for pulmonary ven ti lation distribution. Intensive Care Med 2009; 35:1900–1906.
78 Zhao Z, Steinmann D, Frerichs I, Guttmann J, Moller K. PEEP titration guided by ven ti lation homogeneity: a feasibility study using electrical impedance tomography. Crit Care 2010; 14:R8.
79 Muders T, Luepschen H, Putensen C. Regional Ventilation Delay Index: Detection of Tidal Re cruitment using Electrical Impedance Tomography. Yearbook of Intensive Care and Emergency Care 2009; 405-412.
80 Costa EL, Borges JB, Melo A, Suarez-Sipmann F, Toufen C Jr, Bohm SH, Amato MB. Bed side estimation of recruitable alveolar collapse and hyper-distension by electrical im pedance tomography. Intensive Care Med 2009; 35:1132–1137
119
81 Lowhagen K, Lundin S, Stenqvist O. Regional intratidal gas distribution in acute lung injury and acute respiratory distress syndrome – assessed by electric impedance tomography. Minerva Anestesiol. 2010 Dec; 76(12):1024-35.
82 Gomez-Laberge C, Arnold JH, Wolf GK. A unified approach for EIT imaging of re gional overdistension and atelectasis in acute lung injury. IEEE Trans Med Imaging 2012; 31:834–842
83 Bikker IG, Preis C, Egal M, Bakker J, Gommers D. Electrical impedance tomography measured at two thoracic levels can visualize the ventilation distribution changes at the bedside during a decremental positive end-expiratory lung pressure trial. Critical Care 2011, 15:R193.
84 Zhao Z, Fischer R, Frerichs I, Müller-Lissed U, Möller K. Regional ventilation in cystic fibrosis measured by electrical impedance tomography. Journal of Cystic Fibrosis, September 2012; 11(5): 412–418.
85 Pikkemaat R, Tenbrock K, Lehmann S, Leonhardt S. Electrical impedance tomo graphy: New diagnostic possibilities using regional time constant maps. Applied Car dio pulmonary Pathophysiology 2012; 16:212-225.
86 Adler A, Amato MB, Arnold JH, Bayford R, Bodenstein M, Böhm SH, Brown BH, Frerichs I, Stenqvist O, Weiler N, Wolf GK. Whither lung EIT: Where are we, where do we want to go and what do we need to get there? Physiol. Meas. 2012; 33:679–694.
87 Wolf GK, Gómez-Laberge C, Rettig JS, Vargas SO, Smallwood CD, Prabhu SP, Vitali SH, Zurakowski D, Arnold JH. Mechanical ventilation guided by electrical impedance tomography in experimental acute lung injury. Crit Care Med. 2013; May; 41(5):1296-304.
118|

120|ELECTRICAL IMPEDANCE TOMOGRAPHY | APPENDIX I
88 Bikker IG, Blankman P, Specht P, Bakker J, Gommers D. Global and regional parameters to visualize the ‚best‘ PEEP during a PEEP trial in a porcine model with and without acute lung injury. Minerva Anestesiol. 2013 Sep; 79(9):983-92.
89 Dargaville PA, Rimensberger PC, Frerichs I. Regional tidal ventilation and compliance during a stepwise vital capacity manoeuvre. Intensive Care Med. 2010 Nov; 36(11):1953-61.
90 Camporota L, Smith J, Barrett N, Beale R. Assessment of regional lung mechanics with electrical impedance tomography can determine the requirement for ECMO in patients with severe ARDS. Intensive Care Med. 2012 Dec; 38(12):2086-7.
91 Pierre AF. Pneumonectomy: historical perspective and prospective insight. Eur J Cardiothorac Surg 2003; 23:439-445
92 Löwhagen K, Lundin S, Stenqvist O. Regional intratidal gas distribution in acute lung injury and acute respiratory distress syndrome. Minerva Anestesiol 2010; 76 (12): 1024-1035
93 Fagerberg A, Stenqvist O, Åneman A. Monitoring pulmonary perfusion by electrical impedance tomography: an evaluation in a pig model. Acta Anaesthesiol Scand 2009; 53: 152-158
94 Smit HJ et al. Electrical impedance tomography to measure pulmonary perfusion: is the reproducibility high enough for clinical practice? Physiol. Meas. 2003; 24: 491-499
95 Deibele JM, Lüpschen H, Leonhardt S. Dynamic separation of pulmonary and cardiac changes in electrical impedance tomography. Physiol. Meas. 2008; 29: S1–S14

121
96 Mayer M, Brunner P, Merwa R, et al. Direct reconstruction of tissue parameters from differential multi-frequency EIT in vivo. Physiol Meas 2006; 27: S93–S101
97 Beckmann L, Cordes A, Saygili E, Schmeink A, Schauerte P, Walter M, Leonhardt S. Monitoring of body fluid in patients with chronic heart failure using Bioimpedance-Spectroscopy. World Congress on Medical Physics and Biomedical Engineering 2009; Munich; Sep. 7-12
98 Bodenstein M, David M, Markstaller K. Principles of electrical impedance tomography and its clinical application. Crit Care Med 2009; Vol. 37, No. 2, p. 1-12
99 Geddes LA, Baker LE. The specific resistance of biological material – a compendium of data for the biomedical engineer and physiologist. Med Biol Eng 1967; 5: 271–293
100 Heyward VH. Practical body composition assessment for children, adults, and older adults. Int J Sport Nutr 1998; 8: 285–307
101 Nopp P, Rapp E, Pfützner H, Nakesch H, Ruhsam Ch. Dielectric properties of lung tissue as a function of air content. Phys. Med. Biol. 38 1993; p. 699-716
102 Nopp P, Harris ND, Zhao TX, Brown BH. Model for the dielectric properties of human lung tissue against frequency and air content. Med. & Biol. Engin. & Computing 1997; p 695-702
103 Bernard GR, Artigas A, Brigham KL, Carlet J, Falke K, Hudson L, Lamy M, Legall JR, Morris A, Spragg R. The American-European Consensus Conference on ARDS. Definitions, mechanisms, relevant outcomes, and clinical trial coordination. Am J Respir Crit Care Med. 1994 Mar; 149(3 Pt 1):818-24.
120|

122|ELECTRICAL IMPEDANCE TOMOGRAPHY | APPENDIX I
104 Ferguson ND, Fan E, Camporota L, Antonelli M, Anzueto A, Beale R, Brochard L, Brower R, Esteban A, Gattinoni L, Rhodes A, Slutsky AS, Vincent J-L, Rubenfeld GD, Thompson BJ. The Berlin definition of ARDS: an expanded rationale, justification, and supplementary material. Intensive Care Med (2012) 38:1573–1582

123
Before the term bioimpedance can be fully understood, a basic understanding of electrical impedance is necessary.
DEFINITION OF ELECTRICAL IMPEDANCE
Electrical impedance, or simply impedance, describes a measure of opposition of a material to a sinusoidal alternating current (AC).
Electrical impedance extends the concept of resistance R described by Ohm’s law (V=I*R) to AC circuits. Impedance describes not only the relative amplitudes of the voltage V and current I, but also their relative phases.
As both capacitors and inductors cause either negative or positive phase shifts between voltage and current, the term impedance is generally applied when electrical AC circuits contain capacitive and/or inductive elements.
HOW TO EXPRESS IMPEDANCE
Mathematically, electrical impedance Z~ describes a complex number: it consists of a real and an imaginary component. Dimensionally, impedance is the same as resistance; the SI unit is the Ohm (Ω) for both entities.
There are two ways to express impedance mathematically:
Polar Form:
The polar form conveniently captures both magnitude and phase characteristics, where the magnitude Z represents the ratio of the amplitude of the voltage difference to the current amplitude, while the argument θ gives the phase difference between voltage and current and j is the imaginary unit.
Appendix II: Determining the biological impedance of the lung
122|

ELECTRICAL IMPEDANCE TOMOGRAPHY | APPENDIX II
Cartesian Form:
In the Cartesian representation, the real part of impedance is the resistance R and the imaginary component is the reactance Χ.In the literature, the graph displayed in fig. 58 is often used to illustrate the relationship between resistance R, reactance Χ and impedance Z~.
The impedance of an ideal resistor is purely real and is referred to as a resistive impedance
Ideal inductors L and capacitors C have a purely imaginary reactive impedance.
The term ω equals 2πf. This means that the impedance of an inductor and a capacitor, and thus the electrical behaviour of inductive or capacitive AC circuits, is a function of the frequency of the applied alternating current. Thus, the impedance expresses the effects of those AC circuits or materials on phase shifts between voltage and current.
R
X
Im
Re
Fig. 58: Relationship between R, reactance Χ and impedance Z~
D-7
7-20
11
124|

Time
0 1 2 3 4 5 6 7 8 9
–1
–0.5
0
0.5
1
Time
0 1 2 3 4 5 6 7 8 9
–1
–0.5
0
0.5
1
Time
0 1 2 3 4 5 6 7 8 9
–1
–0.5
0
0.5
1 Voltage
Current
Inductor V – I Phase Relationship
Ideal Resistor V - I Phase Relationship
Capacitor V – I Phase Relationship
Fig. 59: V-I phase relationships of resistors, inductors and capacitors
D-3
437-
2011
124|125
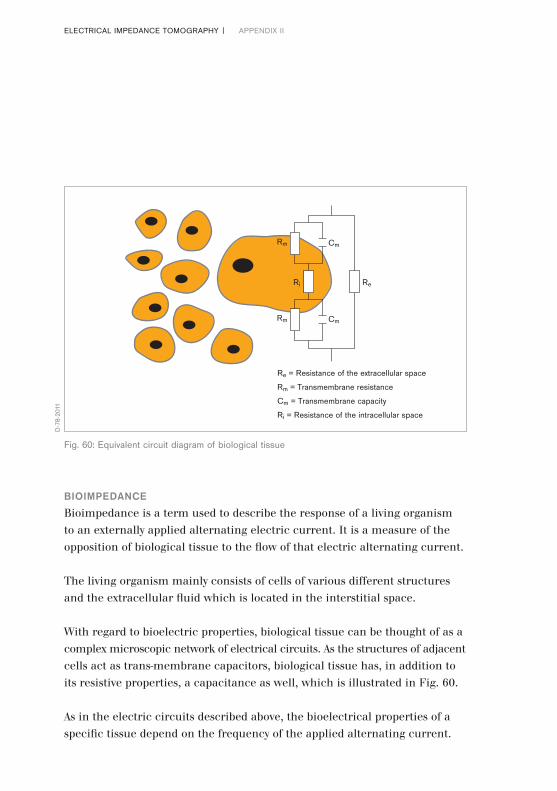
ELECTRICAL IMPEDANCE TOMOGRAPHY | APPENDIX II
BIOIMPEDANCE
Bioimpedance is a term used to describe the response of a living organism to an externally applied alternating electric current. It is a measure of the opposition of biological tissue to the flow of that electric alternating current.
The living organism mainly consists of cells of various different structures and the extracellular fluid which is located in the interstitial space.
With regard to bioelectric properties, biological tissue can be thought of as a complex microscopic network of electrical circuits. As the structures of adjacent cells act as trans-membrane capacitors, biological tissue has, in addition to its resistive properties, a capacitance as well, which is illustrated in Fig. 60.
As in the electric circuits described above, the bioelectrical properties of a specific tissue depend on the frequency of the applied alternating current.
Re = Resistance of the extracellular space
Rm = Transmembrane resistance
Cm = Transmembrane capacity
Ri = Resistance of the intracellular space
Cm
Cm
ReRi
Rm
Rm
Fig. 60: Equivalent circuit diagram of biological tissue
D-7
8-20
11
126|

The transition from a microscopic to a macroscopic view leads to a simplified electrical circuit (Fig. 61), where the specific tissue impedance is simulated by a parallel connection of a capacitor C and a resistor R0 – R00.
It can be mathematically expressed with the following formula:
While the capacity depends on characteristics of the biomembranes of a specific tissue (ion channels, fatty acids, gap junctions, etc.), its resistance mainly depends on characteristics of the extracellular fluid (e.g., composition and amount).
Consequently, it is the specific composition (e.g., lipids, water, electrolytes in the extracellular fluid) of biological tissue which leads to distinct impedance characteristics.
R00
R0 – R00 C
Fig. 61: Simplified equivalent circuit diagram of biological tissue
R00 = Skin resistance
R0–00 = Specific tissue resistance
C = Specific tissue capacity
D-7
9-20
11
126|127

ELECTRICAL IMPEDANCE TOMOGRAPHY | APPENDIX II
Increased extra-cellular water content, high concentration of electrolytes, large cells, and a high number of cell connections via gap junctions reduce impedance (e.g., in blood and muscle). In contrast, fat accumulation, bone, and air act as electrical resistors and thus increase regional impedance. Regional impedance can be predicted by tissue resistivity (Table 1) [98].
Although in vivo measurements of electrical properties of specific biological tissues are not easily obtained and depend heavily on the experimental setup, impedance values for specific types of biological tissue can be found in the literature [15, 99, 100].
When bioimpedance measurements are performed to assess the lung function, the deviations between end-inspiratory and end-expiratory electrical properties are of particular interest. It is misleading to explain the increased end-inspiratory impedance by the fact that air as such is a poor electric conductor. In contrast to X-rays, the pathways of electrical current never pass through the air inside the bronchi, alveoli or pathological structures such as emphysema bulla or a pneumothorax.
The explanation for the concomitant increase of bioimpedance with increasing pulmonary air content was delivered by Nopp et al. [101, 102]:
Tissue Impedance/Resistivity
Blood 150Ω*cm
Lung expiration 700Ω*cm
inspiration 2400Ω*cm
Fat 2000–2700Ω*cm
Bones 16600Ω*cm
Muscle longitudinal 125Ω*cm
transversal 1800Ω*cm
HeartMuscle longitudinal 160–575Ω*cm
transversal 420–5200Ω*cm
128|

With increasing air content, the cellular structures of the lung parenchyma are stretched, increasing the length of the pathways while the diameter of the conducting cellular structure decreases.
According to the formula Z = L/S, where L is the length and S the section of a conductor, the impedance increases during inflation as the conductive cellular structures are stretched.
The electric current only passes through either intracellular or extracellular structures, depending on the frequency applied (Fig. 62).
At frequencies below 5 kHz, electrical current does not permeate into the cells and thus flows only through extracellular fluid. The tissue therefore shows mainly resistive characteristics.
Fig. 62: Pathways of electrical current at different frequencies
No deflexion at the membrane
100 KHz
50 KHz
5 KHz
Slight deflexion at the membrane
No permeation into the cells
D-8
0-20
11
128|129

ELECTRICAL IMPEDANCE TOMOGRAPHY | APPENDIX II
The capacitive behaviour increases with increasing frequencies and reaches its maximum at about 50 kHz. Electrical currents are slightly deflected at the cell membranes.
At higher frequencies (> 100 kHz), the electrical current is directly passing the cell membranes, resulting in a decrease in the capacitive behaviour. As early as 1949, Kenneth S. Cole und Robert H. Cole described a model which explains this tissue specific impedance behaviour (Fig. 63).
Fig. 63: Cole-Cole plot
Low frequency High frequencyResistance
Impedance
Rea
ctan
ce
α
D-8
1-20
11
130|
BIOIMPEDANCE MEASUREMENTS WITH PULMOVISTA 500
PulmoVista 500 utilises alternating currents with a range of 80 – 130 kHz. It generally applies the current at a single frequency, which is automatically adjusted if a high level of electromagnetic background noise of a certain frequency would result in compromised data acquisition.
In contrast to bioelectrical impedance analysers (BIA), which utilise the frequency dependent responses of the tissue to determine body composition, PulmoVista 500 requires only a single frequency to determine ventilation or cardiac related impedance changes.
PulmoVista 500 is processing the absolute magnitude of impedance; however the information on the phase difference between voltage and current is not used for signal processing.
Within the frequency range of 80 – 130 kHz, the selection of the operating frequency does not have a substantial impact on the results of the measurements or the displayed information.
For many years, patient monitors have used bioimpedance measurements to monitor respiratory function. Like with PulmoVista 500, these patient monitors also make use of the fact that trans-thoracic impedance, which in this case is measured using ECG electrodes, increases in proportion to the intra-thoracic air content, which in turn is linked to the respiratory efforts of the patient.
130|131

ELECTRICAL IMPEDANCE TOMOGRAPHY | APPENDIX II
CARDIAC RELATED IMPEDANCE CHANGES
The thoracic impedance changes related to cardiac activity are of the same interest as those brought about by ventilation. Typically, ventilation related impedance changes of the entire EIT sensitivity region are about 10 times higher than cardiac related impedance changes. However, it has to be taken into account that this ratio depends very strongly on the position of the electrodes relative to the heart, the lung water content, tidal volumes, stroke volumes and the end-expiratory lung volume, the latter suggesting that PEEP settings also will affect this ratio.
The underlying mechanisms of these cardiac related impedance changes are not completely understood.
The best explanation developed so far may be that, due to the contraction of the heart muscle during systole, low conductive lung tissue replaces high conductive heart volume. Simultaneously, lung tissue is displaced by the stroke volume distributed into the pulmonary circuit. Thus, the decrease in regional bioimpedance induced by perfusion would be a spatial dislocation effect of lung tissue caused by the expansion of major vessels and increased blood perfusion [98].
As typical tidal volumes in adults are about 500 to 600 ml and corresponding stroke volumes 70 ml, a rough correlation to the aforementioned 10:1 ratio of ventilation to cardiac related impedance changes is suggested, and actually can often be found in EIT data.
It requires further fundamental research and validation studies before information on cardiac activity or even lung perfusion derived from EIT data can be used for clinical decision making.
132|

TERM ABBREVIATION EXPLANATION
Acute Lung ALI A severe, heterogeneous lung disease Injury caused by a variety of direct and indirect
issues. It is characterised by inflammation of the lung parenchyma leading to impaired gas exchange, non-cardiogenic pulmonary edema, low lung compliance with concomitant systemic release of inflammatory mediators causing inflammation, hypoxemia and frequently resulting in multiple organ failure. Acute Lung Injury is defined as [103]: – Bilateral pulmonary infiltrates on chest x-ray
– Pulmonary Capillary Wedge Pressure < 18 mmHg (2.4 kPa)
– PaO2/FiO2 <300
Acute ARDS A more severe form of ALI. Respiratory For many years, acute Respiratory Distress Distress Syndrome was defined as [103]: Syndrome – Bilateral pulmonary infiltrates on chest
x-ray – Pulmonary Capillary Wedge Pressure < 18 mmHg (2.4 kPa) – PaO2/FiO2 <200
Recently this definition has been reviewed and redefined by a consensus panel [104]:
Appendix III: Glossary
132|133
ELECTRICAL IMPEDANCE TOMOGRAPHY | APPENDIX III
Acute ARF Inadequate gas exchange by the Respiratory respiratory system, with the result that Failure arterial oxygen and/or carbon dioxide
levels cannot be maintained within their normal ranges.
Aeration Amount of gas contained within the lung at a certain moment of time.
Alternating AC A current, in which the movement of Current electric charge periodically reverses
direction. The usual waveform of an AC is a sine wave.
Alveolar Alveolar recruitment describes the Recruitment process of expanding collapsed parts
of the lung over the entire ventilation cycle. It is one of the primary goals of respiratory care for acute lung injury. It is aimed at improving pulmonary gas exchange and, even more important, at protecting the lungs from VILI.
Atelectasis A condition where alveoli are deflated and collapsed; it may be due to a blockage of airways, and/or excessive external pressure on the alveoli.
TERM ABBREVIATION EXPLANATION
134|

Barotrauma The damage to the lung caused by overdistension of alveoli due to excessive trans-pulmonary pressure during mechanical ventilation. Recent clinical data demonstrate that excessive tidal volumes, and not airway pressure, is the causal factor of VALI.
Change of ΔEELI Absolute impedance measurements End-Expiratory cannot directly be related to the end- Lung expiratory lung impedance. However, Impedance ΔEELI closely correlates with changes
of end-expiratory lung volume of the EIT sensitivity region. The parameter ΔEELI as determined by PulmoVista 500 expresses deviations of the regional end-expiratory lung impedance in relation to the global tidal variation.
Chest X-Ray CXR A radiograph (frontal plane) of the chest used to diagnose conditions affecting the chest. Chest radiographs are among the most common films taken, being diagnostic of many conditions.
TERM ABBREVIATION EXPLANATION
134|135
ELECTRICAL IMPEDANCE TOMOGRAPHY | APPENDIX III
Computed CT, CAT A medical imaging method employing Tomography tomography created by computer
processing. CT is one of the most important methods of radiological diagnosis. It delivers non-superimposed, cross-sectional images of the body, which can show smaller contrast differences than conventional X-ray images. For lung imaging, CT images allow to differentiate between ventral and dorsal regions of the lung.
Cyclic Opening Describes alveoli which are collapsed at and Closing the end of expiration and open during
inspiration. This condition can cause VALI. Synonymously used with the term “tidal recruitment”.
Cytokines Cytokines are substances released by cells of the immune system; they act as messengers between cells in the generation of an immune response. Lung cytokines can be released because of inadequate ventilator settings especially in patients with ALI and ARDS. An immune response triggered by cytokine activity may contribute to multiple system organ failure.
TERM ABBREVIATION EXPLANATION
136|

Dependent Area of the lungs, where the weight of the Lung Regions lung (and the heart) above this area
acts as an additional weight, causing superimposed pressure. In supine position, the dependent lung regions are located in the dorsal part of the lung.
Derecruitment Loss of end-expiratory lung volume leading to a lack of gas and respective ventilation within a lung area.
Differential Is designed to display changes between Image two EIT images at different points in time.
As these changes can generally be positive or negative, the zero value (representing no change) is always displayed in the mid-position of the colour scale, which uses – in contrast to the colour scale for Dynamic and Status Images – a turquoise colour for positive and an orange colour for negative changes.
Dorsal D Related to the position of the subject’s spine, in EIT imaging the lower aspect of the image represents the part closest to the subject’s spine. When the EIT image is subdivided into 4 layers, the dorsal part is represented by ROI 4.
TERM ABBREVIATION EXPLANATION
136|137

ELECTRICAL IMPEDANCE TOMOGRAPHY | APPENDIX III
Dynamic Image Continuously displays relative impedance changes induced by ventilation within the EIT sensitivity region as a series of tomograms. The relative impedance changes are referred to the end-expiratory impedance level.
EIT sensitivity region The lens shaped intra-thoracic volume whose impedance changes contribute to the generation of EIT images. This plane is 4 cm thick at the periphery and increases towards the central region.
Electrode plane The plane intersecting the centres of the body surface EIT electrodes. The most common is a transverse or oblique plane around the thorax.
Electron EBCT An experimental, specific form of CT in Beam which the X-ray tube is not mechanically Computed spun in order to rotate the source of X-ray Tomography photons. This different design was
explicitly developed to better image heart structures which never stop moving, performing a complete cycle of movement with each heart beat.
End- EELI End-expiratory lung impedance, which Expiratory- closely correlates with end-expiratory lung Lung volume of the EIT sensitivity region. Thus Impedance ΔEELI represents the change in end-
expiratory lung volume within the EIT sensitivity region.
TERM ABBREVIATION EXPLANATION
138|

End- EELV Sometimes synonymously used with the Expiratory- term FRC. However, mechanically Lung ventilated patients exhale against PEEP Volume rather than ambient pressure, which is
why physicians use the term EELV (End-Expiratory Lung Volume) instead of FRC. EELV (resp. FRC) describes the air volume which can contribute to gas exchange between two breaths. Adequate PEEP settings during mechanical ventilation help to keep alveoli and airways open thus maintaining a sufficient EELV.
Frame A set of 208 voltage measurements taken after one complete rotation of the current injection, which is used to reconstruct one single EIT image.
Frame Rate The frame rate is the frequency expressed as images per second at which Dynamic Images are generated.
Functional fEIT PulmoVista 500 performs functional EIT, EIT meaning that it mainly displays relative
impedance changes as a result of lung function, i.e., ventilation and changing end-expiratory lung volume.
TERM ABBREVIATION EXPLANATION
138|139

ELECTRICAL IMPEDANCE TOMOGRAPHY | APPENDIX III
Functional FRC Physiological parameter, which describes Residual the volume of air present in the lungs at Capacity the end of passive expiration (against
ambient pressure). Global TVglobal The parameter TV global represents the Tidal difference between the minimum value Variation and the maximum value in the Global
impedance waveform for each breath. Regardless of the tidal volume, this figure is always 100%, it solely serves as a reference for the ROI tidal variations.
Hyperinflation See Overdistension.
Impedance Electrical impedance, or simply impedance, describes a measure of opposition to alternating current (AC). Lung tissue during end of inspiration causes more opposition to the current than during end of expiration, and thus the intra-thoracic impedance changes with ventilation.
TERM ABBREVIATION EXPLANATION
140|

Magnetic MRI A medical imaging technique most Resonance commonly used in radiology to visualise Imaging detailed internal structure and function
of the body. MRI provides much greater contrast between the different soft tissues of the body than CT, making it especially useful in neurological, musculoskeletal, cardiovascular, and oncological imaging.
Mid-dorsal MD An EIT imaging specific term, referring to the part of the image that is located above the dorsal aspect. When the EIT image is subdivided into 4 layers, the mid-dorsal part is represented by ROI 3.
Mid-ventral MV An EIT imaging specific term, referring to the part of the image that is located below the ventral aspect. When the EIT image is subdivided into 4 layers, the mid-ventral part is represented by ROI 2.
Minute Image The Minute Image represents regional distribution of impedance changes over the last minute. The Minute Image displays Tidal Images averaged over the last minute.
TERM ABBREVIATION EXPLANATION
140|141

ELECTRICAL IMPEDANCE TOMOGRAPHY | APPENDIX III
Multiple MIGET An experimental technique used mainly Inert Gas in pneumology, that involves measuring Elimination mixed venous, arterial, and mixed expired Technique concentrations of six infused inert gases.
In many cases MIGET yields the crucial information about the physiology of gas exchange, i.e. shunt, dead space, and the general ventilation versus blood flow (Va/Q).
Non-dependent Area of the lungs without superimposed Lung Regions pressure. In supine position, the non-
dependent lung regions are located in the ventral part of the lung.
Overdistension Excessive expansion of the lungs at the end of inspiration, commonly caused by either high tidal volumes or high end-expiratory lung volumes resulting from high PEEP levels. Recent findings suggest that overinflation is the predominant cause of VILI. Often synonymously used with Overinflation, Hyperdistension, and Hyperinflation. In EIT data, the effects of overdistension can only indirectly be seen, as overdistended lung regions have a low compliance and are thus less ventilated. Further studies are required to validate the capability of EIT to directly detect overdistension.
TERM ABBREVIATION EXPLANATION
142|

Overinflation See Overdistension.
Positive End PEEP The pressure during mechanical Expiratory ventilation used to oppose passive Pressure emptying of the lung and to keep the
airway pressure above the atmospheric pressure. PEEP is used to maintain a sufficient end-expiratory lung volume.
Pulmonary The solidification of normally aerated Consolidation lung tissue, that occurs as a result of
accumulation of inflammatory cellular exudate in the alveoli and adjoining ducts. Consolidation may also occur due to the alveolar space filling with water or blood.
Pulmonary Pulmonary shunt describes alveoli that Shunt are perfused but not ventilated, e.g. due to
collapse or consolidation.
TERM ABBREVIATION EXPLANATION
142|143

ELECTRICAL IMPEDANCE TOMOGRAPHY | APPENDIX III
Recruitment RM A procedure, usually performed with a Manoeuvre mechanical ventilator, aimed at
expanding collapsed lung tissue. In order to recruit collapsed lung tissue, sufficiently high peak pressures and PEEP levels must be temporarily imposed to exceed the critical opening pressure of the affected lung region. After the recruitment manoeuvre the PEEP must be kept high enough that subsequent de-recruitment does not occur. Recruitment manoeuvres also have a time related component as the time required to open (heterogeneous) alveoli varies.
Region of ROI A user-defined area within an EIT Interest status image. The image can be divided
horizontally or into quadrants. In PulmoVista 500, the area covered by each ROI is represented by a corresponding regional impedance waveform, a TV ROI and a regional ΔEELI.
ROI Tidal TV ROI Regional Tidal Variations show the Variation percentage of ventilation related
impedance change which takes place in the corresponding ROI.
TERM ABBREVIATION EXPLANATION
144|

Single Photon SPECT An experimental, nuclear tomographic Emission imaging technique using gamma rays. Computed Similar to CT, it delivers cross-sectional Tomography images of the body.
Status Image A Tidal Image or Minute Image;
Tidal Image The Tidal Image represents regional distribution of impedance changes of the last detected breath. The Tidal Image is a differential image of the end of inspiration compared to the beginning of inspiration.
Tidal See Cyclic Opening and Closing. Recruitment
Tomogram A cross-sectional image, created by a tomograph.
Tomograph A device, used to create a tomogram.
Tomography A method of producing a cross-sectional image, in slices, of a solid object.
Transverse PulmoVista 500 provides cross-sectional Plane images as if looking through the subject’s
feet; the left side of the image represents the right side of the subject.
TERM ABBREVIATION EXPLANATION
144|145
ELECTRICAL IMPEDANCE TOMOGRAPHY | APPENDIX III
Ventilation Movement of gas into and out of the lung during breathing.
Ventilator VALI Lung injury as a result of mechanical Associated ventilation, caused by either excessive Lung Injury (regional) tidal volumes leading to
overdistension and / or cyclic opening and closing of alveoli as a result of insufficient PEEP settings. In relation with mechanically ventilated patients, the term VALI has replaced the term VILI, as clinical data show that pre-existing lung injury seems to be mandatory for the observed adverse effects of mechanical ventilation.
Ventilator VILI Sometimes used synonymously with VALI, Induced but correctly the term VILI should only be Lung Injury used in the context of a purposely induced
lung injury in laboratory settings.
Ventral V Related to the position of the subject’s sternum (or belly), in EIT imaging the upper aspect of the image, regardless of whether the patient is lying in supine, lateral or prone position. When the EIT image is subdivided into 4 layers, the ventral part is represented by ROI 1.
TERM ABBREVIATION EXPLANATION
146|

Volutrauma The damage to the lung during mechanical ventilation, caused by excessive (regional) tidal volumes leading to overdistension of alveoli. It is not necessarily associated with barotrauma: the pressure in the alveoli may not be excessive but they may still be overdistended.
TERM ABBREVIATION EXPLANATION
146|147

Eckhard Teschner, born in 1964 in Bremen, Germany, has a biomedical engineering background, but has also worked in emergency care and the intensive care environment. After his studies, he was employed as Senior Product Manager in the business fields of radiology, cardiology and heart surgery. He joined Dräger in 1999 and has been the responsible Product Manager for the EIT technology project since its launch in 2001 in cooperation with the EIT group Göttingen.
He has initialised and accompanied various scientific and clinical cooperations with international experts in lung mechanics and mechanical ventilation. He has been present during more than 100 EIT measurements on intensive care patients who were in some cases suffering from severe respiratory dysfunctions.
In the product development process of PulmoVista 500, he has specified its product requirements and designed its graphical user interface.
D-3
415-
2011
Prof. Dr. med. Michael Imhoff is board certified in general surgery and intensive care medicine. Research areas include trauma surgery, intensive care medicine, patient monitoring, clinical data management, artificial intelligence in medicine and health economics, leading to over 300 publications and scientific presentations.
He teaches Medical Informatics and Statistics at the Ruhr-University Bochum, Germany, is a reviewer for the German Research Foundation, a member of the editorial boards of and reviewer for several international biomedical journals, and Chairman of the section for patient monitoring of the German Association of Biomedical Engineering (DGBMT).
D-7
0-20
11
ELECTRICAL IMPEDANCE TOMOGRAPHY |
D-7
0-20
11

Prof. Dr. med. Dr.-Ing. Steffen Leonhardt was born in 1961 in Frankfurt, Germany. He obtained an M.S. in Electrical Engineering from SUNY at Buffalo, NY, USA, a Diploma and a Ph.D. in Electrical Engineering from Technical University of Darmstadt, Darmstadt, Germany, and an M.D. from Goethe University, Frankfurt, Germany. In 1999, he joined Dräger Medical GmbH in Luebeck, Germany, and he led the EIT-R&D team building the first prototypes of Pulmovista 500 from 2001 – 2003. In 2003, he was appointed Head of the newly established Philips Chair for Medical Information Technology at the Helmholtz-Institute for Biomedical Engineering, RWTH Aachen University, Germany.
Besides EIT, his research interests include medical measurement technologies, personal health care devices and closed loop systems in medicine.
D-6
76-2
014


90 6
6 78
8 | 1
5.04
-3 |
Com
mun
icat
ions
& S
ales
Mar
ketin
g | P
P |
PR
| LE
| P
rinte
d in
Ger
man
y | C
hlor
ine-
free
– en
viron
men
tally
com
patib
le |
Sub
ject
to m
odifi
catio
ns |
© 2
015
Drä
gerw
erk
AG
& C
o. K
GaA
CORPORATE HEADQUARTERSDrägerwerk AG & Co. KGaAMoislinger Allee 53–5523558 Lübeck, Germany
www.draeger.com
Manufacturer:Dräger Medical GmbH Moislinger Allee 53–5523558 Lübeck, Germany
REGION EUROPE CENTRAL AND EUROPE NORTHDräger Medical GmbH Moislinger Allee 53–5523558 Lübeck, GermanyTel +49 451 882 0Fax +49 451 882 [email protected]
REGION EUROPE SOUTHDräger Médical S.A.S. Parc de Haute Technologie d’Antony 225, rue Georges Besse92182 Antony Cedex, FranceTel +33 1 46 11 56 00Fax +33 1 40 96 97 [email protected]
REGION MIDDLE EAST, AFRICADräger Medical GmbHBranch OfficeP.O. Box 505108Dubai, United Arab EmiratesTel +971 4 4294 600Fax +971 4 4294 [email protected]
REGION ASIA / PACIFICDraeger Medical South East Asia Pte Ltd.25 International Business Park#04-27/29 German CentreSingapore 609916, SingaporeTel +65 6572 4388Fax +65 6572 4399 [email protected]
REGION CENTRAL AND SOUTH AMERICADräger Panama Comercial S. de R.L.Complejo Business Park, V tower, 10th floorPanama CityTel +507 377 9100Fax +507 377 9130 [email protected]
As of August 2015:Dräger Medical GmbH changes to Drägerwerk AG & Co. KGaA.