electrifying mobility in india - brookings.edu · vehicular stock, sales and kilometres how will...
TRANSCRIPT

By Mohd. Sahil Aliand Rahul Tongia
Impact Series
FUTURE PROSPECTS FOR THE ELECTRIC AND EV ECOSYSTEM
ELECTRIFYINGMOBILITY IN INDIA

IMPACT SERIES 052018
Copyright © 2018
Brookings Institution India CenterNo. 6, Second Floor,Dr Jose P Rizal Marg, Chanakyapuri,New Delhi - 110021
Recommended Citation: Ali, Mohd. Sahil; Tongia, Rahul (2018). “Electrifying Mobility in India: Future prospects for the electric and EV ecosystem”, Brookings India IMPACT Series No. 052018. May 2018.
Brookings India does not hold an institutional view.

ELECTRIFYINGMOBILITY IN INDIA
By Mohd. Sahil Ali and Rahul TongiaMay 2018
FUTURE PROSPECTS FOR THE ELECTRIC AND EV ECOSYSTEM

About the authorsMohd. Sahil AliAssociate, Energy and Sustainability, Brookings India.Ali specialises in systems-level modelling and analyses of energy and material flow and its linkages with technology, policy, economy and environment. He has contributed to several energy and emissions scenario modelling exercises at the state and national level, reflecting directly in official policies and action plans. He has also represented the Indian research community on important platforms for SDGs and green growth, and has advised NITI Aayog on its national energy security model. Ali has a Master’s Degree in Economics from Jawaharlal Nehru University, New Delhi, and a Bachelor’s in Arts from St. Stephen’s College, New Delhi. Rahul TongiaFellow, Energy and Sustainability Brookings India An expert in technology, policy and design of infrastructure, Tongia’s research covers energy, electricity and sustainable development, with additional expertise information technology and telecommunications. His work focuses on smart grids, which use innovative information and communications technology to improve management of the electricity grid; renewables and renewable integration; shortfalls of electricity and mitigation measures; and electricity pricing. He is also Adjunct Professor at Carnegie Mellon University, and was the founding technical advisor for the Government of India’s Smart Grid Task Force. Tongia has a Ph.D. in Engineering and Public Policy from Carnegie Mellon University, U.S.
Support for this publication was generously provided by TATA Steel Ltd. Brookings India recognises that the value it provides is in its absolute commitment to quality, independence, and impact. Activities supported by its donors reflect this commitment and the analysis and recommendations found in this report are solely determined by the scholar(s).

Electrifying Mobility in India | 5
Key Points• By 2030, India could see anywhere between 100 and 300 million electric vehicles (EVs) based on technology and policy developments facilitating consumer switch. About 80-85 per cent of these will be private vehicles, with two-wheelers making up almost 70 per cent of the mix.
- Fleet vehicles such as taxis, buses and three-wheelers (autos) make up the remaining ~15 per cent of EV population in 2030s, but will likely demand 50-60 per cent electricity.
- While fleet vehicles will contribute ~30 per cent to the total load capacity of EVs, their duty cycles, and therefore charging behaviour, are much less uncertain. Their instanta- neous loads are higher, but they are also amenable to battery swapping models that help utilise solar power for charging the battery.
• If National Electric Mobility Mission Plan (NEMMP) sales targets for the year 2020 were met, the electricity demand from these EVs would be less than 10 billion units (BUs), which is 1 per cent of current electricity demand. However, in terms of aggregate loading capacity, these would contribute almost 10 per cent.
• This difference between BUs demanded and aggregate loading capacity becomes more stark with higher sales. By 2030, even if 100 per cent sales were EVs, their electricity demand would be around 100 Terawatt-hour (TWh), which come to less than 400 Megawatt-hour (MWh) per EV on an average annual basis.
- But even at 33 per cent sales penetration, EVs will constitute the most significant load in the country, higher than steel or other industrial loads.
- The capacity utilisation factor of conventional grid loads is about 20 per cent, but hovers around less than 1.5 per cent for EVs, making EVs an inherently volatile load.
- The grid impact with EVs plugged in together versus theoretically spread out to cause minimum instantaneous surge varies with a ratio of over 50 times, which gets worse with faster charging.

6 | Electrifying Mobility in India
• The key challenge for the grid with EVs will therefore not be in terms of aggregate electricity units, but rather ‘when’ and ‘where’ the demand is generated. Issues of supply capacity sizing at the local distribution transformer or even substation level with a significant EV population need to be deliberated by utilities sooner than later.
• Perhaps the most crucial factor for studying EVs and their grid impact is the Time of Day (ToD) characteristics of charging demand–how much of it will coincide with the peak or with the solar generation curve.
- Our analysis shows that EVs could add up to 50 per cent to peak demand and add 3 percentage points to peak demand growth between 2017 and 2030.
- EVs charging from night to morning help grid utilisation but have a worse impact than petrol or diesel vehicles on carbon emissions (as they primarily use coal-based power for charging overnight).
- Tariff design for EVs must accommodate such trade-offs based on time-of-use. There are different ways of designing tariffs based on the context.

Electrifying Mobility in India | 7
By any measure, India’s electric vehicle (EV) aspirations are steep from where we stand today, but they have sparked remarkable interest and action in policy, industry and research arenas. A push to mandate all vehicles sold by 2030 to be electric seems to have tempered, but high EV penetration scenarios remain likely. While costs and consumer choice remain fundamental factors, there are three additional key issues for realising any growth: (1) manufacturing; (2) grid capabilities; (3) charging infrastructure. In this paper, we focus on points (2) and (3).
As a market, India sells only a fraction of electric two-wheelers (E2Ws) and four-wheelers (E4Ws) annually as the aggregate two- and four-wheeler sales daily. In the absence of any significant deployment, it becomes difficult to plan and prioritise on a large-scale based on learnings. This is especially true in case of a transition to EVs, which has several wide-ranging ramifications related to urban infrastructure, manufacturing transitions and learning curves, grid planning and behavioural shifts.
This paper is set in the context of the electricity grid-level impact of EVs and the drivers and fallouts from a large-scale transition to EVs, based on the recent findings of an ongoing study by the authors. Through this paper, we also intend to explore specific aspects related to peak coincidence of EVs’ demand and Time of Day (ToD) aspects, heterogeneities between private and fleet vehicle charging behaviour and requirements, local issues of distribution capacity, carbon and grid utilisation co-benefits, tariff design strategies and fiscal implications of powering mobility.
We find an enormous divergence between energy (kWh) and load capacity (kW) implications of EVs. This is likely to be unmanageable under the conventional approach to capacity expansion, both on a technical level as well as a regulatory/pricing model. Regardless of the exact volume (share) of EVs in 2030, the grid impact1 can vary–between theoretical worst case scenario of when all EVs are plugged in simultaneously to a best case scenario of charging spread out as much as possible–with a ratio of over 50 times. The reality will be somewhere in between, based on several unknowns as discussed later. Normal grid loads today have an annual aggregate load capacity to effective capacity used factor of nearly five; for EVs this can vary between 80 and 160, based on the sales mix, duty cycle, and charging speeds. ToD pricing, local congestion signalling, and similar measures can play a crucial role in synergising the EVs to the electricity grid.
Introduction - EVs are a different ball game!
1 In terms of cumulative power demand at any given point of time.

8 | Electrifying Mobility in India
Grid impact under EV penetration and charging scenarios
Vehicular stock, sales and kilometres
How will EVs impact the national grid? We attempt to model bottom-up scenarios of EVs’ stock, kilometres run and energy requirement by EV category. Further, we attempt to quantify the aggregate load capacity of EVs to estimate their impact on instantaneous grid demand.
We analysed the impact of large-scale EV adoption under two scenarios: an ambitious scenario of 100 per cent EV sales by 2030 as per Government of India’s previous targets, and a relatively modest scenario of approximately 33 per cent EV sales by 2030.2 Additionally, we quantified energy requirements and total giga-watt (GW) charging capacity of EVs by 2020 as envisaged in the National Electric Mobility Mission Plan (NEMMP).
As of 2015,3 the Ministry of Road Transport and Highways estimates over 210 million registered vehicles, out of which we estimate that over 90 per cent can be categorised as exclusively passenger vehicles, 7-8 per cent as freight vehicles, and remaining in the mixed-use category (Indiastat.com). Between 2000 and 2015, four-wheelers registered the highest compound annual growth rate (CAGR) of 10.8 per cent followed by two-wheelers (10.6 per cent), buses (8.7 per cent), freight vehicles (8.6 per cent), and others.4
2The analysis has been carried out for intra-state (or urban) kilometres travelled by passenger vehicles owing to considerations of battery-pack sizing, range, and power of EVs compared to internal combustion engine vehicles and associated duty-cycles with freight operations. However, E3Ws may be suitable for short distance movement of goods, though it has not yet been considered in the analysis due to lack of data availability and policy thrust.3FY’2014-15 has been considered as the base year of analysis due to the availability of revised estimates.4Others include tractors, trailers, three-wheelers (passenger vehicles)/LMV and other miscellaneous vehicles not separately classified.

Electrifying Mobility in India |9
Based on recent trends in stock and sales data, urbanisation and mobility requirement projections, and vehicular kilometres travelled annually, the future demand and supply of urban road mobility are estimated. This data is variously obtained from industrial associations, independent agencies, think-tanks and government departments, multilateral agencies, academia and expert assessments.
1%
4%
8%14%
73%
Buses Freight Vehicles Others Cars, Jeeps & Taxis 2W
Total = 210 million
Source: Indiastat.com, accessed August. 2017.
Figure 1: Share of registered vehicles in India (2015)

10 | Electrifying Mobility in India
Therefore, while two-wheelers triple in stock (7.6 per cent CAGR), penetration of four-wheelers grows from one in 16 households6 in 2015 to one in four households in 2030 (9.9 per cent CAGR of stock), and bus and three-wheeler7 population more than doubles per capita (with one bus per 400 persons in 2030 at 5.9 per cent CAGR of stock, and one three-wheeler per 70 persons in 2030 at 9.3 per cent CAGR of stock).
Source: Indiastat.com, Central Statistics Office and authors’ calculations
Figure 2: Active vehicles/1000 persons in 2015 and 2030
5Studies have estimated that approximately 70 per cent of registered vehicles in India can be classified as “on-road” or active stock (Abhyankar & Gopal, 2017). This has been considered for future analysis of km/vehicle, with some variations among vehicular categories and greater pace of junking and replacements in future, raising the active stock to 75-80 per cent. 6Weighted average household size is estimated to decline from 4.7 persons in 2015 to 4.0 persons in 2030, with urbanisation increasing from 32.3 per cent to 40 per cent in the same period (Byravan & Ali, 2017). 7Registered three-wheelers are estimated at 60 per cent of the stock of ‘others’ after netting out tractors (~5 million) and miscellaneous vehicles (~1.5 million) (Goel & Kumar, 2013).
Figure 2 shows the projection of active (on-road) passenger vehicles per 1,000 persons in 2030 compared to 2015.5

Electrifying Mobility in India | 11
The underlying average vehicular sales (active vehicles) between 2016 and 2030 is shown in Figure 3. Note that four-wheelers are further split into cars (private) and taxis, the latter estimated at 6 per cent of total cars in stock in 2015.
Figure 3: Average annual vehicular sales (2016-30)
Source: Author’s calculations from various reports and statistical datasets
Further, Figure 48 provides the annual intra-city vehicular kilometres per vehicle for 2013 and 2030. It is clear that the vehicular kilometres (VKMs) travelled increase at a higher rate than growth in active stock across all vehicular categories, indicating higher utilisation of existing stock.9
8Note that 2013 is the most recent year for which VKMs by vehicular category are available from the Central Road Research Institute’s study (Ravinder & Madhu, 2014), which projects vehicular emissions from the road sector at the national level. 9Certain VKMs/vehicle appear low most likely because of the difference in the number of registered versus active vehicles. The active stock in some categories (eg. buses) may actually be much lower than the assumptions used in this analysis. However, this does not change the total VKMs travelled.

12 | Electrifying Mobility in India
To validate the above projections, sub-mode-wise urban billion passenger kilometres (BPKMS) in the reference and future years are used to derive occupancy rates based on the aggregate VKMs obtained from Figure 2 and Figure 4. These are shown in Figure 5 (Ravinder & Madhu, 2014; Byravan & Ali, 2017).
Source: CRRI (2014), Indiastat.com and author’s calculations
Figure 4: Annual intra-city VKMs/vehicle
Figure 5: Sub-mode-wise BPKMs and occupancy rates
Source: CSTEP (2015), IESS v2.0 (2015), CRRI (2014) and author’s calculations

Electrifying Mobility in India | 13
In this manner, it is verified that demand and supply side for urban passenger road mobility is balanced over the study horizon. The aggregate VKMs travelled, along with the vehicular range, provide an estimate of the energy requirement for charging EVs. Additionally, the charger capacity, along with aggregate EV stock across vehicular categories provides the potential GWs of end-use power demand owing to EVs in the system.
Figure 6 shows the category-wise sales as defined under the NEMMP, with the range of sales within each category segmented as lower (LB) and upper (UB) bounds (Department of Heavy Industry, 2012). Compared to the 2030 targets, these appear highly modest in terms of percentage of total sales. As a comparison, to achieve 100 per cent EV sales by 2030, the proportion of EVs in new sales should grow to ~25 per cent by 2020 if the growth were progressive. In reality, however, there may be a delayed spike in EV sales later.
If NEMMP targets are met (2020)
Source: Department of Heavy Industries (DHI) (2012) and author’s calculations
Figure 6: EV penetration as per NEMMP targets (2020)

14 | Electrifying Mobility in India
Next, the electricity demand under such a scenario is presented in Figure 7.10 Remarkably, even if all plug-in hybrid electric vehicles (PHEV) use similar amount of electricity to run as battery electric vehicles (BEV), aggregate demand in the UB case does not exceed 9 BUs, which constitutes less than 1 per cent of aggregate end-use electricity demand in the country in 2020.
However, even by 2020, the potential loading capacity from the sales of EVs reaches 50-60 GW, which is nearly 10 per cent of the capacity of all electricity devices and equipment in the country across the end-use sectors.11 This difference between the units consumed and the potential instantaneous loading pressure on the grid becomes starker in scenarios of higher EV penetration by 2030.
Figure 7: Electricity Demand by EVs under NEMMP (2020)
10 As a simplifying assumption, the characteristics (range, battery size, etc.) of all PHEVs is considered similar to BEVs and mild-hybrids are not considered. 11In 2015, the national aggregate consumption capacity was estimated at 456 GW and projected to grow to 600- 630 GW by 2020.

Electrifying Mobility in India | 15
Results: Electricity requirement and EV charging capacity 2030Table 1 shows the cumulative future EV sales in the ambitious (UB) and modest (LB) scenarios between 2017 and 2030. While the two scenarios of 100 per cent and 33 per cent sales by 2030 correspond to roughly 60 per cent and 25 per cent sales over the period, the sales for different vehicular types slightly differ owing to differences in assessments of active stock (and therefore, junking and replacements). Certain categories like fleet vehicles should reach 100 per cent sales earlier in UB, while private vehicles may lag further behind in the LB.
Future EV Sales (Cumulative 2017-30)
% Total Sales
Cars
Taxis
Buses
2W
3W
Total/ Wtd. Avg.
60%
65%
65%
60%
65%
61%
42.2
6.8
2.3
197.8
24.7
274
Million Numbers
20%
25%
25%
20%
33%
21%
2030 LB 2030 UB
14.1
2.6
0.9
65.9
12.6
96
2030 LB 2030 UB
Table 1: Sales of EVs between 2017 and 2030

16 | Electrifying Mobility in India
Electricity demand Based on the EV stock, annual VKMs per vehicle in 2030 and performance of EVs (km/kWh),12 the electricity demand from EVs in 2030 is derived as shown in Figure 8.
Total electricity demand for EVs may therefore vary between 37 and 97 TWhs under 33 per cent and 100 per cent penetration of EVs in sales by 2030, considering only intra-city (urban) passenger travel. Buses and private cars constitute more than half the demand, followed by three-wheelers, two-wheelers, and taxis. This constitutes a less than 4 per cent share under all scenarios of aggregate end-use demand projected in 2030 in another Brookings India study.13 It is therefore clear that meeting the energy (BUs) demanded under the ambitious target should not be a challenge for the Indian electricity sector in aggregate.
Figure 8: Vehicular Category-wise Electricity Demand by EVs in 2030
12In addition, an equivalent of charging losses and deviation from stated mileage is taken as 15 per cent for four-wheelers, 5 per cent for buses, and 10 per cent for two-wheelers and three-wheelers. 13The current work is a component of a larger study on bottom-up scenarios of sector-wise end-use electricity demand, currently in draft review stage.
Electrifying Mobility in India | 17
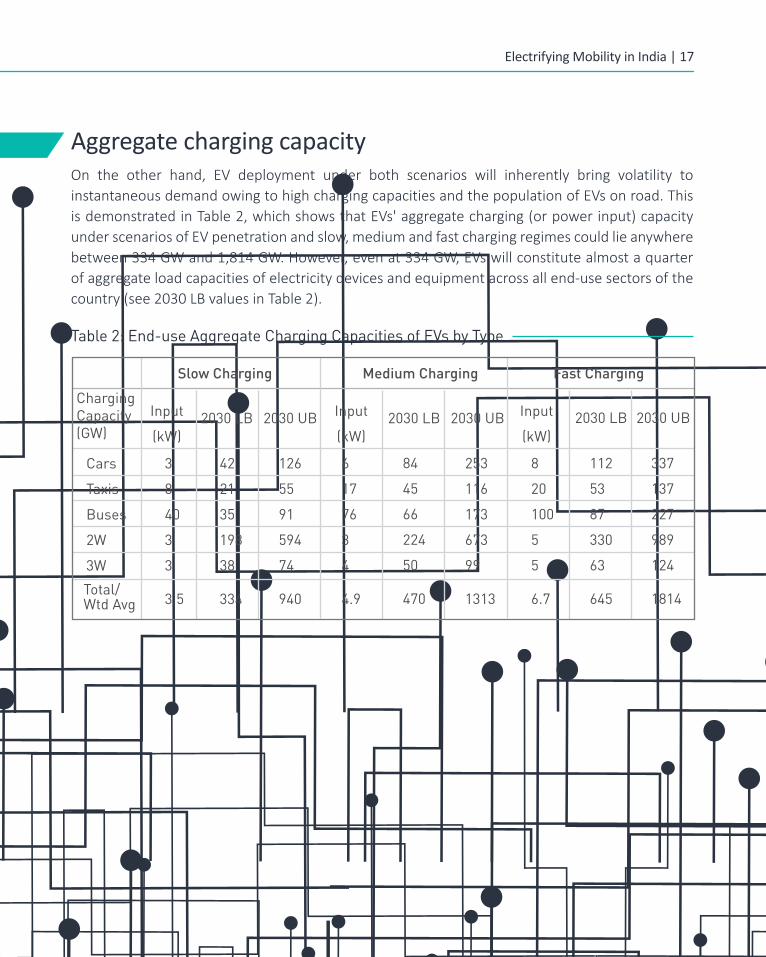
Aggregate charging capacityOn the other hand, EV deployment under both scenarios will inherently bring volatility to instantaneous demand owing to high charging capacities and the population of EVs on road. This is demonstrated in Table 2, which shows that EVs' aggregate charging (or power input) capacity under scenarios of EV penetration and slow, medium and fast charging regimes could lie anywhere between 334 GW and 1,814 GW. However, even at 334 GW, EVs will constitute almost a quarter of aggregate load capacities of electricity devices and equipment across all end-use sectors of the country (see 2030 LB values in Table 2).
Table 2: End-use Aggregate Charging Capacities of EVs by Type
Slow Charging Medium Charging Fast Charging
Cars
Taxis
Buses
2W
3W
Total/Wtd Avg
3
8
40
3
3
3.5
42
21
35
198
38
334
126
55
91
594
74
940
6
17
76
3
4
4.9
253
116
173
673
99
1313
8
20
100
5
5
6.7
112
53
87
330
63
645
337
137
227
989
124
1814
84
45
66
224
50
470
2030 UB2030 LB2030 UB2030 LB2030 UB2030 LBInput
(kW)
Input
(kW)
Input
(kW)
ChargingCapacity(GW)
18 | Electrifying Mobility in India
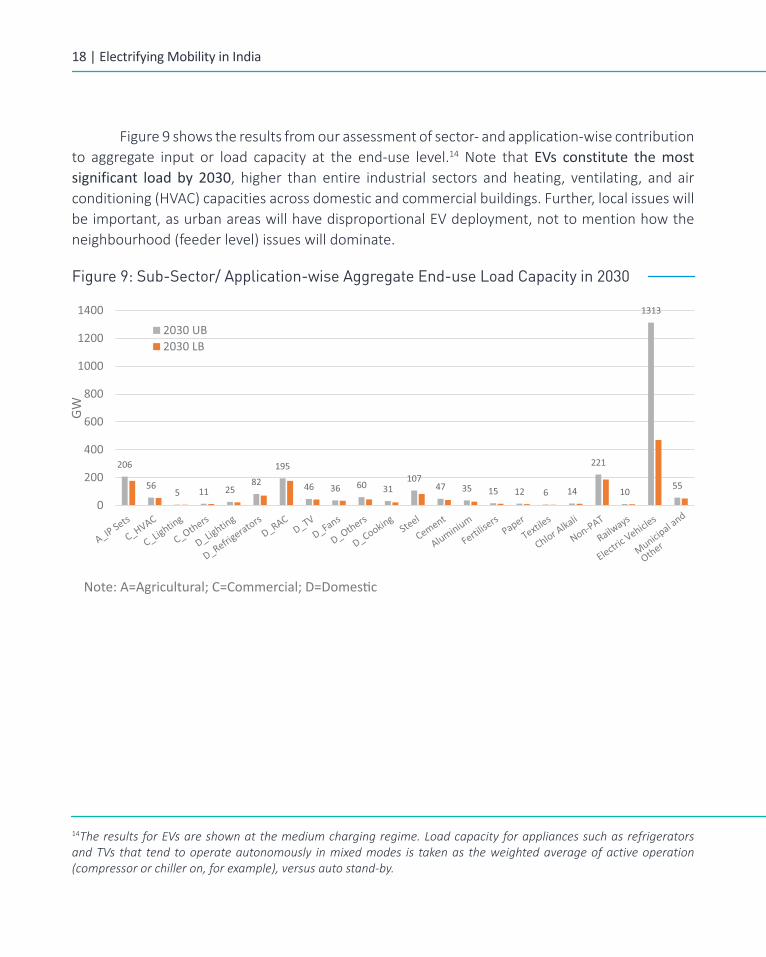
Figure 9 shows the results from our assessment of sector- and application-wise contribution to aggregate input or load capacity at the end-use level.14 Note that EVs constitute the most significant load by 2030, higher than entire industrial sectors and heating, ventilating, and air conditioning (HVAC) capacities across domestic and commercial buildings. Further, local issues will be important, as urban areas will have disproportional EV deployment, not to mention how the neighbourhood (feeder level) issues will dominate.
Figure 9: Sub-Sector/ Application-wise Aggregate End-use Load Capacity in 2030
14The results for EVs are shown at the medium charging regime. Load capacity for appliances such as refrigerators and TVs that tend to operate autonomously in mixed modes is taken as the weighted average of active operation (compressor or chiller on, for example), versus auto stand-by.
Municipal and
Other
Note: A=Agricultural; C=Commercial; D=Domestic

Electrifying Mobility in India | 19
Figure 10: Major Sector/ Application-Wise Shares in Aggregate Load Capacity
IP Sets
Ligh�ng & Appliances
PAT Industry
Non-PAT Industry
EVs Others
ACs
134, 29%
40, 9%
76, 17%27, 6%
85, 19%
2030 Upper Bound(GW, Share)
2030 Lower Bound(GW, Share)
228, 15%176, 11%57, 4%
470, 31%250,10%
206, 8%65, 3%
1313, 51% 223, 9%
185, 12%
237, 9%
266, 10%
182, 12% 224, 15%
93, 20%
2015(GW, Share)
Figure 10 puts this into historical perspective, showing how EVs grow from having virtually zero contribution to aggregate end-use input capacity in 2015 (476 GW) to between 30 per cent and 50 per cent share in LB (470 out of 1,542 GW) and UB (1,313 out of 2,587 GW ) scenarios, respectively, by 2030. Aggregate load capacity CAGR between 2015 and 2030 is thus 8.4-12.2 per cent, contrasting with 5.7-6.9 per cent CAGR obtained for all other sectors and applications in the absence of EVs. Therefore, EVs will pose disproportionately higher issues for instantaneous demand (loading), constituting a 13-17 times higher share in aggregate load capacity compared to aggregate electricity demand.

20 | Electrifying Mobility in India
It is therefore clear that the nature of electricity demand and commensurate requirement in grid flexibility is much different in case of EVs compared to traditional loads. Defining capacity utilisation factor of electrical loads (CUFL) as actual energy demanded versus theoretical maximum energy demand if all the loads were simultaneously switched on throughout the year, we get a CUFL of 20 per cent in 2015, when EVs are virtually absent.15 On the other hand, EVs have a CUFL of 0.6 per cent-1.3 per cent under different scenarios of EV sales and charging regimes, indicating that whereas the actual hours of charging may actually be very low, the surge in power requirement upon plugging in will be disproportionately large (in orders of magnitude).
In terms of grid planning, the reciprocal of CUFL indicates the multiplier (ratio) of all the load capacity coming online simultaneously versus actual consumption distributed uniformly during the year. For the year 2015, this was 4.9 when no EVs were present, so the electricity distribution companies could size individual connections accordingly, after accounting for relatively minor inter-sectoral variations in distribution categories and utilisation patterns.16 However, in case of EVs, this multiplier could lie between 79 and 164 depending on the charging regime in place, which would be 16-33 times that of conventional loads. Therefore, sizing connections, providing charging and distribution infrastructure and planning for peak demand growth, whilst optimising plant load factors across generation sources and reducing power purchase costs, all become more daunting with a higher share of EVs (especially privately owned).
15In 2015, the aggregate end-use consumption was 949 TWh, whereas the aggregate electrical load capacity was 456 GW (Footnote 11).16For example, low tension and high tension consumers will have different associated distribution losses (technical). Further, peak load utilisation (PLU) assessments—maximum load that is actually/likely to be switched on simultaneously versus aggregate load capacity—will vary across consumer categories.

Electrifying Mobility in India | 21
This section furthers the discussions on some of the crucial factors influencing nature of EV demand and its compatibility (or lack thereof) with the grid. This necessitates a deep-dive into some of the more granular issues related to charging behaviour, duration and diversity of loads, feeder and distribution transformer-level planning, and issues of time of day and how loads can be shifted to meet the objectives of greenhouse gas abatement and grid stability.
Delving into the unknowns of EV demand
Peak contribution of EVs
For 2015, the average peak load utilisation (PLU) (see Footnote 16) of the grid is estimated as 25 per cent.17 Even if we ignore the fact that the energy consumption pattern of EVs is prone to much more volatility and treat the PLU of EV loads the same as actual grid PLU in 2015, the peak contribution of EVs (at bus-bars) by 2030 could be between 120 GW and 332 GW in the medium-charging case. This is daunting when compared to 2017 peak demand of 160 GW. To put this into perspective, if we further assume that PLU of the remaining grid also remains the same (a much more plausible situation), then EVs at 33 per cent and 100 per cent sales in 2030 would contribute between 28 per cent and 50 per cent to peak load.18
A crucial aspect missing in the above analysis is the ToD aspect of peak demand. India has generally witnessed evening peaks (7-10 pm) when household loads are utilised at a maximum. However, this trend has been witnessing new variations in recent years as morning peaks (8-11 am) have been catching up with evening peaks in certain times of the year.19 In this context, the duty and charging cycles of EVs become especially important in order to more accurately assess EVs' aggregate impact on instantaneous demand, which also has fundamental implications for choice of generation technologies.
17Aggregate End-use Load Capacity= 456 GW, Peak Demand =148 GW (Government of India, 2016), T&D Losses= 22.77 per cent (Central Electricity Authority, 2017)18In this situation, peak load reaches 423-626 GW in LB and UB scenarios. Absolute peak load contribution of conventional loads grows at 4.9 per cent-5.6 per cent CAGR. This has historically been growing at almost 4.5 per cent CAGR.19This is owing to the relatively high growth in commercial and industrial loads accompanied by the fact that household loads in aggregate are more responsive to external temperature, humidity and lighting conditions than other loads.

Demand characteristics of private versus fleet vehicles
22 | Electrifying Mobility in India
This problem is exacerbated at the feeder level, where the issue is not so much availability of supply but distribution capacity. If we consider a housing society with 100 EVs using slow charging at 3 kW, it means they must charge overnight, resulting in a 300 kW additional load. This is more than the transformer can handle, and may even be more than the headroom on the 11 kV feeder (typically sized to 3 MW). On the other hand, a low-tech three-phase charging of 8.6 kW (which requires minimal equipment) can almost triple the load. In such a scenario, does the utility simply ‘expand’ existing capacity or build dedicated capacity for EV charging? How does infrastructure keep pace with additions in EV capacity? How much do we plan for and build in advance and who is bearing the costs and risks? Similar issues will arise during day charging for commercial complexes, likely accompanied by supply availability issues as day and afternoon peak grow. The question is much easier to answer with DC fast-charging fleet vehicles that will necessarily require dedicated feeder lines to the charging depot. If we extrapolate to the national level, we are talking massive overhaul of distribution infrastructure to accommodate EVs, in an era where most electricity distribution companies are barely able to cover operational costs.
Private and fleet vehicles are likely to have different duty cycles and therefore charging requirements. While private vehicles can be reasonably assumed to travel for work and ideally charged at or near workplaces during day times, fleet vehicles will likely have fixed duty cycles during the day or be used on-demand, so may not have the flexibility of charging during the time when solar power is being generated. This further complicates the issue of ‘EV-PV marriage’. Moreover, fleet vehicles such as taxis or buses will have limited idle time for charging (whether fixed or erratic) compared to private vehicles, necessitating more advanced fast charging infrastructure. Coupled with higher miles travelled and larger battery capacities, this implies while they will charge faster, they will add much more instantaneous load on the grid compared to private vehicles. From Table 2, while private vehicles comprise two-thirds or higher load capacity, the fleet mix on average will be nearly 10 times higher in terms of instantaneous charging input requirements compared to private vehicles. The latter will likely be charged with the equivalent of single or three-phase chargers.
Local issues dominate

Electrifying Mobility in India | 23
Designing charging tariffsWhile it is unambiguously patent that EV charging tariffs should be higher than average residential tariff slabs owing to augmentation required in supply and distribution capacity due to EVs, states like Delhi have opted for a flat tariff,20 unconstrained by ToD considerations. In such a case, the question remains whether the tariff is reflective of the actual cost to serve at different times of day, when power may be surplus or deficit. ToD pricing is a handy policy tool to help shift flexible loads to when the grid is best prepared to serve them. However, should ToD pricing account only for grid loading and peak versus off-peak or trough—what can broadly be understood as demand characteristics, given supply of indistinguishable giga-watts? Or should ToD of supply mix in terms of solar/non-fossil versus fossil hours be factored in or even gain primacy? A win-win situation is such that the pricing incentivises both grid stability/stabilisation and solar/fossil-free consumption.
How carbon-friendly an EV is over an equivalent internal combustion engine (ICE) is determined not just by how “green” the grid is, but also the time of charging. In the absence of large-scale storage in the short term, an EV charging at night may be worse than ICE when it comes to carbon emissions. On the other hand, superior grid utilisation from charging EVs during ‘agricultural supply’ hours can help improve thermal plant economics and result in cheaper power. However, this trade-off may only be a short-term phenomenon.
As solar expands to meet its ambitious growth targets and charging infrastructure develops, EVs could potentially absorb surplus power from renewable energy and prevent curtailment during solar output hours. For fleet vehicles, battery swapping technologies and models, if successful, can similarly help during day charging. Especially for private vehicles for which charging hours can be relatively flexible, ToD pricing can further help better solar utilisation and peak-shaving. In the longer run when grid storage becomes viable, high renewable energy accompanied by ToD pricing can potentially overcome short-term trade-offs between better grid utilisation and mitigation co-benefits.
Carbon mitigation and grid utilisation co-benefits
20In fact, Delhi’s EV tariff is below the average cost of supply.

24 | Electrifying Mobility in India
Impact on public exchequer Moving from oil to electricity as primary transport fuel also has implications down the road in terms of how much the central and state governments can raise in taxes or equivalent revenues. Petrol and diesel taxes together constitute almost 3 per cent of gross domestic product and a complete transition to EVs entails a loss of perhaps two-thirds of that revenue (Tongia, 2017).21 The move will therefore have implications for budgetary allocation and growth, and needs to be adequately planned for. Taxing electricity equivalently is complex and unlikely to work.
This is coupled with India’s transition to RE which implies loss of revenues, taxes and royalties on coal and greater reliance on subsidised renewables, while keeping electricity prices affordable to encourage growth.22 Together, while the story is great for environmental sustainability and current account deficits, it restricts the government's spending capabilities on development in other sectors in the absence of new sources of revenue and cheaper, longer-term finance. These aspects may have second-order effect on the electricity grid, and therefore merit deliberation on longer-term strategies for fiscal sustainability and alternate revenue-generating mechanisms for the government.
The key challenge here is availability of or access to granular data to dig deeper into weekly, diurnal and seasonal aspects of demand and supply, which is spatially disaggregated to provide meaningful regional or local-level insights. This will shed light on the likely trade-offs and synergies between the two objectives under different conditions, and this information can be reflected in the ToD design features. Whether one objective must be prioritised over the other in case of trade-offs is another aspect that may be worthy of deliberation.
21 Some diesel demand is non-vehicular and not all diesel demand in transport can be expected to shift to electric.22The calculus of solar versus coal is more complex than levelised cost of energy (LCOE) calculations suggest. The Central Electricity Authority (CEA) estimates that the hidden cost of RE today is almost Rs 1.5/kWh due to transmission costs and impact on thermal generators in terms of efficiency, wear-and-tear, and backing down. Coal-based power costs represent taxes, levies, royalties and cess on coal, plus a significant portion of the cross-subsidy to passenger railways from the transport of coal to power plants. Put together, these constitute over Rs 0.7/kWh coal generation.
Electrifying Mobility in India | 25
EVs are unlike any other conventional loads that the grid has been used to. Their disproportionately large impact on peak demand compared to electricity units requires significant peaking and distribution capacity head-room that risks severe underutilisation and therefore, unviability. In theory, one could simply recover these costs from EV tariffs, but that means the primary consumer motivation for buying EVs—fuel and operations and maintenance costs savings compared to ICEs—no longer exists, and EVs become a non-starter. Therefore, the appropriate approach should be to plan and calibrate from both demand (regulated EV loads and charging patterns) and supply (generation and distribution capacity) sides to mitigate these fallouts, and build frameworks that foster reflexive learning and system adaptability. This paper is an attempt to estimate the magnitude of this challenge and its constituents, and delineate the key issues and uncertainties on the path to an electricity-fuelled mobility future. We hope that it can stimulate new ideas for research endeavour, and provide a stronger foundation and greater dynamism to the question of EVs and the electrical grid.
Conclusion

ReferencesAbhyankar, N., & Gopal, A. e. (2017). Techno-Economic Assessment of Deep Electrification of Passenger Vehicles in India. Berkley, California: LBNL.
Byravan, S., & Ali, M. S. (2017). Quality of life for all: A sustainable development framework for India's climate policy reduces greenhouse gas emissions. Energy for Sustainable Development, 39, 48-58.
Central Electricity Authority. (2017). Power Sector Executive Summary Jan-2017. New Delhi: Ministry of Power.
Department of Heavy Industry. (2012). National Electric Mobility Mission Plan 2020. New Delhi: Ministry of Heavy Industries & Public Enterprises.
Goel, H., & Kumar, V. (2013). Automobiles- Sixth Gear. Kotak Institutional Equities.
Government of India. (2016, January 7). Peak Demand and Peak Power Supply during April 2015 – September 2015. Retrieved from community.data.gov.in: https://community.data.gov.in/peak-demand-and-peak-power-supply-during-april-2015-september-2015/
Indiastat.com. (n.d.). Total Number of Registered Motor Vehicles in India (1951, 1956 and 1959 to 2015). Retrieved August 2017, 17, from https://www.indiastat.com/transport/30/vehicles/289/registeredvehicles/16443/stats.aspx
Ravinder, K., & Madhu, E. (2014). Vehicular emissions based on vehicle kilometres travelled from road sector at national level in India. New Delhi: CRRI.
Tongia, R. (2017, May 12). The Future of Electric Vehicles in India. Retrieved from livemint: https://www.livemint.com/Opinion/EOeIutAWfkMFl2r82z1bnI/The-future-of-electric-vehicles-in-India.html

About Brookings IndiaEstablished in 2013, Brookings India is an independent Indian research institution working towards improving governance across different areas of public policy in our country. Our single-focused mission is to produce and promote independent and high quality research that contributes to India’s nation-building. Brookings India is registered as a non-profit institution under Section 8 of the Companies Act 2013 (formerly Section 25 of the Companies Act, 1956). All our research products and publications are online and available for free to all.
About the Impact SeriesBrookings India’s fundamental objective is to contribute meaningfully to the process of designing solutions for India’s policy problems. We aspire to do this in a way which fully reflects the core values of analytical quality and independence of views. We believe that policy recommendations based on these two attributes are most likely to have a positive impact on outcomes.
Since we began our activities in 2013, we have been active in three broad domains: Economic Development, Foreign Policy, and Energy & Sustainability. We have initiated research on several issues within these domains and, simultaneously, organised a regular series of conversations between various stakeholders, who bring their particular perspective to the discussions in a constructive way. These activities have helped us to understand the nature of specific problems in each domain, gauge the priority of the problem in terms of India’s broad development and security agenda and develop a network of people who think deeply about these issues.
In this series of policy papers, the authors offer concrete recommendations for action on a variety of policy issues, emerging from succinct problem statements and diagnoses. We believe that these papers will both add value to process of policy formulation and to the broader public debate amongst stakeholders, as opinion converges on practical and effective solutions.
Many of the papers are written by Brookings India researchers, but, in keeping with our objective of developing and sustaining a collaborative network, we have invited a few experts from outside the institution to contribute to the series as well.
We look forward to active engagement with readers on the diagnoses and recommendations that these papers offer. Feedback can be sent directly to the authors.

w w w . b r o o k i n g s . i n