electronic supplementary · pdf filewere obtained on a matrix-assisted laser ... measured by...
TRANSCRIPT

1
Electronic Supplementary Information
Inner Salt-Shaped Small Molecular Photosensitizer with Extremely Enhanced Two-Photon Absorption for Mitochondrial-Targeting Photodynamic Therapy
Wenbo Hu, Tingchao He, Rongcui Jiang, Jun Yin, Lin Li, Xiaomei Lu, Hui Zhao, Lei Zhang, Ling Huang, Handong Sun, Wei Huang* and Quli Fan*
Electronic Supplementary Material (ESI) for ChemComm.This journal is © The Royal Society of Chemistry 2017
2
1. Experimental details
Materials: 2, 2-((2, 5-diiodo-1, 4-phenylene) bis (oxy)) bis (N, N-diethylethanamine)
(monomer 2) was reported in our previous literature1 and used as received. The
methyl 4-ethynylbenzoate (monomer 1), 2, 2'-((2,5-diiodo-1,4-phenylene) bis (Oxy))
bis (N, N-diethylethanamine) (DBD), and 4, 4'-((2,5-bi's (2-(diethylamino) ethoxy) -
1,4-phenylene) bis (ethyne-2,1-diyl)) dibenzoic acid (DBA) were synthesized
according to the literature procedures.[1] N-acetyl-L-cysteine (NAC) and 2',7'-
dichlorfluorescein-diacetate (DCFH-DA) was purchased from Sigma-Aldrich (St.
Louis, MO, USA). Anti-PARP1 (9532), anti-cleaved Caspase-3 (Asp175), anti-β
tubulin (ab6046) and HRP-conjugated secondary antibody (7074S) were purchased
from abcam or Cell signal, respectively. Unless otherwise noted, all reagents were
purchased from Sigma Aldrich and used without additional purification. All other
solvents were purchased from either Fisher Scientific or Aldrich and used as received.
Characterization: NMR spectra were recorded on a Bruker Ultra Shield Plus 400
MHz spectrometer (1H: 400 MHz, 13C: 100 MHz) and referenced to tetramethylsilane
(TMS) as the internal standard, the following abbreviations are used to explain the
multiplicities: s=singlet, d=doublet, t=triplet, q=quartet, m=multiplet. Mass spectra
were obtained on a matrix-assisted laser desorption/ionization time of flight mass
spectrometry MS (MALDI-TOF, Bruker AutoFlex III system). Single-crystal X-ray
crystallography was carried out on a Bruker SMART APEX-II CCD diffractometer
equipped with graphite monochromated Mo-K radiation. The steady-state absorption
data and photoluminescence spectra were measured by a Shimadzu UV-3600
ultraviolet-visible-near-infrared spectrophotometer and an RF-5301PC
spectrofluorometer, respectively. The time-resolved emission spectra and lifetime
were measured using an Edinburgh FLSP920 fluorescence spectrophotometer
equipped with a picosecond pulsed semiconductor light (EPL375) and a microsecond
flash-lamp (uF900), respectively. The absolute quantum yield measured using an
Edinburgh FLSP920 fluorescence spectrophotometer equipped with an integrating
sphere and a xenon lamp. Two-photon absorption cross sections of molecules were

3
measured by the Z-scan technique using home-built experimental setup.[2] The laser
source is a Ti:sapphire system that produced 100 fs pulses at a repetition of 80 MHz.
All images were acquired on Leica TCS SP5X Confocal Microscope System
equipped with Leica HCX PL APO 63x/1.20 W CORR CS, 405 nm Diode laser,
white laser (470 nm to 670 nm, with 1 nm increments, with 8 channels AOTF for
simultaneous control of 8 laser lines, each excitation wavelength provides 1.5 mV),
and Ti-Sapphire laser (~4 W at 800 nm) which corresponded to approximately 1%
(~40 mW at 800 nm) average power in the focal plane. All the calculations were done
with Gaussian09 program (Revision B.01).
Synthetic route for target molecule
Fig.S1. Synthetic route of DBD and DBA.
Methyl 4-ethynylbenzoate (monomer 1)
A 2.1 g (10 mmol) sample of methyl 4-bromobenzoate, 0.55 g (0.5 mmol) of Pd
(PPh3)4 and 0.112 g (0.6 mmol) of CuI were dissolved in 30 ml of diisopropylamine
(DIPA). 5.6 ml (36 mmol) of (trimethylsilyl) acetylene was added into the vigorously
stirred solution at room temperature for 30 min under nitrogen protection. The

4
reaction mixture was stirred at reflux for 24 h. After the mixture was filtered, the
solvent was evaporated under reduced pressure; the residue was poured into 100 mL
of water and extracted with chloroform three times. The organic layer was separated
and washed with water three times and brine once and dried over MgSO4. After the
solvent was evaporated, the above mentioned compound was dissolved in 30 mL of
THF and K2CO3 aqueous solution (4 g in 50 mL water) was added dropwise at room
temperature and stirred for 60 min. After the stirring, the obtained light yellow
organic layer was separated and the water layer was extracted with chloroform three
times. The combined organic layers were washed with water twice and brine once and
dried over MgSO4. The mixture was filtered, the crude product was purified by
chromatography using petroleum and the filtrate was evaporated by rotary evaporator
to afford 1.3 g yellow crystals (yield 83.1%). 1H NMR (CDCl3, 400 MHz): 8.07 –
7.91 (m, 2H), 7.60 – 7.50 (m, 2H), 3.92 (s, 3H), 3.23 (s, 1H). 13C NMR (CDCl3, 100
MHz):165.94, 132.93, 129.54, 82.37,51.58. GC-MS (m/z): Calcd for C8H10O2 [M]+,
160.1; found, 159.9.
4, 4-((2, 5-bis (2-(diethylamino) ethoxy)-1, 4-phenylene) bis (ethyne-2, 1-diyl)) dibenzoate (DBD)
A 0.5 g (3.1 mmol) sample of methyl 4-ethynylbenzoate, 0.8 g (1.4 mmol) 2,2'-
((2,5-diiodo-1,4-phenylene) bis (Oxy)) bis (N, N-diethylethanamine) (monomer 2),
0.12 g (0.1 mmol) of Pd (PPh3)4, 0.052 g (0.2 mmol) Triphenylphosphane and 0.019 g
(0.1 mmol) CuI were charged in a 250 mL round-bottom flask. Under nitrogen
protection, added degaussed DIPA (30 mL) and THF (20 mL). The reaction mixture
was stirred at reflux for 24 h under nitrogen protection. After removal of excess DIPA
by rotary evaporation, the mixture was filtered, the combined organic layer was dried
over anhydrous sodium sulfate, filtered and the solvent was removed by rotary
evaporation. After removing the solvent, the residue was purified by chromatography
using petroleum and dichloromethane (8:1) with triethylamine as the eluent. Remove
eluent by rotary evaporation to give 0.7 g yellow powders (yield 78.5%). 1H NMR
(CDCl3, 400 MHz): 8.09 – 7.97 (m, 4H), 7.63 – 7.53 (m, 4H), 7.04 (s, 2H), 4.11 (t, J =
5.9 Hz, 4H), 3.93 (s, 6H), 2.97 (t, J = 5.9 Hz, 4H), 2.68 (q, J = 7.1 Hz, 8H), 1.07 (t, J =

5
7.1 Hz, 12H). 13C NMR (CDCl3, 100 MHz): 166.57, 153.61, 131.46, 129.52, 128.03,
116.79, 113.74, 94.26, 88.92, 68.48, 52.27, 51.58, 48.00, 12.18. MALDI-TOF-MS
(m/z): Calcd for C38H44N2O6 [M]+, 624.32; found: 624.40.
4,4'-((2,5-bis(2-(diethylamino)ethoxy)-1,4-phenylene)bis(ethyne-2,1-diyl))dibenzoic acid. (DBA)
The abovementioned compound (0.3 g, 0.5 mmol) was dissolved in 30 mL of
dichloromethane and potassium hydroxide aqueous solution (4 g in 30 mL water) was
added dropwise at room temperature and stirred for 60 min. After the stirring, the
obtained water layer was separated and washed with dichloromethane three times.
Diluted hydrochloric acid was added into water layer until the green precipitate not
occur, the green precipitation was filtered and washed with water twice and brine
once and dried over anhydrous sodium sulfate to give 0.25 g green powders (yield
87.2%). 1H NMR (CD3OD, 400 MHz): 8.05 (d, J = 8.4 Hz, 4H), 7.62 (d, J = 8.4 Hz,
4H), 7.35 (s, 2H), 4.52 – 4.45 (m, 4H), 3.74 – 3.67 (m, 4H), 3.42 (q, J = 7.3 Hz, 8H),
1.34 (q, J = 7.6 Hz, 12H). 13C NMR (CD3OD, 100 MHz): 152.94, 131.01, 129.52,
117.02, 113.94, 94.34, 64.27, 50.91, 48.74, 8.10. MALDI-TOF-MS (m/z): Calcd for
C36H40N2O6 [M]+, 596.29; found: 596.45.
Theoretical model. The density functional theory (DFT) were performed to study the
singlet geometries of neutral and anion states by exchange-correlation functional
B3LYP and the unrestricted formalism (UB3LYP), respectively, together with basis
sets 6-31G(d, p). All the optical transition matrix elements and corresponding
excitation energies were calculated using time-dependent DFT (TD-DFT) based on
range-separated functional CAM-B3LYP/6-31G(d, p) method. The solvation effects
in methanol and THF used as solvents in the measurement were taken into account
with the conductor-like polarizable continuum model (CPCM). For simulate the TPA
cross sections, the lowest 100 excited states were taken account as the transition
dipole moments for higher exited states are small. All the calculations were done with
Gaussian09 program (Revision B.01).
The TPA process corresponds to simultaneous absorption of two photons. The
TPA efficiency of an organic molecule, at optical frequency ω/2π, can be

6
characterized by the TPA cross section δ(ω). It can be directly related to the
imaginary part of the second hyperpolarizability by[3] 1 2 3γ ; , ,
2
1 2 32 20
3δ ω γ ; , ,2
Imn c
hò
where is the excitation energy, c is the speed of light, and is the vacuum electric ℏ𝜔 𝜀0
permittivity; n means the refractive index of the medium; ω1, ω2, and ω3 are optical
frequencies, and is the polarization response frequency.1 2 3
The two-photon transition matrix elements can be identified from the sum-over-states
(SOS) formula, and the SOS equation for second hyperpolarizability γ is.[4]
1 2 3
0 0
0 0 0 2 3 31 2 3
0 0
0 0 1 3
ˆ
; , ,
, , ,
ABCD
A B C Di ij jk k
i j k i j k
A B C Di ij jk k
i j i i j
P A B C D
where A, B, C, and D are the molecular axes; 0 refer to the ground state and i, j, and k
denote excited states; µ is the component of the dipole operator. To compare the
calculated TPA cross section (δ) value with the experimental value measured in
solution, the orientationally averaged value of γ is evaluated, which is
1/ 5avg xxxx yyyy zzzz xxyy yyzz yyxx zzxx zzyy
1O2 quantum yield measurement by detecting 1O2 emission. One-photon
excitation singlet oxygen generation was directly monitored by the characteristic
emission of 1O2 at ∼1270 nm in D2O solution. The 1O2 emission was measured by
using FluoroLog-3 spectrofluorometer (Jobin-Yvon) equipped with a more near-
infrared sensitive photomultiplier (Hamamatsu model: DSS-IGA (1.9) 010L). An 850
nm long pass filter was placed before the detector. Considering the short
phosphorescence luminescence (PL) lifetime of 1O2 in water, the DBA solution was
lyophilized. TMPyP4 in D2O was used as the reference (r), and = 74% in water.28 Φr
The 1O2 quantum yield of the DBA can be calculated according to
7
Φ Φ DBADBA r
r
II
Where IDBA and Ir represent the PL peak areas of 1O2 produced by the DBA and
TMPyP4, respectively.
Procedure for cell imaging. Hela cells were seeded in glass-bottom dishes
(Mattek) and grown till 70 ~ 80% confluency. Subsequently, cells were incubated
with DBA (2 μM prepared in fresh media from a buffer stock) for 2 h, and then
further incubated with 200 nM of the Mito-tracker. Cells were then washed three
times with PBS, then imaged with the Leica TCS SP5X Confocal Microscope System.
Images of DBA stained cells were collected at 420 ~ 500 nm by using a Ti-Sapphire
laser excitation wavelength at 720 nm. Background signals of all images were verified
to be nearly zero by imaging the same cells treated with a buffer control.
MitoTracker® Red CMXRos dye was from Invitrogen (Ex = 550 nm, PMT range:
570 ~ 650 nm).
Subcellular fractions separation. Hela cells were seeded in 6-well plates and
incubated at 37 oC with 5% CO2 overnight. Before collection, cells were incubated
with DBA (10 µM) for 2 h. The cell pellets were lysed in mitochondria isolation
buffer (10 mM Tris-HCl, 0.3 M sucrose, 0.5 mM EDTA, pH 7.4) with proteinase
inhibitors. To release mitochondria from the cells, the lysates were applied to 27G
needle for 90 times till 90% cells were broken (as determined by visual inspection
under a light microscope). The lysates were spun at 4 oC at 100 g for 5 min to remove
unbroken cells. The supernatant was collected and spun at 4 oC at 8000 g for 20 min,
giving rise to two different fractions (soluble and pellet). The mitochondrial fraction,
now isolated in the pellet fraction, was further sonicated in lysis buffer (PBS with 1%
SDS and proteinase inhibitors). The above soluble fraction, which contains mostly
cytosolic cellular components, was tested alongside for comparison. Subsequently, the
presence of DBA in the lysates from both the mitochondrial and cytoplasmic fractions
were assessed on a Perkin-Elmer LS50 spectrofluorometer.
Cell viability. XTT colorimetric cell proliferation kit (Roche) was used to
determine cell viability according to manufacturer’s guidelines. Briefly, cells were

8
grown to 20 ~ 30% confluence (since they will reach ~90% confluence with 24 h in
the absence of compounds) in 96-well plates. The medium was aspirated and then
treated with media (0.1 mL) containing different amounts of DBA or TMPyP4. After
incubation for 24 h, proliferation was assayed by using the XTT colorimetric cell
proliferation kit (Roche). A total of three replicas were performed.
Intracellular 1O2 detection. Hela cells were cultured in confocal microscope dishes
to 20~30% confluence in complete DMEM medium and cultured for 24 h. Then, the
medium was aspirated, washed with PBS, treated with medium containing 20 µM
DBA for 2 h, and then further incubated with 10 µM 1O2 probe DCFH-DA. After
incubation for 20 min, the cells were washed again and exposed under two-photon
confocal laser at 750 nm for 5 min to generate 1O2. The green fluorescent signals of
DCF at 505 nm ~ 555 nm were captured under the irradiation at 488 nm by using
laser confocal microscopy.
TP-PDT. Hela cells were grown to 20 ~ 30% confluence (since they will reach
~90% confluence with 24 h in the absence of compounds) in 96-well plates. The
medium was aspirated and then treated with media (0.1 mL) containing 2 μM of DBA
or TMPyP4. After incubation for 24 h, cells were washed using PBS and re-cultured in
a serum-containing DMEM medium. Each well was exposed to 1 kHz femtosecond
laser irradiation at 750 nm with power density of ∼1.0 W cm−2. Cells after PDT
treatments were further incubated for 24 h for apoptosis followed by the XTT assay of
the cell proliferation. Cell experiments without DBA under the same experimental
conditions were performed for direct comparison.
Western blotting assay. The cells in 96-well were directly lysed with 20 L 1× SDS
loading buffer for Western blotting assay (1 : 1000 for primary antibody if there is no
specific highlight), and resolved on SDS-PAGE and transferred onto a nitrocellulose
membrane (Hybond ECL, Amersham Pharmacia Biotech). The membrane were then
blocked with 25 mM Tris-HCl, pH 7.4, 137 mM NaCl, 2.68 mM KCl, and 0.05%
Tween 20 containing 5% nonfat milk for 1 h at room temperature. Membranes were
incubated with primary antibodies, such as, anti-PARP1, anti-Cleaved Caspase-3 and
anti-Tublin (1:5000) shaking 4°C overnight. HRP conjugated secondary antibody

9
(1:1000) is added at room temperature for 1 h. The antibody-reactive bands are
visualized by chemiluminescent detection (ECL western detection kit; Amersham
Pharmacia Biotech).
Statistical analysis: The statistical analysis of the samples was undertaken using a
Student’s t-test, and p-values < 0.05 were considered statistically significant. All data
reported are means ± standard deviations, unless otherwise noted.
2 Figure and Table
2.1 Characterization of inner salt-shaped DBA
Fig.S2. 1H NMR spectrum (400 MHz, 298 K) of DBD in Chloroform-d with concentration of 2 mM.

10
Fig.S3. 13C NMR spectrum (100 MHz, 298 K) of DBD in Chloroform-d with
concentration of 2 mM.
Fig.S4. 1H NMR spectrum (400 MHz, 298 K) of DBA in Methanol-d with concentration of 2 mM. The absence of the peak at 3.93 (s, 6H) ppm in DBA indicating successfully de-methoxy while all signals corresponding to the nitrogen atoms shift to the lower field suggesting the formation of inner salt between carboxyl group and tertiary amine.

11
Fig.S5. 13C NMR spectrum (100 MHz, 298 K) of DBA in Methanol-d with
concentration of 2 mM.
Fig.S6. Crystal structure diagrams of compound DBD (left) and DBA (right).
Table S1. Structure data of DBD and DBA single crystals.
Name DBD DBA
Formula C38H44N2O6 C36H40N2O6
Wavelength (Å) 0.71073 1.54178
Space Group P 21/n P 4/n
Cell Lengths (Å)a 6.156 (2),b 23.845 (10),c 12.467 (5)
a 31.236 (8),b 31.236 (8),c 8.080 (3)
12
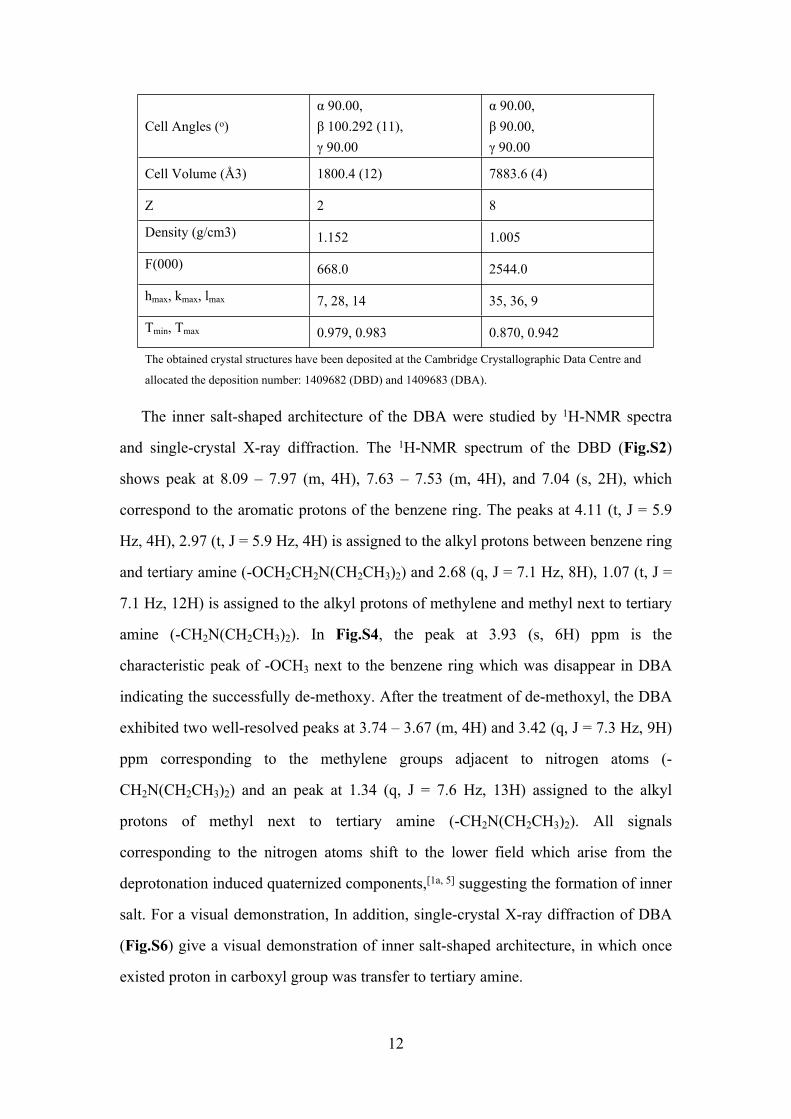
Cell Angles (o)α 90.00,β 100.292 (11), γ 90.00
α 90.00,β 90.00, γ 90.00
Cell Volume (Å3) 1800.4 (12) 7883.6 (4)
Z 2 8
Density (g/cm3) 1.152 1.005
F(000) 668.0 2544.0
hmax, kmax, lmax 7, 28, 14 35, 36, 9
Tmin, Tmax 0.979, 0.983 0.870, 0.942
The obtained crystal structures have been deposited at the Cambridge Crystallographic Data Centre and
allocated the deposition number: 1409682 (DBD) and 1409683 (DBA).
The inner salt-shaped architecture of the DBA were studied by 1H-NMR spectra
and single-crystal X-ray diffraction. The 1H-NMR spectrum of the DBD (Fig.S2)
shows peak at 8.09 – 7.97 (m, 4H), 7.63 – 7.53 (m, 4H), and 7.04 (s, 2H), which
correspond to the aromatic protons of the benzene ring. The peaks at 4.11 (t, J = 5.9
Hz, 4H), 2.97 (t, J = 5.9 Hz, 4H) is assigned to the alkyl protons between benzene ring
and tertiary amine (-OCH2CH2N(CH2CH3)2) and 2.68 (q, J = 7.1 Hz, 8H), 1.07 (t, J =
7.1 Hz, 12H) is assigned to the alkyl protons of methylene and methyl next to tertiary
amine (-CH2N(CH2CH3)2). In Fig.S4, the peak at 3.93 (s, 6H) ppm is the
characteristic peak of -OCH3 next to the benzene ring which was disappear in DBA
indicating the successfully de-methoxy. After the treatment of de-methoxyl, the DBA
exhibited two well-resolved peaks at 3.74 – 3.67 (m, 4H) and 3.42 (q, J = 7.3 Hz, 9H)
ppm corresponding to the methylene groups adjacent to nitrogen atoms (-
CH2N(CH2CH3)2) and an peak at 1.34 (q, J = 7.6 Hz, 13H) assigned to the alkyl
protons of methyl next to tertiary amine (-CH2N(CH2CH3)2). All signals
corresponding to the nitrogen atoms shift to the lower field which arise from the
deprotonation induced quaternized components,[1a, 5] suggesting the formation of inner
salt. For a visual demonstration, In addition, single-crystal X-ray diffraction of DBA
(Fig.S6) give a visual demonstration of inner salt-shaped architecture, in which once
existed proton in carboxyl group was transfer to tertiary amine.

13
2.2 Room-temperature OP-related optical properties investigation
Fig.S7. OP-related optical properties of DBD and DBA. (a) Concentration dependence of the absorption of DBD in THF. (b) The plot of optical density at 381 nm versus concentration. The straight line is a linear least-squares fit to the data, indicating the effective molar extinction coefficient of DBD at the absorption maxima. (c) Concentration dependence of the absorption of DBA in methanol solution. (d) The plot of optical density at 356 nm versus concentration. The straight line is a linear least-squares fit to the data, indicating the effective molar extinction coefficient of DBA at the absorption maxima. (e) Fluorescence quantum yield of DBD in THF measured at the concentration of 1×10⁻⁵ M. (f) Fluorescence quantum yield of DBA in methanol solution measured at the concentration of 1×10⁻⁵ M. (g) Fluorescence decay curve of DBD and DBA recorded at max emission peak with a pulse laser at 375 nm. Green line and blue line: fitting of the fluorescence decay curve with monoexponential decay (τ=1.08 ns for DBD, τ=2.23 ns for DBA).
14
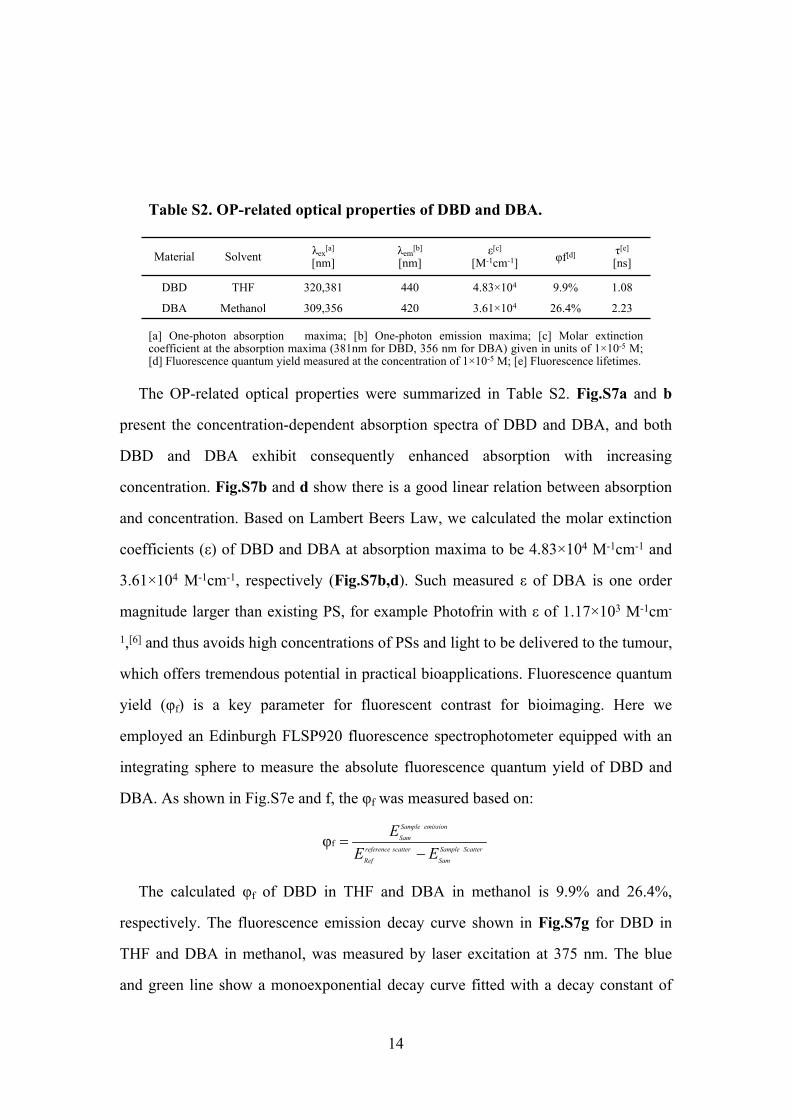
Table S2. OP-related optical properties of DBD and DBA.
Material Solvent λex[a]
[nm]λem
[b]
[nm]ε[c]
[M-1cm-1] φf[d] τ[e]
[ns]
DBD THF 320,381 440 4.83×10⁴ 9.9% 1.08
DBA Methanol 309,356 420 3.61×10⁴ 26.4% 2.23
[a] One-photon absorption maxima; [b] One-photon emission maxima; [c] Molar extinction coefficient at the absorption maxima (381nm for DBD, 356 nm for DBA) given in units of 1×10⁻⁵ M; [d] Fluorescence quantum yield measured at the concentration of 1×10⁻⁵ M; [e] Fluorescence lifetimes.
The OP-related optical properties were summarized in Table S2. Fig.S7a and b
present the concentration-dependent absorption spectra of DBD and DBA, and both
DBD and DBA exhibit consequently enhanced absorption with increasing
concentration. Fig.S7b and d show there is a good linear relation between absorption
and concentration. Based on Lambert Beers Law, we calculated the molar extinction
coefficients (ε) of DBD and DBA at absorption maxima to be 4.83×10⁴ M-1cm-1 and
3.61×10⁴ M-1cm-1, respectively (Fig.S7b,d). Such measured ε of DBA is one order
magnitude larger than existing PS, for example Photofrin with ε of 1.17×10³ M-1cm-
1,[6] and thus avoids high concentrations of PSs and light to be delivered to the tumour,
which offers tremendous potential in practical bioapplications. Fluorescence quantum
yield (φf) is a key parameter for fluorescent contrast for bioimaging. Here we
employed an Edinburgh FLSP920 fluorescence spectrophotometer equipped with an
integrating sphere to measure the absolute fluorescence quantum yield of DBD and
DBA. As shown in Fig.S7e and f, the φf was measured based on:
f
φSample emission
Sam
reference scatter Sample Scatter
Ref Sam
EE E
The calculated φf of DBD in THF and DBA in methanol is 9.9% and 26.4%,
respectively. The fluorescence emission decay curve shown in Fig.S7g for DBD in
THF and DBA in methanol, was measured by laser excitation at 375 nm. The blue
and green line show a monoexponential decay curve fitted with a decay constant of

15
1.08 ns for DBD and 2.23 ns for DBA, indicative of only one existing species for
DBD or DBA in its exited state.
2.3 Verification of two-photon absorption process
To further determine the number of photons involved in such nonlinear process,
the intensities of the emissions at 420 nm are recorded as a function of the excitation
power density in ln-ln plots based on the following equation:[2b]
Equation. 1 ln ln B nem exI I
Here, Iem and Iex are the emission and excitation intensities of TPA molecules,
respectively. B is a constant and n is the number of photons involved in the multi-
photon energy upconversion process. Insert in Fig.S8a and b show the fluorescence
emission intensity increases along the excitation power density at 720 nm
femtosecond laser. From the equation, the number of photons involved for this
upconversion process were calculated to be 1.998 for DBD and 2.008 for DBA,
respectively, which proves the TPA process.
2.4 Exclusion of linear absorption for DBA in two-photon absorption region
Fig.S8. (a) TP-fluorescent intensity of DBD at different excitation power density in THF. Insert shows the power dependence of the TP-fluorescent intensity on the femtosecond laser. (b) TP-fluorescent intensity of DBA at different excitation power density in methanol solution. Insert shows the power dependence of the TP-fluorescent intensity on the femtosecond laser.

16
To exclude the influence of linear absorption of DBA in methanol or DBD in
THF, the transmission spectra for DBA in methanol or DBD in THF were measured.
Both samples have negligible linear absorption in the biological tissue transparency
window of 650 - 800 nm (Fig.S9), excluding the influence of linear absorption of
samples and solvent.
2.5 Triplet lifetime of DBA
Fig.S9. Transmission spectra of DBD in THF and DBA in methanol.
Fig.S10. Luminescence decay curve (red line) of DBA monitored at 480 nm under oxygen-free environment with an excitation of 375 nm. Green line: fitting of the fluorescence decay curve. Fit=A+B1exp (-τ/τ1)+B2exp (-t/τ2); τ1=1.32 μs, τ2=10.85 μs).

17
The triplet excited state lifetime was also evaluated to be 10.85 μs (70%) and
1.32 μs (30%) from the fitting of the emission decay as shown in Fig.S10, which is
long enough to interact with molecular oxygen to yield 1O2.
2.6 Feasibility of DBA for bioapplications
The XTT colorimetric cell proliferation kit was employed to determine the dark-
cytotoxicity of DBA. No significant cytotoxicity was observed in Fig.S11a even
when the concentration of DBA increased to 50 μM, implying super low dark-
cytotoxicity. Meanwhile, the biocompatibility was also investigated through a typical
protocol in which DBA soluble in PBS and serum solutions were recorded after
centrifugation at 6000 rpm for 5 min (Hyclone was diluted in PBS to prepare serum
solution).[7] No obvious precipitation was observed suggesting the excellent
biocompatibility in both PBS and serum (Fig.S11b).
2.7 Chemical stability of DBA
Fig.S11. (a) Dark-cytotoxicity of Hela cells after incubation with DBA of different concentrations for 24 h. (b) DBA in PBS and serum solutions were recorded after centrifugation at 6000 rpm for 5 min. No obvious precipitation was observed suggesting the excellent biocompatibility in both PBS and serum.

18
Fig.S12. The absorption spectra of 1.0 μM DBA in PBS buffer (pH 7.5) with/without 10 % serum labeled as PBS/Serum, respectively. No obvious spectral changes indicate the excellent chemical stability in physiological environment.
2.8 Optical interference between DBA and MTR
Fig.S13. The UV-absorption and PL spectra of DBA and MTR. The negligible overlap between absorption of MTR and fluorescence of DBA excludes the disturb influence.
To unambiguously determine the mitochondrial-targeting of DBA, a standard co-
staining experiment was performed with DBA and a commercial probe (MTR), while
the prerequisite of co-localization experiment is that no optical and chemical
interferences exist between two dyes. As such, the absorption and fluorescence

19
properties of DBA and MTR were carefully studied and the final results demonstrate
that DBA and MTR negligibly disturbed each other (Fig.S13).
2.9 Isoelectronic point (pI) estimation
Fig.S14. The pH-dependent adsorption profiles of DBA, The arrow indicates the isoelectric point of DBA. The isoelectric point at 7.54 assure the positive-charged state of DBA in biological condition.
The key to target mitochondria is the electrostatic interactions between positive-
charged mitochondrial-targeting groups and negative-charged membrane of
mitochondria. Therefore, the isoelectronic point (pI) of DBA was measured via pH-
dependent binding analysis,[8] in which strong ions exchanger (SP-Sephadex A-50)
was utilized due to the fact that its capacity is constant over a much wider pH range
than are those of the weak ones.[9] Two plateaus were seen in Fig.S14. The lower one
represents the pH range where DBA carry the charge with the same sign as that of the
ion exchanger and therefore remain unbound in the supernatant. The higher one
represents the region where DBA are totally bound to the ion exchanger. The
inflection reflects the change of the binding affinity of DBA due to the change of its
charge characteristic. The midpoint of the transition is considered to be the isoelectric
pH for DBA where there is no overall net charge on the DBA. In particular, the
evaluated pI of 7.54 in Fig.S14, whether in a normal cell (pH = 6.8 - 7.2) or tumor

20
environment (pH = 6.5 - 6.8),[10] affords DBA weak positive-charged state, providing
a high possibility to target mitochondria.
2.10 Reactive oxygen species generation in intracellular environment
Fig.S15. Micrographs of reactive oxygen species generation in HeLa cells co-incubated with DBA and DCFH-DA with or without a two-photon confocal laser (750 nm) irradiation. The obvious green fluorescence of DCF in Hela cells after TPE compared to that without TPE demonstrates the reactive oxygen species (e.g., 1O2) generation of DBA in intracellular environment.
3 References
[1] Q. L. Fan, Y. Zhou, X. M. Lu, X. Y. Hou, W. Huang, Macromolecules 2005, 38, 2927-2936.
[2] a) T. He, P. C. Too, R. Chen, S. Chiba, H. Sun, Chem.--Asian J. 2012, 7, 2090-2095; b) T. He, Z. B. Lim, L. Ma, H. Li, D. Rajwar, Y. Ying, Z. Di, A. C. Grimsdale, H. Sun, Chem.--Asian J. 2013, 8, 564-571.
[3] D. Beljonne, W. Wenseleers, E. Zojer, Z. Shuai, H. Vogel, S. J. K. Pond, J. W. Perry, S. R. Marder, J. L. Brédas, Adv. Funct. Mater. 2002, 12, 631-641.
[4] a) K. Sasagane, F. Aiga, R. Itoh, J. Chem. Phys. 1993, 99, 3738-3778; b) T. Lu, F. Chen, J. Comput. Chem 2012, 33, 580-592.
[5] B. Liu, W. L. Yu, Y. H. Lai, W. Huang, Macromolecules 2002, 35, 4975-4982.[6] D. E. J. G. J. Dolmans, D. Fukumura, R. K. Jain, Nat. Rev. Cancer 2003, 3,
380-387.

21
[7] a) W. Hu, X. Lu, R. Jiang, Q. Fan, H. Zhao, W. Deng, L. Zhang, L. Huang, W. Huang, Chem. Commun. 2013, 49, 9012-9014; b) Z. Liu, J. T. Robinson, X. Sun, H. Dai, J. Am. Chem. Soc. 2008, 130, 10876-10877.
[8] R. N. Farías, A. E. López Viñals, E. Posse, R. D. Morero, Anal. Biochem. 1989, 264, 285-287.
[9] V. C. Yang, R. Langer, Anal. Biochem. 1985, 147, 148-155.[10] M. Stubbs, P. M. J. McSheehy, J. R. Griffiths, C. L. Bashford, Mol. Med.
Today 2000, 6, 15-19.