electronics technology and devices lab fort mon--etc … · ada9 7 army electronics technology and...
TRANSCRIPT

ADA9 7 ARMY ELECTRONICS TECHNOLOGY AND DEVICES LAB FORT MON--ETC F/0 9/5FUNDAMENTAL. LIMITATIONS OF ELECTRON BEAM LITHOGRAPHY FOR FIJTURE--ETC (U)JUN S0 J IAFRATE. J N HELBERT, A T BALLATO
NSCLASIFIEO PG.
-m IND

11111 132 111225
1111112.8
11111_L.25 1.j(4 11111 1.6
MICROCOPY RESOLUTION TEST CH-ART

IAFRATE, HELBERT, BALLATO,
COOK, and McAFEE -.
L'-I
FUNDAMENTAL LIMITATIONS OF ELECTRON BEAM LITHOGRAPHYFOR FUTURE MILITARY IC DEVICE FABRICATION> (U-)
_- - ...... ,--- ".JUNd teen
/ G. J.JIIAFRATEf - J. N./IHELBERT~,, A. T. /ALlA i940C. . ICOOK, Jr. .S McAFEErPhD.
USA ELECTR TEC1t OLOGY AND D Tf E6'1BORATORY (ERADCOM)FORT MONMOUTH, NEW JERSEY 07703 /
INTRODUCTION
Future military requirements for real-time information acquisitionand tactical electronic warfare (EW) information processing have es-tablished a need for very large scale (VLSI) and very high spped (VHSI)integrated circuit microelectronics. Both VLSI and VHSI technologiesrequire a high areal density of integrated circuit (IC) elements there-by dictating a reduction of device size into the submicron and ultra-submicron regions.
The requisite miniaturization of military IC devices into the sub-micron and ultra-submicron region raises serious questions regardingthe use of electron beam lithography (EBL) as an appropriate fabrica-tion technique for this end. In EBL an intermediate energy (5-20 keV)electron beam exposes a radiation sensitive target (such as the polymerPMMA) overlaid on an IC device substrate; a subsequent chemical de-velopment treatment removes the exposed region leaving an outline ofthe pattern sketched by Phe electron beam (e-beam) when employing apositive-acting resist.l athe e-beam technique is attractive because itleads to the production of micron to submicron resolved channels and
also lends itself to computer-controlled production-line automation,0. However, we find that the use of an e-beam introduces certain diffi-
culties in that electrons penetrating the target scatter away from theC.) incident electron beam thereby causing unintended exposure to other
regions of the target; also, the penetrating electrons are generallyenergetic enough to reach and backscatter from the IC substrate thustending to expose unintended regions of the resist as well. This scat-tering and backscattering leads to a widening and distortion of the ex-
Cposed region and results in a degradation of the resolution of two
f777 7 ~295 LobonaprovedI "3X 11 OCT 1 6 19801" S"! .U :-., :,n in ,r!~e...'.., . -.-
SCA-80 10 16 20
* :1 ,'4icy 4

IAFRATE, HELBERT, BALLATO,COOK, and McAFEE
parallel e-beam lines. It is clear from this study that the ultimate
resolution of the e-beam process is determined by electron scattering
effects in the resist material and by electron backscattering from the
device substrate, and not by the resolution of the electron-optical
system. In this paper we assess the merit of the e-beam fabrication
technique for use in very high speed integrated circuit (VHSIC) tech-
nology. A study is presented which describes the electron scattering
and backscattering processes in electronic materials. A theoretical
study describing primary electron backscattering from single- and
double-layered substrates is presented; also attention is focused on
the question of the spatial region exposed by a scattered electron
beam in a lithographic resist material. Experimental electron back-
scattering, e-beam and scanning electron microscopy studies are pre-
sented to corroborate theoretical predictions.
ELECTRON BACKSCATTERING
Many phenomena, such as polymer bond breaking, x-ray production,
cathodoluminescence, electron-hole pair generation in semiconductors
and insulators, etc., result from the inelastic interaction of a highenergy (1-50 keV) electron beam with matter. Numerous primary electronbackscattering studies, both experimental and theoretical, have been
carried out in an effort to understand the dominant mechanisms forelectron scattering and energy loss arising from the electron beam-
target interaction. Most theoretical treatments (1-3) of electronbackscattering are limited in usefulness, suffering either from severephysical approximations or mathematical complexity. However, the re-
cent theoretical extension (4) of Everhart's theory (1) to include thecalculation of energy distribution spectra has stimulated a renewed
interest in this simple analytic approach.In this paper we make use of Everhart's theory (1,4) to describe
electron backscattering from solids, double layers, and supported thinfilms. [Due to limitations in space, only salient features of thetheory will be discussed throughout the paper. Detailed theoretical
analyses and discussions can be found in the references cited.] Ever-hart's theory assumes that primary electrons, upon entering a solidtarget, suffer energy loss in accordance with the Thomson-Whiddington
(T-W) law and undergo changes in direction via single large-angle(greater than 900) Rutherford scatters. Moreover, electrons that are
scattered through angles less than 90 are treated as if they are notscattered at all.
The T-W energy-loss law asserts that the energy loss associatedwith a typical particle at a given depth into the target is inverselyproportional to the energy of the particle at that depth. Thus, inmaking use of the assumptions of Everhart's theory, the relative number
of electrons backacattered from a solid target of atomic number Z with
296
. tC i . /o

IAFRATE, HELBERT, BALLATO,
COOK, and McAFEE
energies in the range (EE0 ,E0 ), where E. is the primary electron en-ergy and e is some fraction of E 0, can be calculated as
(a+l)yp - 1 + (l-yo)+ l
ns(c Z) (a+l)yo (1)
where
Yo (1-c) (2)
and
a (0.045)z. (3)
The energy distribution curve (EDC) can be otained, to within afactor (l/E0 ), directly from the absolute value of the first deriva-tive of n.s(E,Z) with respect to E. Figures 1 and 2 show the depen-dence of n (E,Z) and the EDC on C for various values of Z; since e isthe reduced energy with which the least energetic electrons in thebackscattering current, ns(e,Z), escape from the target, it is thenalso thought of as the reduced potential energy required to retardbackscattered electrons with reduced energies less than e from beingcollected by an electron analyzer. Figure 2 indicates two salientfeatures of the EDC as predicted by Everhart's theory, namely, thegeneral "triangular" shape of the curve and the change in curvature ofthe EDC's from concave downward to concave upward with increased Z.
05 oN
05 070
0180
0 0i 02 00 04 05 06 of OS 09 0 0 0' 02 0S 04 00 06 07 OR 09 I0
FLLKMII SWM CKFFrlM FOR Ig TI A Go FO VARIOUS
IETANDIN F ULCMA 0FO L WWMIRN ,UJ
Fig. 1. Fig. 2.
These two features have been observed in the experiments of Kulenkampffand Spyra (5) as shown in Fig. 3. The poor agreement between theoryand experiment for Z = 78 (Pt) in Fig. 3 is expected since diffusion as
297
_-A. ~

IAFRATE, HELBERT, BALLATO,COOK, and McAFEE
given by Archard's theory (2), rather than single scattering in accor-dance with Everhart's theory (1), is believed to be dominant forZ 40. In addition, the lack of agreement between theory and experi-ment for Cu and Al when E 1 is believed to be due to the failure ofthe T-W continuous energy loss law (indeed, any continuous energy losslaw) near the target surface. (6,7)
EERNMT'S TNEPT
III I
S 02 04 .9 $1 ItE
Fig. 3. Comparison of EDC 's of Everhart'stheory with those experiments obtained inref. (6) for Al, Cu, and Pt.
We point out in Fig, 1 that the relative number of electronsbackscattered from reasonably-high-Z solids such as silicon (Z = 14)and gallium arsenide (Z - 33), can be quite high, ranging from 17%to about 35% respectively. For solids with higher nuclear charge,such as gold (Z - 79), the relative number of backscattered electronscan be as high as 65%.
Finally, we note that the backscattering coefficient derived inthis analysis does not depend explicitly on the incident electronenergy when the retarding potential energy, e is zero. This is a re-sult which seems to be consistent with the experimental data reportedby Sternglass (8) and others for primary electron energies above3-5 keV.
Everhart's theory can easily be extended (4) to describe electronbackscattering from double layers and supported thin films. In theanalysis the target is considered to be a double layer consisting ofan infinitely thick substrate covered by an overlying thin film ofthickness D. The thin film and substrate are assumed to have massdensity and average atomic number (p1 , Z ) and (p, Z2 ), respectively.When the maximum depth of electron penetration is less than or equalto the thin film thickness, D, the electrons energetically can onlybackscatter from the thin film; the appropriate backscattering co-
298

IAFRATE, HELBERT, BALLATO,
COOK, and McAFEE
efficient is then given by n5(C,Z) in Eq. (1) with Z replaced by Z1.On the other hand, when the maximum depth of electron penetration isgreater than D, electrons then have sufficient energy to backscatterfrom both thin film and substrate. In this case the backscatteringcoefficient is given by
fl(eZ 1,Z2) -n + 11TF TFS (4)
Here, nTF represents the reflection coefficient for electrons back-scattered from the thin film of thickness D and 'TFS is the reflec-tion coefficient for electrons transmitted through the thin film andthen backscattered from the substrate with sufficient energy to es-cape from the target.
I O77 (E, Z1,Zf I FOR fW LAMt
OR t 0320
012 ~0.24 U
ON r 0 1$- Y 00
1,- OA b"
2 4
Fig. 4. Backacattering coef- Fig. 5. EDC's for double-layerficient for double layer tar- targets. Z, and Z2 refer to thegets. Z1 and Z2 refer to the average nuclear charge of the thinaverage nuclear charge of the film and substrates, respectively;thin film and substrates, re- YD is the reduced thin film thick-spectively; yD is the reduced ness.
thin film thickness.
The backscattering coefficient and the EDC derived therefrom areplotted as functions of e in Figures 4 and 5 for Z, 1 14 and Z- 1S0,and for various values of yD [yD is the reduced thin film thicknessD/R1 , where R, ig the range of electrons in the thin film]. ForE -6 (1-2y ) . the backscattering coefficient veers away from its"bulks thin fim value to accommodate the composite thin film-substrate scattering. This variation in the backscattering coefficient
299

IAFRATE, HELBERT, BALLATO,COOK, and McAFEE
is greatly enhanced in the EDC's of Fig. 5 and is due to the assumeddiscontinuous nature of the interface; a sigmoidal variation in Z andp across the interface should lead to a smooth variation in the EDC's.
Experimentally measured EDC's for double-layer supported thin
film targets appear not to be available in the literature so thatcomparison with theory could not be made. There are, however, manyexperiments, for double layers and supported thin films which relatethe backscattering coefficient to the thin film mass thickness pD andprimary electron energy E0 . Holliday and Sternglass (9) have reportedbackscattering coefficients as a function of primary electron energyfor various double-layer targets. In Fig. 6 we compare the theoreti-cal backscattering coefficient with their results to show good agree-ment.
SERAIT'S TiEORT.5 - LL IA SMW MtAS
4
f OWN AV
2 -o.MM/ Al ,• " . / OVER C
00. 2 4 1 , 1 O I' L 4 - I 4, 4 O
PalMA ENEUT, RevCSRAISM OF 1) NULTILATEf FlNiS OF AM~INUil
OVER WO WS EUMOS WOt MS
Fig. 6.
In addition, Cosslett and Thomas (10) have reported electron back-scattering coefficients as a function of mass density and primary
electron energy for thin films supported on rings. In Fig. 7 we com-pare our backscattering coefficient with experimental results to showreasonable agreement. 0 -.
0.2 -1Fig. 7. Comparison of nTF 1 5
with experiment for Cu.
- EVART'S TNIEO (a.O)- C@SStI~T AM TN10i
00
i 300
-4W
IAFRATE, HELBERT, BALLATO,COOK, and McAFEE
Comparison of theoretically obtained backscattering coefficients
and EDC's with results obtained by experiment yielded good agreement,which is remarkable in view of the simplicity of Everhart's assump-tions and the adopted model for the double-layer interface. Moreover,we have pointed out that, within this model for which we have estab-lished reasonable confidence, the percentage of incident electrons re-flected from a solid or double-layered substrate will increasemonotonically with the atomic number of the reflecting substrate. Itwill be shown in a later section that this behavior affects the reso-lution of closely spaced e-beam lines rather dramatically.
ELECTRON SCATTERING
In this section we address the question of the spatial extent ofelectrons scattered in the target. We do this by making use of themultiple scattering theory of Bethe et al. (11,12) to calculate theaverage cosine between the actual direction of motion and the directionof the primary beam in terms of the average atomic number of the tar-get and the depth of electron penetration into the target. Moreover,we make use of the order-of-magnitude expression for the depth atwhich two e-beam lines overlap in terms of the average atomic numberof the target.
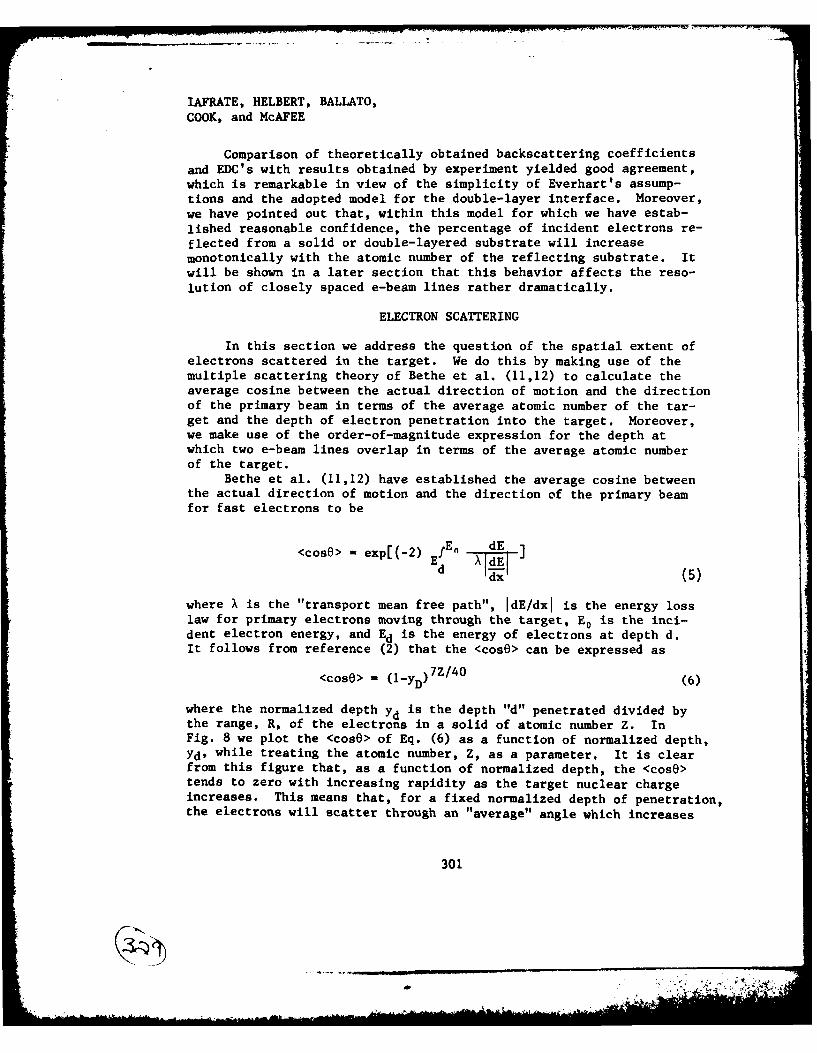
Bethe et al. (11,12) have established the average cosine betweenthe actual direction of motion and the direction of the primary beamfor fast electrons to be
<cosO> - exp[(-2) Ed dE
d jX(5)
where X is the "transport mean free path", IdE/dxl is the energy losslaw for primary electrons moving through the target, E 0 is the inci-dent electron energy, and Ed is the energy of electrons at depth d.It follows from reference (2) that the <cose> can be expressed as
<cose> - (1-yD) 7Z/4 0 (6)
where the normalized depth Yd is the depth "d" penetrated divided bythe range, R, of the electrons in a solid of atomic number Z. InFig. 8 we plot the <cose> of Eq. (6) as a function of normalized depth,
Yd, while treating the atomic number, Z, as a parameter, It is clearfrom this figure that, as a function of normalized depth, the <cosO>tends to zero with increasing rapidity as the target nuclear chargeincreases. This means that, for a fixed normalized depth of penetration,the electrons will scatter through an "average" angle which increases
301

IAFRATE, HELBERT, BALLATO,COOK, and McAFEE
monotonically with target nuclear charge.
Log
®0 5
14
33
0 02 0.4 H 0.1 D
Yd
Fig. 8. Plot of <cosO> as a functionof normalized depth, yD, with averageatomic number, Z, as a parameter,
This finding has significant importance in the light of recentwork reported by IBM (13) on high atomic-numbered (Z) acrylic polymerresist compositions. IBM has studied Thallium (Z = 81) and cesium(Z = 55) substituted methacrylic acid copolymers which have average
atomic numbers (Z) higher than Z-values of well-known resist polymerssuch as poly(isobutyleno)(Z = 2.6), poly(methyl methacrylate)(PMMA)(Z = 3.6), and poly(batene-l-sulfone)(Z = 4.1); the value of Z for100% cesium-substiuted acrylic polymer resist is 11. In a later sec-tion electron scattering in the resist will be shown to be a factorgoverning e-beam pattern resolution.
One can make use of the <cose> calculation to establish the de-pendence of the undercutting on target nuclear charge of two equallyexposed parallel electron-beam lines. We define L, somewhat arbi-trarily, as the depth at which electrons scattered from each beam mu-tually expose the region of the target midway between the two electron-beam lines. The depth L is then determined by setting the <cosO>equal to the geometrical cosine, cose - 1/[l + 1/4(D/L)2] , depictedin Fig. 9. We set the <cose> in Eq. (§) [with d = L equal to cosegto obtain an analytical expression for the normalized depth,. as
(1-f)7Z/4 0 = 1/[l + 1!4(Z/4)2 ] 1 (8a)
with
=D/Rp C -L/ b)
302
2,

IAFRATE, HELBERT, BALLATO,COOK, and McAFEE
a-b-om -beom L
VACUUM i0U
1 TARGET
I
1 D/2 I JD
Fig. 9. Diagram depicts two Fig. 10. Plot of reduced depth;,e-beams, separated by a dis- as a function of reduced separa-tance D, striking the target; tion,.O, with average atomic num-the geometrical angle, 0 ,g and ber, Z, as a parameter.the undercutting length, L,
are visually defined.
Here, as before, R is the range of the electron in the target material.In Fig. 10 we plot the reduced depth as a function of reduced sepa-ration between electron beams with average atomic number as a para-meter. The results predict a marked decrease in the depth*withincreased target nuclear charge for a fixed separation between elec-tron beams. We also note from Fig. 10 that increasing the averageatomic number of the resist from 3.0 to 11 radically changes the de-pendence of undercutting on the spacing of the electron beams.
ELECTRON-BEAM LITHOGRAPHIC STUDIES
In the previous sections of this paper, we have outlined twotheoretical models which adequately describe electron backscatteringand scattering phenomena in solids. Moreover, we made several ob-servations based on the theoretical results, namely, that a substan-tial fraction of incident electrons can be reflected from a semi-conductor surface or interface and that the spatial extent ofpenetrating electrons scattered from an incident electron beam is
strongly dependent on the average nuclear charge of the target. Wenow show that both of these phenomena dramatically affect the resolu-tion of closely spaced e-beam lines.
Experimentally, we have studied electron scattering and back-scattering effects in "infinitely thick" resist materials and in thin
303

IAFRATE, HELBERT, BALLATO,COOK, and McAFEE
film resist materials mounted on various IC substrates. [The terms"infinitely thick" and "thin" film refers to the thickness of the film
relative to the range of the electrons.] In this study we have irradi-
ated a variety of substrates by EBL techniques; the resulting e-beamexposures were then photographed by use of scanning electron micros-copy (SEM). In our EBL process a 20 keV electron beam exposes aradiation-sensitive target [PMMA was used in this study] overlaid onan IC substrate; a subsequent chemical development treatment removesthe exposed region leaving an outline of the pattern created by thescattered electron beam. Figure 11
Fig. 11. SEM photograph of a typicalEBL exposure of thick PMMA resistmaterial.
represents an SEM photograph of a typical EBL exposure of thick PMMAresist material. For this particular pattern, the e-beam machine wasprogramed to "write" ten equally spaced one micron thick lines of twomicron spacings. The teardrop-shaped hollows represent developed re-gions of e-beam exposure. The geometrical shape of a given hollow isdirectly related to the spatial extent of the scattered e-beam in theresist material. It is clear from this figure that e-beam scatteringin the resist will limit the e-beam line separation achieveable inEBL; as the e-beam line separation is reduced, the teardrops below thesurface overlap to undercut the resist material between the linesthereby destroying the e-beam pattern.
In order to study the depth of undercutting as a function ofe-beam separation in PMMA without destroying the e-beam pattern, wehave developed a unique technique which makes use of the misalignmentof the e-beam deflection fields. The deflection field is the maximumarea of e-beam projection achieveable without translating the e-beamspecimen stage. Since the e-beam machine in our laboratory writeswith a deflection field of 0.5 x 0.5 squared millimeters, to writelarger patterns covering areas greater than the deflection field
304
Q3~m

IAFRATE, HELBERT, BALLATO,
COOK, and McAFEE
requires precise matching (butting) of the adjacent deflection fields,If adjacent deflection fields are not well matched, then an e-beampattern which is written across the deflection field boundry willgive rise to a "butting" error. The e-beam pattern resulting from alateral (transverse) adjacent deflection field mismatch is seen inFig. 13c. In our study we intentionally misalign the adjacent de-flection fields in the longitudinal direction with respect to tenequally spaced e-beam lines. In this case the e-beam lines in thearray are doubly exposed at the deflection field boundry. Thus, whenthe pattern is developed, the doubly exposed regions at the fieldboundries produce much deeper crevasses whose internal shapes re-semble the e-beam patterns receiving twice the dose. For our purposes,we write the entire pattern with an underexposing e-beam dose; sincethe field boundry receives double exposure, the PMMA samples fracturevery easily at the field boundry thus making visable the e-beam ra-diation pattern without destroying the pattern. An SEM photograph ofa typical sample is seen in Fig. 12. In this figure it should benoted that a triangular region is defined between the underexposede-beam lines as theoretically visualized in Fig. 9. We have written
a series of arrays, varying the spacings between one micron thicklines, while keeping the e-beam exposure rate and misaligned deflectionfield constant, to obtain the depth of undercutting as a function ofline spacing, The results indicate excellent agreement with the shapeof the curve predicted in Fig. 10 for PMMA (Z = 3,6).
Fig. 12. SEM photograph ofe-beam radiation pattern.
Finally, we have experimentally studied e-beam proximity effects[overexposure effects arising from e-beam writing of closely-spacedlines and from electron backscattering from substrates] on thin filmsof PMMA due to substrate electron backscattering. We have already es-tablished in a previous section that the percentage of incident elec-trons backscattering from a substrate will increase with the atomic
305

IAFRATE, HELBERT, BALLATO,COOK, and McAFEE
number of that substrate. We have e-beam irradiated three differentsamples to show dramatic proximity- effects.
Fig. 13a. SEN photograph of e-beam exposure on PNMA.
Fig. 13b. SEN photograph of e- Fig. 13c, SEN photograph of e-beam exposure on PMMA/silicon beam exposure on PMMA/gold sub-
substrate. strate.
In Figure 13a we show an e-beam exposure on "infinitely thick" PNMA.
In Figures 13b,c, we show typical e-beam exposures of three micronsthick PNMA on silicon (Z = 14) and gold (Z = 79), respectively. Allthree samples were exposed to equal e-beam doses, yet the samples
show an increased e-beam over-exposure with increased substrate nu-clear charge. Thus, we have clearly shown that e-beam scattering ef-fects play a major role in limiting the resolution of closely spacede-beam lines.
306
.
IAFRATE, HELBERT, BALLATO,COOK, and McAFEE
SUMMARY
In this paper two theoretical models have been outlined which ade-quately describe electron backscattering and scattering phenomena insolids. The theoretical results indicated that a substantial fractionof incident electrons can be backscattered from a semiconductor sub-strate and that the spatial extent of penetrating electrons from anincident electron beam is strongly dependent on the average nuclearcharge of the target. Experimentally, we have shown that both ofthese phenomena dramatically affect the resolution of closely spacede-beam lines. As part of our experimental study, we have developed atechnique for studying closely-spaced e-beam patterns without destroy-ing the pattern.
In future studies we plan to expand our theoretical efforts toinclude the simulation of e-beam patterns by using a further extensionof Everhart's theory as well as Monte Carlo methods. Experimentally,we plan to extend our present studies to include a wide variety ofresist materials and substrates by using the excellent EBL and SEMfacilities available in ET&DL.
ACKNOWLEDGMENTS
The authors wish to thank J. Kwiatkowski and D. Eckart for tech-nical assistance; we also thank C. Mauser for typing this manuscript.
REFERENCES
1. T. Everhart, J. Appl. Phys. 31, 1483(1960).
2. G. Archard, J. Appl. Phys. 32, 1505(1961).
3. R. Dashen, Phys. Rev. 134, A1025(1964).
4. G.J. lafrate, W.S. McAfee, and A. Ballato, J. Vac. Sci. Technol.,
13, 843(1976).
5. H. Kulenkampff and W. Spyra, Z. Phys. 137, 416(1954).
6. P. Brown, D. Wittry, and D. Kyser, J. Appl. Phys. 40, 1627(1969).
7. L. Spencer and V. Fano, Phys. Rev. 95, 1172(19541.
8. E.J. Sternglass, Phys. Rev. 95, 345(1954); P.C.R. Palluel,C.R. Seances Acad4 Sci. Roum__224, 1492(1947).
9. J, Holliday and E. Sternglass, J. Appl. Phys, 28, 1189(1957).
307
,J -,
- *-

IAFRATE, HELBERT, BALLATOCOOK, and McAFEE
10. V. Cosslett and R. Thomas, Br. J. Appi. Phys. 16, 779(1965).
11. H. Bethe, Rose, and Smith, Proc. American Philosophical Society,78, 573(1938).
12. H. Bethe, Ann. Physik, 5, 325(1930).
13. R. Feder, T. Haller, M. Hatzakis, L.T. Roman kiw, and E. Spiller,IBM Technical Disclosure Bulletin, 18, 2346(1975).
308
- ----
