elementary statistics a step by step approach 9th edition
TRANSCRIPT
Chapter 2 - Frequency Distributions and Graphs
7
EXERCISE SET 2-1
1. Frequency distributions are used toorganize data in a meaningful way, todetermine the shape of the distribution, tofacilitate computational procedures forstatistics, to make it easier to draw chartsand graphs, and to make comparisons amongdifferent sets of data.
2. Categorical distributions are used withnominal or ordinal data, ungroupeddistributions are used with data having asmall range, and grouped distributions areused when the range of the data is large.
3. Five to twenty classes. Width should bean odd number so that the midpoint willhave the same place value as the data.
4. An open-ended frequency distribution haseither a first class with no lower limit or alast class with no upper limit. They arenecessary to accomodate all the data.
5.Boundaries: 42.5 47.5Midpoint: 45Width: 5
6.Boundaries: 124.5 131.5Midpoint: 128Width: 7
7.Boundaries: 8.235 11.365Midpoint: 9.8Width: 3.13
8.Boundaries: 16.25 18.55Midpoint: 17.4Width: 2.3
9. Class width is not uniform.
10. Class limits overlap, and class width is notuniform.
11.A class has been omitted.
12.Class width is not uniform.
13.Class f Percent
F 19 38
C 14 28
B 10 20
A
50 100
7 14
The class with the most data values isprofessional football. The class with theleast number of data values is auto racing.
14.Class f Percent
A 4 10%
M 28 70%
H 6 15%
S 2 %
40 100%
5
15.Limits Boundaries f
0 -0.5 - 0.5 2
1 0.5 - 1.5 5
2 1.5 - 2.5 24
3 2.5 - 3.5 8
4 3.5 - 4.5 6
5 4.5 - 5.5 4
6 5.5 - 6.5 0
7 6.5 - 7.5
50
1
cf
Less than -0.5 0
Less than 0.5 2
Less than 1.5 7
Less than 2.5 31
Less than 3.5 39
Less than 4.5 45
Less than 5.5 49
Less than 6.5 49
Less than 7.5 50
The category "twice a week" has morevalues than any other category.
Elementary Statistics A Step by Step Approach 9th Edition Bluman Solutions ManualFull Download: http://testbanklive.com/download/elementary-statistics-a-step-by-step-approach-9th-edition-bluman-solutions-manual/
Full download all chapters instantly please go to Solutions Manual, Test Bank site: testbanklive.com
Chapter 2 - Frequency Distributions and Graphs
8
16.Limits Boundaries f
3 2.5 - 3.5 2
4 3.5 - 4.5 4
5 4.5 - 5.5 4
6 5.5 - 6.5 1
7 6.5 - 7.5 4
8 7.5 - 8.5 3
9 8.5 - 9.5
20
2
cf
Less than 2.5 0
Less than 3.5 2
Less than 4.5 6
Less than 5.5 10
Less than 6.5 11
Less than 7.5 15
Less than 8.5 18
Less than 9.5 20
17.H 514 L 465œ œRange 514 465 49œ œWidth 49 6 8.2 round up to 9œ ƒ œ
Limits Boundaries f
465 - 473 464.5 - 473.5 9
474 - 482 473.5 - 482.5 7
483 - 491 482.5 - 491.5 7
492 - 500 491.5 - 500.5 6
501 - 509 500.5 - 509.5 7
510 - 518 509.5 - 518.5
40
4
cf
Less than 464.5 0
Less than 473.5 9
Less than 482.5 16
Less than 491.5 23
Less than 500.5 29
Less than 509.5 36
Less than 518.5 40
18.H 110 L 54œ œRange 110 54 56œ œWidth 56 7 8 round up to 9œ ƒ œ
18. continuedLimits Boundaries f
54 - 62 53.5 - 62.5 7
63 - 71 62.5 - 71.5 6
72 - 80 71.5 - 80.5 8
81 - 89 80.5 - 89.5 4
90 - 98 89.5 - 98.5 1
99 - 107 98.5 - 107.5 3
108 - 116 107.5 - 116.5
30
1
cf
Less than 53.5 0
Less than 62.5 7
Less than 71.5 13
Less than 80.5 21
Less than 89.5 25
Less than 98.5 26
Less than 107.5 29
Less than 116.5 30
19.H 70 L 27œ œRange 70 27 43œ œWidth 43 7 6.1 or 7œ ƒ œ
Limits Boundaries f
27 - 33 26.5 - 33.5 7
34 - 40 33.5 - 40.5 14
41 - 47 40.5 - 47.5 15
48 - 54 47.5 - 54.5 11
55 - 61 54.5 - 61.5 3
62 - 68 61.5 - 68.5 3
69 - 75 68.5 - 75.5
55
2
cf
Less than 26.5 0
Less than 33.5 7
Less than 40.5 21
Less than 47.5 36
Less than 54.5 47
Less than 61.5 50
Less than 68.5 53
Less than 75.5 55
20.H 177,500 L 70,000œ œRange 177,500 70,000 107,500œ œWidth 107,500 6 17,916.67œ ƒ œround up to 17,917

Chapter 2 - Frequency Distributions and Graphs
9
20. continuedLimits Boundaries f
70,000 - 87,916 69,999.5 - 87,916.5 1
87,917 - 105,833 87,916.5 - 105,833.5 3
105,834 - 123,750 105,833.5 - 123,750.5 7
123,751 - 141,667 123,750.5 - 141,667.5 6
141,668 - 159,584 141,667.5 - 159,584.5 5
159,585 - 177,502 159,584.5 - 177,502.5
25
3
cf
Less than 69,999.5 0
Less than 87,916.5 1
Less than 105,833.5 4
Less than 123,750.5 11
Less than 141,667.5 17
Less than 159,584.5 22
Less than 177,502.5 25
21.H 88 L 12œ œRange 88 12 76œ œWidth 76 9 8.4 round up to 9œ ƒ œ
Limits Boundaries f
12 - 20 11.5 - 20.5 7
21 - 29 20.5 - 29.5 7
30 - 38 29.5 - 38.5 3
39 - 47 38.5 - 47.5 3
48 - 56 47.5 - 56.5 4
57 - 65 56.5 - 65.5 3
66 - 74 65.5 - 74.5 0
75 - 83 74.5 - 83.5 2
84 - 92 83.5 - 92.5
30
1
cf
Less than 11.5 0
Less than 20.5 7
Less than 29.5 14
Less than 38.5 17
Less than 47.5 20
Less than 56.5 24
Less than 65.5 27
Less than 74.5 27
Less than 83.5 29
Less than 92.5 30
22.H 51.7 L 1.2œ œRange 51.7 1.2 50.5œ œWidth 50.5 5 10.1 round up to 11œ ƒ œ
22. continuedLimits Boundaries f
0 - 10 -0.5 - 10.5 7
11 - 21 10.5 - 21.5 6
22 - 32 21.5 - 32.5 2
33 - 43 32.5 - 43.5 0
44 - 54 43.5 - 54.5
16
1
cf
Less than -0.5 0
Less than 10.5 7
Less than 21.5 13
Less than 32.5 15
Less than 43.5 15
Less than 54.5 16
23.H 123 L 77œ œRange 123 77 46œ œWidth 46 7 6.6 or 7œ ƒ œ
Limits Boundaries f
77 - 83 76.5 - 83.5 1
84 - 90 83.5- 90.5 1
91 - 97 90.5- 97.5 6
98 - 104 97.5- 104.5 14
105 - 111 104.5 - 111.5 8
112 - 118 111.5 - 118.5 1
119 - 125 118.5 - 125.5
32
1
cf
Less than 76.5 0
Less than 83.5 1
Less than 90.5 2
Less than 97.5 8
Less than 104.5 22
Less than 111.5 30
Less than 118.5 31
Less than 125.5 32
24.H 3462 L 3œ œRange 3462 3 3459œ œWidth 3459 9 384.3œ ƒ œround up to 385
Chapter 2 - Frequency Distributions and Graphs
10
24. continuedLimits Boundaries f
3 - 387 2.5 - 387.5 33
388 - 772 387.5 - 772.5 11
773 - 1157 772.5 - 1157.5 3
1158 - 1542 1157.5 - 1542.5 2
1543 - 1923 1542.5 - 1923.5 0
1924 - 2312 1923.5 - 2312.5 0
2313 - 2697 2312.5 - 2697.5 1
2698 - 3082 2697.5 - 3082.5 0
3083 - 3467 3082.5 - 3467.5
5
1
1
cf
Less than 2.5 0
Less than 387.5 33
Less than 772.5 44
Less than 1157.5 47
Less than 1542.5 49
Less than 1923.5 49
Less than 2312.5 49
Less than 2697.5 50
Less than 3082.5 50
Less than 3467.5 51
25.H 12.3 L 6.2œ œRange 12.3 6.2 6.1œ œWidth 6.1 7 0.87 round up to 0.9œ ƒ œ
Limits Boundaries f
6.2 - 7.0 6.15 - 7.05 1
7.1 - 7.9 7.05 - 7.95 7
8.0 - 8.8 7.95 - 8.85 9
8.9 - 9.7 8.85 - 9.75 7
9.8 - 10.6 9.75 - 10.65 8
10.7 - 11.5 10.65 - 11.55 4
11.6 - 12.4 11.55 - 12.45
40
4
cf
Less than 6.15 0
Less than 7.05 1
Less than 7.95 8
Less than 8.85 17
Less than 9.75 24
Less than 10.65 32
Less than 11.55 36
Less than 12.45 40
26.H 37.9 L 17.3œ œRange 37.9 17.3 20.6œ œ
26. continuedWidth 20.6 6 3.43 round up to 3.5œ ƒ œ
Limits Boundaries f
17.3 - 20.2 17.25 - 20.25 4
20.3 - 23.2 20.25 - 23.25 6
23.3 - 26.2 23.25 - 26.25 18
26.3 - 29.2 26.25 - 29.25 8
29.3 - 32.2 29.25 - 32.25 6
32.3 - 35.2 32.25 - 35.25 7
35.3 - 38.2 35.25 - 38.25
50
1
cf
Less than 17.25 0
Less than 20.25 4
Less than 23.25 10
Less than 26.25 28
Less than 29.25 36
Less than 32.25 42
Less than 35.25 49
Less than 38.25 50
27. The percents add up to 101%. Theyshould total 100% unless rounding was used.
28.Class f
0 1
1 4
2 5
3 7
4 4
5 4
6 3
7 3
8 5
9 5
No. Zero appears only once and 3 appears 7times.
EXERCISE SET 2-2
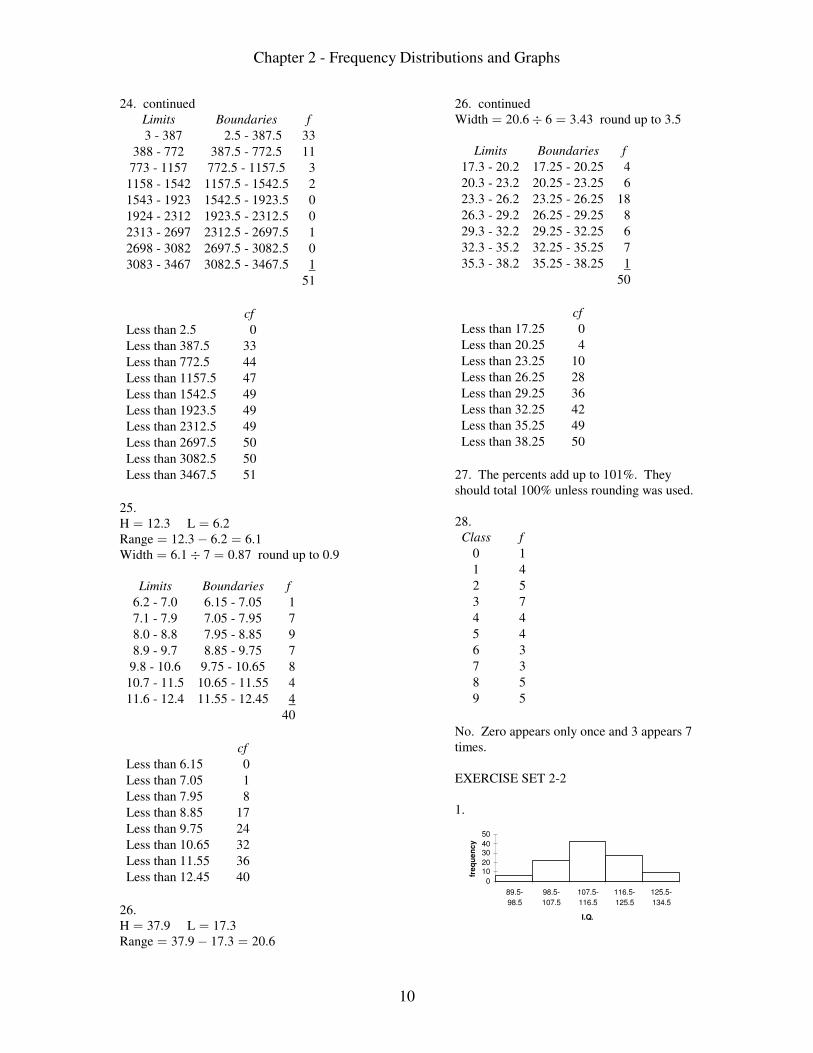
1.
0
1020
3040
50
89.5-
98.5
98.5-
107.5
107.5-
116.5
116.5-
125.5
125.5-
134.5
I.Q.
fre
qu
en
cy
Chapter 2 - Frequency Distributions and Graphs
11
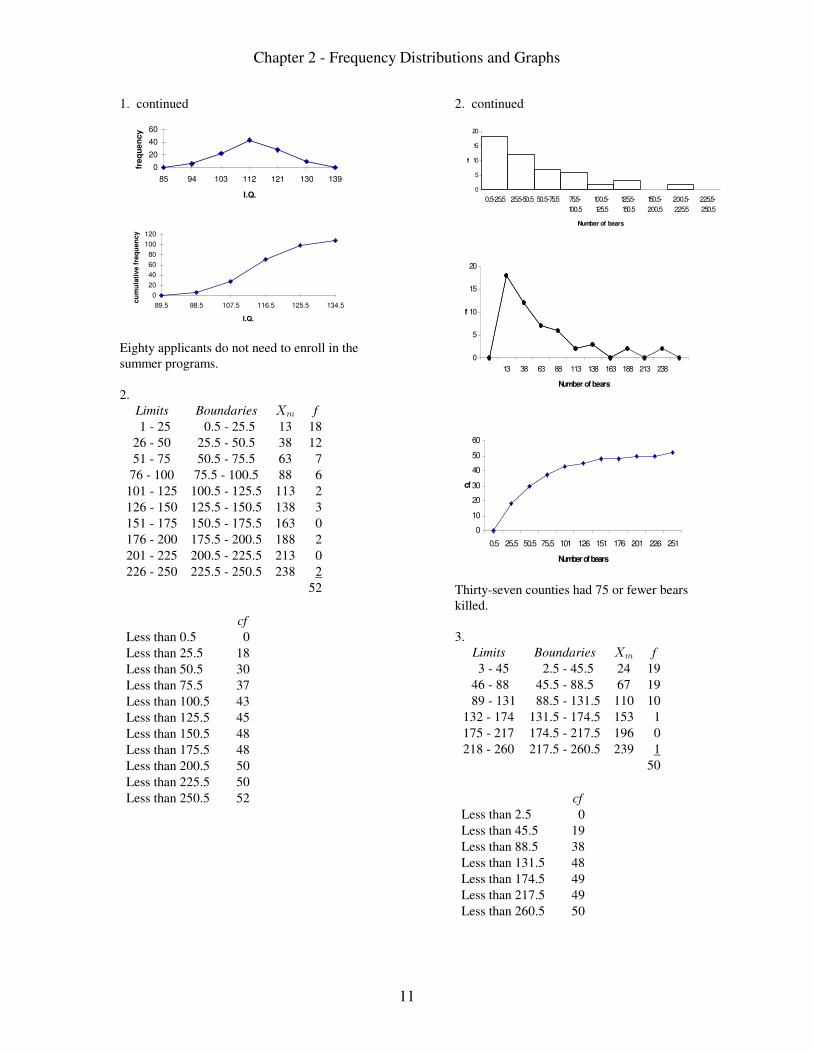
1. continued
0
20
40
60
85 94 103 112 121 130 139
I.Q.
fre
qu
en
cy
0
20
40
60
80
100
120
89.5 98.5 107.5 116.5 125.5 134.5
I.Q.
cu
mu
lati
ve f
req
uen
cy
Eighty applicants do not need to enroll in thesummer programs.
2.Limits Boundaries f\7
1 - 25 0.5 - 25.5 13 18
26 - 50 25.5 - 50.5 38 12
51 - 75 50.5 - 75.5 63 7
76 - 100 75.5 - 100.5 88 6
101 - 125 100.5 - 125.5 113 2
126 - 150 125.5 - 150.5 138 3
151 - 175 150.5 - 175.5 163 0
176 - 200 175.5 - 200.5 188 2
201 - 225 200.5 - 225.5 213 0
226 - 250 225.5 - 250.5 238
52
2
cf
Less than 0.5 0
Less than 25.5 18
Less than 50.5 30
Less than 75.5 37
Less than 100.5 43
Less than 125.5 45
Less than 150.5 48
Less than 175.5 48
Less than 200.5 50
Less than 225.5 50
Less than 250.5 52
2. continued
0
5
10
15
20
0.5-25.5 25.5-50.5 50.5-75.5 75.5-
100.5
100.5-
125.5
125.5-
150.5
150.5-
200.5
200.5-
225.5
225.5-
250.5
Number of bears
f
0
5
10
15
20
13 38 63 88 113 138 163 188 213 238
Number of bears
f
0
10
20
30
40
50
60
0.5 25.5 50.5 75.5 101 126 151 176 201 226 251
Number of bears
cf
Thirty-seven counties had 75 or fewer bearskilled.
3.Limits Boundaries f\7
3 - 45 2.5 - 45.5 24 19
46 - 88 45.5 - 88.5 67 19
89 - 131 88.5 - 131.5 110 10
132 - 174 131.5 - 174.5 153 1
175 - 217 174.5 - 217.5 196 0
218 - 260 217.5 - 260.5 239
50
1
cf
Less than 2.5 0
Less than 45.5 19
Less than 88.5 38
Less than 131.5 48
Less than 174.5 49
Less than 217.5 49
Less than 260.5 50
Chapter 2 - Frequency Distributions and Graphs
12
3. continued
0
5
10
15
20
2.5-45.5 45.5-88.5 88.5-131.5 131.5-174.5 174.5-217.5 217.5-260.5
Counties, parishes, or divisions
freq
uen
cy
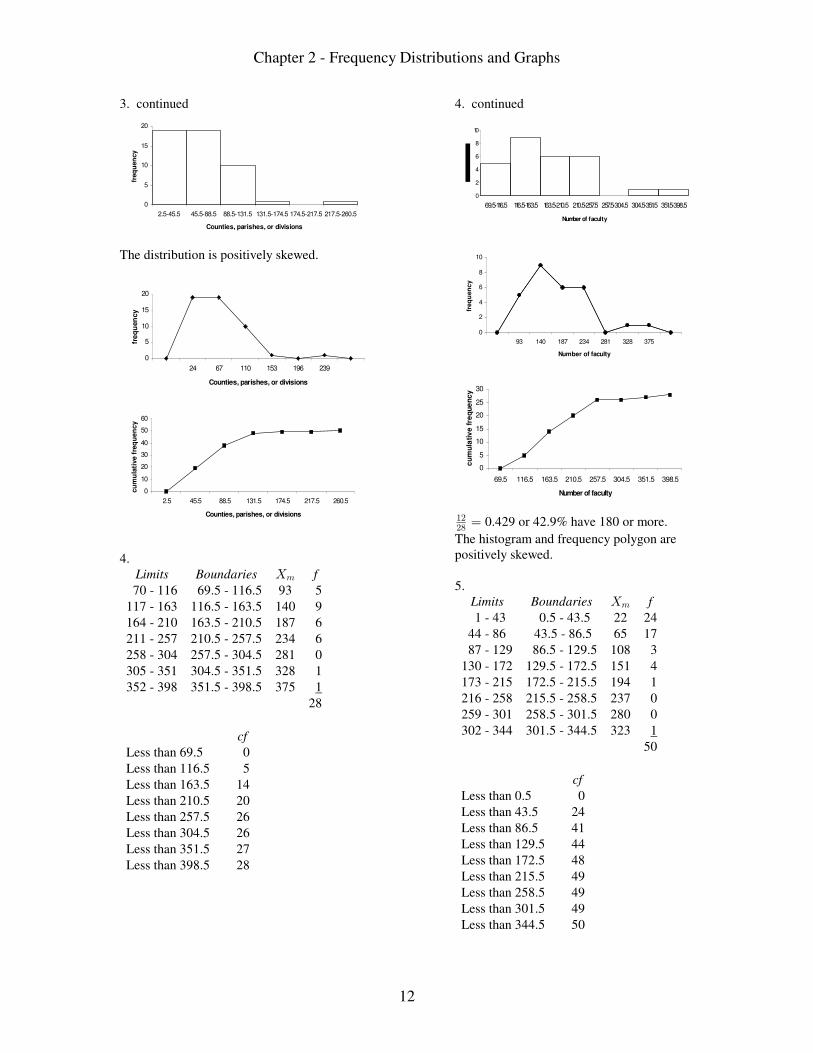
The distribution is positively skewed.
0
5
10
15
20
24 67 110 153 196 239
Counties, parishes, or divisions
fre
qu
en
cy
0
10
20
30
40
50
60
2.5 45.5 88.5 131.5 174.5 217.5 260.5
Counties, parishes, or divisions
cu
mu
lati
ve
fre
qu
en
cy
4.Limits Boundaries f\7
70 - 116 69.5 - 116.5 93 5
117 - 163 116.5 - 163.5 140 9
164 - 210 163.5 - 210.5 187 6
211 - 257 210.5 - 257.5 234 6
258 - 304 257.5 - 304.5 281 0
305 - 351 304.5 - 351.5 328 1
352 - 398 351.5 - 398.5 375
28
1
cf
Less than 69.5 0
Less than 116.5 5
Less than 163.5 14
Less than 210.5 20
Less than 257.5 26
Less than 304.5 26
Less than 351.5 27
Less than 398.5 28
4. continued
0
2
4
6
8
10
69.5-116.5 116.5-163.5 163.5-210.5 210.5-257.5 257.5-304.5 304.5-351.5 351.5-398.5
Number of faculty
0
2
4
6
8
10
93 140 187 234 281 328 375
Number of faculty
freq
uen
cy
0
5
10
15
20
25
30
69.5 116.5 163.5 210.5 257.5 304.5 351.5 398.5
Number of faculty
cu
mu
lati
ve
fre
qu
en
cy
"##)
œ 0.429 or 42.9% have 180 or more.
The histogram and frequency polygon arepositively skewed.
5.Limits Boundaries f\7
1 - 43 0.5 - 43.5 22 24
44 - 86 43.5 - 86.5 65 17
87 - 129 86.5 - 129.5 108 3
130 - 172 129.5 - 172.5 151 4
173 - 215 172.5 - 215.5 194 1
216 - 258 215.5 - 258.5 237 0
259 - 301 258.5 - 301.5 280 0
302 - 344 301.5 - 344.5 323
50
1
cf
Less than 0.5 0
Less than 43.5 24
Less than 86.5 41
Less than 129.5 44
Less than 172.5 48
Less than 215.5 49
Less than 258.5 49
Less than 301.5 49
Less than 344.5 50
Chapter 2 - Frequency Distributions and Graphs
13
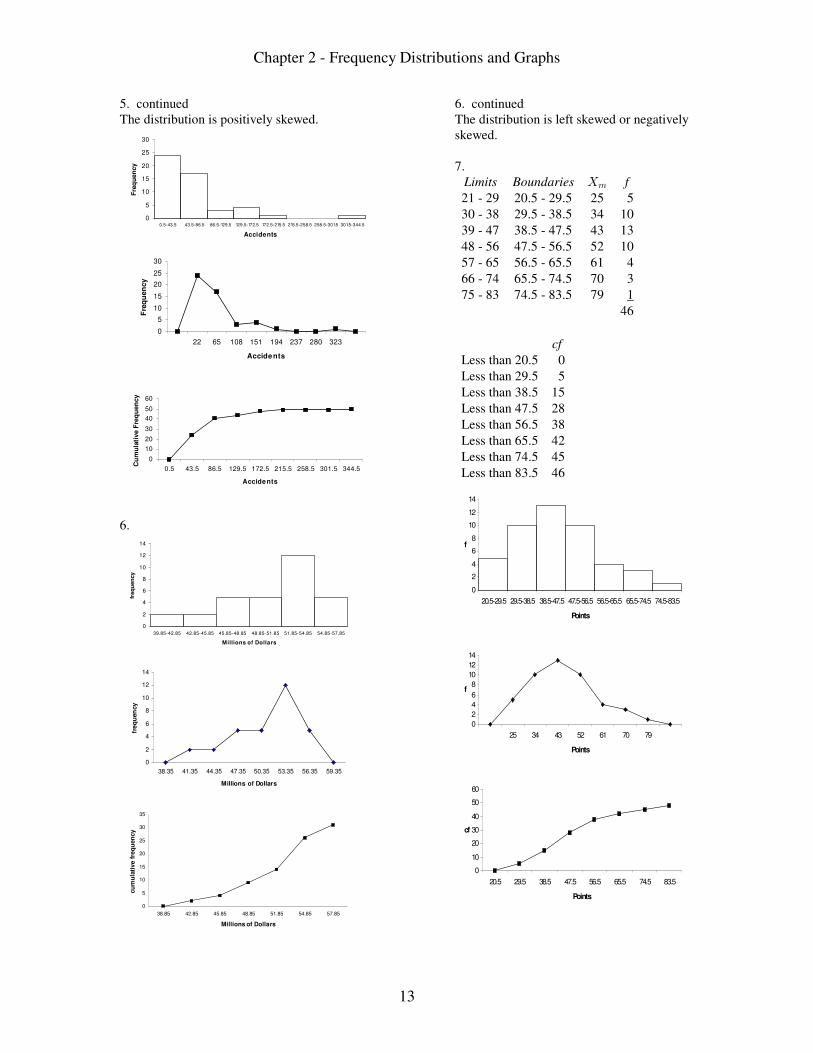
5. continuedThe distribution is positively skewed.
0
5
10
15
20
25
30
0.5-43.5 43.5-86.5 86.5-129.5 129.5-172.5 172.5-215.5 215.5-258.5 258.5-301.5 301.5-344.5
Accidents
Fre
qu
en
cy
0
5
10
15
20
25
30
22 65 108 151 194 237 280 323
Accidents
Fre
qu
en
cy
0
10
20
30
40
50
60
0.5 43.5 86.5 129.5 172.5 215.5 258.5 301.5 344.5
Accide nts
Cu
mu
lati
ve F
req
uen
cy
6.
0
2
4
6
8
10
12
14
39.85-42.85 42.85-45.85 45.85-48.85 48.85-51.85 51.85-54.85 54.85-57.85
Millions of Dollars
freq
uen
cy
0
2
4
6
8
10
12
14
38.35 41.35 44.35 47.35 50.35 53.35 56.35 59.35
Millions of Dollars
fre
qu
en
cy
0
5
10
15
20
25
30
35
38.85 42.85 45.85 48.85 51.85 54.85 57.85
Millions of Dollars
cu
mu
lati
ve f
req
uen
cy
6. continuedThe distribution is left skewed or negativelyskewed.
7.Limits Boundaries f\7
21 - 29 20.5 - 29.5 25 5
30 - 38 29.5 - 38.5 34 10
39 - 47 38.5 - 47.5 43 13
48 - 56 47.5 - 56.5 52 10
57 - 65 56.5 - 65.5 61 4
66 - 74 65.5 - 74.5 70 3
75 - 83 74.5 - 83.5 79
46
1
cf
Less than 20.5 0
Less than 29.5 5
Less than 38.5 15
Less than 47.5 28
Less than 56.5 38
Less than 65.5 42
Less than 74.5 45
Less than 83.5 46
0
2
4
6
8
10
12
14
20.5-29.5 29.5-38.5 38.5-47.5 47.5-56.5 56.5-65.5 65.5-74.5 74.5-83.5
Points
f
0
2
4
6
8
10
12
14
25 34 43 52 61 70 79
Points
f
0
10
20
30
40
50
60
20.5 29.5 38.5 47.5 56.5 65.5 74.5 83.5
Points
cf

Chapter 2 - Frequency Distributions and Graphs
14
8.
0
5
10
15
20
5.5-8.5 8.5-11.5 11.5-14.5 14.5-17.5 17.5-20.5 20.5-23.5 23.5-26.5
Costs of utilities
Fre
qu
en
cy
0
5
10
15
20
7 10 13 16 19 22 25
Costs of utilities
Fre
qu
en
cy
0
5
10
15
20
25
30
35
5.5 8.5 11.5 14.5 17.5 20.5 23.5 26.5
Costs of utilities
Cu
mu
lati
ve f
req
uen
cy
The distribution is positively skewed.
9.Limits Boundaries f (now) f(5 years ago)
10 - 14 9.5 - 14.5 6 5
15 - 19 14.5 - 19.5 4 4
20 - 24 19.5 - 24.5 3 2
25 - 29 24.5 - 29.5 2 3
30 - 34 29.5 - 34.5 5 6
35 - 39 24.5 - 39.5 1 2
40 - 44 39.5 - 44.5 2 1
45 - 49 44.5 - 49.5 1 1
Total 24 24
0
2
4
6
8
9.5-14.5 14.5-
19.5
19.5-
24.5
24.5-
29.5
29.5-
34.5
34.5-
39.5
39.5-
44.5
44.5-
49.5
Sulfur Dioxide (now)
f
0
1
2
3
4
5
6
7
9.5-14.5 14.5-19.5 19.5-24.524.5-29.529.5-34.534.5-39.5 39.5-44.544.5-49.5
Sulfur Dioxide (5 years ago)
f
9. continuedWith minor differences, the histograms arefairly similar.
10.
0
5
10
15
20
17.5 -
22.5
22.5 -
27.5
27.5 -
32.5
32.5 -
37.5
37.5 -
42.5
42.5 -
47.5
% At or Above Reading Level
freq
uen
cy
0
5
10
15
20
17.5 -
22.5
22.5 -
27.5
27.5 -
32.5
32.5 -
37.5
37.5 -
42.5
42.5 -
47.5
% At or Above Math Level
freq
uen
cy
The distribution of math percentages is morebell-shaped than the distribution of readingpercentages, and its peak in the class of32.5 37.5 is not as high as the peak of thereading percentages.
11.Limits Boundaries f\7
60 - 64 59.5 - 64.5 62 2
65 - 69 64.5 - 69.5 67 1
70 - 74 69.5 - 74.5 72 5
75 - 79 74.5 - 79.5 77 12
80 - 84 79.5 - 84.5 82 18
85 - 89 84.5 - 89.5 87 6
90 - 94 89.5 - 94.5 92 5
95 - 99 94.5 - 99.5 97
50
1
cf
Less than 59.5 0
Less than 64.5 2
Less than 69.5 3
Less than 74.5 8
Less than 79.5 20
Less than 84.5 38
Less than 89.5 44
Less than 94.5 49
Less than 99.5 50
Chapter 2 - Frequency Distributions and Graphs
15
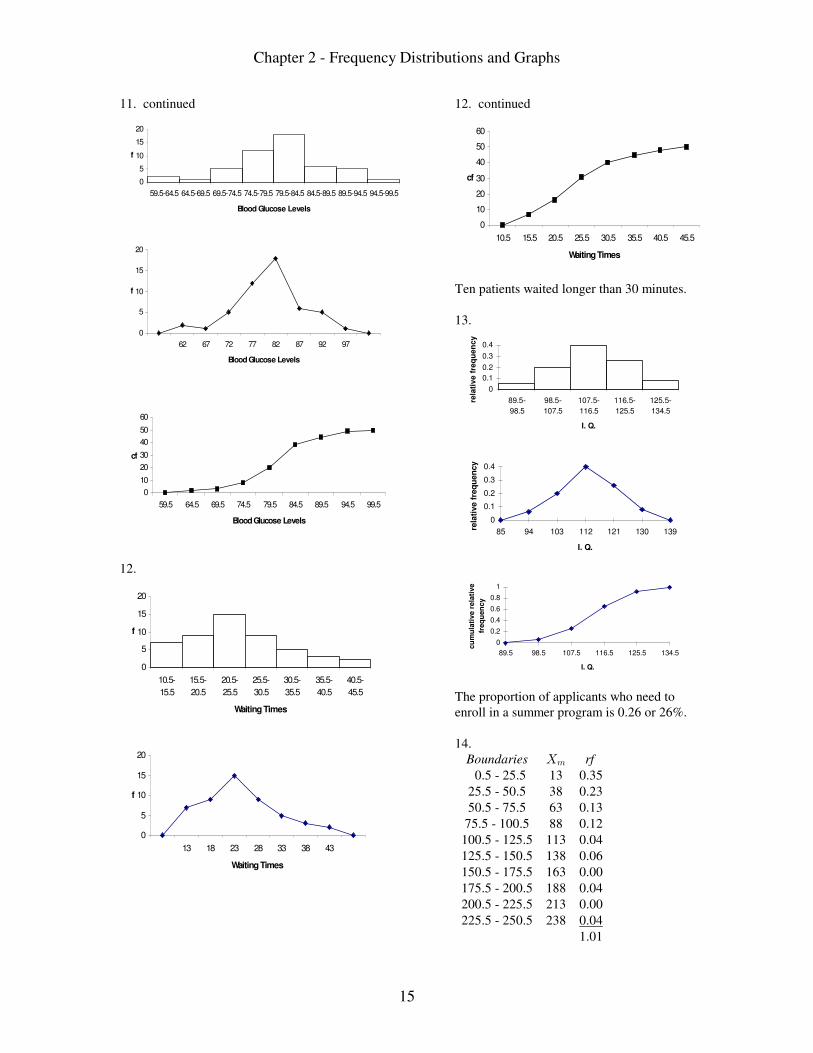
11. continued
0
5
10
15
20
59.5-64.5 64.5-69.5 69.5-74.5 74.5-79.5 79.5-84.5 84.5-89.5 89.5-94.5 94.5-99.5
Blood Glucose Levels
f
0
5
10
15
20
62 67 72 77 82 87 92 97
Blood Glucose Levels
f
0
10
20
30
40
50
60
59.5 64.5 69.5 74.5 79.5 84.5 89.5 94.5 99.5
Blood Glucose Levels
cf
12.
0
5
10
15
20
10.5-
15.5
15.5-
20.5
20.5-
25.5
25.5-
30.5
30.5-
35.5
35.5-
40.5
40.5-
45.5
Waiting Times
f
0
5
10
15
20
13 18 23 28 33 38 43
Waiting Times
f
12. continued
0
10
20
30
40
50
60
10.5 15.5 20.5 25.5 30.5 35.5 40.5 45.5
Waiting Times
cf
Ten patients waited longer than 30 minutes.
13.
0
0.1
0.2
0.3
0.4
89.5-
98.5
98.5-
107.5
107.5-
116.5
116.5-
125.5
125.5-
134.5
I. Q.
rela
tiv
e f
req
ue
nc
y
0
0.1
0.2
0.3
0.4
85 94 103 112 121 130 139
I. Q.
rela
tive f
req
uen
cy
0
0.2
0.4
0.6
0.8
1
89.5 98.5 107.5 116.5 125.5 134.5
I. Q.
cu
mu
lati
ve r
ela
tive
freq
uen
cy
The proportion of applicants who need toenroll in a summer program is 0.26 or 26%.
14.Boundaries rf\7
0.5 - 25.5 13 0.35
25.5 - 50.5 38 0.23
50.5 - 75.5 63 0.13
75.5 - 100.5 88 0.12
100.5 - 125.5 113 0.04
125.5 - 150.5 138 0.06
150.5 - 175.5 163 0.00
175.5 - 200.5 188 0.04
200.5 - 225.5 213 0.00
225.5 - 250.5 238
1.01
0.04
Chapter 2 - Frequency Distributions and Graphs
16
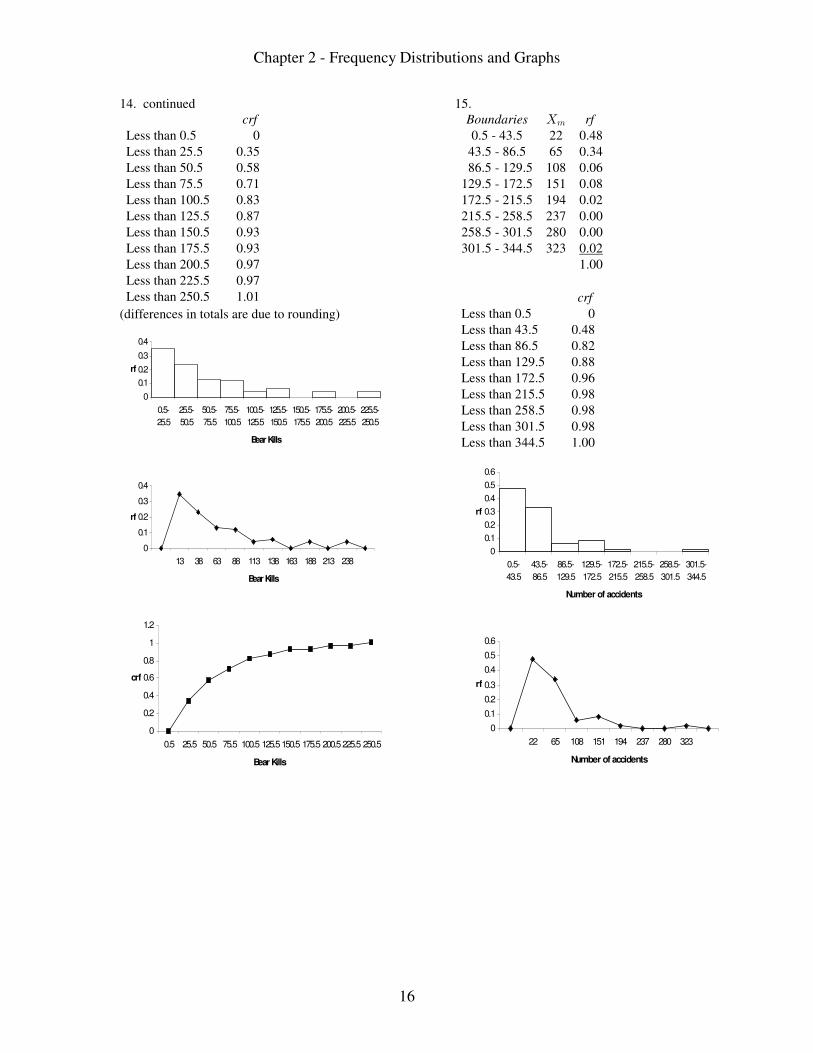
14. continuedcrf
Less than 0.5 0
Less than 25.5 0.35
Less than 50.5 0.58
Less than 75.5 0.71
Less than 100.5 0.83
Less than 125.5 0.87
Less than 150.5 0.93
Less than 175.5 0.93
Less than 200.5 0.97
Less than 225.5 0.97
Less than 250.5 1.01
(differences in totals are due to rounding)
0
0.1
0.2
0.3
0.4
0.5-
25.5
25.5-
50.5
50.5-
75.5
75.5-
100.5
100.5-
125.5
125.5-
150.5
150.5-
175.5
175.5-
200.5
200.5-
225.5
225.5-
250.5
Bear Kills
rf
0
0.1
0.2
0.3
0.4
13 38 63 88 113 138 163 188 213 238
Bear Kills
rf
0
0.2
0.4
0.6
0.8
1
1.2
0.5 25.5 50.5 75.5 100.5 125.5150.5 175.5 200.5225.5 250.5
Bear Kills
crf
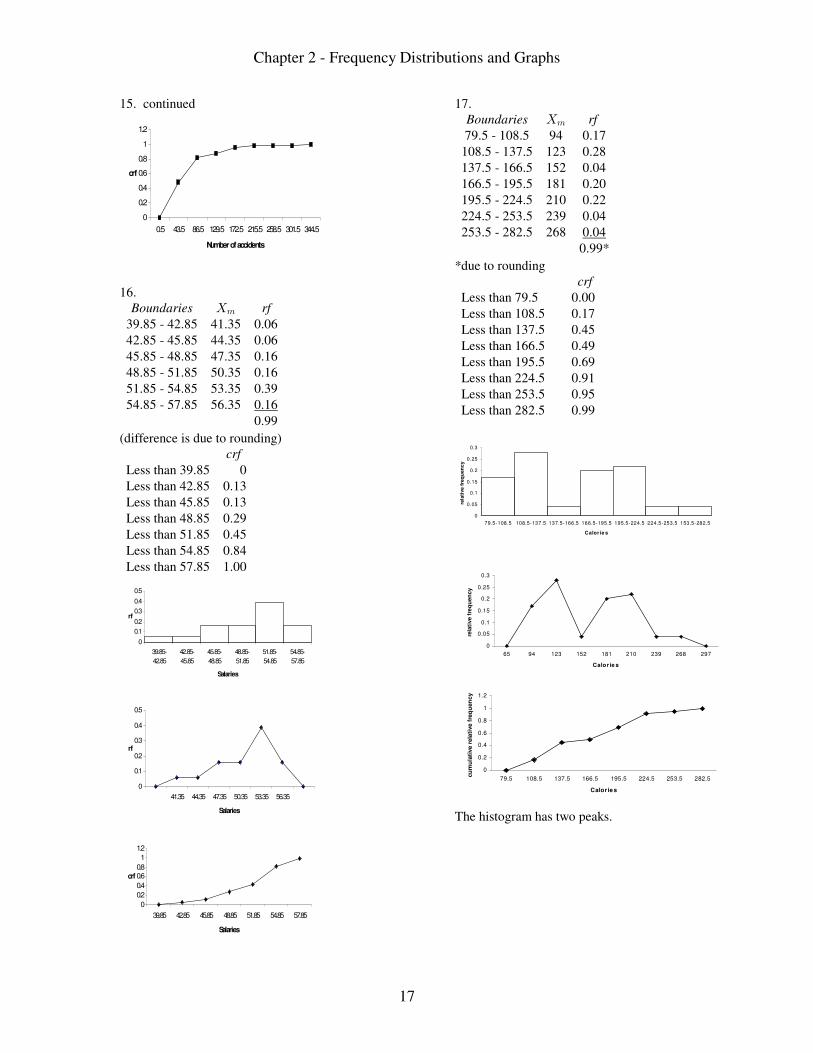
15.Boundaries rf\7
0.5 - 43.5 22 0.48
43.5 - 86.5 65 0.34
86.5 - 129.5 108 0.06
129.5 - 172.5 151 0.08
172.5 - 215.5 194 0.02
215.5 - 258.5 237 0.00
258.5 - 301.5 280 0.00
301.5 - 344.5 323
1.00
0.02
crf
Less than 0.5 0
Less than 43.5 0.48
Less than 86.5 0.82
Less than 129.5 0.88
Less than 172.5 0.96
Less than 215.5 0.98
Less than 258.5 0.98
Less than 301.5 0.98
Less than 344.5 1.00
0
0.1
0.2
0.3
0.4
0.5
0.6
0.5-
43.5
43.5-
86.5
86.5-
129.5
129.5-
172.5
172.5-
215.5
215.5-
258.5
258.5-
301.5
301.5-
344.5
Number of accidents
rf
0
0.1
0.2
0.3
0.4
0.5
0.6
22 65 108 151 194 237 280 323
Number of accidents
rf
Chapter 2 - Frequency Distributions and Graphs
17
15. continued
0
0.2
0.4
0.6
0.8
1
1.2
0.5 43.5 86.5 129.5 172.5 215.5 258.5 301.5 344.5
Number of accidents
crf
16.Boundaries rf\7
39.85 - 42.85 41.35 0.06
42.85 - 45.85 44.35 0.06
45.85 - 48.85 47.35 0.16
48.85 - 51.85 50.35 0.16
51.85 - 54.85 53.35 0.39
54.85 - 57.85 56.35
0.99
0.16
(difference is due to rounding)crf
Less than 39.85 0
Less than 42.85 0.13
Less than 45.85 0.13
Less than 48.85 0.29
Less than 51.85 0.45
Less than 54.85 0.84
Less than 57.85 1.00
0
0.1
0.2
0.3
0.4
0.5
39.85-
42.85
42.85-
45.85
45.85-
48.85
48.85-
51.85
51.85-
54.85
54.85-
57.85
Salaries
rf
0
0.1
0.2
0.3
0.4
0.5
41.35 44.35 47.35 50.35 53.35 56.35
Salaries
rf
0
0.2
0.4
0.60.8
1
1.2
39.85 42.85 45.85 48.85 51.85 54.85 57.85
Salaries
crf
17.Boundaries rf\7
79.5 - 108.5 94 0.17
108.5 - 137.5 123 0.28
137.5 - 166.5 152 0.04
166.5 - 195.5 181 0.20
195.5 - 224.5 210 0.22
224.5 - 253.5 239 0.04
253.5 - 282.5 268
0.99*
0.04
*due to roundingcrf
Less than 79.5 0.00
Less than 108.5 0.17
Less than 137.5 0.45
Less than 166.5 0.49
Less than 195.5 0.69
Less than 224.5 0.91
Less than 253.5 0.95
Less than 282.5 0.99
0
0.05
0.1
0.15
0.2
0.25
0.3
79.5-108.5 108.5-137.5 137.5-166.5 166.5-195.5 195.5-224.5 224.5-253.5 153.5-282.5
Calor ie s
rela
tive f
req
uen
cy
0
0.05
0.1
0.15
0.2
0.25
0.3
65 94 123 152 181 210 239 268 297
Calor ie s
rela
tive
fre
qu
en
cy
0
0.2
0.4
0.6
0.8
1
1.2
79.5 108.5 137.5 166.5 195.5 224.5 253.5 282.5
Calor ies
cu
mu
lati
ve
rela
tive f
req
uen
cy
The histogram has two peaks.
Chapter 2 - Frequency Distributions and Graphs
18
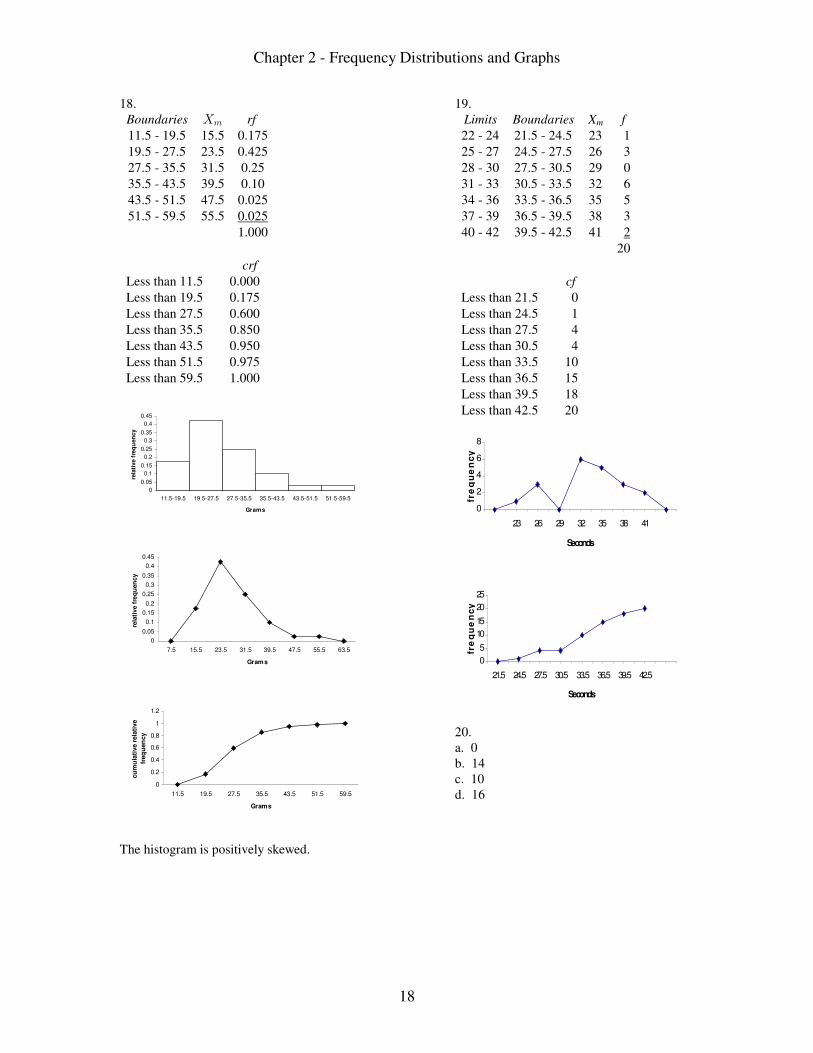
18.Boundaries rf\7
11.5 - 19.5 15.5 0.175
19.5 - 27.5 23.5 0.425
27.5 - 35.5 31.5 0.25
35.5 - 43.5 39.5 0.10
43.5 - 51.5 47.5 0.025
51.5 - 59.5 55.5 0.025
1.000
crf
Less than 11.5 0.000
Less than 19.5 0.175
Less than 27.5 0.600
Less than 35.5 0.850
Less than 43.5 0.950
Less than 51.5 0.975
Less than 59.5 1.000
0
0.05
0.1
0.15
0.2
0.25
0.3
0.35
0.4
0.45
11.5-19.5 19.5-27.5 27.5-35.5 35.5-43.5 43.5-51.5 51.5-59.5
Grams
rela
tive f
req
uen
cy
0
0.05
0.1
0.15
0.2
0.25
0.3
0.35
0.4
0.45
7.5 15.5 23.5 31.5 39.5 47.5 55.5 63.5
Grams
rela
tiv
e f
req
uen
cy
0
0.2
0.4
0.6
0.8
1
1.2
11.5 19.5 27.5 35.5 43.5 51.5 59.5
Grams
cu
mu
lati
ve r
ela
tive
freq
uen
cy
The histogram is positively skewed.
19.Limits Boundaries X fm
22 - 24 21.5 - 24.5 23 1
25 - 27 24.5 - 27.5 26 3
28 - 30 27.5 - 30.5 29 0
31 - 33 30.5 - 33.5 32 6
34 - 36 33.5 - 36.5 35 5
37 - 39 36.5 - 39.5 38 3
40 - 42 39.5 - 42.5 41
20
2
cf
Less than 21.5 0
Less than 24.5 1
Less than 27.5 4
Less than 30.5 4
Less than 33.5 10
Less than 36.5 15
Less than 39.5 18
Less than 42.5 20
0
2
4
6
8
23 26 29 32 35 38 41
Seconds
fre
qu
en
cy
0
5
10
15
20
25
21.5 24.5 27.5 30.5 33.5 36.5 39.5 42.5
Seconds
fre
qu
en
cy
20.a. 0b. 14c. 10d. 16

Chapter 2 - Frequency Distributions and Graphs
19
21.Boundaries f\7
468.5 - 495.5 482 6
495.5 - 522.5 509 15
522.5 - 549.5 536 10
549.5 - 576.5 563 7
576.5 - 603.5 590 6
603.5 - 630.5 617
50
6
f
Less than 468.5 0
Less than 495.5 6
Less than 522.5 21
Less than 549.5 31
Less than 576.5 38
Less than 603.5 44
Less than 630.5 50
0
5
10
15
20
468.5-495.5 495.5-522.5 522.5-549.5 549.5-576.5 576.5-603.5 603.5-630.5
Average Mathematics Score
f
0
5
10
15
20
482 509 536 563 590 617
Average Mathematics Score
f
EXERCISE SET 2-3
1.f
Dogs 78
Cats 86
Fish 160
Other 53
1. continued
0
50
100
150
200
Dogs Cats Fish Other
Pets
0 50 100 150 200
Dogs
Cats
Fish
Other
Pets
2.f
Wendy's $8.7
KFC 14.2
Pizza Hut 9.3
Burger King 12.7
Subway 10.0
Sales of Fast Foods
0 2 4 6 8 10 12 14 16
Wendy's
Pizza Hut
Subway
Dollars (billions)
0
5
10
15
KFC Burger King Subway Pizza Hut Wendy's
Sales of Fast Foods
Do
llars
(b
illio
ns
)
Chapter 2 - Frequency Distributions and Graphs
20
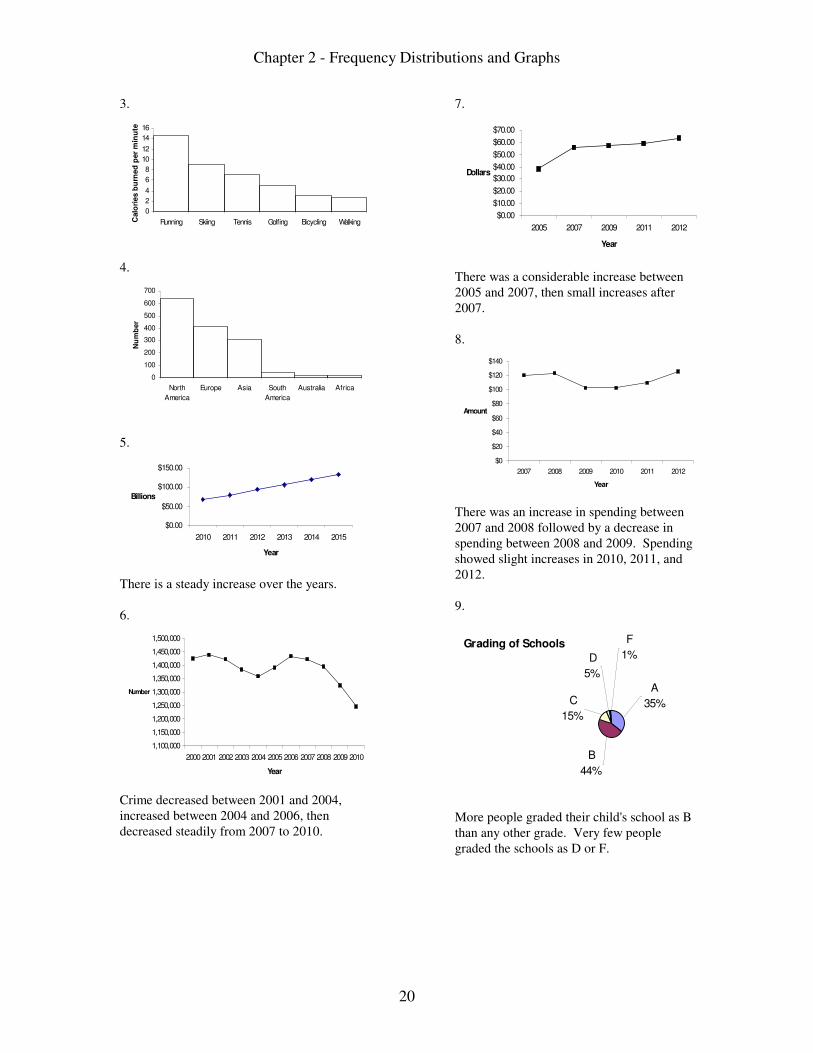
3.
0
2
4
6
8
10
12
14
16
Running Skiing Tennis Golfing Bicycling WalkingCalo
ries b
urn
ed
per
min
ute
4.
0
100
200
300
400
500
600
700
North
America
Europe Asia South
America
Australia Africa
Nu
mb
er
5.
$0.00
$50.00
$100.00
$150.00
2010 2011 2012 2013 2014 2015
Year
Billions
There is a steady increase over the years.
6.
1,100,000
1,150,000
1,200,000
1,250,000
1,300,000
1,350,000
1,400,000
1,450,000
1,500,000
2000 2001 2002 2003 2004 2005 2006 2007 2008 2009 2010
Year
Number
Crime decreased between 2001 and 2004,increased between 2004 and 2006, thendecreased steadily from 2007 to 2010.
7.
$0.00
$10.00
$20.00
$30.00
$40.00
$50.00
$60.00
$70.00
2005 2007 2009 2011 2012
Year
Dollars
There was a considerable increase between2005 and 2007, then small increases after2007.
8.
$0
$20
$40
$60
$80
$100
$120
$140
2007 2008 2009 2010 2011 2012
Year
Amount
There was an increase in spending between2007 and 2008 followed by a decrease inspending between 2008 and 2009. Spendingshowed slight increases in 2010, 2011, and2012.
9.
Grading of Schools
D
5%
C
15%
B
44%
A
35%
F
1%
More people graded their child's school as Bthan any other grade. Very few peoplegraded the schools as D or F.

Chapter 2 - Frequency Distributions and Graphs
21
10.Personal Business 146 14.6% 52.56°
Visit friends or family 330 33.0% 118.8°
Work-related 225 22.5% 81.0°
Leisure 299 29.9% 107.64°
1000 100% 360°
Pers onal
14.6%
V is it
33.0%W ork
22.5%
Leis ure
29.9%
About of the travelers visit friends or"3
relatives, with the fewest travelling forpersonal business.
11.
Energy Consumption
Natural Gas
25%
Coal
21%
Petroleum
37%
Nuclear
9%
Renewable
8%
Fossil fuels accounted for 83% of totalusage.
12.White 19% 68.4°
Silver 18% 64.8°
Black 16% 57.6°
Red 13% 46.8°
Gray 12% 43.2°
Blue 12% 43.2°
Other 10% 36.0°
Popular Vehicle Colors
White
19%
Silver
18%
Black
16%
Red
13%
Gray
12%
Blue
12%
Other
10%
13.ì
ì ì
ì ì
ì ì ì ì ì
ì ì ì ì ì ì ì
ì ì ì ì ì ì ì ì ì ì
ì ì ì ì ì ì ì ì ì ì ì
ì ì ì ì ì ì ì ì ì ì ì ì ì ì
21 22 23 24 25 26 27 28 29 30 31 32 33 34 35
The dotplot is somewhat positively skewedand shows that the majority of the playersare between 21 and 30 years old. There are2 peaks at 24 years old, with 7 players, andat 25 years old, with 8 players.
14.ì
ì ì ì ì
ì ì ì ì ì ì ì ì ì
3 4 5 6 7 8 9 10 11 12 13 14 15 16 17 18
The number of teacher strikes ranges from 3strikes to 18 strikes. The data clustersbetween 7 and 10 strikes and between 13and 15 strikes.
15.ì
ì ì ì ì ì
ì ì ì ì ì ì
ì ì ì ì ì ì ì ì ì ì ì
ì ì ì ì ì ì ì ì ì ì ì ì ì ì ì ì ì
72 73 74 75 76 77 78 79 80 81 82 83 84 85 86 87 88 89 90 91
The data peaks at age 77 and gaps betweenthe ages of 80 and 84. The data clustersbetween ages 72 to 80 and between ages 84to 91.
16.ì
ì ì ì ì ì
ì ì ì ì ì ì ì ì ì
ì ì ì ì ì ì ì ì ì ì ì ì ì ì
ì ì ì ì ì ì ì ì ì ì ì ì ì ì ì ì ì ì ì ì ì
11 12 13 14 15 16 17 18 19 20 21 22 23 24 25 26 27 28 29 30 31 32 33
The commuting times range from 11 minutesto 33 minutes. The data clusters between 17and 31 minutes and gaps at 16 and 32minutes.
17.5 0 0 0 0 0 0 1 1 1 1 1 2 2 2 2 2 2 4 4 4 4 4 4 4
5 6 6 6 7 7 8 8 8 8 9
6 0 1 3 4
6 5 6
7 0 3
Most of the players have 50 to 54 homeruns. The greatest number of home runs is73.

Chapter 2 - Frequency Distributions and Graphs
22
18.10 0 0 0 0 0
11 0 0 5
12 0 0 0 0
13 0 0 0 0 0
14 0 0 5 5
15 0 0
16 0 0 0 0
17 0
18 0 0
19 0
! !
! ! &
!
!
19. South America Europe
#
&
0 3 4 4
0 5 5 5 6 6 6 6 6 7 8 8 9
4 2 1 0 0 0 0 0 0 0 1 .1 2 3 4
1 2
5 2
3
9 3
The majority of the South American riversare longer than those in Europe.
20. Math Reading
9 9 9 7 5 5 2 5
9 8 6 3 2 1 6 1 1 5 6 6 7 9
6 4 3 3 2 7 0 0 1 6 6 6 7 7 7 8
8 0
The reading scores are somewhat higherthan the math scores.
21.a. Pareto chartb. Pareto chartc. Pie graphd. Pie graphe. Pareto chartf. Time series graph
22.a. Time series graphb. Pie graphc. Pareto chartd. Pie graphe. Time series graphf. Pareto chart
23.
0.0%
5.0%
10.0%
15.0%
20.0%
25.0%
30.0%
35.0%
Govt. Admin Nursing Home Prescriptions Drs. and
Clinics
Hospital Other
%
Govt. Admin
10%
Nursing Home
6%
Prescriptions
10%
Drs. and Clinics
20%Hospital
30%
Other
24%
24.
Patents
0
20,000
40,000
60,000
80,000
100,000
120,000
Japan
22.4%
Germany
6.2%
Italy
0.9%Israel
0.9%China
1.3%
United Kingdom
2.1%
South Korea
5.8%
Taiwan
4.1%
Canada
2.4%
US
53.8%
The bar graph is better since there are toomany categories for the pie graph.
Chapter 2 - Frequency Distributions and Graphs
23
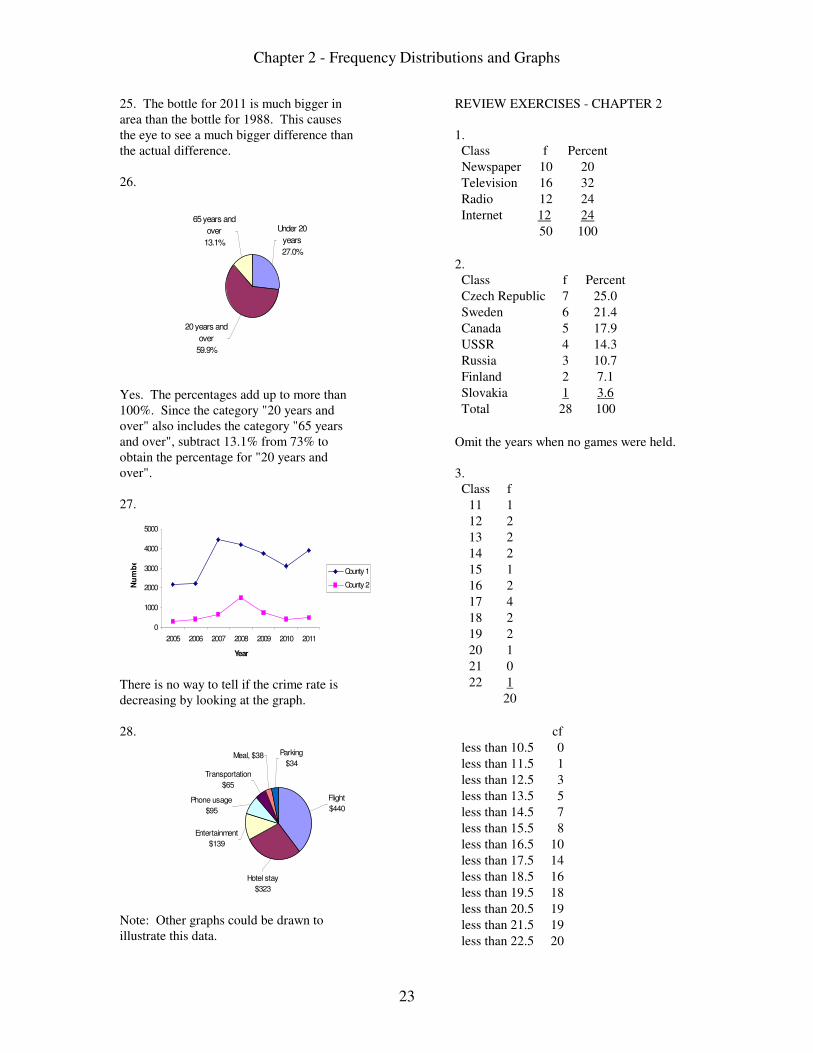
25. The bottle for 2011 is much bigger inarea than the bottle for 1988. This causesthe eye to see a much bigger difference thanthe actual difference.
26.
20 years and
over
59.9%
65 years and
over
13.1%
Under 20
years
27.0%
Yes. The percentages add up to more than100%. Since the category "20 years andover" also includes the category "65 yearsand over", subtract 13.1% from 73% toobtain the percentage for "20 years andover".
27.
0
1000
2000
3000
4000
5000
2005 2006 2007 2008 2009 2010 2011
Year
Nu
mb
er
County 1
County 2
There is no way to tell if the crime rate isdecreasing by looking at the graph.
28.
Meal, $38 Parking
$34
Transportation
$65
Flight
$440 Phone usage
$95
Entertainment
$139
Hotel stay
$323
Note: Other graphs could be drawn toillustrate this data.
REVIEW EXERCISES - CHAPTER 2
1.Class f Percent
Newspaper 10 20
Television 16 32
Radio 12 24
Internet
50 100
12 24
2.Class f Percent
Czech Republic 7 25.0
Sweden 6 21.4
Canada 5 17.9
USSR 4 14.3
Russia 3 10.7
Finland 2 7.1
Slovakia
Total 28 100
1 3.6
Omit the years when no games were held.
3.Class f
11 1
12 2
13 2
14 2
15 1
16 2
17 4
18 2
19 2
20 1
21 0
22
20
1
cf
less than 10.5 0
less than 11.5 1
less than 12.5 3
less than 13.5 5
less than 14.5 7
less than 15.5 8
less than 16.5 10
less than 17.5 14
less than 18.5 16
less than 19.5 18
less than 20.5 19
less than 21.5 19
less than 22.5 20
Chapter 2 - Frequency Distributions and Graphs
24
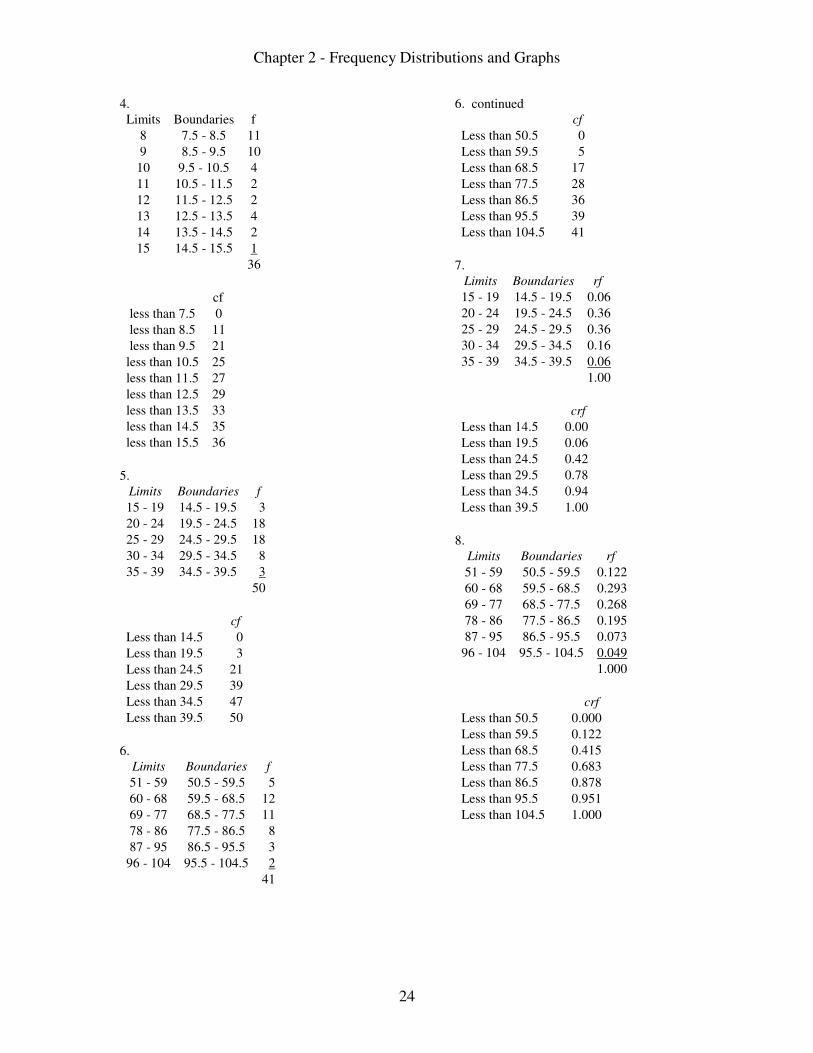
4.Limits Boundaries f
8 7.5 - 8.5 11
9 8.5 - 9.5 10
10 9.5 - 10.5 4
11 10.5 - 11.5 2
12 11.5 - 12.5 2
13 12.5 - 13.5 4
14 13.5 - 14.5 2
15 14.5 - 15.5
36
1
cf
less than 7.5 0
less than 8.5 11
less than 9.5 21
less than 10.5 25
less than 11.5 27
less than 12.5 29
less than 13.5 33
less than 14.5 35
less than 15.5 36
5.Limits Boundaries f
15 - 19 14.5 - 19.5 3
20 - 24 19.5 - 24.5 18
25 - 29 24.5 - 29.5 18
30 - 34 29.5 - 34.5 8
35 - 39 34.5 - 39.5
50
3
cf
Less than 14.5 0
Less than 19.5 3
Less than 24.5 21
Less than 29.5 39
Less than 34.5 47
Less than 39.5 50
6.Limits Boundaries f
51 - 59 50.5 - 59.5 5
60 - 68 59.5 - 68.5 12
69 - 77 68.5 - 77.5 11
78 - 86 77.5 - 86.5 8
87 - 95 86.5 - 95.5 3
96 - 104 95.5 - 104.5
41
2
6. continuedcf
Less than 50.5 0
Less than 59.5 5
Less than 68.5 17
Less than 77.5 28
Less than 86.5 36
Less than 95.5 39
Less than 104.5 41
7.Limits Boundaries rf
15 - 19 14.5 - 19.5 0.06
20 - 24 19.5 - 24.5 0.36
25 - 29 24.5 - 29.5 0.36
30 - 34 29.5 - 34.5 0.16
35 - 39 34.5 - 39.5 0.06
1.00
crf
Less than 14.5 0.00
Less than 19.5 0.06
Less than 24.5 0.42
Less than 29.5 0.78
Less than 34.5 0.94
Less than 39.5 1.00
8.Limits Boundaries rf
51 - 59 50.5 - 59.5 0.122
60 - 68 59.5 - 68.5 0.293
69 - 77 68.5 - 77.5 0.268
78 - 86 77.5 - 86.5 0.195
87 - 95 86.5 - 95.5 0.073
96 - 104 95.5 - 104.5
1.000
0.049
crf
Less than 50.5 0.000
Less than 59.5 0.122
Less than 68.5 0.415
Less than 77.5 0.683
Less than 86.5 0.878
Less than 95.5 0.951
Less than 104.5 1.000
Chapter 2 - Frequency Distributions and Graphs
25
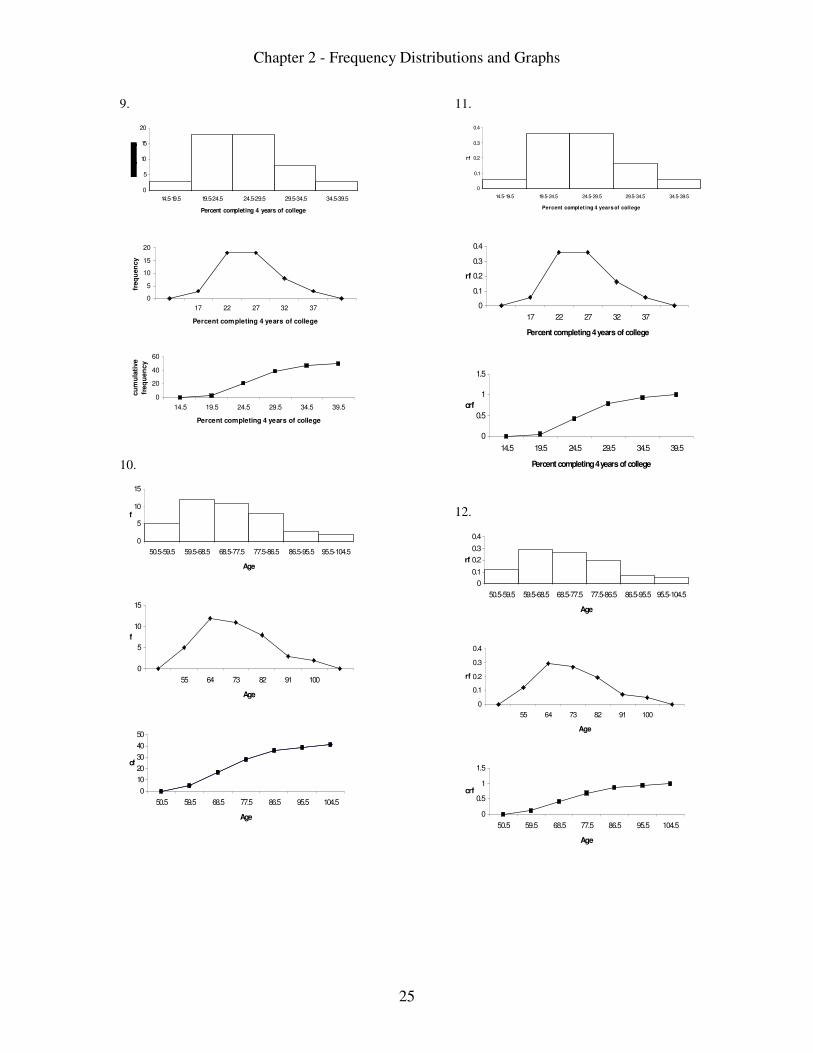
9.
0
5
10
15
20
14.5-19.5 19.5-24.5 24.5-29.5 29.5-34.5 34.5-39.5
Percent completing 4 years of college
0
5
10
15
20
17 22 27 32 37
Percent completing 4 years of college
freq
uen
cy
0
20
40
60
14.5 19.5 24.5 29.5 34.5 39.5
Percent completing 4 years of college
cu
mu
lati
ve
freq
uen
cy
10.
0
5
10
15
50.5-59.5 59.5-68.5 68.5-77.5 77.5-86.5 86.5-95.5 95.5-104.5
Age
f
0
5
10
15
55 64 73 82 91 100
Age
f
0
10
20
30
40
50
50.5 59.5 68.5 77.5 86.5 95.5 104.5
Age
cf
11.
0
0.1
0.2
0.3
0.4
14.5-19.5 19.5-24.5 24.5-29.5 29.5-34.5 34.5-39.5
Percent complet ing 4 years of college
rf
0
0.1
0.2
0.3
0.4
17 22 27 32 37
Percent completing 4 years of college
rf
0
0.5
1
1.5
14.5 19.5 24.5 29.5 34.5 39.5
Percent completing 4 years of college
crf
12.
0
0.1
0.2
0.3
0.4
50.5-59.5 59.5-68.5 68.5-77.5 77.5-86.5 86.5-95.5 95.5-104.5
Age
rf
0
0.1
0.2
0.3
0.4
55 64 73 82 91 100
Age
rf
0
0.5
1
1.5
50.5 59.5 68.5 77.5 86.5 95.5 104.5
Age
crf

Chapter 2 - Frequency Distributions and Graphs
26
13.
0
20
40
60
80
100
Drink Talk on cell
phone
Eat Road
Range
Smoke
Percent
0 20 40 60 80 100
Drink
Talk on cell phone
Eat
Road Range
Smoke
Percent
14.
0
50
100
150
200
250
Peanuts Almonds Macadamia Pecans Cashews
Calo
ries
0 50 100 150 200 250
Peanuts
Almonds
Macadamia
Pecans
Cashews
Calories
15.
0
50
100
150
200
250
300
Websites Online images Online games Online videos
16.
0
2
4
6
8
10
12
14
16
Vet Care Supplies Grooming Purchases
Cos t in
billions
17.
0
200
400
600
800
60-69 70-79 80-89 90-99 00-09
Decade
Launches
Launches declined steadily from the 1960sthrough the 1970s and 1980s. Launchesincreased in the 1990s then decreased in the2000s.
18.
0.0%
2.0%
4.0%
6.0%
8.0%
10.0%
12.0%
2003 2004 2005 2006 2007 2008 2009
Year
Percent
The dropout rate increased slightly from2003 to 2004, then decreased slightly eachyear until 2008. There was a slight increasein 2009.
19.
Spending of College Freshmen
Electronics
56%Dorm Items
27%
Clothing
11%
Shoes
6%
Chapter 2 - Frequency Distributions and Graphs
27
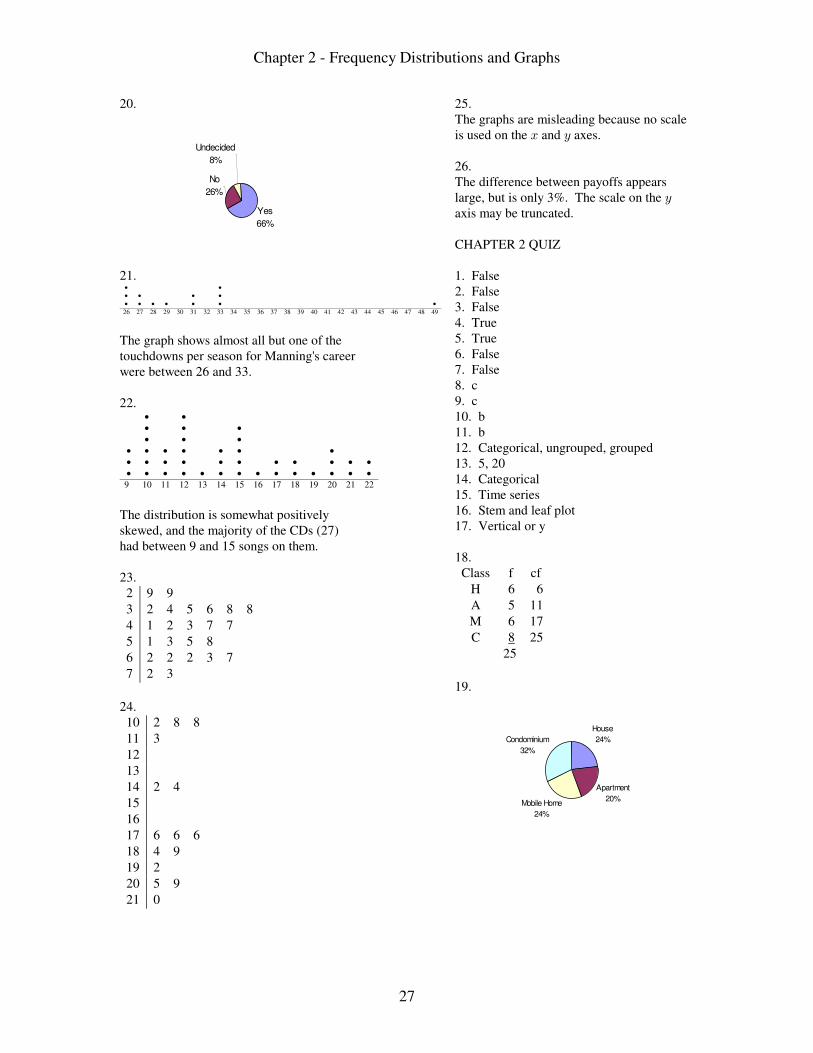
20.
Yes
66%
No
26%
Undecided
8%
21.ì ì
ì ì ì ì
ì ì ì ì ì ì ì
26 27 28 29 30 31 32 33 34 35 36 37 38 39 40 41 42 43 44 45 46 47 48 49
The graph shows almost all but one of thetouchdowns per season for Manning's careerwere between 26 and 33.
22.ì ì
ì ì ì
ì ì ì
ì ì ì ì ì ì ì
ì ì ì ì ì ì ì ì ì ì ì
ì ì ì ì ì ì ì ì ì ì ì ì ì ì
9 10 11 12 13 14 15 16 17 18 19 20 21 22
The distribution is somewhat positivelyskewed, and the majority of the CDs (27)had between 9 and 15 songs on them.
23.2 9 9
3 2 4 5 6 8 8
4 1 2 3 7 7
5 1 3 5 8
6 2 2 2 3 7
7 2 3
24.10 2 8 8
11 3
12
13
14 2 4
15
16
17 6 6 6
18 4 9
19 2
20 5 9
21 0
25.The graphs are misleading because no scaleis used on the and axes.B C
26.The difference between payoffs appearslarge, but is only 3%. The scale on the Caxis may be truncated.
CHAPTER 2 QUIZ
1. False2. False3. False4. True5. True6. False7. False8. c9. c10. b11. b12. Categorical, ungrouped, grouped13. 5, 2014. Categorical15. Time series16. Stem and leaf plot17. Vertical or y
18.Class f cf
H 6 6
A 5 11
M 6 17
C 25
25
8
19.
House
24%
Apartment
20%Mobile Home
24%
Condominium
32%

Chapter 2 - Frequency Distributions and Graphs
28
20.Limits Boundaries f
1 0.5 1.5 1
2 1.5 2.5 5
3 2.5 3.5 3
4 3.5 4.5 4
5 4.5 5.5 2
6 5.5 6.5 6
7 6.5 7.5 2
8 7.5 8.5 3
9 8.5 9.5
30
4
cf
less than 0.5 0
less than 1.5 1
less than 2.5 6
less than 3.5 9
less than 4.5 13
less than 5.5 15
less than 6.5 21
less than 7.5 23
less than 8.5 26
less than 9.5 30
21.
0
2
4
6
1 2 3 4 5 6 7 8 9
Items Purchased
Nu
mb
er
0
2
4
6
0 1 2 3 4 5 6 7 8 9 10
Items Purchased
Nu
mb
er
0
5
10
15
20
25
30
0.5 1.5 2.5 3.5 4.5 5.5 6.5 7.5 8.5 9.5
Items Purchased
Nu
mb
er
22.Limits Boundaries f rf\7
0 - 214 107 -0.5 - 214.5 20 0.39
215 - 429 322 214.5 - 429.5 15 0.29
430 - 644 537 429.5 - 644.5 5 0.10
645 - 859 752 644.5 - 859.5 5 0.10
860 - 1074 967 859.5 - 1074.5 2 0.04
1075 - 1289 1182 1074.5 - 1289.5 2 0.04
1290 - 1504 1397 1289.5 - 1504.5
51 1.00
2 0.04
cf crf
Less than 0 0 0
Less than 214.5 20 0.39
Less than 429.5 35 0.68
Less than 644.5 40 0.78
Less than 859.5 45 0.88
Less than 1074.5 47 0.92
Less than 1289.5 49 0.96
Less than 1504.5 51 1.00
23.
0
5
10
15
20
25
0.5-214.5 214.5-
429.5
429.5-
644.5
644.5-
859.5
859.5-
1074.5
1074.5-
1289.5
1289.5-
1504.5
Billions of BTU
f
0
5
10
15
20
25
107 322 537 752 967 1182 1397
Billions of BTU
f
0
10
20
30
40
50
60
0 214.5 429.5 644.5 859.5 1074.5 1289.5 1504.5
Billions of BTU
cf
Chapter 2 - Frequency Distributions and Graphs
29
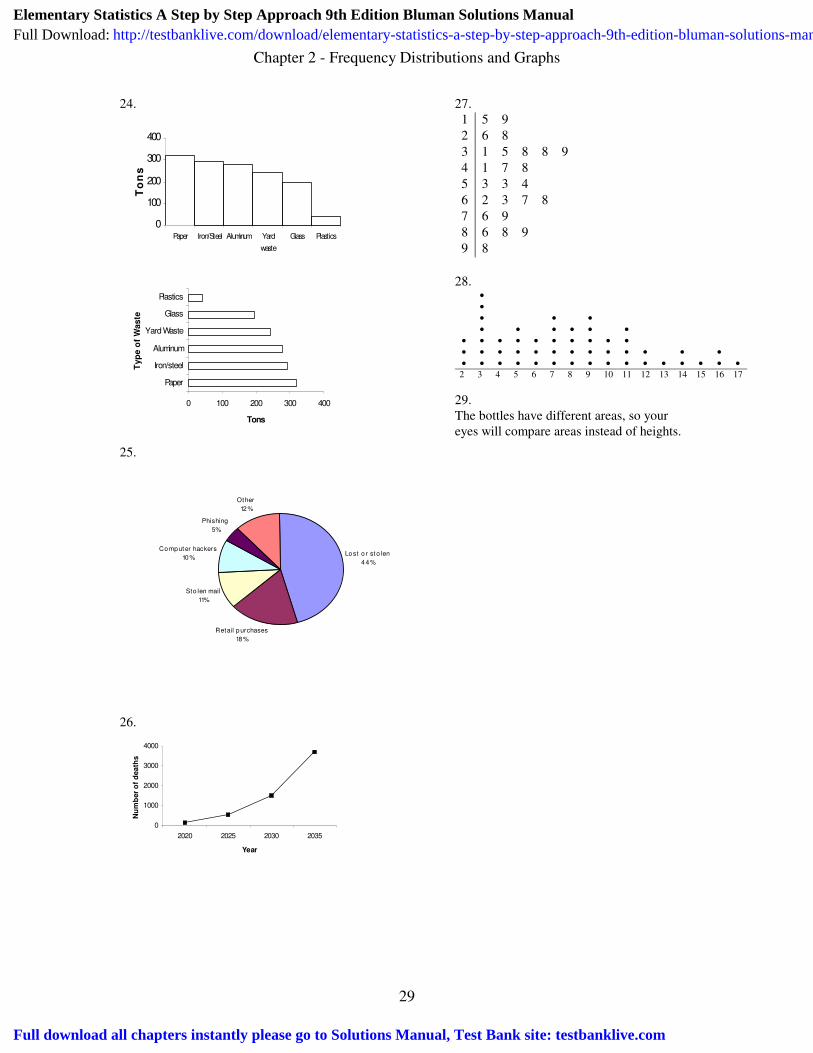
24.
0
100
200
300
400
Paper Iron/Steel Aluminum Yard
waste
Glass Plastics
To
ns
0 100 200 300 400
Paper
Iron/steel
Aluminum
Yard Waste
Glass
Plastics
Typ
e o
f W
aste
Tons
25.
Lo st o r st o len
4 4 %
Retail p urchases
18 %
Sto len mail
11%
Co mp ut er hackers
10 %
Phishing
5%
Other
12 %
26.
0
1000
2000
3000
4000
2020 2025 2030 2035
Year
Nu
mb
er
of
death
s
27.1 5 9
2 6 8
3 1 5 8 8 9
4 1 7 8
5 3 3 4
6 2 3 7 8
7 6 9
8 6 8 9
9 8
28.ì
ì
ì ì ì
ì ì ì ì ì ì
ì ì ì ì ì ì ì ì ì ì
ì ì ì ì ì ì ì ì ì ì ì ì ì
ì ì ì ì ì ì ì ì ì ì ì ì ì ì ì ì
2 3 4 5 6 7 8 9 10 11 12 13 14 15 16 17
29.The bottles have different areas, so youreyes will compare areas instead of heights.
Elementary Statistics A Step by Step Approach 9th Edition Bluman Solutions ManualFull Download: http://testbanklive.com/download/elementary-statistics-a-step-by-step-approach-9th-edition-bluman-solutions-manual/
Full download all chapters instantly please go to Solutions Manual, Test Bank site: testbanklive.com