elite commercial reit - alanyeo.files.wordpress.com
TRANSCRIPT

ed: JS / sa: PY, CS
BUY (Initiating Coverage)
Last Traded Price ( 21 Jul 2021): S$0.67 (STI : 3,119.00) Price Target 12-mth: S$0.80 (20% upside)
Potential Catalyst: Uplift in valuations and rentals
Analyst
Singapore Research Team [email protected].
Dale LAI +65 66823715 [email protected]
Price Relative
Forecasts and Valuation
FY Dec (GBPm) 2020A 2021F 2022F 2023F
Gross Revenue 21.0 33.4 36.8 39.7 Net Property Inc 20.4 32.5 35.8 38.5 Total Return 23.4 19.1 20.7 22.6 Distribution Inc 14.8 23.7 25.8 28.1 EPU (S cts) N/A 4.72 4.35 4.71 EPU Gth (%) nm nm (8) 8 DPU (S cts) 4.43 5.00 5.41 5.82 DPU Gth (%) nm 13 8 8 NAV per shr (S cts) 64.9 65.2 64.6 64.0 PE (X) N/A 14.1 15.3 14.1 Distribution Yield (%) 6.7 7.5 8.1 8.8 P/NAV (x) 1.0 1.0 1.0 1.0 Aggregate Leverage (%) 33.7 43.7 43.7 43.7 ROAE (%) N/A 7.2 6.7 7.3 Consensus DPU (S cts): 9.4 9.6 10.3 Other Broker Recs: B: 3 S: 0 H: 0 GICW Industry : Real Estate GIC Sector: Equity Real Estate Investment (REITs) Principal Business: Elite Commercial REIT is a Singapore real estate investment trust ("REIT") established with the investment strategy of principally investing, directly or indirectly, in commercial assets and real estate-related assets in the UK.
Source of all data on this page: Company, DBS Bank, Bloomberg Finance
L.P.
At A Glance Issued Capital (m shrs) 470
Mkt. Cap (S$m/US$m) 313 / 229
Major Shareholders (%)
Partner Reinsurance Co Ltd 22.4
Ho Lee Group Trust 7.6
Sunway Re Cap Pte Ltd 5/8
Free Float (%) 59.5
3m Avg. Daily Val (US$m) 0.09
DBS Group Research . Equity
22 Jul 2021
Singapore Company Focus
Elite Commercial REIT Bloomberg: ELITE SP | Reuters: ELIE.SI Refer to important disclosures at the end of this report
High Yield, Low (UK Sovereign) Risk
• Initiate coverage with a BUY recommendation and TP of
GBP0.80; attractive yields of 7.6%/8.2% in FY21F/FY22F
• 93% leased to the UK’s Department for Work and
Pensions (DWP), which is counter-cyclical and resilient
• Full occupancy and long WALE of 7.2 years provide
strong income visibility
• Rental uplift of c.8% for majority of portfolio assets in
FY23 to drive a re-rating
Initiate coverage with BUY, TP of GBP0.80, implying upside of 21% with attractive yields of 7.6%/8.2% for FY21F/FY22F. Elite Commercial REIT occupies a unique position in the REITs space, where it functions as social infrastructure, given its 99% exposure to the UK government. We like its resilient and counter-cyclical portfolio that provides stable cash flows through the economic cycles. The REIT enjoys 100% portfolio occupancy and a weighted average lease expiry (WALE) of c.7.2 years, offering strong visibility to distributions.
Potential uplift in valuations in 2022. Current book value is conservative and assumes that half of the break options will be exercised, an unlikely scenario. We thus expect to see significant uplift in valuations when the breaks are not exercised by Mar 2022, bringing P/NAV down to <1.0x. We think it is unlikely for the primary tenant, Department for Work and Pensions (DWP), to break the leases as properties are strategically chosen to serve the local communities and provide crucial public services to c.30% of the UK population.
Built-in upside from inflation-linked rental uplift every five years. The leases to the UK government have rent reviews every five years pegged to the UK Consumer Price Index (“CPI”), subject to an annual minimum increase of 1.0% and maximum of 5.0%. This provides the portfolio with an embedded rental growth profile. The next rent review in Apr 2023 could see c.8% rental growth for selected leases, resulting in c.7.4% rental growth for the portfolio in that year.
Valuation: Our target price of GBP0.80 is based on DCF with a WACC of 5.5% and terminal growth rate of 1.00%.
Key Risks to Our View: Tenant risks, lease break option in 2023 for most agreements, country risks, interest rate risks and regulatory risks.
89
109
129
149
169
189
209
0.6
0.6
0.6
0.6
0.6
0.7
0.7
0.7
0.7
0.7
0.7
Mar-21 Jun-21
Relative IndexS$
Elite Commercial REIT (LHS) Relative STI (RHS)
DBS is supported by the Research Talent Development Grant Scheme
which aims to groom research talent to expand research coverage of
small-mid cap SGX listed companies

Page 2
Company Focus
Elite Commercial REIT
Table of Contents
Investment Summary 3
Peers Comparison 4
Valuation 6
Key Risks 7
SWOT Analysis 8
Resilience of Portfolio a Positive 9
Potential Upside 10
Environment, Social & Governance (ESG) 11
Portfolio Overview 12
Financials 19
Company Background 23
Management 24

Page 3
Company Focus
Elite Commercial REIT
Investment Summary
We are initiating coverage on Elite Commercial REIT with a
BUY recommendation and TP of GBP0.80, implying 21%
upside.
Only UK-focused REIT listed on SGX; counter cyclical
portfolio. Elite Commercial REIT is the only UK-focused
listed REIT in Singapore, with over 99% of gross floor area
leased to the AA-rated UK government. Its portfolio, valued
at £515.3m, comprises 155 predominantly freehold quality
commercial buildings located across the UK, with a total
net internal area of c.3.9m square feet. The properties are
geographically diversified across the UK, located in densely
populated areas and primarily in town centres close to
public transport nodes, ensuring accessibility.
Assets Under Management (AUM) expanded by 67% and
market capitalisation increased by 57% from maiden
acquisition. The 58 properties acquired on 9 Mar 2021 are
100% occupied, with more than 99% of the rental income
coming from the UK government. This reinforces the REIT’s
strategy of focusing on high credit quality tenants while
simultaneously diversifying the tenant base by adding
other UK government tenants other than Department for
Work and Pensions (DWP).
Tenant Breakdown by 1Q21 Gross Rental Income
Source: Company
High occupancy of 100% and long WALE of 7.2 years as at
Mar 2021. The portfolio is fully occupied with a long WALE.
Assuming the tenant does not terminate its lease on the
permissible break dates, 93.2% of total portfolio rent will
only expire in 2028. We think that it is unlikely for DWP, the
primary tenant, to exercise the option to break the lease as
the properties in the portfolio are crucial infrastructure
integral to UK’s social fabric and are relevant in meeting
social security needs of the UK in the long run. Tenant DWP
has also invested in the maintenance and upkeep of the
properties, suggesting a lower probability of breaking the
lease.
Potential significant uplift in valuations if breaks are not
exercised. Approximately 64.5% of total portfolio rent have
lease break options that will come into effect in Mar 2023.
The leases will continue till Mar 2028 if break options are
not exercised by Mar 2022 as tenants have to give a one-
year notice, which we understand have not been served.
Our current book values are conservative as we have
assumed that half of the break options will be exercised.
Given that it is highly unlikely that the tenants will exercise
this break option, we can expect to see a significant uplift in
book valuations, bringing P/NAV down to <1.0x once we
confirm that the option is not exercised by Mar 2022.
Embedded rental growth from inflation-linked rental
escalations. The leases to the UK government have rent
reviews every five years based on the UK Consumer Price
Index (“CPI”), subject to an annual minimum increase of
1.0% and maximum of 5.0%. This provides the portfolio
with built-in upside from the rental uplifts. With the next
rent review in Apr 2023, we can expect to see an increase
of c.8% in rental growth for leases with rent review,
resulting in c.7.4% rental growth for the portfolio.
Resilient portfolio provides stable returns. DWP, its primary
tenant, is UK government’s largest public service
department. It is responsible for welfare, pensions, and
child maintenance for c.20m claimants, which is c.30% of
the UK population. As claimant count is highly correlated
with unemployment, DWP is a unique counter-cyclical
occupier, which implies stability throughout economic
cycles. The REIT has also consistently achieved c.100% of
rent collection in advance since listing, notwithstanding UK
lockdowns and Brexit as the portfolio maintains 99%
exposure to AA-rated UK government with low default risk.
Alignment of interest and support from Sponsors. The
Sponsors, Elite Partners Holdings Pte. Ltd. (“EPH”), Ho Lee
Group Pte. Ltd. (“HLG”) and Sunway RE Capital Pte. Ltd.
(“Sunway”), have each provided Elite Commercial REIT a
right of first refusal (ROFR) over all future UK commercial
acquisitions. The Manager believes it will be able to
leverage on the Sponsor Group’s extensive expertise and
strong sourcing capabilities, to pursue DPU, value and
quality-accretive acquisition opportunities for Elite
Commercial REIT to grow its portfolio. These opportunities
are available to the REIT through the ROFR pipeline from
Sponsors and open market supply.
Page 4
Company Focus
Elite Commercial REIT
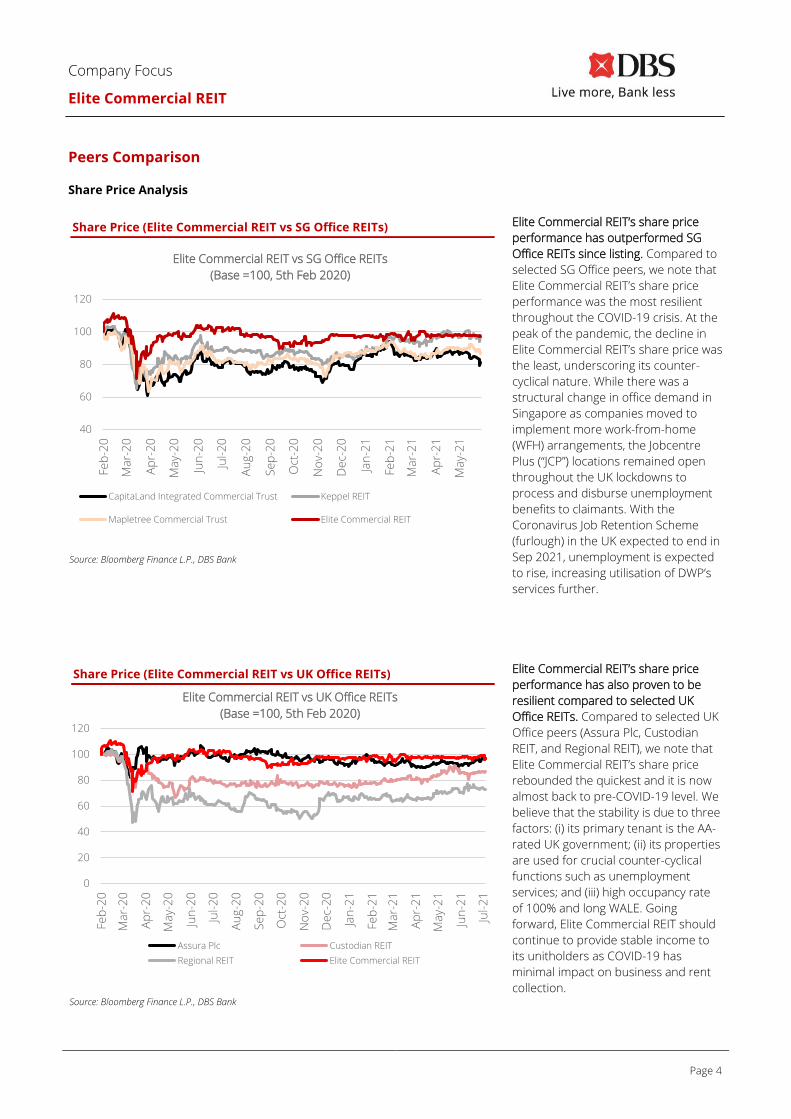
Peers Comparison Share Price Analysis
Source: Bloomberg Finance L.P., DBS Bank
Elite Commercial REIT’s share price
performance has outperformed SG
Office REITs since listing. Compared to
selected SG Office peers, we note that
Elite Commercial REIT’s share price
performance was the most resilient
throughout the COVID-19 crisis. At the
peak of the pandemic, the decline in
Elite Commercial REIT’s share price was
the least, underscoring its counter-
cyclical nature. While there was a
structural change in office demand in
Singapore as companies moved to
implement more work-from-home
(WFH) arrangements, the Jobcentre
Plus (“JCP”) locations remained open
throughout the UK lockdowns to
process and disburse unemployment
benefits to claimants. With the
Coronavirus Job Retention Scheme
(furlough) in the UK expected to end in
Sep 2021, unemployment is expected
to rise, increasing utilisation of DWP’s
services further.
Source: Bloomberg Finance L.P., DBS Bank
Elite Commercial REIT’s share price
performance has also proven to be
resilient compared to selected UK
Office REITs. Compared to selected UK
Office peers (Assura Plc, Custodian
REIT, and Regional REIT), we note that
Elite Commercial REIT’s share price
rebounded the quickest and it is now
almost back to pre-COVID-19 level. We
believe that the stability is due to three
factors: (i) its primary tenant is the AA-
rated UK government; (ii) its properties
are used for crucial counter-cyclical
functions such as unemployment
services; and (iii) high occupancy rate
of 100% and long WALE. Going
forward, Elite Commercial REIT should
continue to provide stable income to
its unitholders as COVID-19 has
minimal impact on business and rent
collection.
Share Price (Elite Commercial REIT vs SG Office REITs)
Share Price (Elite Commercial REIT vs UK Office REITs)
40
60
80
100
120
Feb
-20
Ma
r-2
0
Ap
r-2
0
Ma
y-2
0
Jun
-20
Jul-
20
Au
g-2
0
Se
p-2
0
Oct
-20
No
v-2
0
De
c-2
0
Jan
-21
Feb
-21
Ma
r-2
1
Ap
r-2
1
Ma
y-2
1
Elite Commercial REIT vs SG Office REITs
(Base =100, 5th Feb 2020)
CapitaLand Integrated Commercial Trust Keppel REIT
Mapletree Commercial Trust Elite Commercial REIT
0
20
40
60
80
100
120
Feb
-20
Ma
r-2
0
Ap
r-2
0
Ma
y-2
0
Jun
-20
Jul-
20
Au
g-2
0
Se
p-2
0
Oct
-20
No
v-2
0
De
c-2
0
Jan
-21
Feb
-21
Ma
r-2
1
Ap
r-2
1
Ma
y-2
1
Jun
-21
Jul-
21
Elite Commercial REIT vs UK Office REITs
(Base =100, 5th Feb 2020)
Assura Plc Custodian REIT
Regional REIT Elite Commercial REIT

Page 5
Company Focus
Elite Commercial REIT
P/NAV Analysis
S-REITs are currently trading at a weighted average P/NAV
multiple of 1.05x. REITs with predominantly overseas
assets usually trade at a discount to their Singapore-
focused counterparts. As investors usually perceive higher
risks with a portfolio that is based overseas, S-REITs
typically trade at a slight premium to S-REITs with
predominantly overseas assets.
Given that Elite Commercial REIT’s portfolio is entirely made
up of overseas assets, we believe that overseas office S-
REITs are better peer comparisons. We select Prime US
REIT and IREIT Global as they have portfolios that are
based entirely overseas. UK-listed Assura Plc also works
well as a peer comparison for Elite Commercial REIT, as it is
the closest competitor in the social infrastructure space in
the UK.
The three identified peers are currently trading at P/NAV
multiples of between 1.0x to 1.3x. Given Elite Commercial
REIT’s relatively comparable exposure and high degree of
diversification, our target P/NAV multiple values Elite
Commercial REIT at 1.2x. We believe that this valuation is
undemanding as the identified peers are trading within the
1.0x to 1.3x range. Moreover, Elite Commercial REIT's
portfolio is 99% leased to UK Government linked entities
and we expect it to have minimal risks.
Yield Comparison
As vaccination rates ramp up and the number of COVID-19
cases trend downwards, economies are expected to
rebound from the lows of FY20. Similarly, S-REITs’ earnings
are expected to recover and the average forward yields for
the sector are now 6.0% and 6.6% for FY21F and FY22F
respectively.
Compared to their Singapore-focused peers, S-REITs with
predominantly overseas assets are generally expected to
offer higher yields. Prime US REIT, which is a pure-play US
office REIT, is projected to generate forward yields of 7.8%
and 8.0% in FY21F and FY22F respectively. IREIT, which
invests in office properties in Europe, is forecast to deliver
forward yields of between 5.9% and 7.0% in the next two
years. Assura Plc’s forward yields are 3.8% and 3.9% in
FY21F and FY22F respectively.
Using these three REITs as a peer comparison set, we
believe that Elite Commercial REIT should be priced at a
level where its forward yields fall between 3.8% and 8.0%
over the next two years. Based on our valuations, Elite's
target yield of 6.3% and 6.8% is well within the range where
its peers are trading at now. Having a significantly smaller
market cap than Assura, we expect Elite Commercial REIT
to trade at a premium to Assura's yields. However, when
compared to Prime's and IREIT's yields, we believe that
Elite's target yield is undemanding. Again, Elite's leases are
almost entirely leased to the DWP (UK government linked
entity) and we believe that the stable and visible cash flows
from its portfolio warrants it to trade at a yield that is at
least comparable to its overseas S-REIT peers. On a yield
comparison basis, the average of the three identified peers’
FY21F/FY22F forward yields are 5.8% and 6.3%. Hence, we
believe that a forward FY21F yield of 7.6% is a fair target.
REIT
Mkt
Cap
(S$’bn)
Geographical Exposure Share
Price
Current Yield Current
P/NAV
Target Yield Target
P/NAV Singapore UK /
Europe Others FY21 FY22 FY21 FY22
Assura Plc 3.85 0% 100% 0% 76.55 3.8% 3.9% 1.3x 3.5% 3.6% 1.4x
Manulife US REIT 1.71 0% 0% 100% 0.80 7.4% 7.8% 1.1x 6.6% 6.9% 1.2x
Prime US REIT 1.33 0% 0% 100% 0.85 7.8% 8.0% 1.0x 6.6% 6.8% 1.2x
Keppel Pacific Oak REIT 1.03 0% 0% 100% 0.81 7.5% 7.7% 1.0x 7.1% 7.3% 1.0x
IREIT 0.61 0% 100% 0% 0.64 5.9% 7.0% 1.4x 5.0% 5.9% 1.6x
Elite Commercial REIT 0.58 0% 100% 0% 0.67 7.6% 8.2% 1.0x 6.3% 6.8% 1.2x
Average 6.6% 7.1% 1.1x 5.8% 6.2% 1.3x
Average of three
identified peers 5.8% 6.3% 1.2x 5.0% 5.5% 1.4x
Source: Bloomberg Finance L.P., DBS Bank

Page 6
Company Focus
Elite Commercial REIT
Valuation
Discounted cash flow (DCF) valuation method. We have
assessed Elite Commercial REIT’s fair value using the DCF
valuation method, given its relatively stable and visible
cashflows due to the portfolio’s high occupancy rates and
long WALE. The triple-net leases will also limit large
fluctuations to expenses. As such, we believe that the DCF
method would be an appropriate valuation tool.
We derive a fair value of GBP0.80. Our DCF analysis has
factored in a normalised risk-free rate of 2.0%, market
return of 9.4% and beta of 0.78x. The 5.5% WACC reflects
cost of equity of 7.8% and post-tax cost of debt of 2.0%.
Assuming terminal growth rate of 1.0%, we derive a fair
value of GBP0.80 using DCF. This implies a yield of
7.6%/8.2% for FY21F/FY22F.
Sensitivity analysis. Elite Commercial REIT’s valuation is
more sensitive to changes in WACC than terminal growth.
For every 1-ppt change in WACC, our DCF valuation would
move by c.46% while a 1-ppt shift in terminal growth would
result in a c.28% shift in DCF value.
Source: DBS Bank Estimates
DCF Analysis
FY Dec (GBPm) FY21F FY22F FY23F FY24F FY25F FY26F FY27F FY28F FY29F FY30F Terminal Value
EBIT 28.3 31.3 33.8 34.0 34.0 34.0 34.0 36.8 36.9 37.0
Depreciation 0.0 0.0 0.0 0.0 0.0 0.0 0.0 0.0 0.0 0.0
Tax Provision (4.5) (4.9) (5.3) (5.3) (5.3) (5.3) (5.3) (5.9) (5.9) (5.9)
Capex (215.9) 0.0 0.0 0.0 0.0 0.0 0.0 0.0 0.0 0.0
Chngs to Wkg Cap 5.6 5.4 5.7 5.3 5.4 5.3 5.3 6.2 5.8 5.8
FCF to the Firm (186.5) 31.8 34.2 34.0 34.0 34.0 34.0 37.1 36.8 36.9 720.0
PV of FCF 51.5
PV of Terminal Value 423.0
Net Cash / (Debt) (81.8)
Equity Value (GBPm) 392.7
Price per Share (GBP) 0.80
Risk Free Rate (Rf) 2.0%
Market Return 9.4%
Beta 0.78
Cost of Equity (Ke) 7.8%
% of debt financing 40.0%
After-tax cost of debt 2.0%
WACC 5.5%
Terminal Growth 1.0%
Source: DBS Bank Estimates
Terminal Growth
0.50% 0.75% 1.00% 1.25% 1.50%
WA
CC
4.5% 1.02 1.09 1.18 1.28 1.39
5.0% 0.84 0.90 0.96 1.03 1.11
5.5% 0.71 0.75 0.80 0.85 0.91
6.0% 0.59 0.63 0.66 0.70 0.75
6.5% 0.50 0.53 0.56 0.59 0.62
Sensitivity of DCF to changes in Terminal Growth Rate

Page 7
Company Focus
Elite Commercial REIT
Key Risks Tenant risks. Elite Commercial REIT is dependent on the UK
government for over 99% of rental payments. If the
government agencies do not renew a significant portion of
their leases, and no replacement tenants are found, this
may have an adverse impact on the financial condition and
results of operations of Elite Commercial REIT, as well as
the ability of the REIT to make regular distributions to
unitholders.
However, this risk is mitigated as each of the existing lease
agreements with The Secretary of State for Housing,
Communities and Local Government contains a clause that
requires a one-year notice period for termination, which
provides the Manager sufficient time to source and secure
new tenants.
Concentration risks. The majority of lease agreements are
due to expire in 2028, with certain lease agreements
containing an option for termination in 2023. Such
properties which have lease agreements that contain the
option for the tenant to terminate in 2023 account for
c.70% of the total revenue of Elite Commercial REIT.
Revenue may be adversely affected if majority of these
leases are not renewed or if suitable replacement tenants
are not found.
However, the properties are well-located and close to
amenities and public transportation, hence they may be
easily converted to other uses.
Country risks. Elite Commercial REIT is exposed to country
risk including economic changes, political changes or policy
changes in the UK where all of its properties are located. As
the UK economy is affected by global economic conditions,
a change in the strength of the global economy might
result in a downturn in the economy in the UK which might
negatively affect tenant demand for Elite Commercial REIT’s
properties. This in turn could negatively impact income and
distributions to unitholders of Elite Commercial REIT.
Interest rate risks. While interest rates are still relatively low
currently, inflationary pressures might build up due to
extremely dovish policies. If interest rates go up, Elite
Commercial REIT might face higher borrowing costs and
increased interest rate risk going forward, which could
negatively impact its distributions. However, we
understand that Elite Commercial REIT has already entered
into interest rate hedges for c.63% of its borrowings which
will mitigate such risks in the medium term.
Regulatory risks. The properties are based in the UK, with a
holding company in the British Virgin Islands (“BVI”). The
laws and regulations in Singapore, UK and BVI, as well as
the International Financial Reporting Standards (“IFRS”) are
subject to change, Should there be any changes, this may
affect the current REIT structure and ability to repatriate
cash in a tax efficient manner, potentially negatively
affecting distributions paid to unitholders.

Page 8
Company Focus
Elite Commercial REIT
SWOT Analysis
Strengths Weakness
• Diversified portfolio across the UK. The portfolio is
geographically diversified across the UK, with a particular
concentration in areas of higher population density and/or
close to major urban and metropolitan areas. The
properties used for Jobcentre Plus centres are also close to
public transport and other amenities, hence easily
accessible to the general population.
• Stable cash flow backed by AA-rated UK government, its
primary tenant. Over 99% of the portfolio’s gross rental
income in FY2020 was derived from the current leases with
primary tenant, DWP. This has enabled the REIT to
consistently achieve approximately 100% of rent collection
in advance since listing, notwithstanding UK lockdown and
Brexit.
• Embedded rental growth from inflation-linked rental
escalations. The leases to the UK government have rent
reviews every five years based on the UK Consumer Price
Index (“CPI”), subject to an annual minimum increase of
1.0% and maximum of 5.0%. As a result, there is upside
built into the lease agreements.
• Concentration risk. The portfolio is based entirely in
the UK and used primarily for office purposes. This
exposes Elite Commercial REIT to the risk of an economic
downturn in the UK in general, which may lead to a
decline in occupancy and rental income.
• Regulatory risk. The properties are based overseas in
the UK, with a holding company in the British Virgin
Islands (“BVI”). The laws and regulations in Singapore, UK
and BVI, as well as the International Financial Reporting
Standards (“IFRS”) are subject to change, potentially
affecting Elite Commercial REIT.
Opportunities Threats
• Growth from acquisition opportunities in UK, the most
liquid real estate market in Europe. Elite Commercial REIT is
able to leverage on its sponsors’ extensive expertise and
strong sourcing capabilities in the UK. They have each
provided Elite Commercial REIT a right of first refusal over
all future UK acquisitions.
• Resilience of a counter-cyclical portfolio. Should the
economic impact from Covid-19 worsen, unemployment
rate and claimant count will rise, increasing utilisation of
DWP’s services. However, it will have minimal impact on
Elite Commercial REIT’s operations and rent collection.
• Properties with lease agreements that contain an
option for tenant to terminate in 2023 account for c.70%
of total revenue. Revenue may be adversely affected if
majority of these leases are not renewed or if Elite
Commercial REIT is unable to source for suitable
replacement tenants.
• Gearing level is rising. Current aggregate leverage of
42.1% leaves little available debt headroom. Funding
restrictions may be imposed should the limit breach the
50% mark set by Monetary Authority of Singapore (MAS).
Source: DBS Bank

Page 9
Company Focus
Elite Commercial REIT
Resilient Portfolio
Unique counter-cyclical occupier provides stable cash flows
even in economic downturns. Elite Commercial REIT’s
primary tenant is the Department for Work and Pensions
(“DWP”), UK’s largest public service department. For the 12
months ended 31 Mar 2020, the DWP served over 20m
claimants and customers with a budget of £191bn in
benefits. DWP plays a vital role in the delivery of public
services to more than 66m UK citizens, supporting those
who depend on government measures, especially with
COVID-19 that has weakened the UK economy and raised
unemployment.
Within the portfolio, 123 out of 155 properties function as
Jobcentre Plus (part of the DWP), which is a government-
funded employment agency and social security office whose
aim is to help people of working age find employment in the
UK. Assistance provided include career advisory services,
unemployment benefits arrangements and job-matching
services. Hence, in an economic downturn like now, the
portfolio is especially resilient given that claimant counts, job
centre footfall and DWP benefit spending are all highly
correlated to unemployment. Even during nationwide
lockdowns from COVID-19, Jobcentre Plus locations
remained open and operational with minimal disruption,
demonstrating DWP’s uniquely counter-cyclical operations.
Going forward, we expect footfall to DWP offices to increase
as the Coronavirus Job Retention Scheme (furlough) ends in
Sep 2021, with 4.7m people on furlough as of 31 Jan 2020.
With the unemployment rate rising, these Jobcentre Plus
offices are even more crucial to UK’s social fabric.
Usage of properties ties in with social security needs of the
UK, ensuring relevance in the long run. Aside from
unemployment services, other crucial DWP services will help
to address the challenges the UK will face: (i) UK’s
population is ageing, and it is projected that one in four
people in the UK will be aged 65 years and older by 2050, an
increase from approximately one in five just two years ago,
according to the Office for National Statistics. This drives
long-term structural demand growth for pension services,
which is one of the services provided; (ii) Child maintenance
services, which will be required regardless of economic
conditions; and (iii) Disability services, which will also be
required regardless of economic conditions. The portfolio
represents crucial public infrastructure for the provision of
DWP services and will continue to be needed in the long
run.
Portfolio maintains 99% exposure to AA-rated UK
government with low default risk. Over 99% of the portfolio’s
gross rental income in FY2020 was derived from leases from
the AA-rated (by S&P) UK government. The occupier mix is
now diversified to include other government agencies as
well, such as the Ministry of Defence, National Records of
Scotland, Her Majesty’s Courts and Tribunals Service,
National Resources of Wales and Environmental Agency.
This has enabled the REIT to consistently achieve
approximately 100% of rent collection in advance since
listing, notwithstanding UK lockdowns and Brexit.
Over 99% of gross rental income derived from full repairing
and insuring (triple net) leases. The responsibility for the
repair of the external, internal, and structural format of the
property is placed with the tenant. Elite Commercial REIT, as
the landlord, has no repairing or insuring liability and will not
be required to bear the costs of material repairs to the
properties, if any. This helps to reduce risks caused by
damages to the properties and limit large fluctuations to
capex requirements.
Built-in upside from inflation-linked rental uplifts. The leases
to the UK government have rent reviews every five years
based on the UK Consumer Price Index (“CPI”), subject to an
annual minimum increase of 1.0% and maximum of 5.0%.
This provides the portfolio with an embedded rental growth
profile that benefits from rent escalation; the upcoming rent
review will be in Apr 2023. The Bank of England forecasts
CPI to be 1.7%/2.3% in FY21F/22F. However, we have taken
a slightly more conservative stance and assumed 1.5%/1.9%
for FY21F/22F, bringing the cumulative five-year CPI forecast
to 8%. We have thus assumed that the rental growth will be
c.8% in 2023 for leases that have rent reviews, which is
majority of the portfolio, resulting in c.7.4% rental growth in
the portfolio.
2018 2019 2020 2021F 2022F Cumulative
Bank of
England
Forecast 2.5% 1.5% 0.6%
1.7% 2.3% 8.6%
DBS
Forecast 1.5% 1.9% 8.0%
Source: Bank of England, DBS Bank Estimates
Strong acquisition pipeline. Elite Commercial REIT plans to
acquire £250-300m in assets annually. The Manager
believes it will be able to leverage on the Sponsor group’s
extensive expertise and strong sourcing capabilities, to
pursue DPU, value and quality-accretive acquisition
opportunities for Elite Commercial REIT to grow its portfolio.
These opportunities are available to the REIT through a
pipeline from Sponsors, who have provided Elite
Commercial REIT a right of first refusal (ROFR) over all future
UK commercial acquisitions. Target properties to be
acquired can be obtained from the open market or third
parties as well.
Page 10
Company Focus
Elite Commercial REIT
Upside Potential
Significant uplift in valuations if breaks not exercised.
Approximately 64.5% of the REIT’s portfolio have lease
break options that will come into effect in Mar 2023. The
leases will continue till Mar 2028 if break options are not
exercised by Mar 2022 as tenants have to give a one-year
notice. Current valuations assume that half of the break
options will be exercised. However, we think that it is
unlikely for tenants to exercise the break option as these
properties are assets that provide crucial DWP services to
c.30% of the UK population. In FY20, there was a £3.0m
valuation uplift from £3.6m to £6.6m (84% uplift in value)
after the removal of the lease break clause for Lodge
House, Bristol. Hence, we can expect to see a huge
increase in valuations if the breaks are not exercised by
Mar 2022.
Asset Enhancement Potential. The Manager expects to
improve the rental income generation ability and value of
the portfolio through accretive asset enhancements. At the
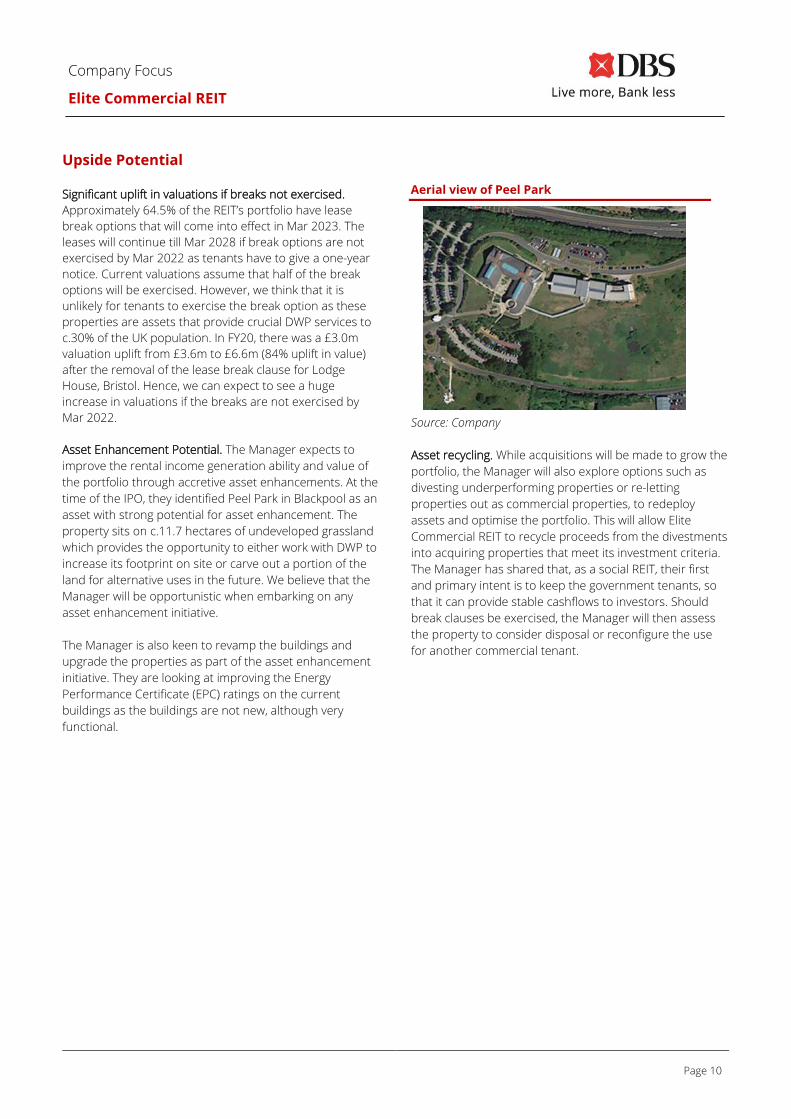
time of the IPO, they identified Peel Park in Blackpool as an
asset with strong potential for asset enhancement. The
property sits on c.11.7 hectares of undeveloped grassland
which provides the opportunity to either work with DWP to
increase its footprint on site or carve out a portion of the
land for alternative uses in the future. We believe that the
Manager will be opportunistic when embarking on any
asset enhancement initiative.
The Manager is also keen to revamp the buildings and
upgrade the properties as part of the asset enhancement
initiative. They are looking at improving the Energy
Performance Certificate (EPC) ratings on the current
buildings as the buildings are not new, although very
functional.
Source: Company
Asset recycling. While acquisitions will be made to grow the
portfolio, the Manager will also explore options such as
divesting underperforming properties or re-letting
properties out as commercial properties, to redeploy
assets and optimise the portfolio. This will allow Elite
Commercial REIT to recycle proceeds from the divestments
into acquiring properties that meet its investment criteria.
The Manager has shared that, as a social REIT, their first
and primary intent is to keep the government tenants, so
that it can provide stable cashflows to investors. Should
break clauses be exercised, the Manager will then assess
the property to consider disposal or reconfigure the use
for another commercial tenant.
Aerial view of Peel Park

Page 11
Company Focus
Elite Commercial REIT
Environment, Social & Governance (ESG)
Elite Commercial REIT understands the importance of
delivering sustainable value in communities where the REIT
operates to make a positive contribution to stakeholders.
Environment: Elite Commercial REIT recognises that the
quality and environmental credentials of the portfolio are
crucial to maintaining the resilience of its business. Hence,
they actively explore ways to improve the energy rating of
buildings and condition of properties. Some of the
initiatives include introducing new ground source or air
source heating systems, which would reduce power usage.
They are also working with the tenant to allow for new
glazing and energy saving lighting systems, which will
improve energy efficiency. Management has shared that
they are willing to allocate a portion of the uplift in
valuations to improvement works.
Social: The properties in Elite Commercial REIT’s portfolio
are assets used to support social welfare. Over 99% of the
portfolio’s gross rental income in FY20 was derived from
DWP, a government agency that plays a crucial role in UK’s
social infrastructure with the provision of unemployment
services, pension services, child maintenance services and
disability services.

Page 12
Company Focus
Elite Commercial REIT
Portfolio Overview
Predominantly freehold office assets that are
geographically diversified across the UK and conveniently
located. The portfolio value as of Mar 2021 is £515.3m. Of
the 155 properties, 150 properties are freehold and five
are on long leasehold tenures. The portfolio is
geographically diversified across the UK, located in densely
populated areas and primarily in town centres close to
public transport nodes, ensuring accessibility.
High occupancy of 100% and long weighted average lease
expiry (WALE) of 7.2 years as at Mar 2021. The portfolio is
fully occupied with long WALE. Assuming the tenant does
not terminate lease on the permissible break dates, 93.2%
of the portfolio rent expires in 2028. We think it is unlikely
for DWP, the primary tenant, to exercise the option to
break the lease as they have invested in the maintenance
and upkeep of the properties.
Geographical Spread of 155 Properties Across UK
Source: Company
Lease Expiry Profile as at 31 Mar 2021
WALB: Weighted Average Lease To Break
Source: Company

Page 13
Company Focus
Elite Commercial REIT
Salient Details of Properties in the Portfolio
No. Property Function Net Internal
Area (sqft)
Valuation
(GBP)
2020 Gross
Revenue
(GBP)
Occupancy
Rate as of
31 Mar 2021
Tenure as
of 31 Dec
2020
London and South East
1 Beaufort House, Harlow Jobcentre Plus 28,170 6,735,000 433,899 100% Freehold
2 Broadlands House, Newport (IOW) Jobcentre Plus 31,930 7,980,000 468,311 100% Freehold
3 Crown Building, Banbury Jobcentre Plus 25,051 3,930,000 253,085 100% Freehold
4 Crown Buildings, Colchester Jobcentre Plus 19,152 3,655,000 204,330 100% Freehold
5 Crown House, Chatham Jobcentre Plus 30,317 6,710,000 432,326 100% Freehold
6 Crown House, Worthing Jobcentre Plus 31,503 5,825,000 326,711 100% Freehold
7 East Street, Epsom Jobcentre Plus 8,687 2,415,000 143,158 100% Freehold
8 Gloucester House, Bognor Regis Jobcentre Plus 21,254 2,885,000 214,083 100% Freehold
9 High Road, Ilford Jobcentre Plus 18,741 6,535,000 356,394 100% Freehold
10 Nutwood House, Canterbury Back Office 27,673 9,160,000 512,000 100% Freehold
11 Palting House, Folkestone Jobcentre Plus 36,566 4,585,000 268,840 100% Freehold
12 Rishton House, Lowestoft Jobcentre Plus 41,656 2,890,000 214,530 100% Freehold
13 South Western House, Aldershot Jobcentre Plus 19,924 2,555,000 164,174 100% Freehold
14 St Andrew's House, Bury St Edmunds Jobcentre Plus 28,863 3,320,000 229,930 100% Freehold
15 The Forum, Stevenage Jobcentre Plus /
Retail 18,609 5,010,000 272,522 100% Freehold
16 Wyvern House, Bedford Jobcentre Plus 23,803 3,160,000 187,741 100% Freehold
17 Crown House Jobcentre Plus 34,729 12,200,000 - 100% Freehold
18 Medina Road Jobcentre Plus 15,366 6,400,000 - 100% Freehold
19 Raydean House Jobcentre Plus 21,958 8,300,000 - 100% Freehold
20 Oates House Jobcentre Plus 14,659 8,600,000 - 100% Freehold
21 Collyer Court Jobcentre Plus 15,586 8,400,000 - 100% Freehold
22 Peckham High Street Jobcentre Plus 17,967 9,600,000 - 100% Freehold
23 Broadway House Jobcentre Plus 17,218 10,900,000 - 100% Freehold
24 Finchley Lane Jobcentre Plus 15,424 5,600,000 - 100% Freehold
25 Kilner House Jobcentre Plus 13,145 6,300,000 - 100% Freehold
26 Tonbridge Crown Buildings Jobcentre Plus 10,549 3,000,000 - 100% Freehold
27 Medwyn House Jobcentre Plus 23,218 6,000,000 - 100% Freehold
28 St. Cross House Jobcentre Plus 42,985 5,500,000 - 100% Freehold
Source: Company

Page 14
Company Focus
Elite Commercial REIT
No. Property Function Net Internal
Area (sqft)
Valuation
(GBP)
2020 Gross
Revenue
(GBP)
Occupancy
Rate as of
31 Mar 2021
Tenure as
of 31 Dec
2020
South West
1 Brendon House, Taunton Jobcentre Plus 41,750 5,705,000 381,723 100% Freehold
2 Cotswold House, Torquay Back Office 21,895 3,110,000 206,540 100% Freehold
3 Cyppa Court, Chippenham Jobcentre Plus 12,299 2,100,000 - 100% Freehold
4 Hanover House, Bridgwater Jobcentre Plus 21,598 2,100,000 - 100% Freehold
5 Kent Street, Bristol Jobcentre Plus 6,339 1,075,000 95,083 100% Freehold
6 Lodge House, Bristol* Back Office 25,979 6,550,000 366,588 100% Freehold
7 Monks Park Avenue, Bristol Jobcentre Plus 10,183 2,070,000 115,477 100% Freehold
8 Queen's House, Plymouth Jobcentre Plus 14,094 1,400,000 - 100% Freehold
9 Regent House, Weston Super Mare Jobcentre Plus /
Retail 21,704 2,685,000 212,637 100% Freehold
10 Spring Gardens House, Swindon Jobcentre Plus 47,918 8,035,000 617,373 100% Freehold
11 St Paul's House, Chippenham Back Office 16,207 3,675,000 272,877 100% Freehold
12 Summerlock House, Salisbury Jobcentre Plus 17,136 2,775,000 185,327 100% Freehold
*Lodge House, Bristol – break option not exercised, lease will expire on 31 March 2028
Source: Company
No. Property Function Net Internal
Area (sqft)
Valuation
(GBP)
2020 Gross
Revenue
(GBP)
Occupancy
Rate as of
31 Mar 2021
Tenure as
of 31 Dec
2020
Midlands
1 Acacia Walk, Nottingham Jobcentre Plus 4,306 785,000 57,656 100% Freehold
2 Beecroft Road, Cannock Jobcentre Plus 31,517 1,850,000 137,015 100% Freehold
3 Bristol Road South, Birmingham Jobcentre Plus 18,996 4,300,000 - 100% Freehold
4 Crown Buildings, Ilkeston Jobcentre Plus 18,352 1,430,000 112,904 100% Freehold
5 Crown House, Burton On Trent Jobcentre Plus 45,897 1,790,000 128,185 100% Freehold
6 Crown House, Grantham Jobcentre Plus 24,962 2,535,000 141,407 100% Freehold
7 George Street, Corby Jobcentre Plus 8,847 1,300,000 - 100% Freehold
8 High Street, Bliston Jobcentre Plus 10,779 1,700,000 - 100% Freehold
9 Holborn House, Derby Call Centre 35,120 6,300,000 452,639 100% Freehold
10 Lothersdale House, Wellingborough Jobcentre Plus 32,113 4,120,000 262,055 100% Freehold
11 Saxon Mill Lane, Tamworth Jobcentre Plus 10,698 1,400,000 - 100% Freehold
12 Scotland House, Stourbridge Jobcentre Plus 12,452 1,800,000 - 100% Freehold
13 St Katherine's House, Northampton Back Office 27,745 2,100,000 - 100% Freehold
14 Tannery House, Alfreton Jobcentre Plus 10,226 1,100,000 86,499 100% Freehold
15 Temple House, Wolverhampton Jobcentre Plus 27,523 3,000,000 - 100% Freehold
16 Upper Huntbach Street, Stoke On Trent Jobcentre Plus 21,540 2,830,000 209,815 100% Freehold
17 Washwood Heath Road, Birmingham Jobcentre Plus 14,922 1,000,000 - 100% Freehold
Source: Company
Page 15
Company Focus
Elite Commercial REIT
No. Property Function Net Internal
Area (sqft)
Valuation
(GBP)
2020 Gross
Revenue
(GBP)
Occupancy
Rate as of
31 Mar 2021
Tenure as
of 31 Dec
2020
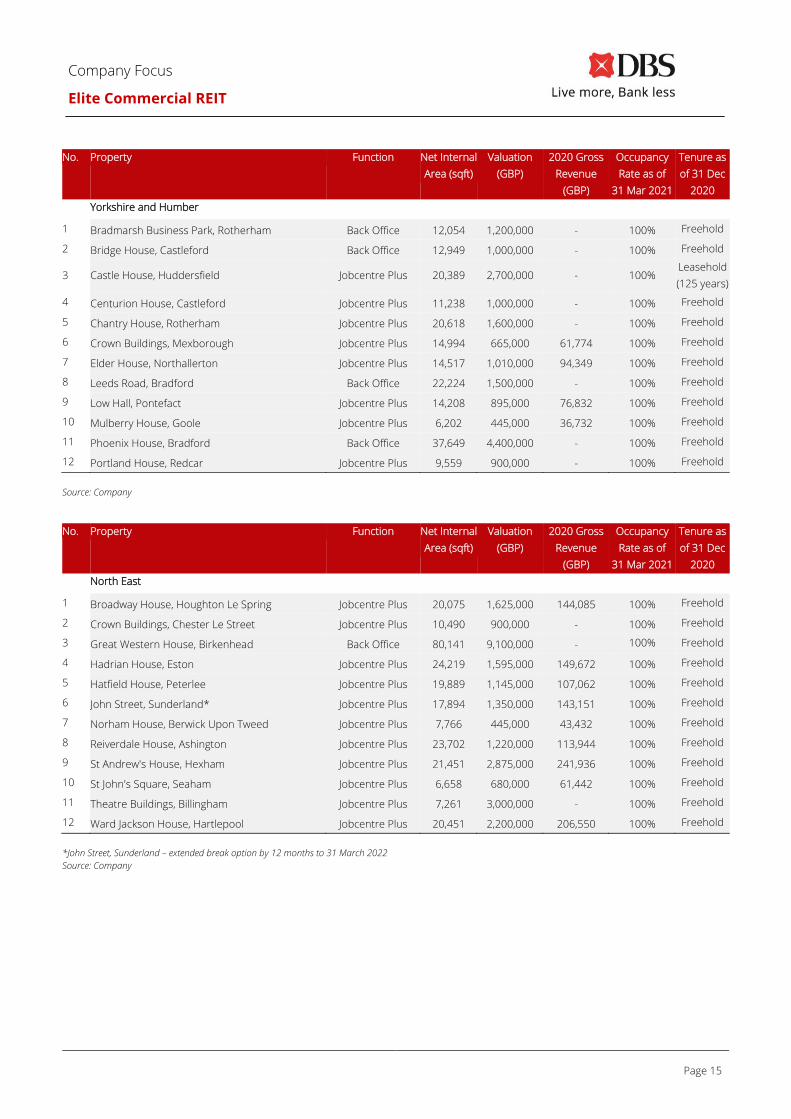
Yorkshire and Humber
1 Bradmarsh Business Park, Rotherham Back Office 12,054 1,200,000 - 100% Freehold
2 Bridge House, Castleford Back Office 12,949 1,000,000 - 100% Freehold
3 Castle House, Huddersfield Jobcentre Plus 20,389 2,700,000 - 100% Leasehold
(125 years)
4 Centurion House, Castleford Jobcentre Plus 11,238 1,000,000 - 100% Freehold
5 Chantry House, Rotherham Jobcentre Plus 20,618 1,600,000 - 100% Freehold
6 Crown Buildings, Mexborough Jobcentre Plus 14,994 665,000 61,774 100% Freehold
7 Elder House, Northallerton Jobcentre Plus 14,517 1,010,000 94,349 100% Freehold
8 Leeds Road, Bradford Back Office 22,224 1,500,000 - 100% Freehold
9 Low Hall, Pontefact Jobcentre Plus 14,208 895,000 76,832 100% Freehold
10 Mulberry House, Goole Jobcentre Plus 6,202 445,000 36,732 100% Freehold
11 Phoenix House, Bradford Back Office 37,649 4,400,000 - 100% Freehold
12 Portland House, Redcar Jobcentre Plus 9,559 900,000 - 100% Freehold
Source: Company
No. Property Function Net Internal
Area (sqft)
Valuation
(GBP)
2020 Gross
Revenue
(GBP)
Occupancy
Rate as of
31 Mar 2021
Tenure as
of 31 Dec
2020
North East
1 Broadway House, Houghton Le Spring Jobcentre Plus 20,075 1,625,000 144,085 100% Freehold
2 Crown Buildings, Chester Le Street Jobcentre Plus 10,490 900,000 - 100% Freehold
3 Great Western House, Birkenhead Back Office 80,141 9,100,000 - 100% Freehold
4 Hadrian House, Eston Jobcentre Plus 24,219 1,595,000 149,672 100% Freehold
5 Hatfield House, Peterlee Jobcentre Plus 19,889 1,145,000 107,062 100% Freehold
6 John Street, Sunderland* Jobcentre Plus 17,894 1,350,000 143,151 100% Freehold
7 Norham House, Berwick Upon Tweed Jobcentre Plus 7,766 445,000 43,432 100% Freehold
8 Reiverdale House, Ashington Jobcentre Plus 23,702 1,220,000 113,944 100% Freehold
9 St Andrew's House, Hexham Jobcentre Plus 21,451 2,875,000 241,936 100% Freehold
10 St John's Square, Seaham Jobcentre Plus 6,658 680,000 61,442 100% Freehold
11 Theatre Buildings, Billingham Jobcentre Plus 7,261 3,000,000 - 100% Freehold
12 Ward Jackson House, Hartlepool Jobcentre Plus 20,451 2,200,000 206,550 100% Freehold
*John Street, Sunderland – extended break option by 12 months to 31 March 2022
Source: Company

Page 16
Company Focus
Elite Commercial REIT
No. Property Function Net Internal
Area (sqft)
Valuation
(GBP)
2020 Gross
Revenue
(GBP)
Occupancy
Rate as of
31 Mar 2021
Tenure as
of 31 Dec
2020
North West
1 Beech House, Hyde Jobcentre Plus 39,550 2,375,000 223,037 100% Freehold
2 Blackburn Road, Burnley Call Centre 46,405 5,605,000 472,113 100% Freehold
3 Duchy House, Preston Back Office 43,805 4,000,000 244,825 100% Freehold
4 Heron House, Stockport Jobcentre Plus 43,271 4,070,000 322,490 100% Freehold
5 Hilden House, Warrington Back Office 50,841 7,065,000 560,215 100% Freehold
6 Hougoumont House, Liverpool Jobcentre Plus 17,082 1,255,000 105,091 100% Freehold
7 Lee-Moran House, Burnley Jobcentre Plus 17,886 2,030,000 170,407 100% Freehold
8 Mitre House, Lancaster Jobcentre Plus 64,597 4,335,000 409,806 100% Freehold
9 Palatine House, Preston Back Office 36,257 3,385,000 207,079 100% Freehold
10 Peel Park, Blackpool Back Office 156,542 26,900,000 1,695,000 100% Freehold
11 Roskell House, Fleetwood Jobcentre Plus 5,863 535,000 46,800 100% Freehold
12 Roydale House, Leigh Jobcentre Plus 21,022 1,300,000 118,550 100% Freehold
13 Silver Street, Bury Jobcentre Plus 9,352 945,000 79,106 100% Freehold
14 Springfield House, Liverpool Jobcentre Plus 10,534 1,175,000 104,253 100% Freehold
15 St Martin's House, Bootle Back Office 85,453 3,915,000 387,592 100% Freehold
16 Wilmslow Road Jobcentre Plus 20,807 2,485,000 196,557 100% Freehold
17 Speke Road, Garston Jobcentre Plus 8,317 700,000 - 100% Freehold
18 Openshaw Job Centre, Manchester Jobcentre Plus 12,925 800,000 - 100% Freehold
19 Premier House, Liverpool Jobcentre Plus 9,476 800,000 - 100% Freehold
20 Great Moore Street, Bolton Jobcentre Plus 13,842 1,300,000 - 100% Freehold
21 Cardwell Place, Lancashire Back Office 15,386 1,000,000 - 100% Freehold
22 Brunswick House, Birkenhead Jobcentre Plus 27,956 2,100,000 - 100% Freehold
23 Tomlinson House, Blackpool Norcross Lane Back Office 89,179 1,000,000 - 100% Freehold
24 Chantry House, Chester Jobcentre Plus 34,847 5,300,000 - 100% Freehold
25 Dallas Court Units 1-2, Salford Back Office 16,044 1,500,000 - 100% Leasehold
(91 years)
Source: Company

Page 17
Company Focus
Elite Commercial REIT
No. Property Function Net Internal
Area (sqft)
Valuation
(GBP)
2020 Gross
Revenue
(GBP)
Occupancy
Rate as of
31 Mar 2021
Tenure as
of 31 Dec
2020
Scotland
1 Atlas Road, Glasgow Jobcentre Plus 49,788 4,010,000 397,111 100% Freehold
2 Bayfield Road, Portree Jobcentre Plus 1,943 240,000 24,901 100% Freehold
3 Bowling Green Street, Bellshill Jobcentre Plus 23,512 2,810,000 277,847 100% Freehold
4 Castlestead House, Montrose Jobcentre Plus 4,246 410,000 41,363 100% Freehold
5 Claverhouse Industrial Park, Dundee Call Centre 48,269 2,995,000 281,392 100% Freehold
6 Coustonholm Road, Glasgow Jobcentre Plus 36,124 3,070,000 303,446 100% Freehold
7 Crown Building, Kilmarnock Jobcentre Plus 36,696 3,050,000 301,762 100% Freehold
8 Discovery House, Stornoway Jobcentre Plus 7,276 865,000 93,259 100% Freehold
9 Flemington House, Motherwell Jobcentre Plus 29,381 2,540,000 263,779 100% Freehold
10 Glasgow Benefits Centre, Glasgow Back Office 137,287 30,290,000 1,940,350 100% Freehold
11 Hall Street, Campbeltown Jobcentre Plus 8,288 585,000 59,758 100% Freehold
12 Heron House, Falkirk Jobcentre Plus 25,454 2,650,000 262,181 100% Freehold
13 High Street, Dingwall Jobcentre Plus 3,438 320,000 30,808 100% Freehold
14 Parklands, Falkirk Back Office 81,350 6,570,000 683,789 100% Freehold
15 Pollokshaws Road, Glasgow Jobcentre Plus 15,812 1,570,000 154,722 100% Freehold
16 St John Steet, Stranraer Jobcentre Plus 6,402 610,000 65,646 100% Freehold
17 Trinity Road, Elgin Jobcentre Plus 17,427 1,450,000 142,946 100% Freehold
18 Waggon Road, Leven Jobcentre Plus 4,901 290,000 27,637 100% Freehold
19 Wallacetoun House, Ayr Jobcentre Plus /
Medical Centre 28,299 2,870,000 283,747 100% Freehold
20 Whitburn Road, Bathgate Jobcentre Plus 31,484 2,695,000 266,327 100% Freehold
21 South Muirhead Road, Glasgow Jobcentre Plus 9,097 900,000 - 100% Freehold
22 Irish Street, Dumfries Jobcentre Plus 12,303 1,400,000 - 100% Freehold
23 New River House, Galashiels Jobcentre Plus 21,216 2,800,000 - 100% Freehold
24 Victoria Road, Fife Jobcentre Plus 45,884 4,500,000 - 100% Freehold
25 Ladywell House, Edinburgh Back Office 54,622 7,400,000 - 100% Freehold
26 Lindsay House, Dundee Back Office 38,803 4,700,000 - 100% Freehold
27 Sidlaw House, Dundee Call Centre 61,250 6,000,000 - 100% Freehold
Source: Company

Page 18
Company Focus
Elite Commercial REIT
No. Property Function Net Internal
Area (sqft)
Valuation
(GBP)
2020 Gross
Revenue
(GBP)
Occupancy
Rate as of
31 Mar 2021
Tenure as
of 31 Dec
2020
Wales
1 Bridge Street, Llangefni Jobcentre Plus 9,601 725,000 63,990 100% Freehold
2 Cleddau Bridge Business Park, Pembroke Dock Call Centre 19,418 1,275,000 119,460 100% Freehold
3 Crown Buildings, Aberdare Jobcentre Plus /
Back Office 24,290 1,050,000 102,662 100% Freehold
4 Crown Buildings, Abertillery Jobcentre Plus 9,159 405,000 37,117 100% Freehold
5 Crown Buildings, Bridgend Jobcentre Plus 46,058 3,975,000 376,304 100% Freehold
6 Crown Buildings, Caerphilly Back Office 21,000 1,400,000 124,374 100% Freehold
7 Dock Street, Porthcawl Jobcentre Plus 3,023 285,000 25,699 100% Freehold
8 Hannah Street, Porth Jobcentre Plus 7,018 680,000 64,763 100% Freehold
9 High Street, Swansea Jobcentre Plus 19,609 1,995,000 188,006 100% Freehold
10 Maengwyn Street, Machynlleth Jobcentre Plus 3,655 145,000 12,421 100% Freehold
11 Oldway House, Swansea Jobcentre Plus 14,575 1,120,000 104,611 100% Freehold
12 Parc Menai, Bangor Call Centre
31,674 3,670,000 384,196
100% Leasehold
(235 years)
13 Quay Street, Haverfordwest Jobcentre Plus 8,603 805,000 75,000 100% Freehold
14 Thistle House, Tonypandy Jobcentre Plus 14,650 1,140,000 112,044 100% Freehold
15 Station Road, Port Talbot Jobcentre Plus 8,793 800,000 - 100% Freehold
16 Rhyl High Street Jobcentre Plus 9,452 900,000 - 100% Freehold
17 Windsor Road, Neath Jobcentre Plus 15,817 1,500,000 - 100% Freehold
18 Afon House, Newtown Jobcentre Plus 19,160 1,700,000 - 100% Freehold
19 Charles Street, Newport Jobcentre Plus 18,334 2,200,000 - 100% Freehold
20 Newport Road, Cardiff Back Office 33,749 4,900,000 - 100% Freehold
Source: Company
No. Property Function Net Internal
Area (sqft)
Valuation
(GBP)
2020 Gross
Revenue
(GBP)
Occupancy
Rate as of
31 Mar 2021
Tenure as
of 31 Dec
2020
East
1 Blackburn House, Norwich Back Office 9,302 1,500,000 - 100% Leasehold
(83 years)
2 Great Oaks House, Basildon Back Office 54,432 9,000,000 - 100% Leasehold
(983 years)
Source: Company

Page 19
Company Focus
Elite Commercial REIT
Financials
Steady growth in revenue driven by portfolio growth. Gross
revenue grew by 87.6% y-o-y to £6.6m in 1Q21 from £3.5m
in 1Q20 (from listing on 6 Feb to 31 Mar), boosted by
contributions from its newly acquired portfolio on 9 Mar
2021. These properties combined are projected to
contribute c.£10.4m to FY21F (from 9 Mar to 31 Dec 2021)
revenues, and c.£13.7m (full year) in FY22F.
Revenue from FY20 – FY22F (£m)
Source: Company
Revenue from FY20 – FY22F (£m)
Source: Company, DBS Bank Estimates
Strong balance sheet. Elite Commercial REIT employs
prudent capital management to drive long-term
sustainable growth. It has a healthy debt maturity profile
with a bridge loan of £9m due in FY22 and an average
weighted debt maturity of 2.8 years. The REIT' has low
borrowing cost of c.1.9%, sound interest coverage ratio
(ICR) of 7.4x and 61% of its assets are unencumbered.
Although its gearing ratio is slightly high at 42.1%,
management has expressed that they are proactively
looking at ways to bring down the gearing to their comfort
level of below 40% in the long run and has plans in the
pipeline to achieve this.
Debt Maturity Profile (£m)
Source: Company
DPU has outperformed IPO forecast every quarter.
Actual DPU has exceeded IPO forecast consistently
every quarter from 1Q20 to 1Q21 despite the
challenging environment, demonstrating resilience of
Elite Commercial REIT. Going forward, we believe that
the REIT will continue to provide stable returns to
unitholders given its unique counter-cyclical
positioning.
Actual DPU vs DPU projection
1Q20 2Q20 3Q20 4Q20 1Q21
DPU
(pence) 0.74 1.22 1.23 1.26 1.22
DPU
projection
(pence)
0.73 1.20 1.21 1.21 1.20
% change +1.2% +1.5% +1.6% +4.4% +1.7%
Source: Company
3.5
5.8 5.8 5.86.6
0.000
2.000
4.000
6.000
8.000
1Q20 2Q20 3Q20 4Q20 1Q21
21.0 23.1 23.1
10.4 13.7
0.0
10.0
20.0
30.0
40.0
FY20 FY21F FY22F
Initial Portfolio Acquisitions
Page 20
Company Focus
Elite Commercial REIT
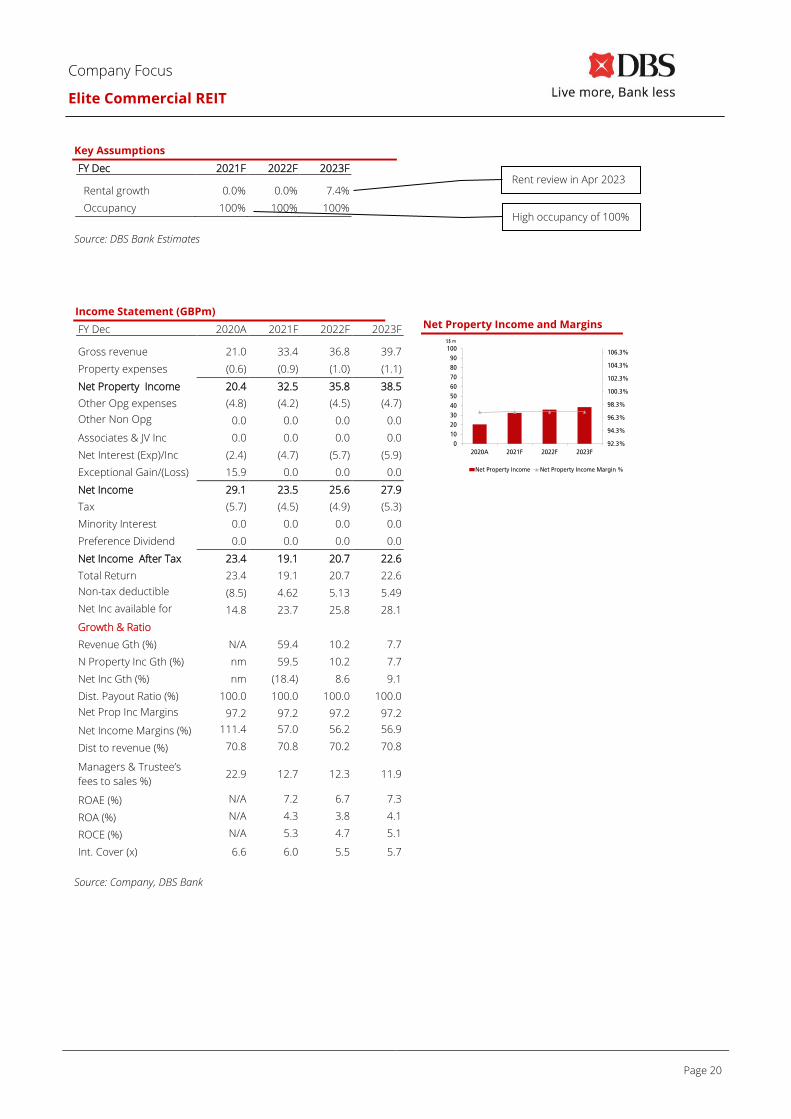
Key Assumptions
FY Dec 2021F 2022F 2023F
Rental growth 0.0% 0.0% 7.4%
Occupancy 100% 100% 100%
Source: DBS Bank Estimates
Income Statement (GBPm)
FY Dec 2020A 2021F 2022F 2023F Gross revenue 21.0 33.4 36.8 39.7
Property expenses (0.6) (0.9) (1.0) (1.1)
Net Property Income 20.4 32.5 35.8 38.5
Other Opg expenses (4.8) (4.2) (4.5) (4.7)
Other Non Opg
(Exp)/Inc 0.0 0.0 0.0 0.0
Associates & JV Inc 0.0 0.0 0.0 0.0
Net Interest (Exp)/Inc (2.4) (4.7) (5.7) (5.9)
Exceptional Gain/(Loss) 15.9 0.0 0.0 0.0
Net Income 29.1 23.5 25.6 27.9
Tax (5.7) (4.5) (4.9) (5.3)
Minority Interest 0.0 0.0 0.0 0.0
Preference Dividend 0.0 0.0 0.0 0.0
Net Income After Tax 23.4 19.1 20.7 22.6
Total Return 23.4 19.1 20.7 22.6
Non-tax deductible
Items (8.5) 4.62 5.13 5.49
Net Inc available for
Dist. 14.8 23.7 25.8 28.1
Growth & Ratio
Revenue Gth (%) N/A 59.4 10.2 7.7
N Property Inc Gth (%) nm 59.5 10.2 7.7
Net Inc Gth (%) nm (18.4) 8.6 9.1
Dist. Payout Ratio (%) 100.0 100.0 100.0 100.0
Net Prop Inc Margins
(%) 97.2 97.2 97.2 97.2
Net Income Margins (%) 111.4 57.0 56.2 56.9
Dist to revenue (%) 70.8 70.8 70.2 70.8
Managers & Trustee’s
fees to sales %) 22.9 12.7 12.3 11.9
ROAE (%) N/A 7.2 6.7 7.3
ROA (%) N/A 4.3 3.8 4.1
ROCE (%) N/A 5.3 4.7 5.1
Int. Cover (x) 6.6 6.0 5.5 5.7
Source: Company, DBS Bank
Net Property Income and Margins
92.3%
94.3%
96.3%
98.3%
100.3%
102.3%
104.3%
106.3%
0
10
20
30
40
50
60
70
80
90
100
2020A 2021F 2022F 2023F
S$ m
Net Property Income Net Property Income Margin %
Rent review in Apr 2023
High occupancy of 100%

Page 21
Company Focus
Elite Commercial REIT
Balance Sheet (GBPm)
FY Dec 2020A 2021F 2022F 2023F Investment Properties 312 528 528 528
Other LT Assets 0.0 0.0 0.0 0.0
Cash & ST Invts 20.2 21.1 21.4 21.6
Inventory 0.0 0.0 0.0 0.0
Debtors 0.88 1.40 1.55 1.67
Other Current Assets 0.0 0.0 0.0 0.0
Total Assets 333 550 551 551
ST Debt
0.0 0.0 0.0 0.0
Creditor 2.54 4.05 4.46 4.81
Other Current Liab 5.36 5.36 5.36 5.36
LT Debt 102 226 226 226
Other LT Liabilities 5.92 5.92 5.92 5.92
Unit holders’ funds 217 309 309 309
Minority Interests 0.0 0.0 0.0 0.0
Total Funds & Liabilities 333 550 551 551
Non-Cash Wkg. Capital (7.0) (8.0) (8.3) (8.5)
Net Cash/(Debt) (81.8) (205) (205) (205)
Ratio
Current Ratio (x) 2.7 2.4 2.3 2.3
Quick Ratio (x) 2.7 2.4 2.3 2.3
Aggregate Leverage (%) 33.7 43.7 43.7 43.7
Source: Company, DBS Bank
Page 22
Company Focus
Elite Commercial REIT
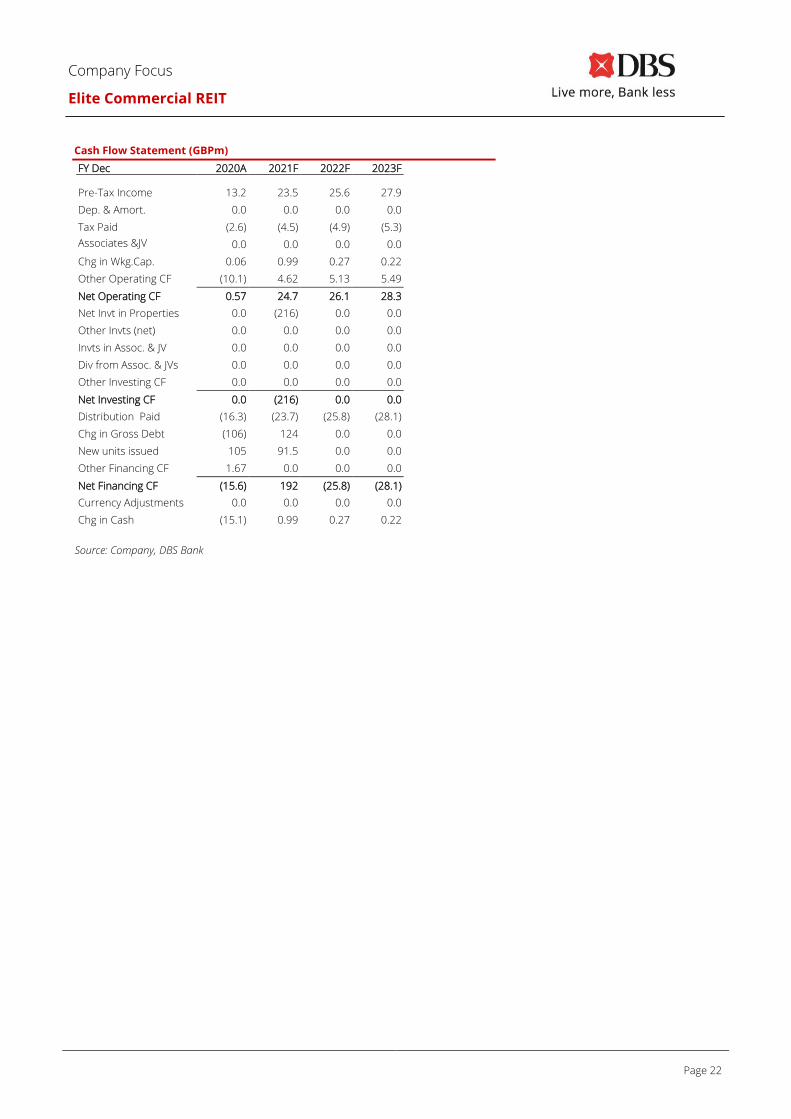
Cash Flow Statement (GBPm)
FY Dec 2020A 2021F 2022F 2023F Pre-Tax Income 13.2 23.5 25.6 27.9
Dep. & Amort. 0.0 0.0 0.0 0.0
Tax Paid (2.6) (4.5) (4.9) (5.3)
Associates &JV
Inc/(Loss) 0.0 0.0 0.0 0.0
Chg in Wkg.Cap. 0.06 0.99 0.27 0.22
Other Operating CF (10.1) 4.62 5.13 5.49
Net Operating CF 0.57 24.7 26.1 28.3
Net Invt in Properties 0.0 (216) 0.0 0.0
Other Invts (net) 0.0 0.0 0.0 0.0
Invts in Assoc. & JV 0.0 0.0 0.0 0.0
Div from Assoc. & JVs 0.0 0.0 0.0 0.0
Other Investing CF 0.0 0.0 0.0 0.0
Net Investing CF 0.0 (216) 0.0 0.0
Distribution Paid (16.3) (23.7) (25.8) (28.1)
Chg in Gross Debt (106) 124 0.0 0.0
New units issued 105 91.5 0.0 0.0
Other Financing CF 1.67 0.0 0.0 0.0
Net Financing CF (15.6) 192 (25.8) (28.1)
Currency Adjustments 0.0 0.0 0.0 0.0
Chg in Cash (15.1) 0.99 0.27 0.22
Source: Company, DBS Bank

Page 23
Company Focus
Elite Commercial REIT
Company Background
The only UK-focused Singapore REIT. Elite Commercial
REIT is a Singapore real estate investment trust (“REIT”)
established with the investment strategy of principally
investing, directly or indirectly, in commercial assets and
real estate-related assets in the United Kingdom (“UK”).
Listed on Singapore Exchange Securities Trading Limited
(SGX-ST) on 6 February 2020, Elite Commercial REIT is the
only UK-focused listed REIT in Singapore. Elite Commercial
REIT’s portfolio comprises 155 predominantly freehold
quality commercial buildings located across the UK, with a
total net internal area of c.3.9m square feet.
Established Sponsors with alignment of interest. The
sponsors of Elite Commercial REIT are Elite Partners
Holdings Pte. Ltd. (“EPH”), Ho Lee Group Pte. Ltd. (“HLG”)
and Sunway RE Capital Pte. Ltd. (“Sunway”). They have an
aggregate of close to 20% interest in the REIT, aligning
their interests with Unitholders.
Trust Structure. The following diagram illustrates the
relationship, among others, between Elite Commercial
REIT, the Manager, the Trustee, the Property Manager,
and the Unitholders.
Structure of Elite Commercial REIT
Source: Company, DBS Bank
Page 24
Company Focus
Elite Commercial REIT
Management
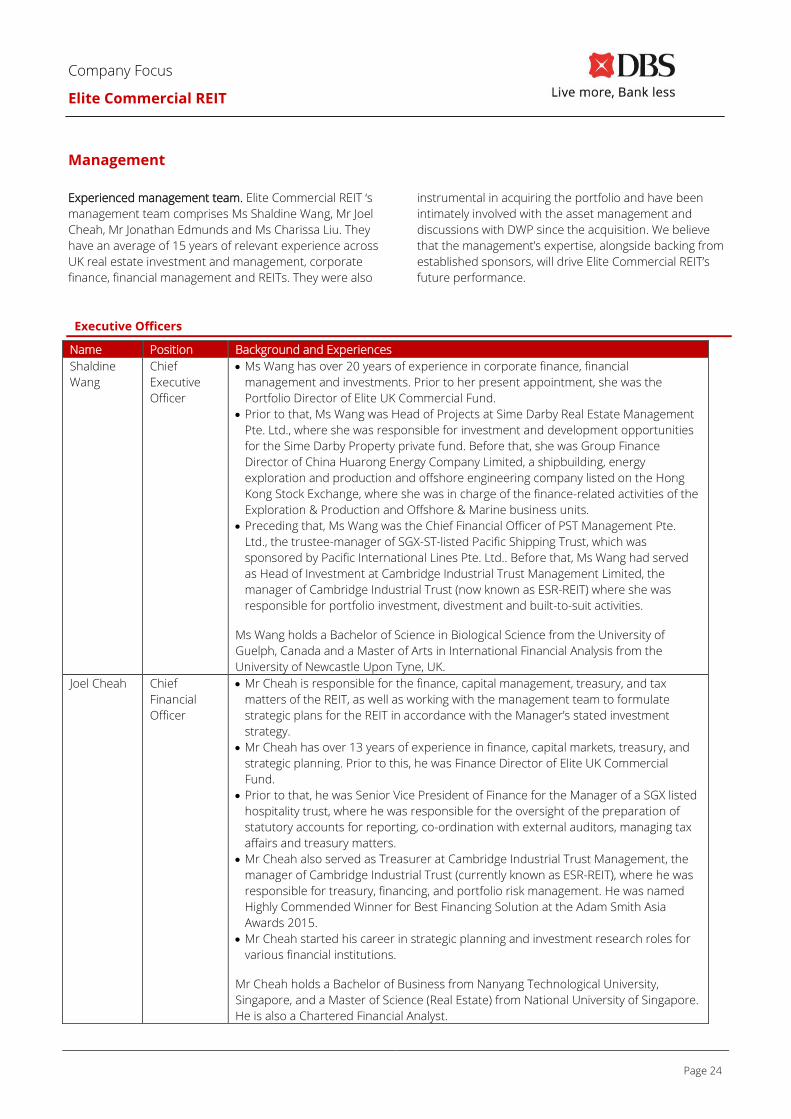
Experienced management team. Elite Commercial REIT ‘s
management team comprises Ms Shaldine Wang, Mr Joel
Cheah, Mr Jonathan Edmunds and Ms Charissa Liu. They
have an average of 15 years of relevant experience across
UK real estate investment and management, corporate
finance, financial management and REITs. They were also
instrumental in acquiring the portfolio and have been
intimately involved with the asset management and
discussions with DWP since the acquisition. We believe
that the management’s expertise, alongside backing from
established sponsors, will drive Elite Commercial REIT’s
future performance.
Executive Officers
Name Position Background and Experiences
Shaldine
Wang
Chief
Executive
Officer
• Ms Wang has over 20 years of experience in corporate finance, financial
management and investments. Prior to her present appointment, she was the
Portfolio Director of Elite UK Commercial Fund.
• Prior to that, Ms Wang was Head of Projects at Sime Darby Real Estate Management
Pte. Ltd., where she was responsible for investment and development opportunities
for the Sime Darby Property private fund. Before that, she was Group Finance
Director of China Huarong Energy Company Limited, a shipbuilding, energy
exploration and production and offshore engineering company listed on the Hong
Kong Stock Exchange, where she was in charge of the finance-related activities of the
Exploration & Production and Offshore & Marine business units.
• Preceding that, Ms Wang was the Chief Financial Officer of PST Management Pte.
Ltd., the trustee-manager of SGX-ST-listed Pacific Shipping Trust, which was
sponsored by Pacific International Lines Pte. Ltd.. Before that, Ms Wang had served
as Head of Investment at Cambridge Industrial Trust Management Limited, the
manager of Cambridge Industrial Trust (now known as ESR-REIT) where she was
responsible for portfolio investment, divestment and built-to-suit activities.
Ms Wang holds a Bachelor of Science in Biological Science from the University of
Guelph, Canada and a Master of Arts in International Financial Analysis from the
University of Newcastle Upon Tyne, UK.
Joel Cheah Chief
Financial
Officer
• Mr Cheah is responsible for the finance, capital management, treasury, and tax
matters of the REIT, as well as working with the management team to formulate
strategic plans for the REIT in accordance with the Manager’s stated investment
strategy.
• Mr Cheah has over 13 years of experience in finance, capital markets, treasury, and
strategic planning. Prior to this, he was Finance Director of Elite UK Commercial
Fund.
• Prior to that, he was Senior Vice President of Finance for the Manager of a SGX listed
hospitality trust, where he was responsible for the oversight of the preparation of
statutory accounts for reporting, co-ordination with external auditors, managing tax
affairs and treasury matters.
• Mr Cheah also served as Treasurer at Cambridge Industrial Trust Management, the
manager of Cambridge Industrial Trust (currently known as ESR-REIT), where he was
responsible for treasury, financing, and portfolio risk management. He was named
Highly Commended Winner for Best Financing Solution at the Adam Smith Asia
Awards 2015.
• Mr Cheah started his career in strategic planning and investment research roles for
various financial institutions.
Mr Cheah holds a Bachelor of Business from Nanyang Technological University,
Singapore, and a Master of Science (Real Estate) from National University of Singapore.
He is also a Chartered Financial Analyst.

Page 25
Company Focus
Elite Commercial REIT
Executive Officers (cont’d)
Jonathan
Edmunds
Chief
investment
Officer
• Mr Edmunds has more than 18 years of experience in the real estate industry,
focusing on real estate investment and management across various sectors globally.
Previously, he was Investment and Asset Management Director of Elite UK
Commercial Fund.
• Preceding that, Mr Edmunds was Director of the Real Estate department of AEP
Investment Management Pte. Ltd., where he was responsible for strategic investment
and transaction management for their UK, Australia, and Singapore mandates. He
was also a lead manager of Basil Property Trust and was responsible for investments,
fund acquisitions and structuring.
• Mr Edmunds had previously worked in the UK and Switzerland. He was Vice
President of the Real Estate department in Beaumont Partners where he was
responsible for fund raising, acquisitions, structuring, reporting, and managing the
Global Student Housing and Multi-Family investment strategy. He also completed the
analysis, structuring and closing of acquisitions for the company’s European and
North American credit income strategies. Prior to that, Mr Edmunds served as
Director of the Real Estate department of WW Advisors Ltd, managing a US$250
million equity mandate to acquire income-producing assets in the UK and Europe.
He originated and managed the acquisition of a portfolio of assets as well as
structured and arranged the debt capital, implemented interest rate hedges and
managed asset performance for the portfolio.
• Earlier in his career, Mr Edmunds was an associate at Lazard, a Corporate Finance
Advisory firm in the UK. He started off as an Associate of Deutsche Bank AG’s Real
Estate Debt Markets department.
Mr Edmunds graduated from University of the West of England with a BA (Hons)
Business Studies. He also holds a Master of Arts in Property Valuation and Law from
The City University in London, UK.
Source: Company, DBS Bank
Page 26
Company Focus
Elite Commercial REIT
DBS Bank recommendations are based an Absolute Total Return* Rating system, defined as follows:
STRONG BUY (>20% total return over the next 3 months, with identifiable share price catalysts within this time frame)
BUY (>15% total return over the next 12 months for small caps, >10% for large caps)
HOLD (-10% to +15% total return over the next 12 months for small caps, -10% to +10% for large caps)
FULLY VALUED (negative total return i.e. > -10% over the next 12 months)
SELL (negative total return of > -20% over the next 3 months, with identifiable catalysts within this time frame)
Share price appreciation + dividends
Completed Date: 22 Jul 2021 06:31:08 (SGT)
Dissemination Date: 22 Jul 2021 06:36:33 (SGT)
Sources for all charts and tables are DBS Bank unless otherwise specified.
GENERAL DISCLOSURE/DISCLAIMER
This report is prepared by DBS Bank Ltd. This report is solely intended for the clients of DBS Bank Ltd, its respective connected and
associated corporations and affiliates only and no part of this document may be (i) copied, photocopied or duplicated in any form or by any
means or (ii) redistributed without the prior written consent of DBS Bank Ltd.
The research set out in this report is based on information obtained from sources believed to be reliable, but we (which collectively refers to
DBS Bank Ltd, its respective connected and associated corporations, affiliates and their respective directors, officers, employees and agents
(collectively, the “DBS Group”) have not conducted due diligence on any of the companies, verified any information or sources or taken into
account any other factors which we may consider to be relevant or appropriate in preparing the research. Accordingly, we do not make any
representation or warranty as to the accuracy, completeness or correctness of the research set out in this report. Opinions expressed are
subject to change without notice. This research is prepared for general circulation. Any recommendation contained in this document does
not have regard to the specific investment objectives, financial situation and the particular needs of any specific addressee. This document
is for the information of addressees only and is not to be taken in substitution for the exercise of judgement by addressees, who should
obtain separate independent legal or financial advice. The DBS Group accepts no liability whatsoever for any direct, indirect and/or
consequential loss (including any claims for loss of profit) arising from any use of and/or reliance upon this document and/or further
communication given in relation to this document. This document is not to be construed as an offer or a solicitation of an offer to buy or sell
any securities. The DBS Group, along with its affiliates and/or persons associated with any of them may from time to time have interests in
the securities mentioned in this document. The DBS Group, may have positions in, and may effect transactions in securities mentioned
herein and may also perform or seek to perform broking, investment banking and other banking services for these companies.
Any valuations, opinions, estimates, forecasts, ratings or risk assessments herein constitutes a judgment as of the date of this report, and
there can be no assurance that future results or events will be consistent with any such valuations, opinions, estimates, forecasts, ratings or
risk assessments. The information in this document is subject to change without notice, its accuracy is not guaranteed, it may be incomplete
or condensed, it may not contain all material information concerning the company (or companies) referred to in this report and the DBS
Group is under no obligation to update the information in this report.
This publication has not been reviewed or authorized by any regulatory authority in Singapore, Hong Kong or elsewhere. There is no
planned schedule or frequency for updating research publication relating to any issuer.
The valuations, opinions, estimates, forecasts, ratings or risk assessments described in this report were based upon a number of estimates
and assumptions and are inherently subject to significant uncertainties and contingencies. It can be expected that one or more of the
estimates on which the valuations, opinions, estimates, forecasts, ratings or risk assessments were based will not materialize or will vary
significantly from actual results. Therefore, the inclusion of the valuations, opinions, estimates, forecasts, ratings or risk assessments
described herein IS NOT TO BE RELIED UPON as a representation and/or warranty by the DBS Group (and/or any persons associated with
the aforesaid entities), that:
(a) such valuations, opinions, estimates, forecasts, ratings or risk assessments or their underlying assumptions will be achieved, and
(b) there is any assurance that future results or events will be consistent with any such valuations, opinions, estimates, forecasts, ratings or
risk assessments stated therein.
Please contact the primary analyst for valuation methodologies and assumptions associated with the covered companies or price targets.

Page 27
Company Focus
Elite Commercial REIT
Any assumptions made in this report that refers to commodities, are for the purposes of making forecasts for the company (or companies)
mentioned herein. They are not to be construed as recommendations to trade in the physical commodity or in the futures contract relating
to the commodity referred to in this report.
DBSVUSA, a US-registered broker-dealer, does not have its own investment banking or research department, has not participated in any
public offering of securities as a manager or co-manager or in any other investment banking transaction in the past twelve months and does
not engage in market-making.
ANALYST CERTIFICATION
The research analyst(s) primarily responsible for the content of this research report, in part or in whole, certifies that the views about the
companies and their securities expressed in this report accurately reflect his/her personal views. The analyst(s) also certifies that no part of
his/her compensation was, is, or will be, directly or indirectly, related to specific recommendations or views expressed in the report. The
research analyst (s) primarily responsible for the content of this research report, in part or in whole, certifies that he or his associate1 does
not serve as an officer of the issuer or the new listing applicant (which includes in the case of a real estate investment trust, an officer of the
management company of the real estate investment trust; and in the case of any other entity, an officer or its equivalent counterparty of
the entity who is responsible for the management of the issuer or the new listing applicant) and the research analyst(s) primarily
responsible for the content of this research report or his associate does not have financial interests2 in relation to an issuer or a new
listing applicant that the analyst reviews. DBS Group has procedures in place to eliminate, avoid and manage any potential conflicts of
interests that may arise in connection with the production of research reports. The research analyst(s) responsible for this report operates
as part of a separate and independent team to the investment banking function of the DBS Group and procedures are in place to ensure
that confidential information held by either the research or investment banking function is handled appropriately. There is no direct link of
DBS Group's compensation to any specific investment banking function of the DBS Group.
COMPANY-SPECIFIC / REGULATORY DISCLOSURES
1. DBS Bank Ltd, DBS HK, DBS Vickers Securities (Singapore) Pte Ltd (''DBSVS'') or their subsidiaries and/or other affiliates have proprietary
positions in Manulife US Real Estate Inv, Prime US REIT, Keppel Pacific Oak US REITl, Mapletree Commercial Trust, CapitaLand Integrated
Commercial Trust, Keppel REIT, recommended in this report as of 30 Jun 2021.
2. Neither DBS Bank Ltd nor DBS HK market makes in equity securities of the issuer(s) or company(ies) mentioned in this Research Report.
3. DBS Bank Ltd, DBS HK, DBSVS, their subsidiaries and/or other affiliates have a net long position exceeding 0.5% of the total issued share
capital in Manulife US Real Estate Inv, Prime US REIT, Keppel Pacific Oak US REITl, Mapletree Commercial Trust, recommended in this
report as of 30 Jun 2021.
4. DBS Bank Ltd, DBS HK, DBSVS, DBSVUSA or their subsidiaries and/or other affiliates beneficially own a total of 1% of any class of
common equity securities of Manulife US Real Estate Inv, Prime US REIT, Keppel Pacific Oak US REITl, as of 30 Jun 2021.
Compensation for investment banking services:
5. DBS Bank Ltd, DBS HK, DBSVS, their subsidiaries and/or other affiliates of DBSVUSA have received compensation, within the past 12
months for investment banking services from IREIT Global, CapitaLand Integrated Commercial Trust, as of 30 Jun 2021.
6. DBS Bank Ltd, DBS HK, DBSVS, their subsidiaries and/or other affiliates of DBSVUSA, within the next 3 months, will receive or intend to
seek compensation for investment banking services from Prime US REIT, as of 30 Jun 2021.
.
1 An associate is defined as (i) the spouse, or any minor child (natural or adopted) or minor step-child, of the analyst; (ii) the trustee of a trust
of which the analyst, his spouse, minor child (natural or adopted) or minor step-child, is a beneficiary or discretionary object; or (iii) another
person accustomed or obliged to act in accordance with the directions or instructions of the analyst.
2 Financial interest is defined as interests that are commonly known financial interest, such as investment in the securities in respect of an
issuer or a new listing applicant, or financial accommodation arrangement between the issuer or the new listing applicant and the firm or
analysis. This term does not include commercial lending conducted at arm's length, or investments in any collective investment scheme
other than an issuer or new listing applicant notwithstanding the fact that the scheme has investments in securities in respect of an issuer
or a new listing applicant.

Page 28
Company Focus
Elite Commercial REIT
7. DBS Bank Ltd, DBS HK, DBSVS, their subsidiaries and/or other affiliates of DBSVUSA have managed or co-managed a public offering of
securities for IREIT Global, Keppel REIT, CapitaLand Integrated Commercial Trust, in the past 12 months, as of 30 Jun 2021.
8. DBSVUSA does not have its own investment banking or research department, nor has it participated in any public offering of securities
as a manager or co-manager or in any other investment banking transaction in the past twelve months. Any US persons wishing to
obtain further information, including any clarification on disclosures in this disclaimer, or to effect a transaction in any security discussed
in this document should contact DBSVUSA exclusively.
Disclosure of previous investment recommendation produced:
9. DBS Bank Ltd, DBS Vickers Securities (Singapore) Pte Ltd (''DBSVS''), their subsidiaries and/or other affiliates may have published other
investment recommendations in respect of the same securities / instruments recommended in this research report during the
preceding 12 months. Please contact the primary analyst listed in the first page of this report to view previous investment
recommendations published by DBS Bank Ltd, DBS Vickers Securities (Singapore) Pte Ltd (''DBSVS''), their subsidiaries and/or other
affiliates in the preceding 12 months.
RESTRICTIONS ON DISTRIBUTION
General This report is not directed to, or intended for distribution to or use by, any person or entity who is a citizen or
resident of or located in any locality, state, country or other jurisdiction where such distribution, publication,
availability or use would be contrary to law or regulation.
Australia This report is being distributed in Australia by DBS Bank Ltd, DBSVS or DBSV HK. DBS Bank Ltd holds Australian
Financial Services Licence no. 475946.
DBSVS and DBSV HK are exempted from the requirement to hold an Australian Financial Services Licence under
the Corporation Act 2001 (“CA”) in respect of financial services provided to the recipients. Both DBS Bank Ltd and
DBSVS are regulated by the Monetary Authority of Singapore under the laws of Singapore, and DBSV HK is
regulated by the Hong Kong Securities and Futures Commission under the laws of Hong Kong, which differ from
Australian laws.
Distribution of this report is intended only for “wholesale investors” within the meaning of the CA.
Hong Kong This report has been prepared by a person(s) who is not licensed by the Hong Kong Securities and Futures
Commission to carry on the regulated activity of advising on securities in Hong Kong pursuant to the Securities and
Futures Ordinance (Chapter 571 of the Laws of Hong Kong). This report is being distributed in Hong Kong and is
attributable to DBS Bank (Hong Kong) Limited, a registered institution registered with the Hong Kong Securities
and Futures Commission to carry on the regulated activity of advising on securities pursuant to the Securities and
Futures Ordinance (Chapter 571 of the Laws of Hong Kong). DBS Bank Ltd., Hong Kong Branch is a limited liability
company incorporated in Singapore.
For any query regarding the materials herein, please contact Carol Wu (Reg No. AH8283) at [email protected]
Indonesia This report is being distributed in Indonesia by PT DBS Vickers Sekuritas Indonesia.

Page 29
Company Focus
Elite Commercial REIT
Malaysia This report is distributed in Malaysia by AllianceDBS Research Sdn Bhd ("ADBSR"). Recipients of this report,
received from ADBSR are to contact the undersigned at 603-2604 3333 in respect of any matters arising from or in
connection with this report. In addition to the General Disclosure/Disclaimer found at the preceding page,
recipients of this report are advised that ADBSR (the preparer of this report), its holding company Alliance
Investment Bank Berhad, their respective connected and associated corporations, affiliates, their directors, officers,
employees, agents and parties related or associated with any of them may have positions in, and may effect
transactions in the securities mentioned herein and may also perform or seek to perform broking, investment
banking/corporate advisory and other services for the subject companies. They may also have received
compensation and/or seek to obtain compensation for broking, investment banking/corporate advisory and other
services from the subject companies.
Wong Ming Tek, Executive Director, ADBSR
Singapore This report is distributed in Singapore by DBS Bank Ltd (Company Regn. No. 196800306E) or DBSVS (Company
Regn No. 198600294G), both of which are Exempt Financial Advisers as defined in the Financial Advisers Act and
regulated by the Monetary Authority of Singapore. DBS Bank Ltd and/or DBSVS, may distribute reports produced
by its respective foreign entities, affiliates or other foreign research houses pursuant to an arrangement under
Regulation 32C of the Financial Advisers Regulations. Where the report is distributed in Singapore to a person who
is not an Accredited Investor, Expert Investor or an Institutional Investor, DBS Bank Ltd accepts legal responsibility
for the contents of the report to such persons only to the extent required by law. Singapore recipients should
contact DBS Bank Ltd at 6327 2288 for matters arising from, or in connection with the report.
Thailand This report is being distributed in Thailand by DBS Vickers Securities (Thailand) Co Ltd.
United
Kingdom
This report is produced by DBS Bank Ltd which is regulated by the Monetary Authority of Singapore.
This report is disseminated in the United Kingdom by DBS Vickers Securities (UK) Ltd, ("DBSVUK"). DBSVUK is
authorised and regulated by the Financial Conduct Authority in the United Kingdom.
In respect of the United Kingdom, this report is solely intended for the clients of DBSVUK, its respective connected
and associated corporations and affiliates only and no part of this document may be (i) copied, photocopied or
duplicated in any form or by any means or (ii) redistributed without the prior written consent of DBSVUK. This
communication is directed at persons having professional experience in matters relating to investments. Any
investment activity following from this communication will only be engaged in with such persons. Persons who do
not have professional experience in matters relating to investments should not rely on this communication.
Dubai
International
Financial
Centre
This research report is being distributed by DBS Bank Ltd., (DIFC Branch) having its office at units 608 - 610, 6th
Floor, Gate Precinct Building 5, PO Box 506538, DIFC, Dubai, United Arab Emirates. DBS Bank Ltd., (DIFC Branch) is
regulated by The Dubai Financial Services Authority. This research report is intended only for professional clients
(as defined in the DFSA rulebook) and no other person may act upon it.
United Arab
Emirates
This report is provided by DBS Bank Ltd (Company Regn. No. 196800306E) which is an Exempt Financial Adviser as
defined in the Financial Advisers Act and regulated by the Monetary Authority of Singapore. This report is for
information purposes only and should not be relied upon or acted on by the recipient or considered as a
solicitation or inducement to buy or sell any financial product. It does not constitute a personal recommendation
or take into account the particular investment objectives, financial situation, or needs of individual clients. You
should contact your relationship manager or investment adviser if you need advice on the merits of buying, selling
or holding a particular investment. You should note that the information in this report may be out of date and it is
not represented or warranted to be accurate, timely or complete. This report or any portion thereof may not be
reprinted, sold or redistributed without our written consent.

Page 30
Company Focus
Elite Commercial REIT
United States This report was prepared by DBS Bank Ltd. DBSVUSA did not participate in its preparation. The research
analyst(s) named on this report are not registered as research analysts with FINRA and are not associated persons
of DBSVUSA. The research analyst(s) are not subject to FINRA Rule 2241 restrictions on analyst compensation,
communications with a subject company, public appearances and trading securities held by a research analyst.
This report is being distributed in the United States by DBSVUSA, which accepts responsibility for its contents. This
report may only be distributed to Major U.S. Institutional Investors (as defined in SEC Rule 15a-6) and to such other
institutional investors and qualified persons as DBSVUSA may authorize. Any U.S. person receiving this report who
wishes to effect transactions in any securities referred to herein should contact DBSVUSA directly and not its
affiliate.
Other
jurisdictions
In any other jurisdictions, except if otherwise restricted by laws or regulations, this report is intended only for
qualified, professional, institutional or sophisticated investors as defined in the laws and regulations of such
jurisdictions.
DBS Regional Research Offices
HONG KONG
DBS (Hong Kong) Ltd
Contact: Carol Wu
13th Floor One Island East,
18 Westlands Road,
Quarry Bay, Hong Kong
Tel: 852 3668 4181
Fax: 852 2521 1812
e-mail: [email protected]
MALAYSIA
AllianceDBS Research Sdn Bhd
Contact: Wong Ming Tek
19th Floor, Menara Multi-Purpose,
Capital Square,
8 Jalan Munshi Abdullah 50100
Kuala Lumpur, Malaysia.
Tel.: 603 2604 3333
Fax: 603 2604 3921
e-mail: [email protected]
Co. Regn No. 198401015984
(128540-U)
SINGAPORE
DBS Bank Ltd
Contact: Janice Chua
12 Marina Boulevard,
Marina Bay Financial Centre Tower 3
Singapore 018982
Tel: 65 6878 8888
e-mail: [email protected]
Company Regn. No. 196800306E
THAILAND
DBS Vickers Securities (Thailand) Co Ltd
Contact: Chanpen Sirithanarattanakul
989 Siam Piwat Tower Building,
9th, 14th-15th Floor
Rama 1 Road, Pathumwan,
Bangkok Thailand 10330
Tel. 66 2 857 7831
Fax: 66 2 658 1269
e-mail: [email protected]
Company Regn. No 0105539127012
Securities and Exchange Commission,
Thailand
INDONESIA
PT DBS Vickers Sekuritas (Indonesia)
Contact: Maynard Priajaya Arif
DBS Bank Tower
Ciputra World 1, 32/F
Jl. Prof. Dr. Satrio Kav. 3-5
Jakarta 12940, Indonesia
Tel: 62 21 3003 4900
Fax: 6221 3003 4943
e-mail: [email protected]