elixir ambience evaluators...
TRANSCRIPT


Elixir Ambience Evaluators GuideTable of ContentsAbout Elixir Ambience.........................................................................................................................2Ambience Features...............................................................................................................................2
Open Architecture............................................................................................................................2Open Interoperability.......................................................................................................................2Platform Independence....................................................................................................................3Scalability And Extensibility...........................................................................................................3Cloud-Ready BI...............................................................................................................................3Wide Database Support....................................................................................................................3In-Memory Columnar Database......................................................................................................3Time-Series Database......................................................................................................................3Built-In Data ETL............................................................................................................................4
Accessing Ambience............................................................................................................................4Entering Your License Information.................................................................................................4Opening the Web Application..........................................................................................................4
Starting the Ambience Server.....................................................................................................4Opening the Web Application.....................................................................................................4
Starting the Designer.......................................................................................................................5Hands on Walk Through.......................................................................................................................7
Preparing Your Data (Using the ETL Process)................................................................................7Derby Installation............................................................................................................................7Importing Data into Derby...............................................................................................................8Create the Derby Database..............................................................................................................8Extracting the Data From the CSV file and Loading into Derby...................................................11Creating a Universe.......................................................................................................................15
Scheduling Jobs..................................................................................................................................22Creating an Adhoc Dashboard............................................................................................................27
Part 1 - Accessing the Adhoc Dashboard Application...................................................................27Part 2 - Setting up the Grid Selection............................................................................................28Part 3 - Viewing the Data...............................................................................................................34Part 4 - Drilling Down Into the Data.............................................................................................38
Creating an Adhoc Report..................................................................................................................42Creating a Report Using the Designer................................................................................................46Portal Operations................................................................................................................................61
Versioning Files.............................................................................................................................62Setting Access Permissions............................................................................................................63

About Elixir AmbienceBusiness intelligence (BI) software enables decision makers at all levels in an organization to leverage data for business advantage—to explore data, interpret insights and meaningful conclusions, and make accurate decisions.
Conventional BI products have delivered reliable, operational data powered by pre-defined, static reports—but have not provided the interactive, on-the-fly, user-driven source of perception people want for addressing daily business challenges.
What modern empowered users want from BI today is the ability to ask and answer questions on their own so that they can make better business decisions. Traditional BI solutions are not well-suited to users who need to directly query or interact with data in a self-sufficient manner.
This vital need is fulfilled by Elixir Ambience.
Elixir Ambience is a Cloud-Scale Business Analytics/Intelligence Platform that helps you analyse and manage your data effectively to make accurate business decisions.
You can create a variety of dashboards and reports to explore and filter your data in real time interactively. These tools help you extract the relevant information that is crucial to support your business decisions.
Data security is critical these days. With the huge amount of data to analyse, not all users should be able to access all data. Access rights should be in place so that only users authorized to view and usethe data are allowed to do so. Ambience features security controls that allow segregation of users. Data can be kept confidential to be shared between users in a domain, using access rights. Ambience allows creation of multiple domains, and users with differing access rights can be createdfor each domain. This ensures separation of responsibilities for each user.
Ambience Features
Open ArchitectureElixir Ambience is developed on an open architecture to achieve open integration with third party JavaScript Visualization Framework like D3js, HighCharts, and Bindows for example. Advanced visualization can convey rich visual and speed-of-thought insight of the data and process which typical charts cannot deliver.
Open InteroperabilityElixir Ambience provides an Open Standard Web Services interface for integration with other applications through HTTP-based REST APIs. These APIs allow you to build applications in the programming language of your choice and call the server for scheduling, reports, data ETL and dashboard functionality.
2 of 66

Platform IndependenceUsers access business software from a variety of devices – phones, tablets, desktops, laptops… Yourbusiness software needs to adapt to your usage. The Elixir Ambience framework is written in cross platform languages. Hence, Elixir Ambience runs on any widely used operating system, such as Windows, Unix, and Mac for instance.
Scalability And ExtensibilityWhile some visualization tools are good for individual users to use, it needs an enterprise-scale platform to deliver BI and analytics functions to the entire organization.
Elixir Ambience is designed from ground up for large scale deployment. Elixir Ambience features High Availability options for clustering, and the Ambience job engines can be run distributed on a number of machines for ultimate reliability.
Cloud-Ready BIThe emergence of cloud computing brings the benefits of system high availability and scalability, while avoiding the overhead of maintaining the hardware server. Having support for the cloud-based platform, Elixir Ambience promises on-demand performance, full fault tolerance, unlimited scalability and zero wastage cost effectiveness.
Wide Database SupportMany BI tools in the market support only one database or embrace their own proprietary database. Elixir Ambience, however, fully supports any JDBC or ODBC compliant relational database. Having substantial amount of insightful information by pulling source of data from disparate databases is radically important for all user groups from management to end users.
In-Memory Columnar DatabaseSpeed of data retrieval has become one of the critical requirements in this fast paced world. Many users appreciate quick data retrieval from a BI tool for quick decision making.
Elixir Ambience is designed with a built-in in-memory Datastore to cache the data on columnar table basis instead of rows in traditional relational tables to facilitate faster data retrieval.
Time-Series DatabaseIn this information era, the volume of available data is overwhelming. Making sense of this huge data is a formidable task, especially for time-series data in which the value changes over the time. Elixir Ambience Tempo Time-series feature enables users to automatically sort and view data by year, quarter, month, week, day, hour, minutes or seconds.
3 of 66

Built-In Data ETLElixir Ambience features an integrated data ETL tool at no additional cost. This built-in tool can be used for aggregation of disparate data sources, data transformation, data validation, data cleansing and to output processed data to any designated location and format.
Accessing AmbienceAmbience provides two methods of use. You can either use the Ambience Designer desktop software or use the web application.
The Ambience web application is meant for end users to create their dashboards and simple reports easily. The web application also allows end users to schedule jobs, manage different versions of files and setup file security, all from within a simple, easy-to-use graphical interface.
The Ambience Designer allows more sophisticated operations such as creating universes, creating jobs, and complex reports for example.
You need to enter the license information, the very first time after you start Ambience.
Entering Your License InformationTo enter your license information, you need to use the Ambience Web Application.
Opening the Web ApplicationFor a video tutorial of this section, see https://www.youtube.com/watch?v=Eo6yt-pNA-U.
Starting the Ambience Server
First start the Ambience Server.
Open a terminal (command prompt), navigate to your Ambience bin folder and run either sh run-server.sh (on Linux and Mac) or run-server.bat (on Windows).
Opening the Web Application
Start your browser and navigate to http://<host>:8080 (for example – http://localhost:8080) to view the Elixir Ambience Web Console.
Type the domain name (eno is the default domain) and the appropriate user name (admin is the default username) and password (sa is the default password) to sign in.
When you open the web application for the first time, you are directed to enter your license information. Enter your license information and click Deploy to deploy it.
4 of 66

Now you can use the web application to create your dashboards and reports.
Starting the DesignerNote: You only need to ensure that the Ambience web server is started, before starting the Designer. You do NOT need to open the web application when using Designer.
1. Follow the instructions in Starting the Ambience Web Server above, to start the Ambience web server.
2. Once your web server is running, open another terminal (command prompt), navigate to your Ambience bin folder and run either sh run-designer.sh (on Linux and Mac) or run-designer.bat (on Windows).
5 of 66

3. Login with the credentials as mentioned in Starting the Web Application above. Click Connect to login to Designer.
4. The Designer is then opened.
6 of 66

Hands on Walk Through
Preparing Your Data (Using the ETL Process)As the first step before designing your dashboards and reports, we recommend that you prepare your database accordingly. You may have large databases that contain all of your data. Fetching datafrom your large database each time, could slow down the system and make your database server sluggish.
As an alternative, you could use another intermediate database (called a Universe) that contains exactly the data that you need for your dashboards and reports.
A Universe is a collection of related database tables.
Behind the scenes, each dashboard and report reads data from a Universe, which can be defined using the Universe Designer and which collects a set of data tables together. A data administrator, familiar with the database structure will usually perform this step and then publish a dashboard and a report template which links to the Universe. Once this template is published, you can use it to construct your own dashboards and reports without worrying about database access rights and how the tables are joined together.
Note: Ambience ships with a default Universe called Cars. You can either use that for evaluation and skip this section, or jump in and learn how to create a Universe.
The following example uses Derby as the intermediate database to fetch data from a CSV file.
Derby InstallationFor a video tutorial of this section, see https://www.youtube.com/watch?v=ii4wPui9Fqo.
1. Download Derby from: https://db.apache.org/derby/derby_downloads.html
2. Extract the downloaded file.
3. Copy derbyclient.jar from Derby lib folder to the Ambience lib folder. This is the Derby driver.
7 of 66

4. Navigate to the Derby bin folder and run either ./NetworkServerControl start (on Linux orMac) or NetworkServerControl start (on Windows).
Derby is now installed and running.
Importing Data into DerbyThe following example uses a large CSV file as the larger database and imports certain columns of data from it into Derby.
We are using the CarsDiv20WithRegions.ds file which is the datasource wrapper for the cars.csv file that is shipped with Ambience.
Create the Derby DatabaseFor a video tutorial of this section, see https://www.youtube.com/watch?v=GflGgOCiuuw.
1. Start Ambience Designer.
2. Right-click on the folder tree and select Add-DataSource.
8 of 66

3. Select the Datasource as JDBC and click Next.
4. Enter a name and description.
9 of 66

5. Click Driver Suggestions and select Derby Server as the database driver.
6. Edit the Derby URL as follows:
jdbc:derby://localhost:1527/JDBC-Car-Sales-DB;create=true;user=cars;password=cars;
where:
a) localhost:1527 – name of the host and port where Derby is running.
b) JDBC-Car-Sales-DB – name of the Derby database to create.
c) create=true – create the database, since it does not exist already.
d) user=cars;password=cars – set the user name and password for the Derby database.
10 of 66

Note: You can either enter the username and password for the database in the Derby URL itself or enter them in the User and Password fields.
7. Click Next. Do not set any JDBC properties for this exercise.
8. Click Finish. The database is now created.
Extracting the Data From the CSV file and Loading into DerbyFor a video tutorial of this section, see https://www.youtube.com/watch?v=HYeBfCV9srw.
1. Right click the folder tree and select Add – Datasource.
2. Select the Composite datasource.
11 of 66

3. Click Next. Enter a name and description for the datasource.
4. Click Next and Finish. The datasource is opened in the Designer.
5. Add a Datasource component. Right click and select Properties. Select the CarsDiv20WithRegions.ds file as shown:
12 of 66

6. Click Next and Finish.
7. Add a Datastore component and link it to the Datasource Component.
8. Right click the Datastore component and select Properties.
9. Select the type as JDBC.
10. Optionally, select any columns you want to discard by clicking the Discard option. These columns will not be saved in the JDBC database.
13 of 66

11. Click Next.12. Select the Derby driver and enter the URL as:
jdbc:derby://localhost:1527/JDBC-Car-Sales-DBThis is the same database we created earlier.
13. Enter the user name and password as earlier.14. Enter any name for the database table.
14 of 66

15. Click Finish.16. Right click the Datastore and select Generate. This writes the data to the Derby database.
Creating a UniverseTo view a video tutorial of this section, click https://youtu.be/UAR3HVCBP4II.
To create a Universe:
1. Right click the folder tree and select Add – Universe.
15 of 66

2. Select the Universe as JDBC. Enter a name for the Universe.
16 of 66
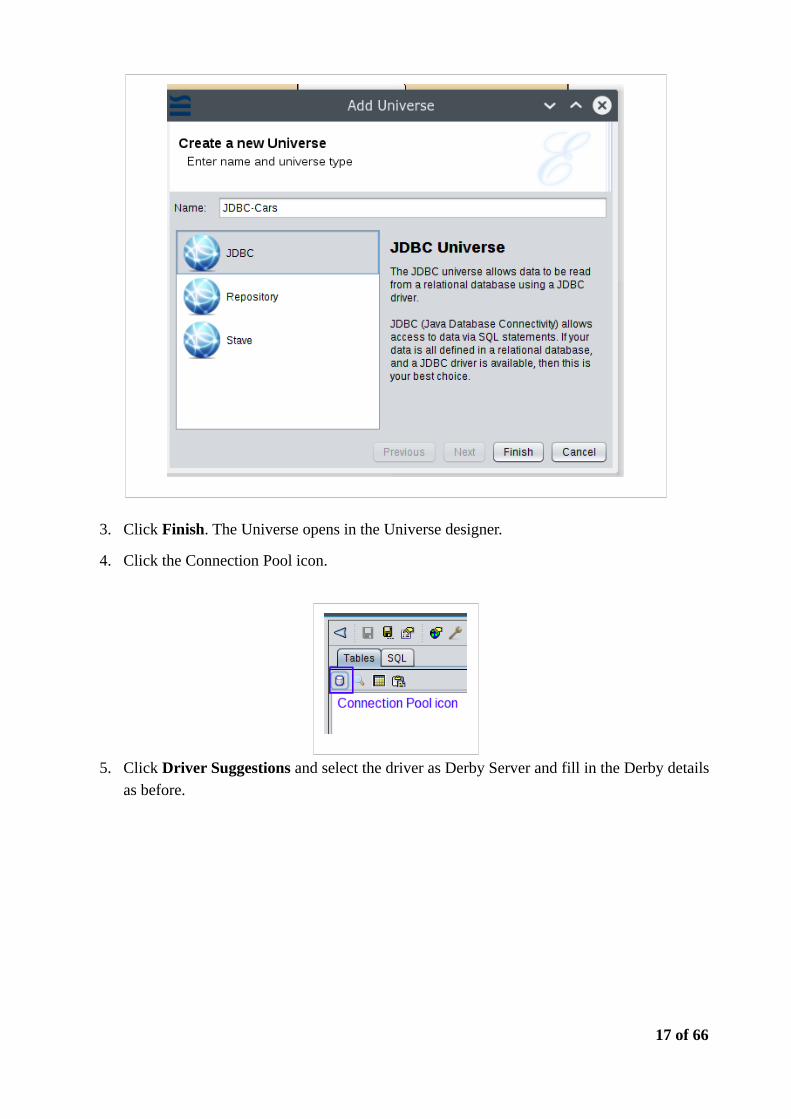
3. Click Finish. The Universe opens in the Universe designer.
4. Click the Connection Pool icon.
5. Click Driver Suggestions and select the driver as Derby Server and fill in the Derby details as before.
17 of 66

6. Click Test Connection to ensure that the connection works.
18 of 66

7. Click Next twice and then click Finish.
8. Click the Add Table icon.
9. Select the cars table and click OK.
19 of 66

10. The data from the table is populated.
11. Click the Admin Tools icon.
20 of 66
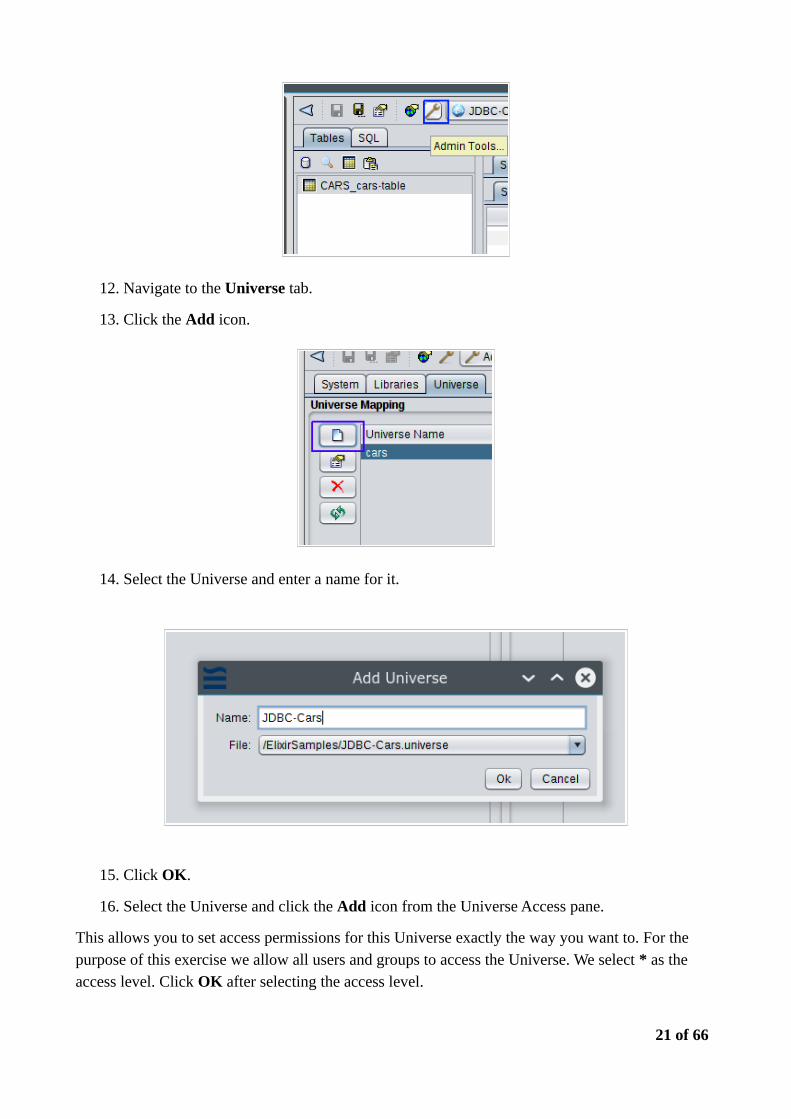
12. Navigate to the Universe tab.
13. Click the Add icon.
14. Select the Universe and enter a name for it.
15. Click OK.
16. Select the Universe and click the Add icon from the Universe Access pane.
This allows you to set access permissions for this Universe exactly the way you want to. For the purpose of this exercise we allow all users and groups to access the Universe. We select * as the access level. Click OK after selecting the access level.
21 of 66

17. Next, we need to publish the universe template, to access it from our dashboards and reports.Click Publish Template Dashboard and Publish Report Dashboard, enter a name and click OK to publish the Universe as a Dashboard and Report template respectively.
Next, let us schedule the job to automatically fetch data periodically from the CSV and import it into our Universe. We can then have current data periodically for our dashboards and reports.
22 of 66

Scheduling JobsTo view a video tutorial of this section, click https://youtu.be/ZduEKwPKEYo.
To schedule this job :
1. From the Designer, right click the folder tree and select Add-Job as shown:
2. Enter a name for the job and click Finish.
23 of 66

3. Right click the job and select Add – GenerateData.
24 of 66

4. Enter a name and select the Datasource. The corresponding Datastore is automatically filled in.
5. Click the Save icon to save the job.
25 of 66

Now that we have created our job from the Designer, let us switch to the web application to schedule it.
Scheduling a job is a task that an end user can do easily using the web application.
6. Login to the web application.
7. Click Schedule. The scheduler is displayed.
8. Click Create. Fill in the scheduler details as per your needs, as shown in the following example:
9. Click Create to save your schedule.
Now that we have our Universe with current data, we can create dashboards and reports.
26 of 66
Creating an Adhoc DashboardThe following section walks you through creating an example dashboard.
For a video tutorial of this section, see the following:
• https://www.youtube.com/watch?v=GmYQYpAcO1o
• https://www.youtube.com/watch?v=5yxl-TSyoc4
To create your dashboard, perform the actions in the following sections:
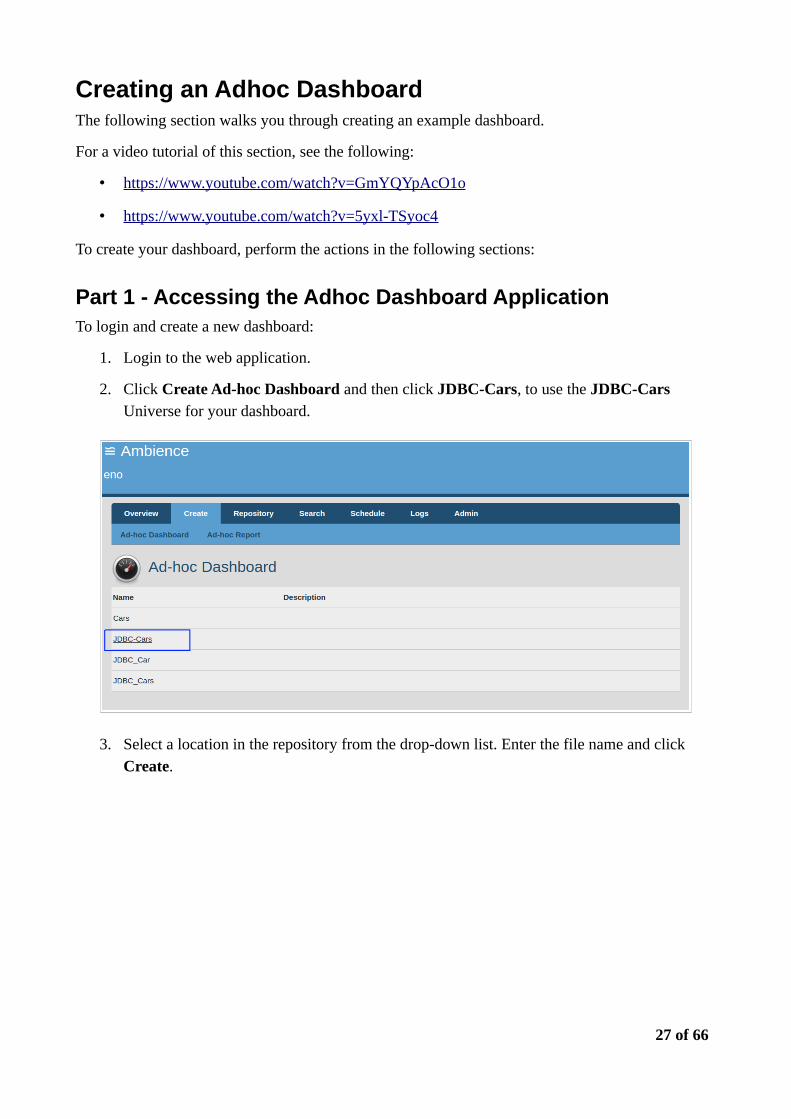
Part 1 - Accessing the Adhoc Dashboard ApplicationTo login and create a new dashboard:
1. Login to the web application.
2. Click Create Ad-hoc Dashboard and then click JDBC-Cars, to use the JDBC-Cars Universe for your dashboard.
3. Select a location in the repository from the drop-down list. Enter the file name and click Create.
27 of 66

4. The system creates a blank dashboard and opens it in Edit mode, in a new browser tab:
Part 2 - Setting up the Grid Selection1. Click the Components tab. Drag and drop the Grid component to the workspace.
Grid view shows unique values from a particular column in the universe. A grid is a selection mechanism to narrow down the range of values, and is used to view a summary of the data.
For more information on the Grid component, see the section called “Grid” in the User manual.
2. Right-click the Grid Component in the workspace and select Properties.
3. Navigate to the data tab and set the Universe table to US Region as shown:
4. Click the icon. Select the Region and Region ID columns as shown.
28 of 66

You can select multiple columns across tables as required. The system is smart to figure out the relationships between the entities and present you the data seamlessly.
This populates the grid with the four US regions.
5. Navigate to the type tab and set the Column to Region as shown. The Count and Direction properties define the layout of the grid.
The Count value indicates that the grid is to have one row of data. The grid is set as a singleselection grid - only one value from the grid can be selected at a time.
29 of 66

6. Navigate to the selection tab and set the Type to first as shown. This indicates that the first value on the grid is selected by default.
7. Click Apply to apply the changes.
8. Drag and drop another Grid component to the workspace, and align it below the first grid.
9. Right-click the second Grid component in the workspace and select Properties.
10. Navigate to the data tab and set the Universe table to US State as shown:
30 of 66

11. Click the icon. Select the State and Region ID columns as shown.
This specifies that the US States should be displayed on the grid.
12. Navigate to the type tab and set the Column to State as shown:
The Count and Direction properties define the layout of the grid.
Here, you also set the Count as 2 - indicating that the grid is to have two rows of data, and the
31 of 66

direction as Down, which specifies that the rows are to be one below the other.
In addition, the grid is set as Multiple Select. This allows multiple selection of values from the grid.
Set the sort order to ascending. This sorts the State codes in alphabetical order for display.
13. Navigate to the selection tab and set the Type to first as shown. This indicates that the
first value is selected and highlighted by default.
14. Navigate to the filters tab and set the properties as follows:
◦ Name: US Region ID
◦ Filter: in-dataset
◦ Condition: Click the icon and set the condition as shown: Click OK to save the
changes.
32 of 66

Here, you select to filter values based on the common column RegionID, that is present in the first
grid (the Region grid), that is named as View-1 on your dashboard.
The values are then filtered, and only the States that correspond to the Region selected in the first grid, are displayed in this second grid.
The filter after selection, is as shown:
15. Click Apply to apply the changes.
16. Click Save to save your dashboard.
17. Click Run to navigate to the Run mode and check that your grid selection works. Select
the Regions from the first grid and watch the second grid automatically display only those states that correspond to the selected region from the first grid.
Here are some screen shots that show you how the grid selection works:
Midwest:
33 of 66

Northeast:
South:
West:
Part 3 - Viewing the DataIn Part 1, you have set up the grid selection and ensured that the States corresponding to the selected Region are displayed.
In this section, you set up the Bar Chart to view the data for the selected States.
1. Drag the Bar Chart component on to the workspace and position it below the second
grid - i.e. the States grid.
34 of 66
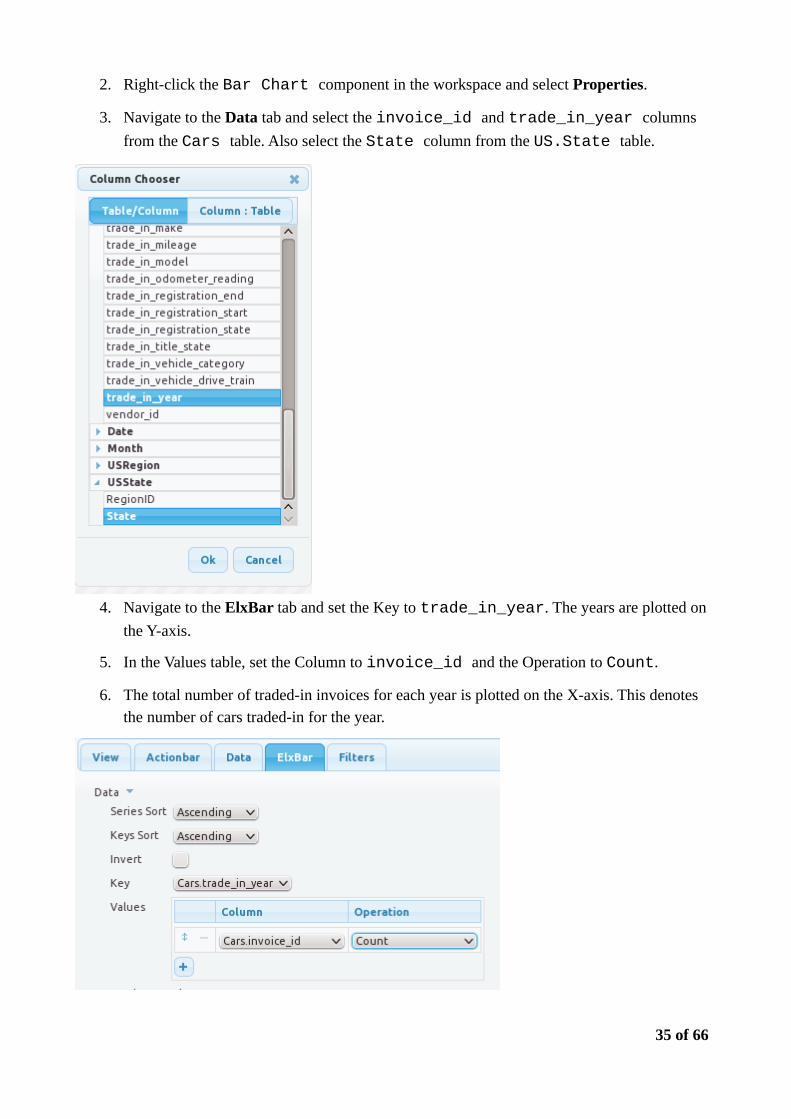
2. Right-click the Bar Chart component in the workspace and select Properties.
3. Navigate to the Data tab and select the invoice_id and trade_in_year columns
from the Cars table. Also select the State column from the US.State table.
4. Navigate to the ElxBar tab and set the Key to trade_in_year. The years are plotted on
the Y-axis.
5. In the Values table, set the Column to invoice_id and the Operation to Count.
6. The total number of traded-in invoices for each year is plotted on the X-axis. This denotes the number of cars traded-in for the year.
35 of 66

7. From the ElxBar tab, set the Background fill color and the border color as shown:
8. From the ElxBar tab, set the Chart Title, the Y-Axis Title (Subtitle West), and the position ofthe Legend to West as shown:
36 of 66
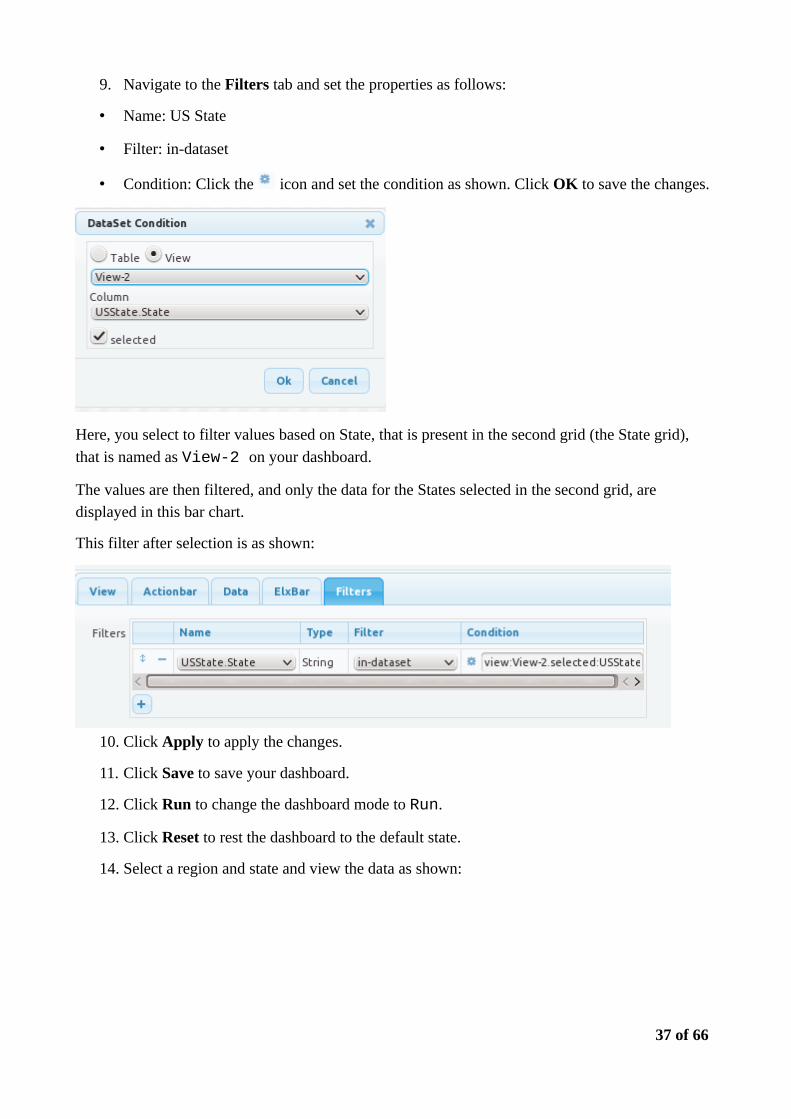
9. Navigate to the Filters tab and set the properties as follows:
• Name: US State
• Filter: in-dataset
• Condition: Click the icon and set the condition as shown. Click OK to save the changes.
Here, you select to filter values based on State, that is present in the second grid (the State grid),
that is named as View-2 on your dashboard.
The values are then filtered, and only the data for the States selected in the second grid, are displayed in this bar chart.
This filter after selection is as shown:
10. Click Apply to apply the changes.
11. Click Save to save your dashboard.
12. Click Run to change the dashboard mode to Run.
13. Click Reset to rest the dashboard to the default state.
14. Select a region and state and view the data as shown:
37 of 66
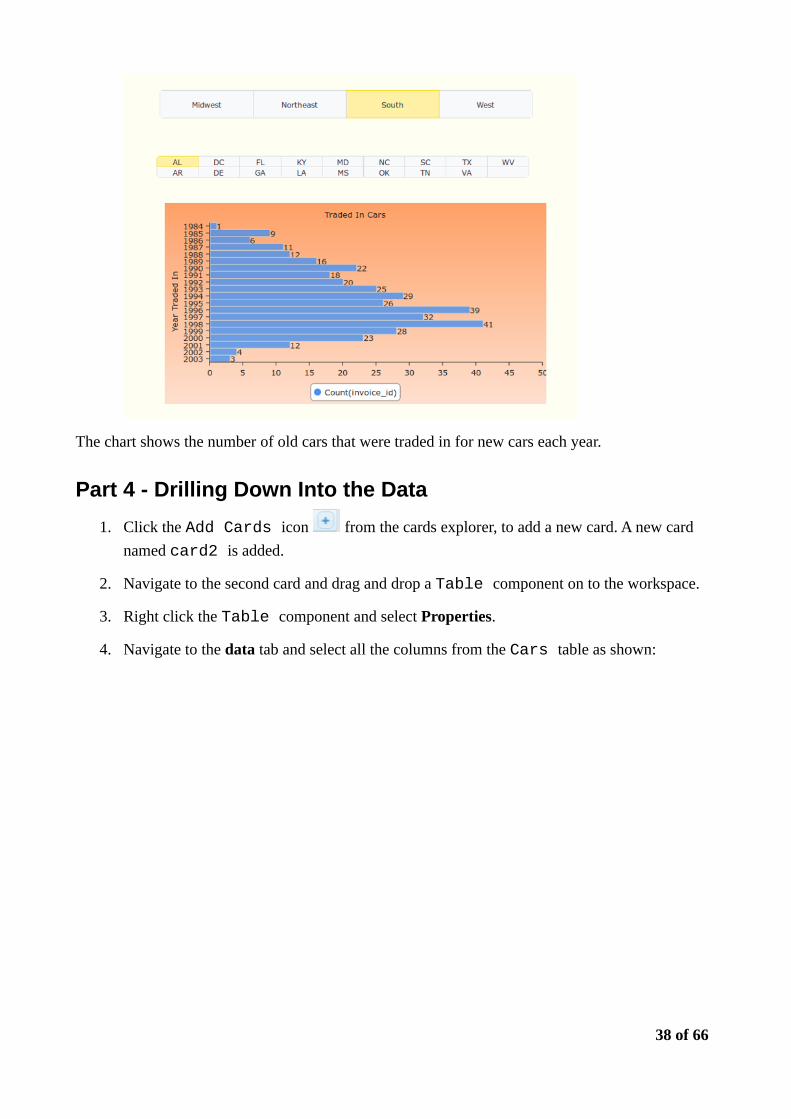
The chart shows the number of old cars that were traded in for new cars each year.
Part 4 - Drilling Down Into the Data
1. Click the Add Cards icon from the cards explorer, to add a new card. A new card
named card2 is added.
2. Navigate to the second card and drag and drop a Table component on to the workspace.
3. Right click the Table component and select Properties.
4. Navigate to the data tab and select all the columns from the Cars table as shown:
38 of 66
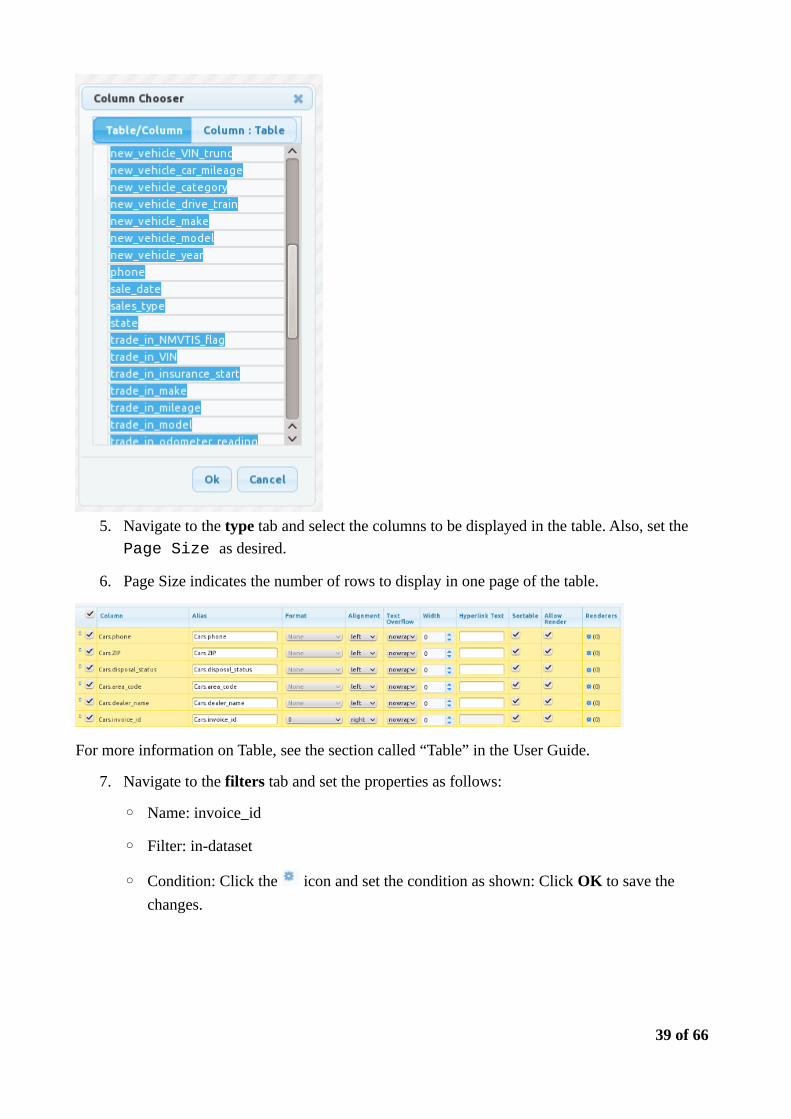
5. Navigate to the type tab and select the columns to be displayed in the table. Also, set the
Page Size as desired.
6. Page Size indicates the number of rows to display in one page of the table.
For more information on Table, see the section called “Table” in the User Guide.
7. Navigate to the filters tab and set the properties as follows:
◦ Name: invoice_id
◦ Filter: in-dataset
◦ Condition: Click the icon and set the condition as shown: Click OK to save the
changes.
39 of 66
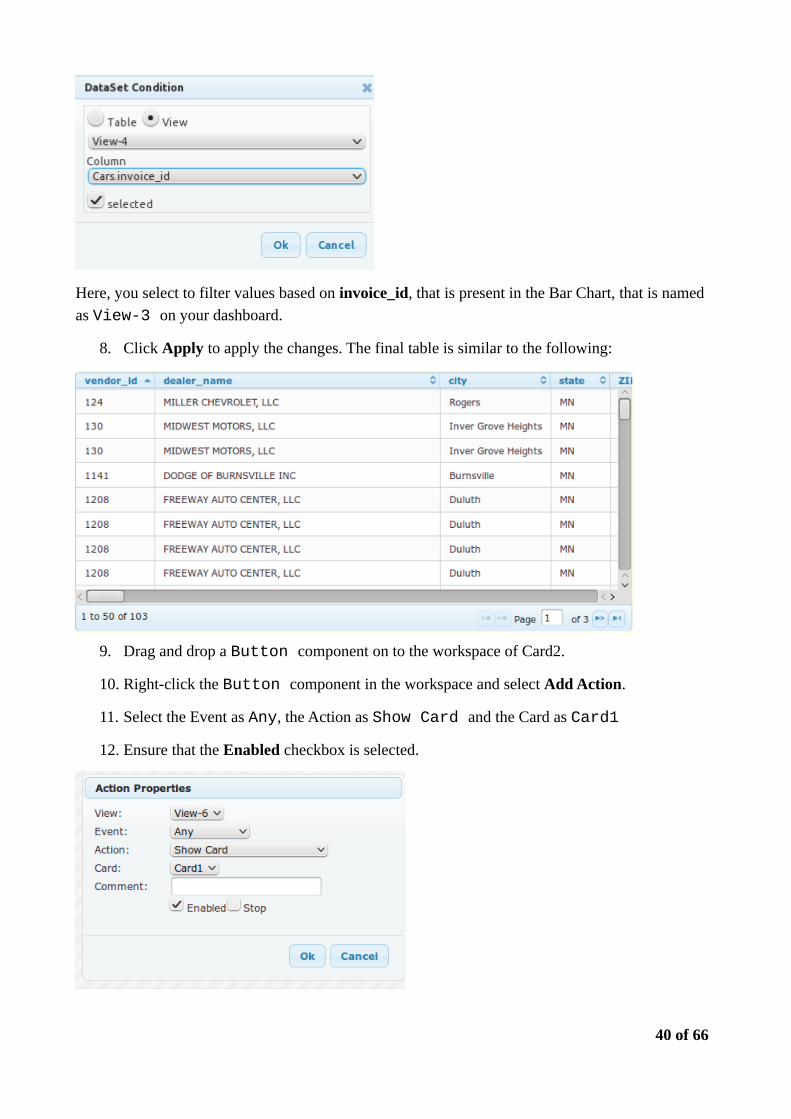
Here, you select to filter values based on invoice_id, that is present in the Bar Chart, that is named
as View-3 on your dashboard.
8. Click Apply to apply the changes. The final table is similar to the following:
9. Drag and drop a Button component on to the workspace of Card2.
10. Right-click the Button component in the workspace and select Add Action.
11. Select the Event as Any, the Action as Show Card and the Card as Card1
12. Ensure that the Enabled checkbox is selected.
40 of 66

13. Click OK to save the action. The completed Card 2 with the Submit button is as follows:
Clicking this button (either a single click or a double click) will navigate back to the first card.
14. Navigate to Card 1 using the card explorer.
15. Drag and drop a Button component on to Card1.
16. Right-click the Button component in the workspace and select Add Action.
17. Select the Event as Any, the Action as Show Card and the Card as Card2
18. Ensure that the Enabled checkbox is selected.
19. Click OK to save the action. The completed Card 1 with the Submit button looks as follows:
41 of 66
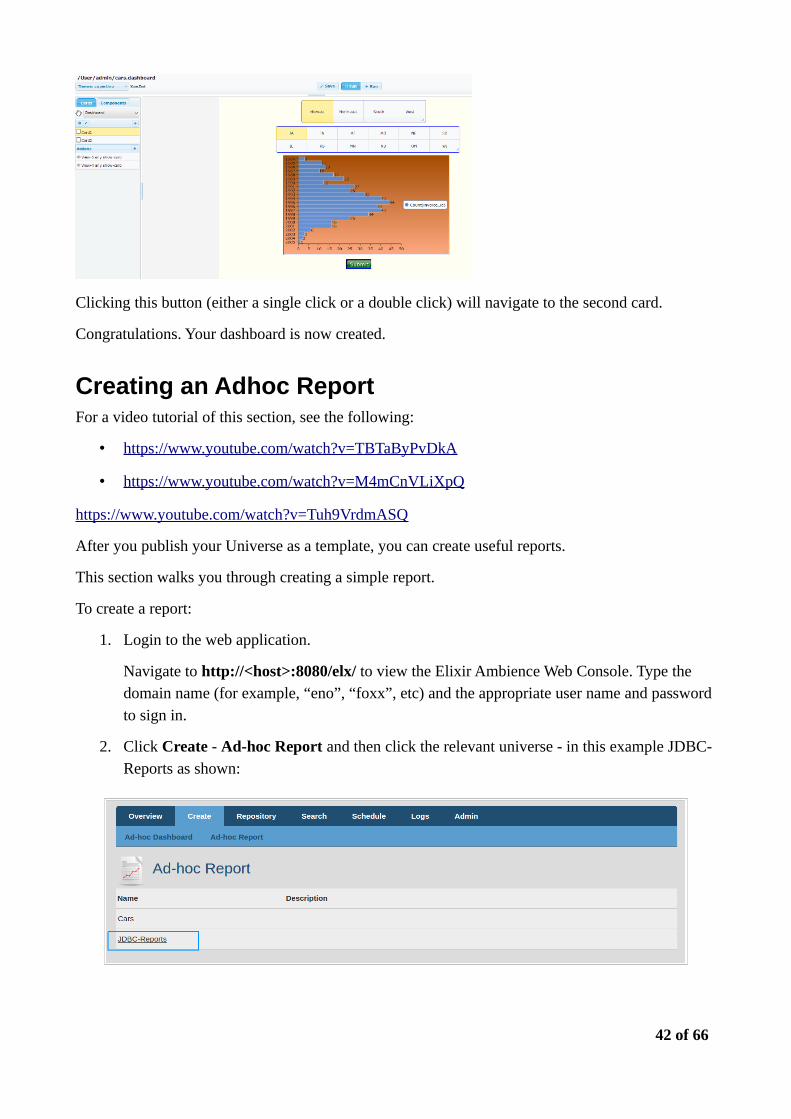
Clicking this button (either a single click or a double click) will navigate to the second card.
Congratulations. Your dashboard is now created.
Creating an Adhoc ReportFor a video tutorial of this section, see the following:
• https://www.youtube.com/watch?v=TBTaByPvDkA
• https://www.youtube.com/watch?v=M4mCnVLiXpQ
https://www.youtube.com/watch?v=Tuh9VrdmASQ
After you publish your Universe as a template, you can create useful reports.
This section walks you through creating a simple report.
To create a report:
1. Login to the web application.
Navigate to http://<host>:8080/elx/ to view the Elixir Ambience Web Console. Type the domain name (for example, “eno”, “foxx”, etc) and the appropriate user name and password to sign in.
2. Click Create - Ad-hoc Report and then click the relevant universe - in this example JDBC-Reports as shown:
42 of 66

3. Select a location in the repository from the drop-down list, as shown. Enter the file name and click Create.
4. The system creates a blank report, and opens it in a new browser tab as shown.
5. Click the Information band and enter a title. Select the page number to be on the left, and thedate and time to be on the right side of the page, as shown.
6. Click the Table Band and enter a title as shown.
43 of 66

7. Click the Add Column icon (+ sign) under Groups and select the Groups for display, as shown:
44 of 66
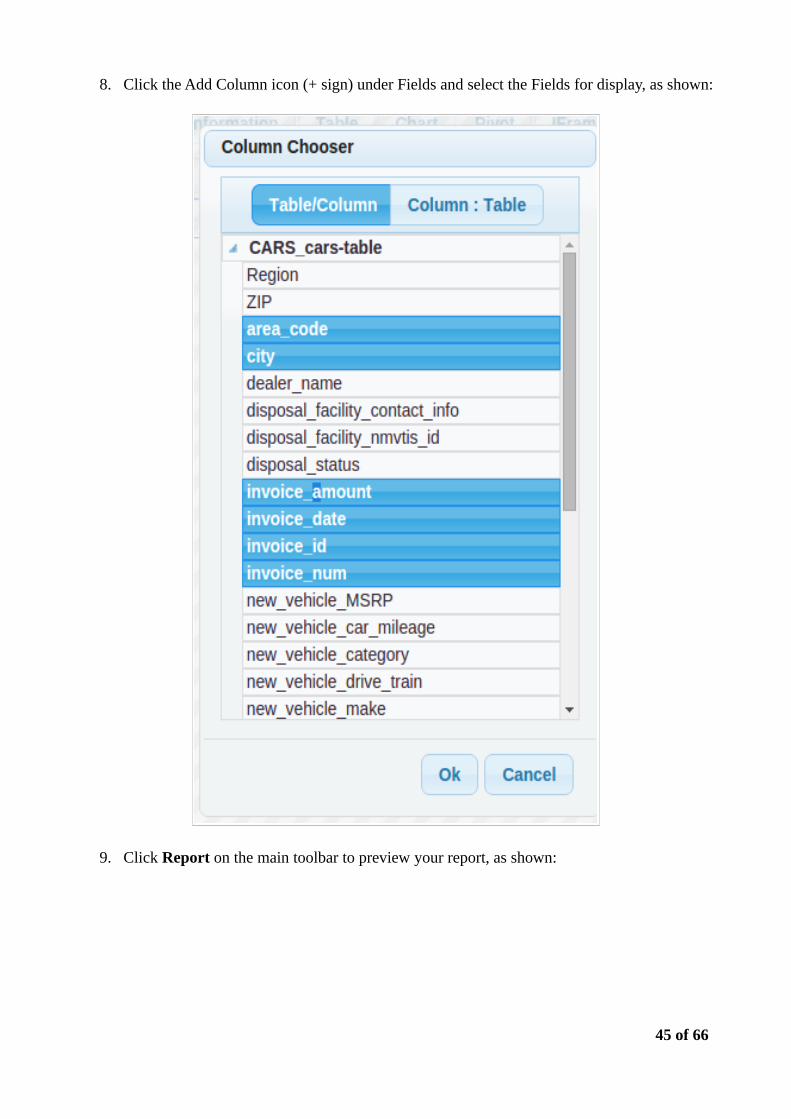
8. Click the Add Column icon (+ sign) under Fields and select the Fields for display, as shown:
9. Click Report on the main toolbar to preview your report, as shown:
45 of 66

10. Click Save to save your report.
Creating a Report Using the DesignerAdhoc Reports are simple reports and are meant for an end user to create easily. For more complex reports, such as those with complex formatting, bar codes etc, use the report designer to create such reports. You can also schedule these reports to be generated automatically. Usually, a dedicated report designer creates these complex reports using the Designer.
For a video tutorial of this section, see https://youtu.be/a6_ss1tWueM.
Here is a walk through of creating a very simple report with Designer.
1. Start Designer.
46 of 66

2. Enter a name and description for the report. Click Next.
3. Select the datasource for the report. Here we use Fruit100.ds as the datasource.
47 of 66

4. Select the type of report to create. You can create a report from scratch using the blank report type. You can also use layout templates to easily create your report.
Report types are described in detail in the Elixir Report Designer User Manual.
Here, we use a columnar report that allow us to group fields.
48 of 66

5. Click Next and select the fields to use in the report.
49 of 66

6. Click Next and select the fields on which the report is to be grouped. Here we select Fruit and Company as the fields.
50 of 66

7. Click Next and select any fields to be sorted. Here we select the Weight to be sorted in ascending numerical order.
51 of 66

8. Click Next and select the report format. Here we select the Block format.
52 of 66

9. Click Finish. The report outline opens in the Designer.
53 of 66

10. Let us replace the Unit Cost display with a Bar Code signifying the unit cost.
Select Unit Cost from the Detail section and delete it.
Drag the Bar Code component to the place where Unit Cost was earlier.
54 of 66

11. Select the type of Bar Code to display as per your requirements.
12. Click Next and select the field for the Bar Code. Here we select Unit Cost.
55 of 66

13. Select any parameters for your Bar Code as required and click Finish.
56 of 66

14. The report outline displays the Bar Code field.
15. Add labels to the columns to identify them. Use the label component.
57 of 66

16. The final report layout looks as shown in the following example:
58 of 66

17. Click Render to render the report.
18. Select the final report format. Here we use the default Glint format to preview the report quickly.
59 of 66

19. The report is displayed as shown:
60 of 66

Portal OperationsThe Web application allows you to do operations such as versioning, setting access permissions andsearching for files among many others.
61 of 66
As an example, this guide just touches upon Versioning and Access Control.
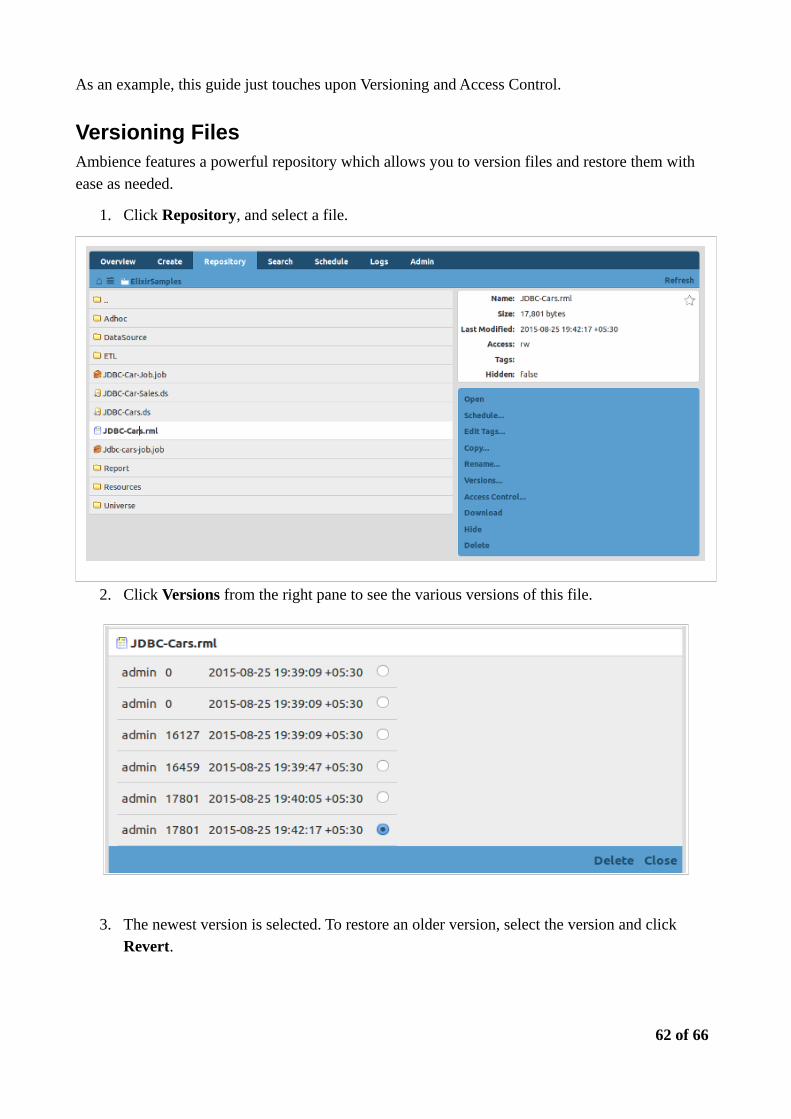
Versioning FilesAmbience features a powerful repository which allows you to version files and restore them with ease as needed.
1. Click Repository, and select a file.
2. Click Versions from the right pane to see the various versions of this file.
3. The newest version is selected. To restore an older version, select the version and click Revert.
62 of 66

Setting Access PermissionsTo set access permissions for a file:
1. Click Repository and select a file. This is explained in Versioning above.
2. Click Access Control.
The two permissions are:
1. Reader: Allows only reading files from the folder. Users cannot write to files in the folder.2. Writer: Allows writing to files in the folder.
To add access rights for a user:
1. Click Add2. Enter the name of the user to add. On platforms that support it, the edit field uses auto-
complete to narrow down the name choices, as you type the name.3. By default, a user gets Reader access when added. To grant Writer access, select the
Writer option.
63 of 66

4. Click the Add icon ( ) to add the access right.
The other portal operations are described in the Elixir Ambience Repository User's Manual.
We hope this short guide has walked you through the main operations of Ambience and shown you how easy it is to create powerful dashboards and reports that cater exactly to your needs.
64 of 66