ellex medical lasers...... “global diabetic retinopathy market 2015 to 2019” technavio insights...
TRANSCRIPT

Slide 1
Ellex manufactures and sells innovative products that help eye surgeons around the world toeffectively and efficiently treat eye disease; this is one powerful vision
Ellex Medical LasersInvestor Presentation for year ended 30 June 2015 based on Appendix 4E Preliminary Financial Report
(prepared 27 August 2015)

Slide 2
Disclaimer
This presentation has been prepared by Ellex Medical Lasers Ltd (Ellex) based on preliminary financial report ASX Form 4E.
While the information in this presentation has been prepared in good faith and with reasonable care, no representation or warranty, express or implied, is made as to the accuracy, adequacy or reliability of any statement, estimates, opinions or other information contained in the presentation.
This presentation may contain forward looking statement. These forward-looking statement have been made based upon Ellex’s expectations and beliefs concerning future developments and their potential effect on Ellex (and it’s controlled entities) and are subject to risks and uncertainty which are, in many instances, beyond Ellex’s control. No assurance is given that future developments will be in accordance with Ellex’s expectations. Actual results could differ materially from those expected by Ellex.
This presentation does not constitute an offer to sell or a solicitation of an offer to purchase any security or financial product or service. Any such offer or solicitation shall be made only pursuant to a Product Disclosure Statement, Information Memorandum, Prospectus or other offer document relating to a financial product or service.
Past performance is not necessarily indicative of future results and no person guarantees the performance of any financial product or service or the amount or timing of any return from it. There can be no assurance that the financial product or service will achieve any targeted return, that asset allocations will be met or that the financial product or service will be able to implement its investment strategy and investment approach or achieve its investment objective.
The information contained in this presentation is not intended to be relied upon as advice to investors or potential investors, who should consider seeking independent professional advice depending upon their specific investment objectives, financial situation or particular needs.
Slide 3
Contents
• Introduction and Company Overview
• FY15 Financial Results
• Growth Strategy Update and Outlook
• Reformatted Profit and Loss
Slide 4
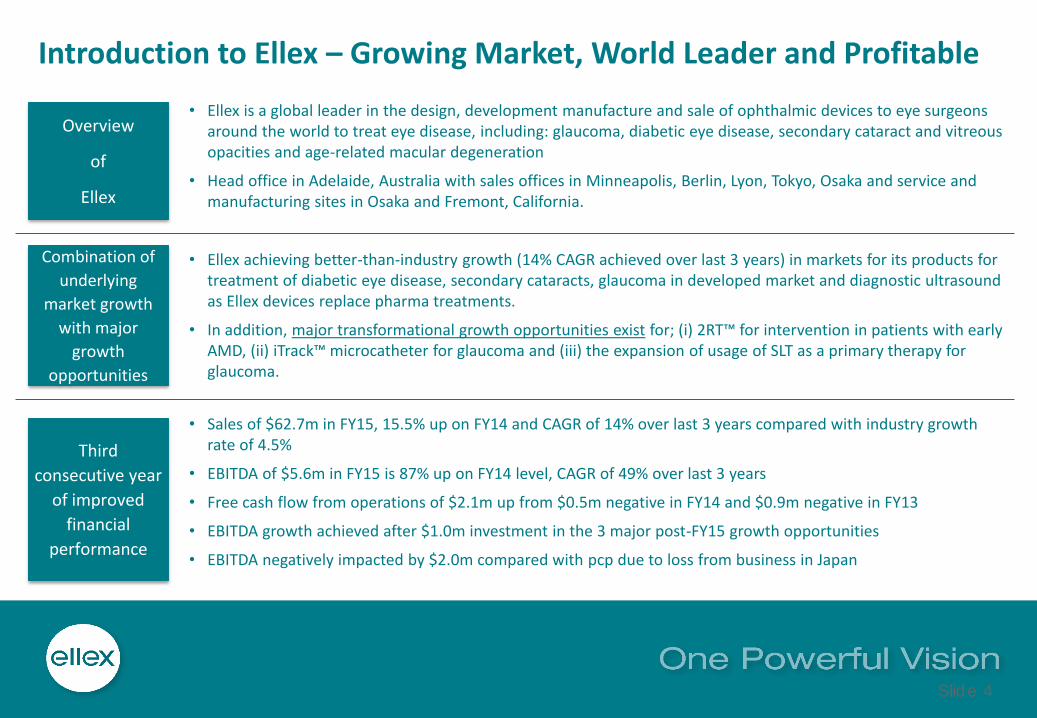
Introduction to Ellex – Growing Market, World Leader and Profitable
• Ellex is a global leader in the design, development manufacture and sale of ophthalmic devices to eye surgeons around the world to treat eye disease, including: glaucoma, diabetic eye disease, secondary cataract and vitreous opacities and age-related macular degeneration
• Head office in Adelaide, Australia with sales offices in Minneapolis, Berlin, Lyon, Tokyo, Osaka and service and manufacturing sites in Osaka and Fremont, California.
• Ellex achieving better-than-industry growth (14% CAGR achieved over last 3 years) in markets for its products for treatment of diabetic eye disease, secondary cataracts, glaucoma in developed market and diagnostic ultrasound as Ellex devices replace pharma treatments.
• In addition, major transformational growth opportunities exist for; (i) 2RT™ for intervention in patients with early AMD, (ii) iTrack™ microcatheter for glaucoma and (iii) the expansion of usage of SLT as a primary therapy for glaucoma.
• Sales of $62.7m in FY15, 15.5% up on FY14 and CAGR of 14% over last 3 years compared with industry growth rate of 4.5%
• EBITDA of $5.6m in FY15 is 87% up on FY14 level, CAGR of 49% over last 3 years
• Free cash flow from operations of $2.1m up from $0.5m negative in FY14 and $0.9m negative in FY13
• EBITDA growth achieved after $1.0m investment in the 3 major post-FY15 growth opportunities
• EBITDA negatively impacted by $2.0m compared with pcp due to loss from business in Japan
Overview
of
Ellex
Combination of
underlying
market growth
with major
growth
opportunities
Third
consecutive year
of improved
financial
performance

Slide 5
ELLEX – OPHTHLAMIC PRODUCTS

Slide 6
Ellex – Balancing Annual Profit with Growth
• Last 3 years have seen Ellex consistently improve both top and bottom line performance
• Reported EBITDA in FY15 negatively impacted by $1m of investments for FY16 and beyond growth for 2RT™, iTrack 250™ and SLT expansion in Asia.
-
10.0
20.0
30.0
40.0
50.0
60.0
70.0
FY13 FY14 FY15
Group Sales in A$ millions
CAGR of 14% over 3 years exceeds industry forecast of 4.5%
-
1.0
2.0
3.0
4.0
5.0
6.0
FY13 FY14 FY15
EBITDA
CAGR of 49 % over 3 years
0.0%
1.0%
2.0%
3.0%
4.0%
5.0%
6.0%
7.0%
8.0%
9.0%
10.0%
FY13 FY14 FY15
EBITDA to Sales Ratio
Demonstrated improving margins
Slide 7
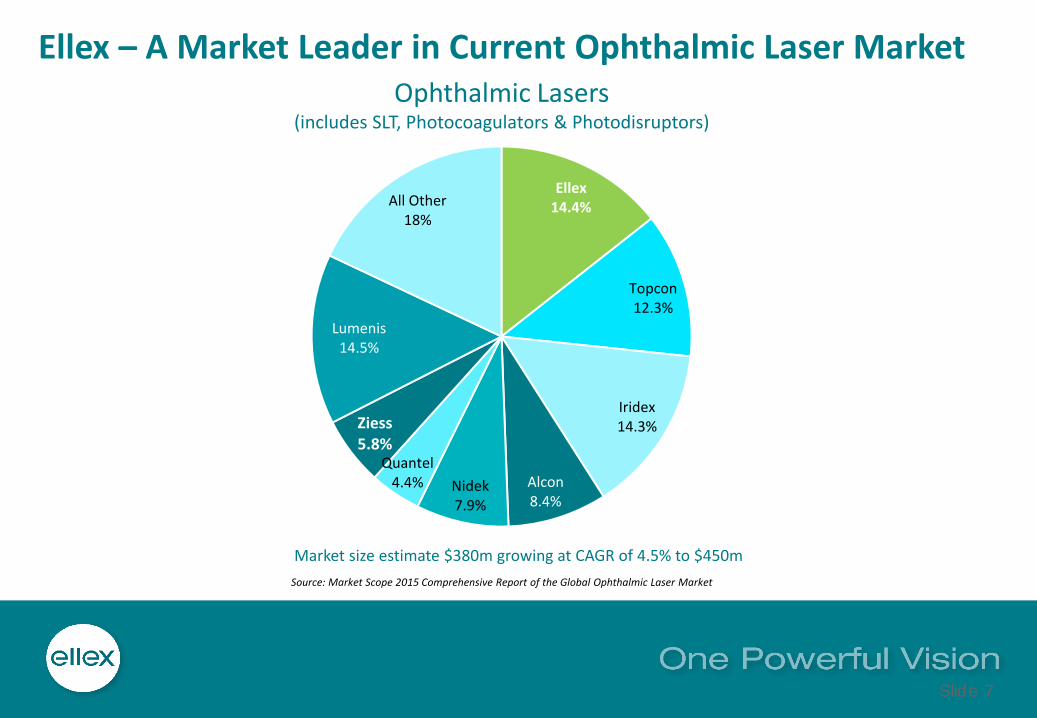
Ellex – A Market Leader in Current Ophthalmic Laser Market
Ellex14.4%
Topcon12.3%
Iridex14.3%
Alcon8.4%
Nidek7.9%
Quantel4.4%
Ziess5.8%
Lumenis14.5%
All Other18%
Source: Market Scope 2015 Comprehensive Report of the Global Ophthalmic Laser Market
Ophthalmic Lasers(includes SLT, Photocoagulators & Photodisruptors)
Market size estimate $380m growing at CAGR of 4.5% to $450m

Slide 8
Disease Current Ellex DevicesTotal annual spend on
disease treatment with pharma and devices
Current device-market accessible to Ellex (2)
Assessed device-market position against listed
peers (1)
Glaucoma – early stage SLT with Tango™, Solo™
US$4.6 billion(1)
US$60 million
(CAGR 4.5% plus more with
pharma replacement)
1. Ellex
2. Lumenis
(LMNS:NASDAQ)
Glaucoma – later stage
iTrack™ (approx. US$50m
invested prior to acquisition
by Ellex)
US$240 million
(CAGR 23%)
1. Glaukos
(GKOS:NYSE)
3 or 4 Ellex
Cataracts and Vitreous
Floaters
Ultra Q™ and
Ultra Q Reflex™
US$3.3 billion plus 24 million
cataract operations per
year(1)
US$65 million
(CAGR 4.5% plus more with
vitreous floater treatment)
1. Ellex
2. Lumenis
Diabetic Disease of RetinaIntegre Pro™ and
Integre Pro Scan™US$1.5 billion(3)
US$305 million
(CAGR 4.5% plus more with
pharma replacement )
1. Iridex (IRIX:NASDAQ)
4. Ellex
Early-Stage AMD and
Clinically Significant Macula
Edema
2RT™US$5.1 billion(4)
(CAGR 7%) in just 7 major economies
Emerging - market will be a
function of the current
annual spend of US$5.1b
1. Ellex (assessed by
ELX)
(1) MarketScope LLC Reports, (2) Combination of Ellex estimate and MarketScope LLC Reports (3) “Global Diabetic Retinopathy Market 2015 to 2019” Technavio Insights (4)PharmaPoint: Macular Edema and Macular Degeneration- Global Drug Forecast and Market analysis to 2023” published in Dec 2014
Ellex – Large Additional Market Potential
Slide 9
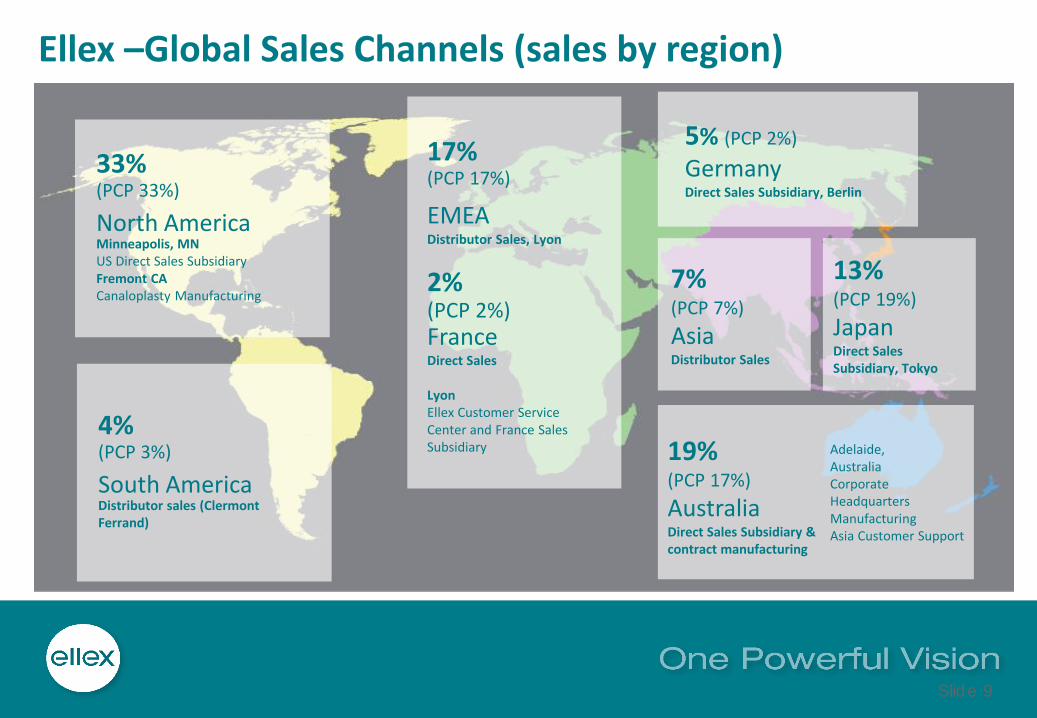
Ellex –Global Sales Channels (sales by region)
13%(PCP 19%)
JapanDirect Sales Subsidiary, Tokyo
7% (PCP 7%)
AsiaDistributor Sales
17%(PCP 17%)
EMEADistributor Sales, Lyon
2%(PCP 2%)FranceDirect Sales
Lyon Ellex Customer Service Center and France Sales Subsidiary
33% (PCP 33%)
North AmericaMinneapolis, MNUS Direct Sales SubsidiaryFremont CACanaloplasty Manufacturing
19%(PCP 17%)
AustraliaDirect Sales Subsidiary & contract manufacturing
Adelaide, AustraliaCorporate HeadquartersManufacturingAsia Customer Support
5% (PCP 2%)
GermanyDirect Sales Subsidiary, Berlin
4% (PCP 3%)
South AmericaDistributor sales (Clermont Ferrand)

Slide 10
FY15 Financial Results
Slide 11
Market and Financial Summary
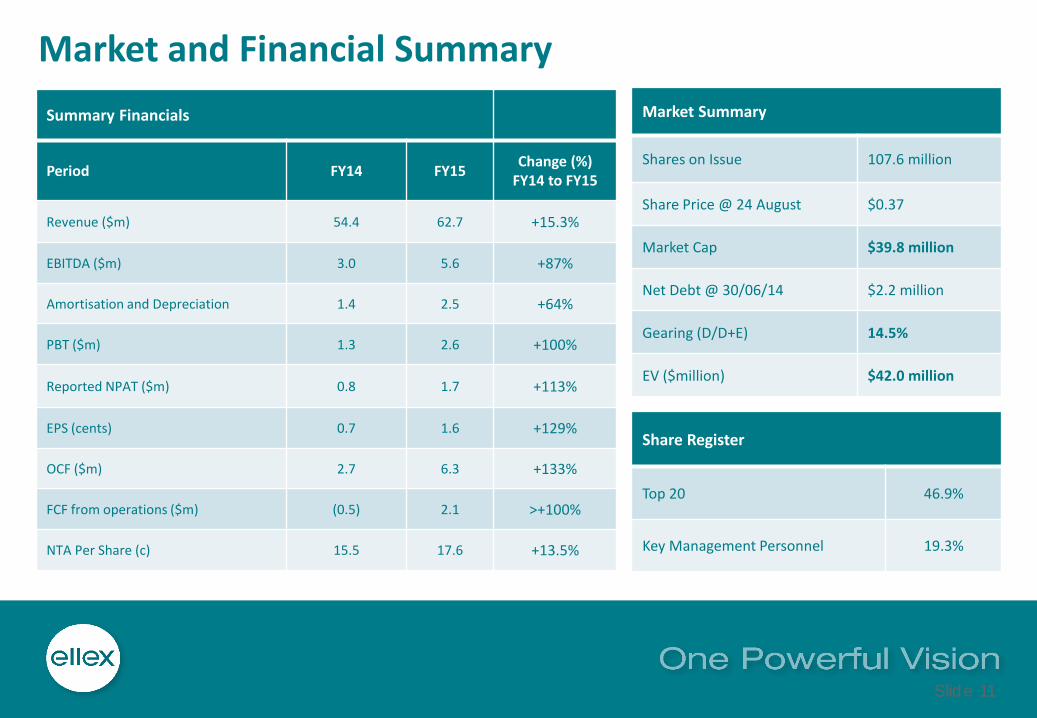
Market Summary
Shares on Issue 107.6 million
Share Price @ 24 August $0.37
Market Cap $39.8 million
Net Debt @ 30/06/14 $2.2 million
Gearing (D/D+E) 14.5%
EV ($million) $42.0 million
Summary Financials
Period FY14 FY15Change (%)
FY14 to FY15
Revenue ($m) 54.4 62.7 +15.3%
EBITDA ($m) 3.0 5.6 +87%
Amortisation and Depreciation 1.4 2.5 +64%
PBT ($m) 1.3 2.6 +100%
Reported NPAT ($m) 0.8 1.7 +113%
EPS (cents) 0.7 1.6 +129%
OCF ($m) 2.7 6.3 +133%
FCF from operations ($m) (0.5) 2.1 >+100%
NTA Per Share (c) 15.5 17.6 +13.5%
Share Register
Top 20 46.9%
Key Management Personnel 19.3%

Slide 12
Financial Summary – Sales
FY13 FY14 FY15 Change
Australia 9.5 9.4 11.8 +26%
USA 8.5 17.9 20.5 +14%
EMEA 10.0 11.4 15.4 +35%
Japan 10.7 10.4 8.4 -19%
Asia 3.2 3.9 4.4 13%
South America 0.9 1.4 2.2 +55%
TOTAL 42.8 54.4 62.7 +15%
Recurring Ellex-branded consumables & service component (%of total)
2.1(5%)
4.7(9%)
8.3(13%)
• Full year of iTrack• Falling A$ against US$• Improved sales of new products Integre Pro and
UltraQ Reflex™
• Improved sales of new products Integre Pro and Ultra Q Reflex™
• See separate slide
• Application of specific additional sales management
• Sales team improvements• Contract manufacturing growth
• Continued growth in China, Thailand and South Korea

Slide 13
Financial Summary – Sales Lines of Revenue
Three Categories
• Ellex manufactured and branded product for all markets – Good growth
• Distribution of products manufactured by third parties mainly by direct sales force in Japan and Australia. Third-party products are complementary to Ellex range and serve to improve revenue per sales representative visit –growth but change in mix
• Service and contract manufacturing –some growth but contract manufacturing was terminated on 30 June 2015 to provide manufacturing capacity in FY16 to meet demand for Ellex products -
10.0
20.0
30.0
40.0
50.0
60.0
70.0
FY13 FY14 FY15
Ellex Product Third party product Service and contract manufacturing

Slide 14
Financial Summary – Estimated Impact of FX
Impact of Revenue TotalComposition in millions
USD YEN EURO AUD
Sales in AUD FY15 at actual FX rates 62.8 30.1 8.2 8.2 16.3
Sales in AUD FY15 at FY14 rates 60.7 27.6 8.4 8.4 16.3
FX generated revenue improvement/(decrease)
2.1 2.5 (0.2) (0.2) -
Average FX rate v’s A$ Net position of $A
FY14 FY15
USD 0.92 0.84 Devaluation 9%
YEN 92.7 95.5 Appreciation 3%
EURO 0.68 0.70 Appreciation 3%
• Production costs – approximately 30% USD
• Operating Costs – approximately 45% USD
Slide 15
Financial Summary – Cash Flow
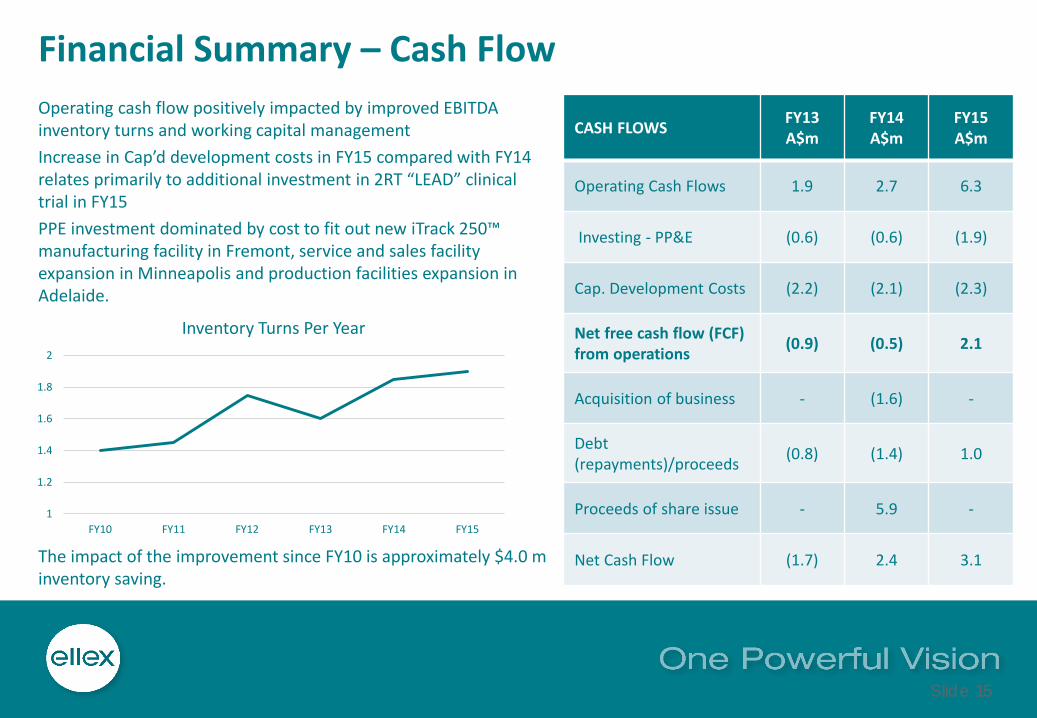
Operating cash flow positively impacted by improved EBITDA inventory turns and working capital management
Increase in Cap’d development costs in FY15 compared with FY14 relates primarily to additional investment in 2RT “LEAD” clinical trial in FY15
PPE investment dominated by cost to fit out new iTrack 250™ manufacturing facility in Fremont, service and sales facility expansion in Minneapolis and production facilities expansion in Adelaide.
CASH FLOWSFY13A$m
FY14A$m
FY15A$m
Operating Cash Flows 1.9 2.7 6.3
Investing - PP&E (0.6) (0.6) (1.9)
Cap. Development Costs (2.2) (2.1) (2.3)
Net free cash flow (FCF) from operations
(0.9) (0.5) 2.1
Acquisition of business - (1.6) -
Debt (repayments)/proceeds
(0.8) (1.4) 1.0
Proceeds of share issue - 5.9 -
Net Cash Flow (1.7) 2.4 3.1
1
1.2
1.4
1.6
1.8
2
FY10 FY11 FY12 FY13 FY14 FY15
Inventory Turns Per Year
The impact of the improvement since FY10 is approximately $4.0 m inventory saving.
Slide 16
Financial Summary - Japan Business Change Management
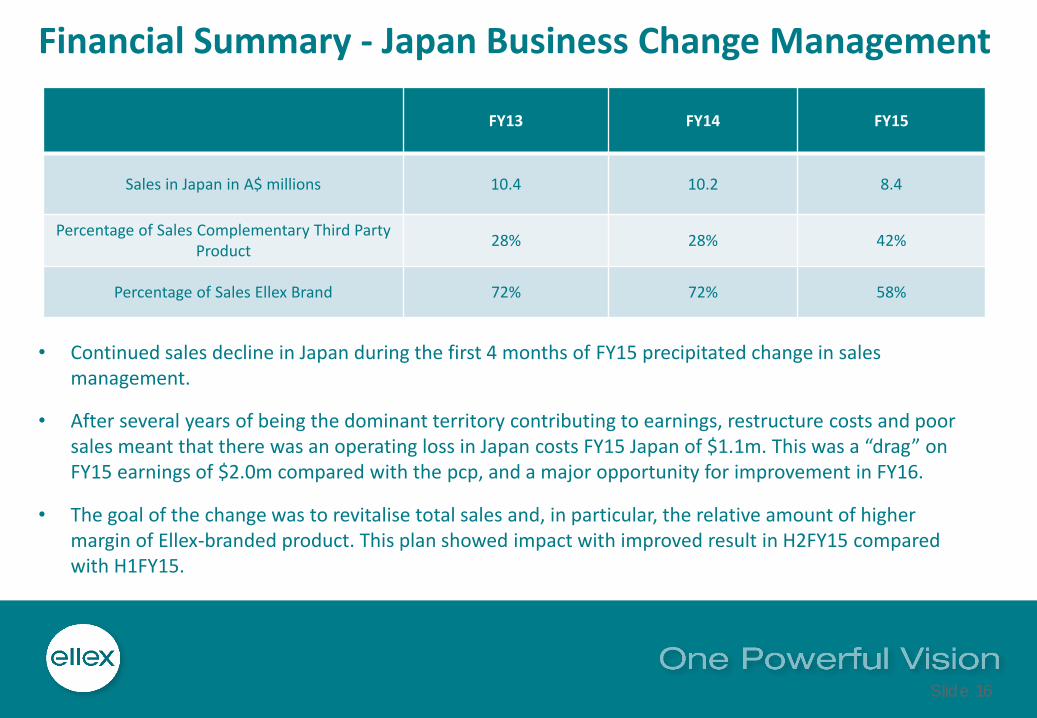
FY13 FY14 FY15
Sales in Japan in A$ millions 10.4 10.2 8.4
Percentage of Sales Complementary Third PartyProduct
28% 28% 42%
Percentage of Sales Ellex Brand 72% 72% 58%
• Continued sales decline in Japan during the first 4 months of FY15 precipitated change in sales management.
• After several years of being the dominant territory contributing to earnings, restructure costs and poor sales meant that there was an operating loss in Japan costs FY15 Japan of $1.1m. This was a “drag” on FY15 earnings of $2.0m compared with the pcp, and a major opportunity for improvement in FY16.
• The goal of the change was to revitalise total sales and, in particular, the relative amount of higher margin of Ellex-branded product. This plan showed impact with improved result in H2FY15 compared with H1FY15.

Slide 17
Financial Performance – EBITDA and FCF Impacted by Growth Investments
FY14 FY15
EBITDAFree Cash
FlowEBITDA
Free Cash Flow
Reported 3.0 (0.5) 5.6 2.1
2RT™:
- LEAD clinical trial and product engineering - 0.4 - 0.4
- Clinical support to early adopter program and marketing - - 0.5 0.5
iTrack™:
- Relaunch device with 5-10 minute procedure (ab-internocanaloplasty, ABiC) to replace 25-30 minute procedure
- - 0.3 0.3
SLT Expansion:
- Additional staff resources in China and additional product registration and legal
- - 0.2 0.2
Reported adjusted for investments for growth 3.0 (0.1) 6.6 3.5
FY15 reported EBITDA and Free Cash Flow have been materially impacted by investments to pursue the 3 major growth opportunities; 2RT™, iTrack 250™ and SLT Expansion.
Slide 18
Financial Summary – Product Development Carried Forward
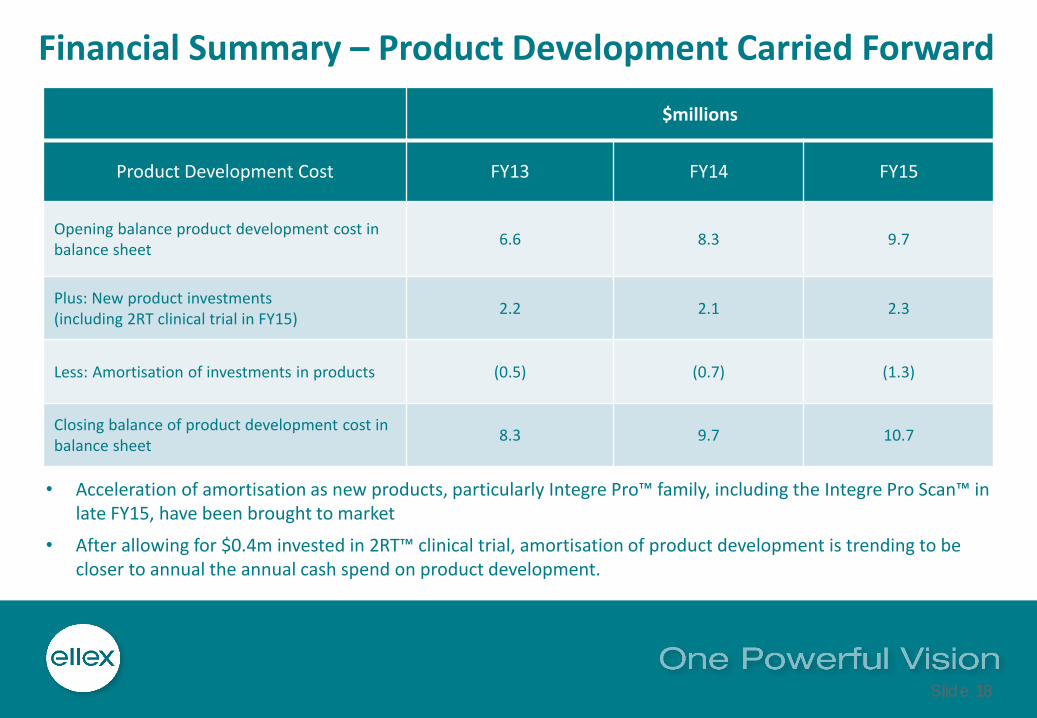
$millions
Product Development Cost FY13 FY14 FY15
Opening balance product development cost in balance sheet
6.6 8.3 9.7
Plus: New product investments(including 2RT clinical trial in FY15)
2.2 2.1 2.3
Less: Amortisation of investments in products (0.5) (0.7) (1.3)
Closing balance of product development cost in balance sheet
8.3 9.7 10.7
• Acceleration of amortisation as new products, particularly Integre Pro™ family, including the Integre Pro Scan™ in late FY15, have been brought to market
• After allowing for $0.4m invested in 2RT™ clinical trial, amortisation of product development is trending to be closer to annual the annual cash spend on product development.
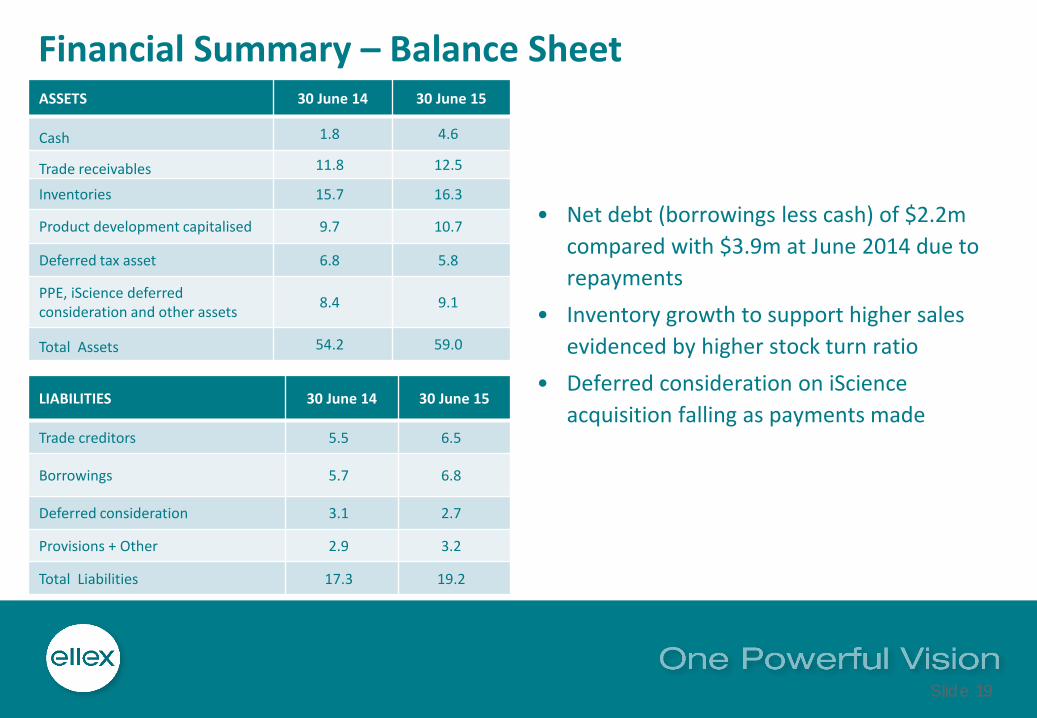
Slide 19
Financial Summary – Balance SheetASSETS 30 June 14 30 June 15
Cash 1.8 4.6
Trade receivables 11.8 12.5
Inventories 15.7 16.3
Product development capitalised 9.7 10.7
Deferred tax asset 6.8 5.8
PPE, iScience deferred consideration and other assets
8.4 9.1
Total Assets 54.2 59.0
• Net debt (borrowings less cash) of $2.2m
compared with $3.9m at June 2014 due to
repayments
• Inventory growth to support higher sales
evidenced by higher stock turn ratio
• Deferred consideration on iScience
acquisition falling as payments madeLIABILITIES 30 June 14 30 June 15
Trade creditors 5.5 6.5
Borrowings 5.7 6.8
Deferred consideration 3.1 2.7
Provisions + Other 2.9 3.2
Total Liabilities 17.3 19.2
Slide 20
Growth Strategy and Outlook
Ellex is entering a phase of rapid growth and, subject to A$ to US$ exchange rate and worldwide economic conditions, expects to achieve in FY16 a continuation of the revenue growth rates recently achieved
and to continue to improve profitability.
Beyond FY16, underlying industry growth is strong and 2RTTM, iTrack™ and SLT products provide transformational growth opportunities.
Slide 21
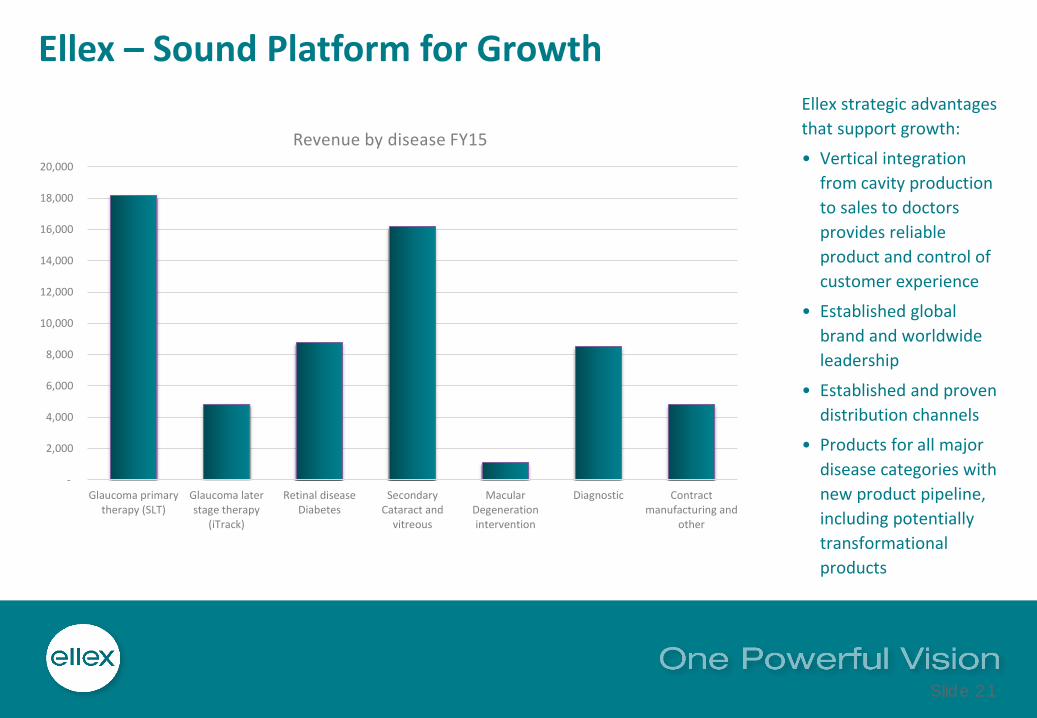
Ellex – Sound Platform for GrowthEllex strategic advantages
that support growth:
• Vertical integration
from cavity production
to sales to doctors
provides reliable
product and control of
customer experience
• Established global
brand and worldwide
leadership
• Established and proven
distribution channels
• Products for all major
disease categories with
new product pipeline,
including potentially
transformational
products
-
2,000
4,000
6,000
8,000
10,000
12,000
14,000
16,000
18,000
20,000
Glaucoma primarytherapy (SLT)
Glaucoma laterstage therapy
(iTrack)
Retinal diseaseDiabetes
SecondaryCataract and
vitreous
MacularDegenerationintervention
Diagnostic Contractmanufacturing and
other
Revenue by disease FY15

Slide 22
Growth Strategy FY16
Glaucoma –SLT (early
stage)
Glaucoma –iTrack (later
stage)
Early-Stage Macular
Degeneration
Retinal DiseaseDiabetes
Secondary Cataracts and
Vitreous floaters
Diagnostic Ultrasound
Cataract Manufacturing
and other
Strategic objective and growth plan
FY16
Increaseglobal
acceptance of SLT as primary
therapy for glaucoma,
particularly in Asia
Roll out iTrack™ ab-interno
procedure (5 to 10 minutes) to give access
to cataract surgeon market
First-to-marketdevice for
intervention in early AMD with
2RT™ with procedure fee for recurring revenue
with sales acceleration
expected in FY16
Produce best-in-class family of
photocoagulators (“Integre Pro™).
Integre Pro Scan™important new
product for FY16
Replace dominant
percentage of global
installed base of YAG lasers (circa 20,000 units) with
UltraQ Reflex™
Maintain leading
position in high
resolution ultrasound
market
Discontinue to free up
production and sales capacity
for higher margin Ellex
products
Market size –current
US$60m US$240m Not yet known US$305m US$65m
US$140m(1)
-
Market spend – on device and
pharma
US$4.6bn US$5.1bn US$1.5bnUS$3.3bn plus 24m cataract
operations-
(1) Persistance Market Research “Global Study in Ophthalmic Devices” 2014
Significant Growth Opportunities
Slide 23
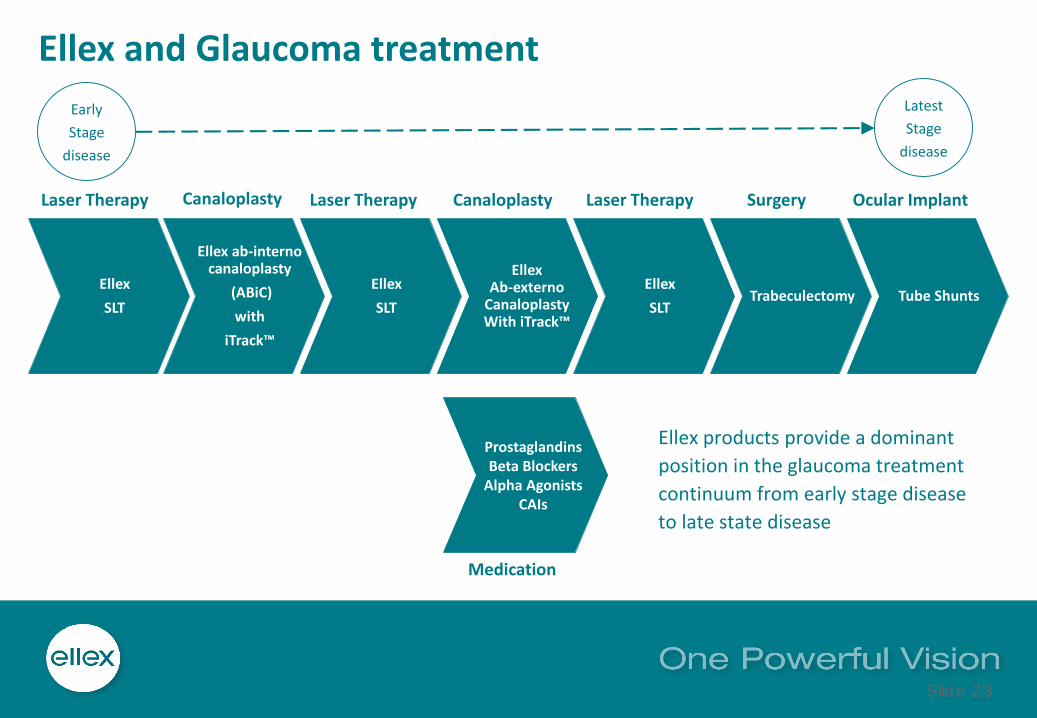
Ellex and Glaucoma treatment
Canaloplasty Surgery Ocular ImplantLaser Therapy Canaloplasty Laser TherapyLaser Therapy
Medication
Ellex
SLT
Ellex ab-internocanaloplasty
(ABiC)
with
iTrack™
Ellex
SLT
EllexAb-externo
CanaloplastyWith iTrack™
Ellex
SLTTrabeculectomy Tube Shunts
ProstaglandinsBeta Blockers
Alpha AgonistsCAIs
Early
Stage
disease
Latest
Stage
disease
Ellex products provide a dominant
position in the glaucoma treatment
continuum from early stage disease
to late state disease
Slide 24
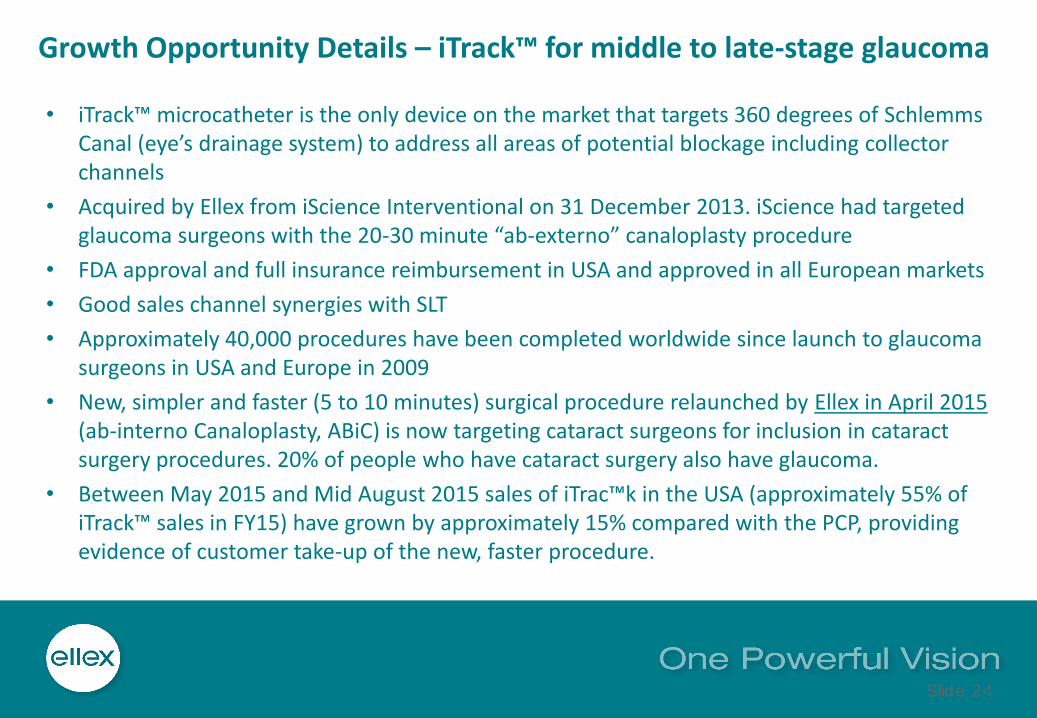
Growth Opportunity Details – iTrack™ for middle to late-stage glaucoma
• iTrack™ microcatheter is the only device on the market that targets 360 degrees of SchlemmsCanal (eye’s drainage system) to address all areas of potential blockage including collector channels
• Acquired by Ellex from iScience Interventional on 31 December 2013. iScience had targeted glaucoma surgeons with the 20-30 minute “ab-externo” canaloplasty procedure
• FDA approval and full insurance reimbursement in USA and approved in all European markets
• Good sales channel synergies with SLT
• Approximately 40,000 procedures have been completed worldwide since launch to glaucoma surgeons in USA and Europe in 2009
• New, simpler and faster (5 to 10 minutes) surgical procedure relaunched by Ellex in April 2015(ab-interno Canaloplasty, ABiC) is now targeting cataract surgeons for inclusion in cataract surgery procedures. 20% of people who have cataract surgery also have glaucoma.
• Between May 2015 and Mid August 2015 sales of iTrac™k in the USA (approximately 55% of iTrack™ sales in FY15) have grown by approximately 15% compared with the PCP, providing evidence of customer take-up of the new, faster procedure.

Slide 25
Growth Opportunity Details – 2RT intervention for Early AMD: Milestones Achieved2RT™ Retinal Rejuvenation therapy is a novel, nano-pulse laser for the retina. The interaction of the very short pulse with the retina stimulates rejuvenation of ageing cells.
Date Progress so far
2008 - 2010First clinical pilot study of 2RT™ (“the Pilot Study”) on 50 patients as intervention for early AMD by Professor Robyn Guymer at Centre of Eye Research Australia (CERA) commences. Also work on 2RT™ for clinically significant macular edema commences. Scientific work at University of Melbourne and Hanson Institute also begins based on original work by Prof. John Marshall at Moorfields Eye Hospital, London.
May 2011 Interim 12-month results from the Pilot Study presented at Association of Research in Vision and Ophthalmology (ARVO) conference.
July 2012 CE Mark for 2RT™ obtained for treatment of clinically significant macular edema (CSME).
November 2012“Laser Intervention in Early AMD” (LEAD) randomised, double-blind clinical trial commences recruitment. Principal Investigator Professor Robyn Guymer. AMD is a very slow progressing disease so three-year follow-up determined as necessary.
July 2013 US FDA approval for 2RT™ for treatment of CSME obtained.
October 2013Results of the Pilot Study on the progress of 50 patients who received a 2RT™ dose published in peer-reviewed journal “Clinical and Experimental Ophthalmology”.
February 2014CE Mark for 2RT™ as intervention in patients with early AMD, where it can produce bilateral improvements in macular appearance and function, obtained. Limited release Early Adopter Program commences with first unit sales following thereafter.
May 2014 24-month results of the Pilot Study presented at ARVO conference.
February 2015Scientific work on the method of action of 2RT™ by Professor Erica Fletcher published in peer-review publication Federation of American Societies for Experimental Biology under title “Nanosecond Laser Burst Reverses Macular Degeneration”. This work included human histology.
April 2015LEAD trial recruitment complete with 291 patients; approximately 145 patients in control group and approximately 145 patients in treatedgroup.
July 2015 Professor Erica Fletcher awarded ARC Grant to advance work on 2RT™ method of action.

Slide 26
Growth Opportunity Details – 2RT Intervention for Early AMD: Future Milestones
Date Future Milestones
Mid September 2015
First case studies to be released by Ellex on outcomes for patients treated by doctors who have purchased 2RT™ under the Early Adopter Program. This will provide first general clinical results of 2RT™ intervention outside a clinical trial setting. To be released at the European Society of Cataract and refractive Surgeons (ESCRS) meeting and EURETINA meetings.
Mid September 2015 Commercial release of 2RT™ at ESCRS in Barcelona, Spain
April 2016
Interim report from LEAD Clinical Trial as of 18 months from the recruitment of the 150th patient (recruited July 2014). This interim report will reveal if there is any difference in disease progression between the patients in the control group (that represent the natural disease progression state) and the patients that received the 2RT™ dose. As the trial will still be blinded the report will not show which group is control and which group is the treated group.
April 2018 Final result from LEAD on 3 year follow up

Slide 27
Growth Opportunity Details – 2RT™ Intervention for Early AMD -Summary
• 2RT™ is an intervention for a chronic, slowly-progressing disease that is terrible for patients and a major burden on health care systems globally
• Solid scientific and clinical data to demonstrate its efficacy is progressing
• In place brand and distribution channel to exploit the opportunity
• As clinical data demonstrates efficacy, 2RT™ has the potential to transform Ellex and AMD treatment worldwide.

Slide 28
Growth Opportunity Detail – Geographical expansion of SLT as Primary Therapy for Glaucoma• SLT penetration as primary therapy for treatment of glaucoma varies around the world
• There is a significant opportunity in all geographies to improve the penetration of SLT as a primary therapy for glaucoma treatment with marketing, doctor training and education as shown in the following table:
• In addition in China alone, MarketScope estimates that there are 19 million people with Glaucoma. A key initiative for Ellex is marketing, training and education to improve SLT penetration.
Ellex Revenue from SLT/100,000 patients with glaucoma in the regional population
Australia $7,000
USA $2,000
Western Europe and Japan $1,000
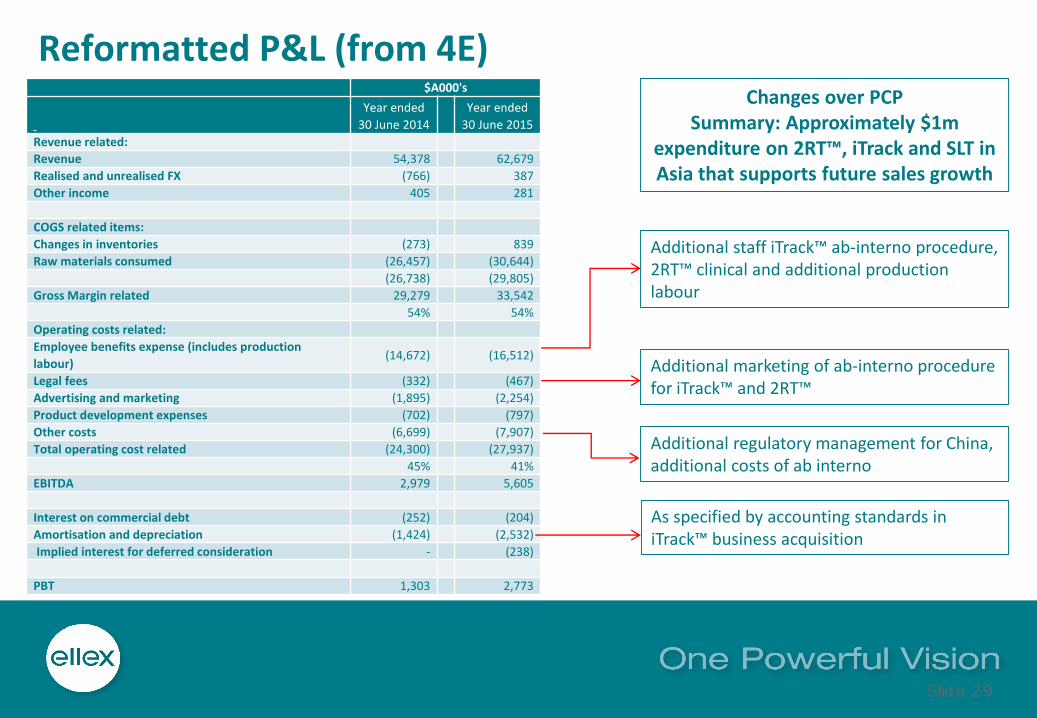
Slide 29
$A000's
Year ended
30 June 2014
Year ended
30 June 2015
Revenue related:
Revenue 54,378 62,679
Realised and unrealised FX (766) 387
Other income 405 281
COGS related items:
Changes in inventories (273) 839
Raw materials consumed (26,457) (30,644)
(26,738) (29,805)
Gross Margin related 29,279 33,542
54% 54%
Operating costs related:
Employee benefits expense (includes production
labour)(14,672) (16,512)
Legal fees (332) (467)
Advertising and marketing (1,895) (2,254)
Product development expenses (702) (797)
Other costs (6,699) (7,907)
Total operating cost related (24,300) (27,937)
45% 41%
EBITDA 2,979 5,605
Interest on commercial debt (252) (204)
Amortisation and depreciation (1,424) (2,532)
Implied interest for deferred consideration - (238)
PBT 1,303 2,773
Reformatted P&L (from 4E)
Additional staff iTrack™ ab-interno procedure, 2RT™ clinical and additional production labour
Additional marketing of ab-interno procedure for iTrack™ and 2RT™
Additional regulatory management for China, additional costs of ab interno
Changes over PCPSummary: Approximately $1m
expenditure on 2RT™, iTrack and SLT in Asia that supports future sales growth
As specified by accounting standards in iTrack™ business acquisition
Slide 30
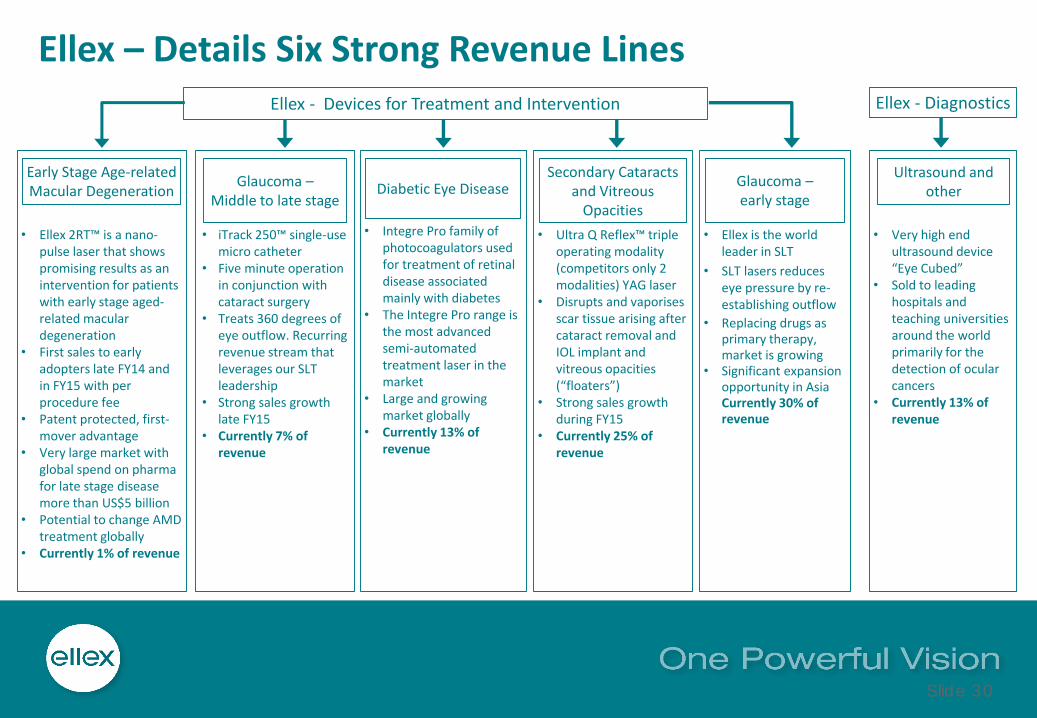
Ellex – Details Six Strong Revenue LinesEllex - DiagnosticsEllex - Devices for Treatment and Intervention
• Ellex is the world leader in SLT
• SLT lasers reduces eye pressure by re-establishing outflow
• Replacing drugs as primary therapy, market is growing
• Significant expansion opportunity in Asia Currently 30% of revenue
Glaucoma –early stage
• iTrack 250™ single-use micro catheter
• Five minute operation in conjunction with cataract surgery
• Treats 360 degrees of eye outflow. Recurring revenue stream that leverages our SLT leadership
• Strong sales growth late FY15
• Currently 7% of revenue
Glaucoma –Middle to late stage
• Ellex 2RT™ is a nano-pulse laser that shows promising results as an intervention for patients with early stage aged-related macular degeneration
• First sales to early adopters late FY14 and in FY15 with per procedure fee
• Patent protected, first-mover advantage
• Very large market with global spend on pharma for late stage disease more than US$5 billion
• Potential to change AMD treatment globally
• Currently 1% of revenue
Early Stage Age-related Macular Degeneration
• Integre Pro family of photocoagulators used for treatment of retinal disease associated mainly with diabetes
• The Integre Pro range is the most advanced semi-automated treatment laser in the market
• Large and growing market globally
• Currently 13% of revenue
Diabetic Eye Disease
• Ultra Q Reflex™ triple operating modality (competitors only 2 modalities) YAG laser
• Disrupts and vaporises scar tissue arising after cataract removal and IOL implant and vitreous opacities (“floaters”)
• Strong sales growth during FY15
• Currently 25% of revenue
Secondary Cataracts and Vitreous
Opacities
• Very high end ultrasound device “Eye Cubed”
• Sold to leading hospitals and teaching universities around the world primarily for the detection of ocular cancers
• Currently 13% of revenue
Ultrasound and other
Slide 31
END