title focal macular electroretinogram in macular edema
TRANSCRIPT

Title Focal Macular Electroretinogram in Macular Edema Secondaryto Central Retinal Vein Occlusion( Dissertation_全文 )
Author(s) Ogino, Ken
Citation 京都大学
Issue Date 2015-03-23
URL https://doi.org/10.14989/doctor.r12917
Right
Type Thesis or Dissertation
Textversion ETD
Kyoto University

Focal Macular Electroretinogram in Macular EdemaSecondary to Central Retinal Vein Occlusion
Ken Ogino, Akitaka Tsujikawa, Hajime Nakamura, Kazuaki Miyamoto,Tomoaki Murakami, Yuki Muraoka, Yumiko Kurashige, and Nagahisa Yoshimura
PURPOSE. To evaluate the usefulness of focal macular electro-retinography (fmERG) for evaluation of macular function ineyes with central retinal vein occlusion (CRVO).
METHODS. fmERG recordings were made prospectively in 24patients with unilateral CRVO. The amplitudes and latencies ofthe a-wave, b-wave, and photopic negative response (PhNR)were compared with other biological parameters, includingvisual acuity (VA), retinal sensitivity measured with a micrope-rimeter, and optical coherence tomography.
RESULTS. In eyes affected by CRVO, amplitudes of the a-wave,b-wave, and PhNR were reduced significantly, and latencieswere prolonged significantly compared with those of healthyfellow eyes (P � 0.001). Relative amplitudes (affected eye/fellow eye) of each wave showed a cross correlation with VA.Furthermore, both relative amplitudes and latencies of eachwave tended to correlate with retinal sensitivity within themacular area. Central foveal thickness showed a correlationwith both relative amplitude and relative latency. Among allparameters, relative amplitude of the PhNR correlated moststrongly with central foveal thickness (r � �0.598, P �0.0042). In addition, sensory retinal thickness showed a corre-lation with relative latencies, and height of the retinal detach-ment (when present) showed a correlation with relative am-plitudes. In ischemic CRVO, relative amplitudes were reducedmore severely than were those in nonischemic CRVO.
CONCLUSIONS. In eyes with CRVO, amplitudes and latencies ofthe fmERG correlated with other biological parameters. Basedon the present study, fmERG appears to be useful for theexamination of the macular edema that accompanies CRVO.(Invest Ophthalmol Vis Sci. 2011;52:3514–3520) DOI:10.1167/iovs.10-7142
Macular edema (ME) is one of the most vision-threateningcomplications associated with central retinal vein occlu-
sion (CRVO).1,2 Generally, the severity of the ME has beenevaluated by using optical coherence tomography (OCT) forthe quantitative measurement of foveal thickness. In addition,recent advances in the technology of OCT have revealed thepathomorphology of ME that is associated with CRVO, includ-ing the location of each cystoid space, the frequent presence ofa serous retinal detachment, and the usefulness of the junctionbetween the inner and outer segments of the foveal photore-
ceptor layer as a hallmark of the integrity of the outer retina.3–6
As a functional parameter in eyes with ME associated withCRVO, we typically use visual acuity (VA), which primarilyreflects foveal function. However, ME usually involves thelarger macular area. To evaluate the severity of ME and itsresponse to treatment, it is essential to establish another func-tional examination that reflects not only the fovea but also thelarger macular area.7
Electroretinography (ERG) is used widely to evaluate thefunction of the retina. In eyes with CRVO, many reports haveshown that full-field (ff)ERG is useful in predicting the devel-opment of neovascular glaucoma.8–14 Recently, Chen et al.15
reported that the amplitude of the photopic negative response(PhNR), which is a negative wave that follows the b-wave, wasmarkedly more reduced than were other components in eyeswith retinal vein occlusion. Because PhNR in the photopic ERGis reported to reflect inner retinal function,16–19 PhNR may bean ideal parameter with which to evaluate retinal function ineyes affected with CRVO, in which the inner retina is theportion of the retina that is most affected.17–19
In contrast to the ffERG, the focal macular (fm)ERG allowsexamination of the retinal function only within the maculararea. In eyes with diabetic macular edema, Terasaki et al.20
demonstrated a correlation between the functional changesdetected by fmERG and foveal thickness. So far, however, littleis known about macular function examined by fmERG in eyeswith CRVO. We hypothesized that fmERG would enable us toevaluate more effectively the macular function in eyes with MEsecondary to CRVO. In the study described herein, we exam-ined the correlation of fmERG with other biological parametersin eyes with ME secondary to CRVO, to evaluate the usefulnessof fmERG, especially PhNR and better define macular functionin these eyes.
PATIENTS AND METHODS
This prospective study consisted of 24 patients with ME secondary tountreated unilateral CRVO who were examined at Kyoto UniversityHospital between May 2009 and August 2010. Patients with co-existingocular disease (i.e., epiretinal membrane, glaucoma, proliferative dia-betic retinopathy, or senile cataract) that resulted in poor quality OCTimages and fmERG in either eye were excluded from the present study.Eyes with hemi-CRVO were also excluded from the present study. Thediagnosis of CRVO was based on the fundus examination and fluores-cein angiography findings of two retina specialists (AT, TM). At theinitial visit, after the medical history was obtained, each patient had acomplete examination, including best corrected VA measurement, slitlamp biomicroscopy, indirect fundus ophthalmoscopy, fluorescein an-giography, OCT, microperimetry, and fmERG.
Best corrected VA was measured with a Landolt chart and wasconverted to logarithm of the minimum angle of resolution (logMAR).Fluorescein angiography was performed on each patient with a con-focal laser scanning system (HRA-2; Heidelberg Engineering, Heidel-berg, Germany). Eyes with CRVO were judged to be ischemic when
From the Department of Ophthalmology and Visual Sciences,Kyoto University Graduate School of Medicine, Kyoto, Japan.
Submitted for publication December 25, 2010; revised February 7and 16, 2011; accepted February 16, 2011.
Disclosure: K Ogino, None; A Tsujikawa, None; H Nakamura,None; K Miyamoto, None; T Murakami, None; Y Muraoka, None; YKurashige, None; N Yoshimura, None
Corresponding author: Akitaka Tsujikawa, Department of Oph-thalmology, Kyoto University Graduate School of Medicine, Sakyo-ku,Kyoto 606-8507, Japan; [email protected].
Retina
Investigative Ophthalmology & Visual Science, May 2011, Vol. 52, No. 63514 Copyright 2011 The Association for Research in Vision and Ophthalmology, Inc.

initial fluorescein angiography revealed more than 10 disc areas ofnonperfusion. All patients were examined by spectral domain-opticalcoherence tomography (Spectralis OCT; Heidelberg Engineering). Us-ing these images obtained at the initial visit, we performed threemeasurements in the fovea, including the center point thickness (CPT),height of the retinal detachment (HRD), and sensory retinal thickness(SRT). CPT was defined as the distance between the internal limitingmembrane and the retinal pigment epithelium (RPE) at the center ofthe fovea; HRD was defined as the distance between the RPE and thebottom of the detached neurosensory retina just beneath the fovea.SRT was calculated by subtracting the HRD from the CPT.
In 17 eyes with CRVO, fundus-monitored microperimetry was per-formed (MP1; Nidek, Gamagori, Japan). The software for this systemcontains an automatic tracking system for fundus movements thatevaluates every acquired frame for shifts in the x- and y-directions ofthe fundus with respect to a reference frame obtained by an infraredcamera at the start of the examination. A 4-2-staircase strategy withGoldmann III size stimulus was used, and 57 stimulus locations thatcovered the central 10° were examined by microperimetry. Each
stimulus is located according to the measurement points used inHumphrey 10-2, with some additional points. The white backgroundillumination was set at 1.27 cd/m2. The differential luminance, definedas the difference between stimulus luminance and background lumi-nance, was 127 cd/m2 at 0 dB stimulation, and the maximum stimulusattenuation was 20 dB. The duration of the stimulus was 200 ms, andthe fixation target varied in size (a 2° cross for central fixation and a 4°or 6° cross for paracentral fixation) according to the VA of the patient.The 5, 17, 29, 37, and 57 measurement points were assigned within thecentral 2°, 4°, 6°, 8°, and 10° areas (Fig. 1).
For fmERG recording, the pupils of both eyes were dilated with0.5% tropicamide and 0.5% phenylephrine hydrochloride. After thepupils were maximally dilated, a Burian-Allen bipolar contact lenselectrode (Hansen Ophthalmic Laboratories, Iowa City, IA) was placedin the conjunctival sac while the eye was under topical anesthesiainduced by 0.4% oxybuprocaine. A chloride silver electrode was at-tached to the left earlobe as a ground electrode. The fmERG waselicited by 15° circular stimuli positioned on the fovea (Fig. 2). ThefmERG system used in this study was the prototype of the ER-80(Kowa, Tokyo, Japan). It was composed of an infrared camera (Kowa)and a stimulation system (Mayo Co., Nagoya, Japan). The luminances ofwhite stimulus light and background illumination were 181.5 and 6.9cd/m2, respectively. A background field of 45° visual angle was pro-jected to the eye from the fundus camera. The fmERG was recordedwith 2-Hz rectangular stimuli (150 ms with the light on and 350 mswith the light off). The 15° circular stimulus was carefully and con-stantly centered on the fovea, as observed through the infrared camera.The affected eyes were examined before the fellow eyes. The record-ing (100–150 responses) was made twice to confirm reproducibility,and a total of 200 to 300 responses were averaged by the signalprocessor (Neuropack MEB-2204; Nihon Kohden, Tokyo, Japan). ThefmERG response was digitized at 10 kHz with a band-pass filter of 5 to500 Hz for the a-wave, b-wave, and photopic negative response, and at50 to 500 Hz for oscillatory potentials (OPs). The amplitudes of thea-wave, b-wave, and PhNR were measured, respectively, from thebaseline to the peak of the a-wave, from the trough of the a-wave tothe peak of the b-wave, and from the peak of the b-wave to the troughof the PhNR (Fig. 2). Latencies were defined as the time from thebeginning of the stimuli to the peak of each component.
The amplitudes and latencies of the a-wave, b-wave, and PhNRwere compared between the affected eye and the fellow eye with apaired t-test. To compare the fmERG parameters with other measure-ment values, we converted to the relative amplitude and latency(affected eye/fellow eye) and calculated the Pearson correlation coef-ficient. Because PhNR is a slow wave and does not have a sharp peakin eyes with decreased function due to CRVO, the relative latency ofPhNR was not compared with the values obtained by others. Thedifference between ischemic and nonischemic cases was shown by an
FIGURE 1. A total of 57 locations covering the central 10° wereexamined with microperimetry. Five measurement points were lo-cated within the central 2° of the macula, 17 were located within thecentral 4°, 29 were located within the central 6°, and 37 points werelocated within the central 8°.
FIGURE 2. (A) Area of macular stimulation. The fmERG was elicited by 15° circular stimuli positioned onthe fovea. (B) fmERG obtained from a normal fellow eye. A total of 200 to 300 responses were averagedby a signal processor. Black arrowhead: the beginning of the stimuli; red arrows: amplitudes of eachwave; blue arrows: latencies of each wave.
IOVS, May 2011, Vol. 52, No. 6 Focal Macular ERG in Eyes with CRVO 3515
unpaired t-test. P � 0.05 was considered to be statistically significant(PASW Statistics, version 17.0; SPSS, Chicago, IL).
RESULTS
In the present study, we examined 24 eyes with CRVO and 24healthy fellow eyes of 24 patients (15 men and 9 women) whoranged in age from 35 to 80 years (mean, 67.2 � 13.0). Themedian duration of symptoms was 1 month (range, 0.5–12). Atthe initial visit, VA in logMAR fashion was 0.62 � 0.47 in theaffected eyes and �0.07 � 0.12 in the healthy fellow eyes. Allaffected eyes had ME with cystoid spaces at the fovea, in whichmean CPT was 771 � 281 �m. Eighteen (75%) of the 24 eyeshad a serous retinal detachment, the mean HRD of these being218 � 215 �m. The SRT was 610 � 180 �m. In the felloweyes, OCT showed a physiologic shape of the fovea and a meanCPT of 223 � 25 �m.
Of the 24 affected eyes, reliable fmERG recordings could beobtained from 22 (92%). In two eyes, a reliable fmERG couldnot be obtained because of low reproducibility or a slantedbaseline. Of the remaining 22 eyes, a flat ERG was recorded in2 (9%) and OPs were diminished in 14 (64%). None of ourpatients noted any eye pain or loss of vision after the fmERGrecording. Amplitudes in the 20 eyes with reliable ERGs (ex-cept for the 2 eyes with flat ERGs) were used for the statisticalanalysis.
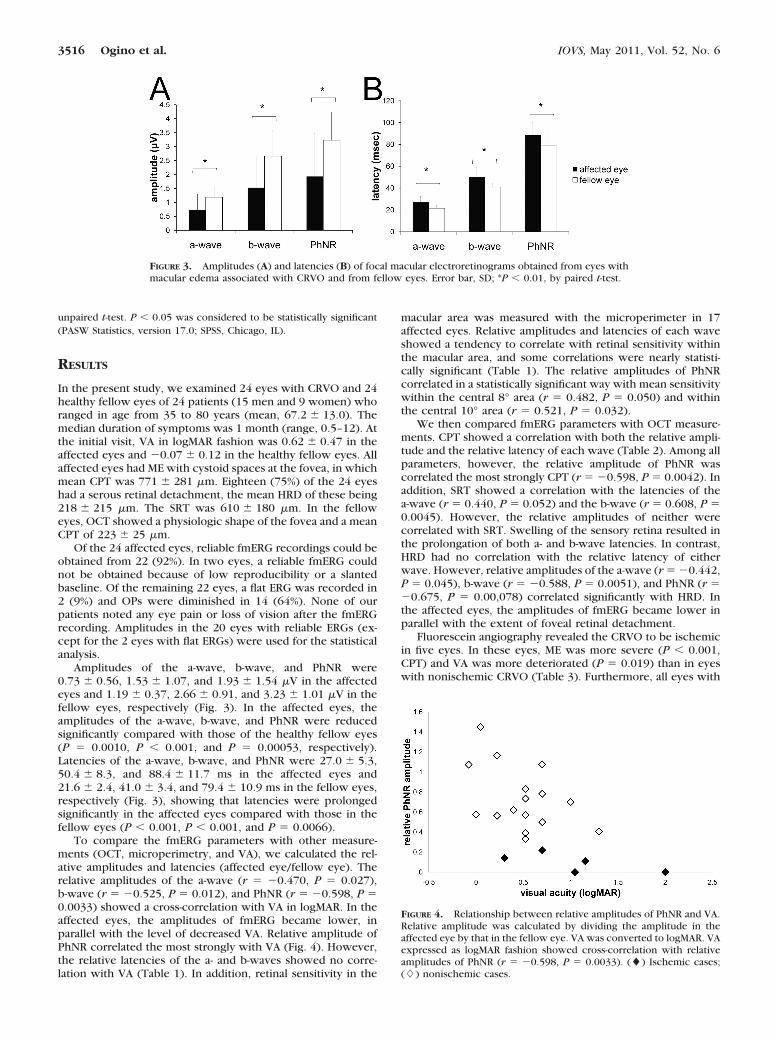
Amplitudes of the a-wave, b-wave, and PhNR were0.73 � 0.56, 1.53 � 1.07, and 1.93 � 1.54 �V in the affectedeyes and 1.19 � 0.37, 2.66 � 0.91, and 3.23 � 1.01 �V in thefellow eyes, respectively (Fig. 3). In the affected eyes, theamplitudes of the a-wave, b-wave, and PhNR were reducedsignificantly compared with those of the healthy fellow eyes(P � 0.0010, P � 0.001, and P � 0.00053, respectively).Latencies of the a-wave, b-wave, and PhNR were 27.0 � 5.3,50.4 � 8.3, and 88.4 � 11.7 ms in the affected eyes and21.6 � 2.4, 41.0 � 3.4, and 79.4 � 10.9 ms in the fellow eyes,respectively (Fig. 3), showing that latencies were prolongedsignificantly in the affected eyes compared with those in thefellow eyes (P � 0.001, P � 0.001, and P � 0.0066).
To compare the fmERG parameters with other measure-ments (OCT, microperimetry, and VA), we calculated the rel-ative amplitudes and latencies (affected eye/fellow eye). Therelative amplitudes of the a-wave (r � �0.470, P � 0.027),b-wave (r � �0.525, P � 0.012), and PhNR (r � �0.598, P �0.0033) showed a cross-correlation with VA in logMAR. In theaffected eyes, the amplitudes of fmERG became lower, inparallel with the level of decreased VA. Relative amplitude ofPhNR correlated the most strongly with VA (Fig. 4). However,the relative latencies of the a- and b-waves showed no corre-lation with VA (Table 1). In addition, retinal sensitivity in the
macular area was measured with the microperimeter in 17affected eyes. Relative amplitudes and latencies of each waveshowed a tendency to correlate with retinal sensitivity withinthe macular area, and some correlations were nearly statisti-cally significant (Table 1). The relative amplitudes of PhNRcorrelated in a statistically significant way with mean sensitivitywithin the central 8° area (r � 0.482, P � 0.050) and withinthe central 10° area (r � 0.521, P � 0.032).
We then compared fmERG parameters with OCT measure-ments. CPT showed a correlation with both the relative ampli-tude and the relative latency of each wave (Table 2). Among allparameters, however, the relative amplitude of PhNR wascorrelated the most strongly CPT (r � �0.598, P � 0.0042). Inaddition, SRT showed a correlation with the latencies of thea-wave (r � 0.440, P � 0.052) and the b-wave (r � 0.608, P �0.0045). However, the relative amplitudes of neither werecorrelated with SRT. Swelling of the sensory retina resulted inthe prolongation of both a- and b-wave latencies. In contrast,HRD had no correlation with the relative latency of eitherwave. However, relative amplitudes of the a-wave (r � �0.442,P � 0.045), b-wave (r � �0.588, P � 0.0051), and PhNR (r ��0.675, P � 0.00,078) correlated significantly with HRD. Inthe affected eyes, the amplitudes of fmERG became lower inparallel with the extent of foveal retinal detachment.
Fluorescein angiography revealed the CRVO to be ischemicin five eyes. In these eyes, ME was more severe (P � 0.001,CPT) and VA was more deteriorated (P � 0.019) than in eyeswith nonischemic CRVO (Table 3). Furthermore, all eyes with
FIGURE 3. Amplitudes (A) and latencies (B) of focal macular electroretinograms obtained from eyes withmacular edema associated with CRVO and from fellow eyes. Error bar, SD; *P � 0.01, by paired t-test.
FIGURE 4. Relationship between relative amplitudes of PhNR and VA.Relative amplitude was calculated by dividing the amplitude in theaffected eye by that in the fellow eye. VA was converted to logMAR. VAexpressed as logMAR fashion showed cross-correlation with relativeamplitudes of PhNR (r � �0.598, P � 0.0033). (�) Ischemic cases;(�) nonischemic cases.
3516 Ogino et al. IOVS, May 2011, Vol. 52, No. 6

ischemic CRVO showed a serous retinal detachment beneaththe fovea. HRD was greater with ischemic CRVO (486 � 274�m) than with nonischemic CRVO (96 � 115 �m; P � 0.001).In ischemic eyes, the relative amplitudes of the a-wave (P �0.041), b-wave (P � 0.0040), and PhNR (P � 0.001) werereduced more severely than in the nonischemic eyes, althoughPhNR was the most severely affected (Fig. 3). Of the 24 af-fected eyes, a flat ERG was recorded in two. Both of these eyesshowed severe ischemic CRVO with a VA of less than 0.1 on aLandolt chart (20/200 on a Snellen chart).
Representative Cases
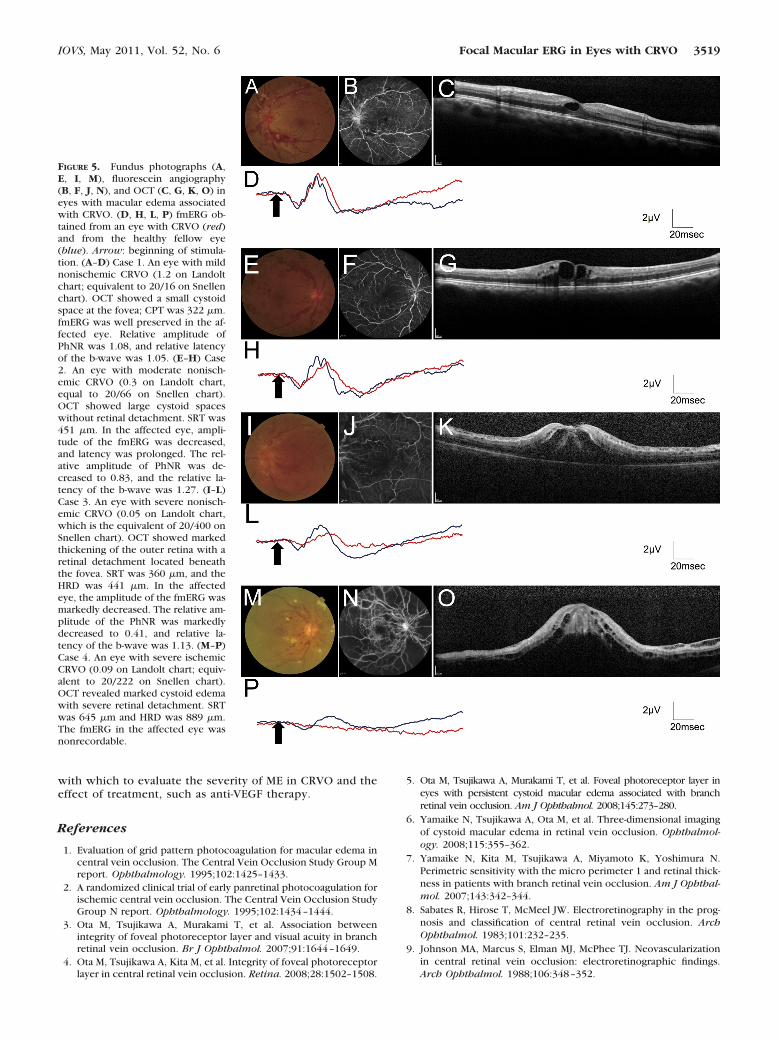
Case 1. A 39-year-old man had a 1-month history of blurredvision in the left eye (1.2 on the Landolt chart, which isequivalent to 20/16 on a Snellen chart), and a retinal hemor-rhage characteristic of CRVO was seen. Fluorescein angiogra-phy showed small areas of nonperfusion, and OCT revealed asmall cystoid space at the fovea; SRT was 322 �m. FmERG waswell preserved in the affected eye. The relative amplitude ofPhNR was 1.08 and the relative latency of the b-wave was 1.05(Fig. 5).
Case 2. A 76-year-old woman had a 1-month history ofdecreased vision in the right eye (0.3 on the Landolt chart,equivalent to 20/66 on a Snellen chart), and an extensiveretinal hemorrhage associated with CRVO was seen. Fluores-cein angiography showed only a minimal area of nonperfusion,and OCT revealed large cystoid spaces with no retinal detach-ment. SRT was 451 �m. In the affected eye, amplitude of thefmERG was decreased and latency was prolonged. The relativeamplitude of PhNR was decreased to 0.83, and relative latencyof the b-wave was 1.27 (Fig. 5).
Case 3. A 73-year-old man had a 2-week history of se-verely decreased VA in the left eye (0.05 on a Landolt chart;equivalent to 20/400 on a Snellen chart). At the initial visit,an extensive retinal hemorrhage and many cotton woolspots associated with CRVO were seen. OCT showed thick-ening of the outer retina with a retinal detachment beneaththe fovea. In the affected eye, SRT was 360 �m and HRD was441 �m, and the amplitude of the fmERG was markedly
decreased. The relative amplitude of PhNR was also mark-edly decreased (to 0.41), and the relative latency of theb-wave was 1.13 (Fig. 5).
Case 4. A 65-year-old man had a 2-week history of severevisual impairment in the right eye (0.09 on a Landolt chart,which is equal to 20/222 on a Snellen chart), and a retinalhemorrhage with numerous cotton wool spots associatedwith CRVO was seen. Fluorescein angiography showed ex-tensive areas of nonperfusion, and OCT revealed markedcystoid edema with severe retinal detachment. SRT was 645�m and HRD was 889 �m; fmERG in this eye was nonre-cordable (Fig. 5).
DISCUSSION
Despite various treatments, ME secondary to CRVO often re-sults in severely impaired visual function. A number of inves-tigators have recently reported the efficacy of antivascularendothelial growth factor therapy for this condition,21–23 butto evaluate the effectiveness of this treatment, most studieshave used a change in both VA and retinal thickness as mea-sured by OCT.24 However, VA reflects only foveal function,whereas the ME secondary to CRVO usually involves the largermacular area. To evaluate the efficacy of treatment for ME, it isessential that another functional examination that reflects thelarger macular area be established.7 Recently, Yamaike et al.7
reported the retinal sensitivity as examined with a microperim-eter (MP1; Nidek) in the macular area of eyes with branchretinal vein occlusion. The MP1 software contains an automatictracking system for fundus movements that evaluates everyacquired frame for shifts in the x- and y-directions of thefundus. In their report, retinal sensitivity in the macular areacorrelated closely with retinal thickness. The fmERG providesaccurate stimulation of the macula while monitoring the mac-ula through the infrared fundus camera.25 We hypothesizedthat fmERG may be useful for examination of macular functionin eyes with CRVO.
The fmERG system, which was developed by Miyake etal,26–28 has been commercially available since 2008. With the
TABLE 1. Comparison of Parameters in the fmERG with VA and Retinal Sensitivity Obtained by Microperimetry
Mean Retinal Sensitivity
Visual Acuity(logMAR) Within 2° Area Within 4° Area Within 6° Area Within 8° Area Within 10° Area
r P r P r P r P r P r P
Relative a-wave amplitude �0.470 0.027 0.395 0.117 0.412 0.100 0.412 0.100 0.417 0.096 0.444 0.074Relative b-wave amplitude �0.525 0.012 0.459 0.064 0.367 0.147 0.374 0.139 0.394 0.118 0.422 0.092Relative PhNR amplitude �0.598 0.0033 0.474 0.055 0.427 0.087 0.454 0.067 0.482 0.050 0.521 0.032Relative a-wave latency 0.203 0.391 �0.500 0.058 �0.416 0.123 �0.420 0.119 �0.423 0.116 �0.398 0.142Relative b-wave latency 0.260 0.268 �0.496 0.060 �0.455 0.088 �0.461 0.084 �0.460 0.084 �0.448 0.094
TABLE 2. Comparison of fmERG with Foveal Measurements Obtained with OCT
CPT SRT HRD
r P r P r P
Relative a-wave amplitude �0.447 0.042 �0.196 0.395 �0.442 0.045Relative b-wave amplitude �0.497 0.022 �0.101 0.665 �0.588 0.0051Relative PhNR amplitude �0.598 0.0042 �0.160 0.487 �0.675 0.00078Relative a-wave latency 0.473 0.035 0.440 0.052 0.225 0.341Relative b-wave latency 0.678 0.0010 0.608 0.0045 0.353 0.127
Data are the Pearson correlation coefficient.
IOVS, May 2011, Vol. 52, No. 6 Focal Macular ERG in Eyes with CRVO 3517

use of fmERG, Machida et al.29 reported the usefulness of focalmacular PhNR in the evaluation of glaucoma, in which theganglion cells are primarily the cells that are damaged. PhNR,which is a negative wave that follows the b-wave, is reportedto reflect inner retinal function. Because CRVO causes damageprimarily within the inner retina, PhNR may well be a usefulparameter in evaluating the function of the inner retina.17–19
Using various stimulus durations on monkeys, Kondo et al.30
reported the characteristics of PhNR obtained by both briefand long flashes. In agreement with their report, our prelimi-nary experience with CRVO showed that PhNR obtained by along flash (150 ms) was larger and slower than that obtained bya brief flash (3 ms). Based on this previous report and on ourpreliminary data, we evaluated macular function in CRVO bymeasuring fmERG, with emphasis on PhNR obtained by a long(150-ms) flash.
In our patients with ME secondary to CRVO, both theamplitudes and the latencies of all components of the fmERGreflected the decreased macular function. However, it has beennoted that the amplitudes and latencies have some varianceeven among normal subjects. To compare the fmERG measure-ments with other parameters, we used the relative amplitudesand latencies (affected eye/fellow eye). In macular pseudohole,Suzuki et al.31 reported a correlation between VA and relativeb-wave amplitudes in fmERG, and a correlation between retinalthickness and these relative b-wave amplitudes. In the presentstudy, we found similar correlations in eyes with CRVO. How-ever, some changes in the fmERG may be characteristic of thedisease, so it may be necessary to accumulate data on eachdisease.
In the present study, foveal thickness (CPT) showed acorrelation with both the relative amplitude and the relativelatency of each wave. In addition, relative amplitude correlatedwith HRD, but not with SRT. Therefore, the correlation of HRDwould contribute primarily to the correlation of CPT withrelative amplitude. Similarly, because relative latency corre-lated with SRT, but not with HRD, the correlation of CPT withrelative latency could be explained by the correlation of HRD.We do not know exactly how ME affects visual function.Murakami et al.32 indicated that obtaining good VA requires anintact foveal photoreceptor layer in acute branch retinal veinocclusion. ME with acute CRVO frequently accompanies se-rous detachment.33 Our finding suggest that subretinal fluidaccumulation within the macula may impair macular function,depending on the height of the detachment. In addition, pro-longed latency may be explained by the delay in conductionfrom the first to the next neuron, depending on the increasedretinal thickness due to CRVO.
From the fmERG recordings, we can obtain the a-wave,b-wave, and PhNR, although it is not yet known which wavemost effectively reflects macular function. Among these three
waves, the amplitudes of PhNR correlated more closely withVA and HRD, but only the PhNR amplitude showed a signifi-cant correlation with retinal sensitivity by the use of micrope-rimetry (MP1; Nidek). Because the amplitude of the a-wave wassmaller than that of the b-wave or of PhNR, the signal-to-noiseratio in the a-wave may have been greater. Because CRVOcauses damage primarily within the inner retina, PhNR, whichoriginates from ganglion cells, may be a useful parameter withwhich to evaluate macular function in CRVO. However, thefmERG showed the most marked change in the amplitude ofPhNR in CRVO. PhNR is a slow wave and does not have a sharppeak, especially in eyes with decreased function due to CRVO,so, when using the latency of fmERG to evaluate macularfunction in CRVO, the latency of the b-wave might be moreappropriate.
Neovascularization is such a severe complication of CRVOthat many previous investigators have reported its predictivefactors. The latency of the 30-Hz flicker in ffERG is reported tobe useful in predicting the occurrence of new vessels inCRVO.13,14,34,35 In our patients, we encountered five eyes withischemic CRVO that showed no new vessels on fluoresceinangiography. These eyes had lower amplitudes, particularly inPhNR, which represents inner retinal dysfunction. PhNR maythus be a predictor of neovascularization in eyes with CRVO.However, the present study was cross-sectional, and it is nec-essary to confirm in future studies the association of PhNR withthe development of new vessels.
Major limitations of the present study are its small samplesize and lack of control individuals. In the present study, weused a Landolt chart, which is based on an uneven spatialgradient scale, for the measurement of VA. A logMAR chart,such as an ETDRS chart, may allow us to obtain a morepowerful correlation of fmERG measurements with VA. Inaddition, because this was a cross-sectional study, it is nec-essary to perform a longitudinal study to better define therole of fmERG recordings in the prediction of visual prog-nosis and in the development of new vessels. However, thisis the first report of macular function in ME secondary toCRVO using the fmERG system and is also the first to com-pare the parameters of fmERG with other measurements,even though the statistical tests were not corrected for thenumber of comparisons. To establish fmERG as a morecommon examination, the conditions of recording must beimproved. The fmERG system at present requires the use ofa contact lens, and the patient being tested tends to feelsome stress. In the current setting, we demonstrated thatboth the amplitudes and the latencies of fmERG were de-creased markedly in CRVO and that they correlated with VAand with some OCT measurements. Based on the presentstudy, fmERG appears to be a useful functional examination
TABLE 3. Comparisons of OCT and fmERG Measurements between Ischemic and Nonischemic CRVO
Ischemic CRVO Nonischemic CRVO P
Number of eyes 5 17Age, y 68.0 � 12.7 67.0 � 13.5 0.88Gender, men/women 3/2 11/6 0.99Visual acuity, logMAR 1.04 � 0.63 0.49 � 0.35 0.019CPT, �m 1185 � 234 673 � 207 �0.001Eyes with retinal detachment, n 5 (100%) 11 (65%) 0.27SRT, �m 699 � 76 577 � 199 0.23HRD, �m 486 � 274 96 � 115 �0.001Relative a-wave amplitude 0.26 � 0.33 0.74 � 0.45 0.041Relative b-wave amplitude 0.22 � 0.28 0.69 � 0.29 0.0040Relative PhNR amplitude 0.09 � 0.09 0.73 � 0.31 �0.001Relative a-wave latency 1.49 � 0.21 1.24 � 0.27 0.148Relative b-wave latency 1.50 � 0.10 1.21 � 0.23 0.048
3518 Ogino et al. IOVS, May 2011, Vol. 52, No. 6
with which to evaluate the severity of ME in CRVO and theeffect of treatment, such as anti-VEGF therapy.
References
1. Evaluation of grid pattern photocoagulation for macular edema incentral vein occlusion. The Central Vein Occlusion Study Group Mreport. Ophthalmology. 1995;102:1425–1433.
2. A randomized clinical trial of early panretinal photocoagulation forischemic central vein occlusion. The Central Vein Occlusion StudyGroup N report. Ophthalmology. 1995;102:1434–1444.
3. Ota M, Tsujikawa A, Murakami T, et al. Association betweenintegrity of foveal photoreceptor layer and visual acuity in branchretinal vein occlusion. Br J Ophthalmol. 2007;91:1644–1649.
4. Ota M, Tsujikawa A, Kita M, et al. Integrity of foveal photoreceptorlayer in central retinal vein occlusion. Retina. 2008;28:1502–1508.
5. Ota M, Tsujikawa A, Murakami T, et al. Foveal photoreceptor layer ineyes with persistent cystoid macular edema associated with branchretinal vein occlusion. Am J Ophthalmol. 2008;145:273–280.
6. Yamaike N, Tsujikawa A, Ota M, et al. Three-dimensional imagingof cystoid macular edema in retinal vein occlusion. Ophthalmol-ogy. 2008;115:355–362.
7. Yamaike N, Kita M, Tsujikawa A, Miyamoto K, Yoshimura N.Perimetric sensitivity with the micro perimeter 1 and retinal thick-ness in patients with branch retinal vein occlusion. Am J Ophthal-mol. 2007;143:342–344.
8. Sabates R, Hirose T, McMeel JW. Electroretinography in the prog-nosis and classification of central retinal vein occlusion. ArchOphthalmol. 1983;101:232–235.
9. Johnson MA, Marcus S, Elman MJ, McPhee TJ. Neovascularizationin central retinal vein occlusion: electroretinographic findings.Arch Ophthalmol. 1988;106:348–352.
FIGURE 5. Fundus photographs (A,E, I, M), fluorescein angiography(B, F, J, N), and OCT (C, G, K, O) ineyes with macular edema associatedwith CRVO. (D, H, L, P) fmERG ob-tained from an eye with CRVO (red)and from the healthy fellow eye(blue). Arrow: beginning of stimula-tion. (A–D) Case 1. An eye with mildnonischemic CRVO (1.2 on Landoltchart; equivalent to 20/16 on Snellenchart). OCT showed a small cystoidspace at the fovea; CPT was 322 �m.fmERG was well preserved in the af-fected eye. Relative amplitude ofPhNR was 1.08, and relative latencyof the b-wave was 1.05. (E–H) Case2. An eye with moderate nonisch-emic CRVO (0.3 on Landolt chart,equal to 20/66 on Snellen chart).OCT showed large cystoid spaceswithout retinal detachment. SRT was451 �m. In the affected eye, ampli-tude of the fmERG was decreased,and latency was prolonged. The rel-ative amplitude of PhNR was de-creased to 0.83, and the relative la-tency of the b-wave was 1.27. (I–L)Case 3. An eye with severe nonisch-emic CRVO (0.05 on Landolt chart,which is the equivalent of 20/400 onSnellen chart). OCT showed markedthickening of the outer retina with aretinal detachment located beneaththe fovea. SRT was 360 �m, and theHRD was 441 �m. In the affectedeye, the amplitude of the fmERG wasmarkedly decreased. The relative am-plitude of the PhNR was markedlydecreased to 0.41, and relative la-tency of the b-wave was 1.13. (M–P)Case 4. An eye with severe ischemicCRVO (0.09 on Landolt chart; equiv-alent to 20/222 on Snellen chart).OCT revealed marked cystoid edemawith severe retinal detachment. SRTwas 645 �m and HRD was 889 �m.The fmERG in the affected eye wasnonrecordable.
IOVS, May 2011, Vol. 52, No. 6 Focal Macular ERG in Eyes with CRVO 3519
10. Sakaue H, Katsumi O, Hirose T. Electroretinographic findings inthe fellow eyes of patients with central retinal vein occlusion. ArchOphthalmol. 1989;107:1459–1462.
11. Breton ME, Montzka DP, Brucker AJ, Quinn GE. Electroretinograminterpretation in central retinal vein occlusion. Ophthalmology.1991;98:1837–1844.
12. Matsui Y, Katsumi O, Sakaue H, Hirose T. Electroretinogram b/awave ratio improvement in central retinal vein obstruction. Br JOphthalmol. 1994;78:191–198.
13. Larsson J, Bauer B, Andreasson S. The 30-Hz flicker cone ERG formonitoring the early course of central retinal vein occlusion. ActaOphthalmol Scand. 2000;78:187–190.
14. Larsson J, Andreasson S. Photopic 30 Hz flicker ERG as a predictorfor rubeosis in central retinal vein occlusion. Br J Ophthalmol.2001;85:683–685.
15. Chen H, Wu D, Huang S, Yan H. The photopic negative responseof the flash electroretinogram in retinal vein occlusion. Doc Oph-thalmol. 2006;113:53–59.
16. Nakamura H, Hangai M, Mori S, Hirose F, Yoshimura N. Hemi-spherical focal macular photopic negative response and macularinner retinal thickness in open-angle glaucoma. Am J Ophthalmol.2011;151:494–506, e1.
17. Viswanathan S, Frishman LJ, Robson JG. The uniform field andpattern ERG in macaques with experimental glaucoma: removal ofspiking activity. Invest Ophthalmol Vis Sci. 2000;41:2797–2810.
18. Rangaswamy NV, Shirato S, Kaneko M, Digby BI, Robson JG,Frishman LJ. Effects of spectral characteristics of Ganzfeld stimulion the photopic negative response (PhNR) of the ERG. InvestOphthalmol Vis Sci. 2007;48:4818–4828.
19. Viswanathan S, Frishman LJ, Robson JG, Harwerth RS, Smith EL 3rd.The photopic negative response of the macaque electroretinogram:reduction by experimental glaucoma. Invest Ophthalmol Vis Sci.1999;40:1124–1136.
20. Terasaki H, Miyake Y, Tanikawa A, Kondo M, Ito Y, Horiguchi.Focal macular electroretinograms before and after successful mac-ular hole surgery. Am J Ophthalmol. 1998;125:204–213.
21. Brown DM, Campochiaro PA, Singh RP, et al. Ranibizumab formacular edema following central retinal vein occlusion: six-monthprimary end point results of a phase III study. Ophthalmology.2010;117:1124–1133.
22. Iturralde D, Spaide RF, Meyerle CB, et al. Intravitreal bevacizumab(Avastin) treatment of macular edema in central retinal veinocclusion: a short-term study. Retina. 2006;26:279–284.
23. Wu L, Arevalo JF, Berrocal MH, et al. Comparison of two doses ofintravitreal bevacizumab as primary treatment for macular edemasecondary to central retinal vein occlusion: results of the panAmerican collaborative retina study group at 24 months. Retina.2010;30:1002–1011.
24. Hee MR, Puliafito CA, Duker JS, et al. Topography of diabeticmacular edema with optical coherence tomography. Ophthalmol-ogy. 1998;105:360–370.
25. Miyake Y, Ichikawa K, Shiose Y, Kawase Y. Hereditary maculardystrophy without visible fundus abnormality. Am J Ophthalmol.1989;108:292–299.
26. Hirose T, Miyake Y, Hara A. Simultaneous recording of electroreti-nogram and visual evoked response: focal stimulation under directobservation. Arch Ophthalmol. 1977;95:1205–1208.
27. Miyake Y, Shiroyama N, Ota I, Horiguchi M. Local macular elec-troretinographic responses in idiopathic central serous chorioreti-nopathy. Am J Ophthalmol. 1988;106:546–550.
28. Miyake Y, Shiroyama N, Horiguchi M, Ota I. Asymmetry of focalERG in human macular region. Invest Ophthalmol Vis Sci. 1989;30:1743–1749.
29. Machida S, Gotoh Y, Toba Y, Ohtaki A, Kaneko M, Kurosaka D.Correlation between photopic negative response and retinal nervefiber layer thickness and optic disc topography in glaucomatouseyes. Invest Ophthalmol Vis Sci. 2008;49:2201–2207.
30. Kondo M, Kurimoto Y, Sakai T, et al. Recording focal macularphotopic negative response (PhNR) from monkeys. Invest Oph-thalmol Vis Sci. 2008;49:3544–3550.
31. Suzuki T, Terasaki H, Niwa T, Mori M, Kondo M, Miyake Y. Opticalcoherence tomography and focal macular electroretinogram ineyes with epiretinal membrane and macular pseudohole. Am JOphthalmol. 2003;136:62–67.
32. Murakami T, Tsujikawa A, Ohta M, et al. Photoreceptor status afterresolved macular edema in branch retinal vein occlusion treatedwith tissue plasminogen activator. Am J Ophthalmol. 2007;143:171–173.
33. Tsujikawa A, Sakamoto A, Ota M, et al. Serous retinal detachmentassociated with retinal vein occlusion. Am J Ophthalmol. 2010;149:291–301.
34. Kjeka O, Bredrup C, Krohn J. Photopic 30 Hz flicker electroreti-nography predicts ocular neovascularization in central retinal veinocclusion. Acta Ophthalmol Scand. 2007;85:640–643.
35. Kuo HK, Kuo MT, Chen YJ, et al. The flicker electroretinograminterocular amplitude ratio is a strong prognostic indicator ofneovascularization in patients with central retinal vein occlusion.Graefes Arch Clin Exp Ophthalmol. 2010;248:185–189.
3520 Ogino et al. IOVS, May 2011, Vol. 52, No. 6